Embed Size (px)
Citation preview

MAN SEInterim report as of September 30, 2014 – Q3 2014
– Orderintakeandsalesrevenuedownsignificantlyyear-on-year– CommercialVehiclesbusinessarea:Europeanmarketdownsignificantlyfollowing introductionofEuro6,furtherdeteriorationinthemarketenvironmentinBrazil,clear slumpintheRussianmarket– Improvementinoperatingprofitinthefirstninemonthsprimarilyattributableto PowerEngineering;CommercialVehiclesbusinessarearecordsconsiderabledecline inoperatingprofitduetomarket-relatedfactors– Netcashflowimpactedbyincreaseinworkingcapitalandpaymentof prior-periodtaxes– Outlookforfull-year2014adjusted:Considerabledeclineinoperatingprofitinthe CommercialVehiclesbusinessareaduetolowerunitsales,MANGroup’ssales revenuesignificantlybelowtheprior-yearlevel,slightincreaseinoperatingprofit attributabletoPowerEngineering
Q3MAN Group: Difficultquarterduetostrainedcommercialvehiclesmarket
2014 2013 Change 2014 2013 Change €million Q1-Q3 Q1-Q3 in% Q3 Q3 in%Order intake 11,147 12,195 –9 3,473 4,349 –20Sales revenue 10,214 11,341 –10 3,515 3,712 –5Operatingprofit 304 36 746 82 159 –49

Group Interim Financial Report for Q3/2014
MAN SE 2
Letter to our Shareholders
Difficult quarter due to strained commercial vehicles market Dear Shareholders, The third quarter of the current fiscal year was again overshadowed by the difficult situation in the international commercial vehicles markets. In particular, the situation in Europe and South America — important sales markets for MAN — remains tense on the back of the economic downturn in these regions. In Europe, we are also still feeling the pull-forward effects from the introduction of the Euro 6 emission standard. Political uncertainties surrounding the Ukraine crisis and in the Middle East also had an impact. This saw the MAN Group’s order intake decline by 20% year-on-year to €3.5 billion in the third quarter of 2014. MAN Truck & Bus recorded an order intake of €2.1 billion in the third quarter of 2014, substantially below the prior-year figure (€2.8 billion). It should however be noted that the previous year includes pull-forward effects in connection with the Euro 6 emission standard. MAN Latin America’s orders were also down year-on-year in the third quarter of 2014, declining by 26% to €534 million. This was primarily due to the significant deterioration in the market environment and the depreciation of the Brazilian real. In the Commercial Vehicles business area, order intake for the first nine months was 13% lower than in the previous year. By contrast, the order situation was slightly better in the Power Engineering business area, where order intake rose to €2.7 billion in the same period. MAN Diesel & Turbo’s marine business picked up again, lifting order intake by 7% to over €2.4 billion in the first three quarters. At €321 million, Renk did not match the prior-year figure.
The MAN Group’s sales revenue declined by approximately 5% year-on-year to €3.5 billion in the third quarter. The figure for the first nine months of 2014 was down 10% at €10.2 billion. The Commercial Vehicles business area generated sales revenue of approximately €2.5 billion in the period from July to September 2014. The Power Engineering business area saw sales revenue increase year-on-year and contributed €1.0 billion to the MAN Group’s sales revenue. The MAN Group’s operating profit improved significantly as against the previous year, rising by €268 million to €304 million in the first nine months of fiscal 2014. The MAN Group’s operating return on sales was 3.0% (previous year: 0.3%). However, a look at the third quarter of 2014 reveals a different picture: The Commercial Vehicles business area recorded an operating profit of €18 million, while the Power Engineering business area generated an operating profit of €83 million. This corresponds to a decline of €80 million and €20 million, respectively, as against the prior-year quarter. This is largely attributable to the lower capacity utilization at MAN Truck & Bus and the significant decline in sales volumes at MAN Latin America. In the past, we were able to rely on our business areas to compensate for difficult situations — and this is also the case today. For example, the Power Engineering business area accounted for the largest share of the MAN Group’s operating profit in the period from January to September 2014. However, MAN Diesel & Turbo’s operating profit also deteriorated year-on-year on the third quarter of 2014 and amounted to €59 million. By contrast, Renk reported a very
good quarter, with operating profit increasing to €24 million. Overall, our figures are certainly less than satisfactory. This is why we are doing everything we can to get back on track as soon as possible. For example, we have successfully introduced cost-cutting measures over the past few months such as changes to the production structure in the bus business, the introduction of short-time working in Steyr and Salzgitter, and strict cost discipline. Some of these cuts are painful. But they are necessary. The outstanding response to the products and services showcased at the SMM and the IAA — both large trade fairs — in September shows that we can look to the future with confidence. We are expecting a significant year-on-year decline in sales revenue and moderately higher operating profit for fiscal year 2014. The MAN Group’s operating return on sales will slightly exceed the 2013 figure.
Dr.-Ing.Georg Pachta-Reyhofen Chief Executive Officer of MAN SE

Group Interim Financial Report for Q3/2014
MAN SE 3
Contents
At a Glance 4
Interim Management Report as of September 30, 2014 5
Condensed Interim Consolidated Financial Statements as of September 30, 2014 26
Notes to the Condensed Interim Consolidated Financial Statements 35
Income Statement Disclosures 40
Balance Sheet Disclosures 45
Overview by Quarter 60
MAN SE Financial Diary 63
Introduction
The Group interim financial report of MAN SE meets the requirements for a quarterly financial report in
accordance with the applicable provisions of the Wertpapierhandelsgesetz (WpHG — German
Securities Trading Act) and, in accordance with section 37x(3) of the WpHG, comprises the condensed
interim consolidated financial statements and the interim management report of the Group. The interim
consolidated financial statements have been prepared in compliance with IAS 34 in accordance with
the International Financial Reporting Standards (IFRSs) and related Interpretations issued by the
International Accounting Standards Board (IASB), that were effective at the end of the reporting period
and endorsed by the European Union (EU). The Group interim financial report should be read in
conjunction with the annual report for fiscal year 2013 and the additional information on the Company
contained in it.
Disclosures on changes to the structure of financial reporting and on changes to the definition of control
measures starting in fiscal 2014 due to the integration into the Volkswagen Group are included in the
interim management report and the notes to the condensed interim consolidated financial statements.
All figures are rounded, so minor discrepancies may arise from addition of these amounts.

Group Interim Financial Report for Q3/2014
MAN SE 4
At a Glance
2014 2013 Change 2014 2013 Change
€ million Q1–Q3 Q1–Q3 in % Q3 Q3 in %
Order intake 11,147 12,195 –9 3,473 4,349 –20
Germany 2,411 2,745 –12 801 1,069 –25
Other countries 8,736 9,450 –8 2,672 3,280 –19
Order backlog1) 6,394 5,776 11 6,394 5,776 11
Headcount1) 55,983 56,102 0 55,983 56,102 0
Germany 32,488 32,430 0 32,488 32,430 0
Other countries 23,495 23,672 –1 23,495 23,672 –1
Sales revenue 10,214 11,341 –10 3,515 3,712 –5
Germany 2,079 2,288 –9 712 751 –5
Other countries 8,135 9,053 –10 2,803 2,961 –5
€ million € million
Operating profit 304 36 268 82 159 –78
Operating return on sales (%) 3.0 0.3 2.7 2.3 4.3 –2.0
Profit/loss before tax from continuing operations 203 –53 256 45 77 –32
as a % of sales revenue 2.0 –0.5 2.5 1.3 2.1 –0.8
Profit/loss after tax 118 –596 714 26 –218 244
Profit/loss attributable to shareholders of MAN
SE 108 –604 712 22 –221 243
ROS (%)2) 3.4 1.6 1.8 2.7 5.2 –2.5
ROCE (%)2) 6.3 3.4 2.9 4.9 11.0 –6.1
Gross cash flow 101 557 –456 –74 358 –431
Net cash provided by/used in operating activities –1,102 –281 –821 –194 254 –447
Cash flows from investing activities attributable
to operating activities 110 –303 413 –115 –100 –15
of which: from acquisitions and divestments 417 – 417 – – –
of which: investments in property, plant, and
equipment –182 –218 36 –69 –72 3
as a % of sales revenue 1.8 1.9 – 2.0 1.9 –
capitalized development costs –135 –98 –37 –50 –31 –19
as a % of sales revenue 1.3 0.9 – 1.4 0.8 –
Net cash flow –992 –584 –408 –308 154 –463
Depreciation and amortization of, and
impairment losses on noncurrent assets 654 666 –12 215 246 –32
R&D expenditures 429 406 23 151 135 16
Cash and cash equivalents 1)
624 1,137 –513 624 1,137 –513
Net financial debt 1) –1,517 –1,315 –202 –1,517 –1,315 –202
Total equity 1) 5,801 5,227 574 5,801 5,227 574
Any differences in this Group interim financial report are due to rounding. 1) As of September 30, 2014, vs. December 31, 2013. 2) The actual ROS and ROCE values according to the previous logic will also be reported on a voluntary basis in fiscal 2014.

Group Interim Financial Report for Q3/2014 MAN SE 5
Interim Management Report as of September 30, 2014
Economic environment
The slight revival of the global economy has continued in the year to date, although it varied from region
to region. The economic situation in the industrialized nations improved despite the continued presence
of structural obstacles. At the same time, economic growth in a number of emerging economies slowed
due to currency volatility and structural deficits.
The economic recovery in Western Europe continued in the reporting period but slowed over the course
of the year. Most northern European countries saw moderate growth, while the recession came to an
end in most of the crisis-hit southern European countries. The German economy lost momentum but
continued to benefit from the positive consumer sentiment and the stable situation on the labor market.
Central Europe also recorded positive economic growth in the first nine months of 2014. Sentiment in
Eastern Europe deteriorated due to the conflict between Russia and Ukraine.
Despite the difficult weather-induced conditions at the beginning of the year, the U.S. economy
continued its recovery in the reporting period. Consumer sentiment boosted the economy, while the
unemployment rate declined further. Growth in Brazil — a key market for MAN — was down significantly
on the relatively low prior-year figure in the first nine months of 2014. Recessionary trends and very
high inflation continued to impact the situation in Argentina.
The Chinese economy again recorded robust growth, though the pace slowed slightly. India’s economy
was weighed down by structural problems and an ongoing reluctance to invest, although there have
been signs of a moderate upward trend since the new government took office.

Group Interim Financial Report for Q3/2014 MAN SE 6
Changes to financial reporting
The integration of the MAN Group into the Volkswagen Group also results in structural adjustments to
financial reporting and changes to the definition of control measures.
Changes to the structure of the income statement
The MAN Group has prepared its income statement in line with the structure used by Volkswagen since
the beginning of fiscal 2014. A comparison of the format of the income statement used previously to the
new format for the period from January 1 to September 30, 2013, and for the third quarter of 2013, as
well as the most important differences are provided in the ―Notes to the Condensed Interim
Consolidated Financial Statements.‖
Changes to the definition of control measures
MAN calculated its financial control measures on the basis of the definitions and structures used in the
Volkswagen Group’s financial reporting for the first time starting in fiscal 2014. The main differences are
explained in the following.
The operating profit used in the MAN Group until December 31, 2013, essentially corresponded to
earnings before interest and taxes (EBIT). When calculating operating profit, adjustments were made
for earnings effects from purchase price allocations and, in individual cases, effects from nonrecurring
items. According to the Volkswagen Group’s definition, operating profit is calculated as profit before tax
and before the financial result. As a result, net investment income in particular is no longer part of
operating profit. This is now presented in the share of profits and losses of equity-method investments
or in the other financial result. However, earnings effects relating to tangible and intangible assets
resulting from the acquisition of an individual segment are eliminated from the operating profit of that
segment.
The operating return on sales for the MAN Group, the business areas, and the segments is expressed
as operating profit as a percentage of sales revenue.
The actual ROS and ROCE values according to the logic used until December 31, 2013, will continue to
be reported on a voluntary basis in 2014.
Restatement of comparative periods
The income statement and the control measures published in this Group interim financial report are no
longer comparable with the figures reported in prior periods due to the changes to the structure of
financial reporting and the definition of control measures. The prior-period figures presented in this
report were therefore adjusted accordingly.

Group Interim Financial Report for Q3/2014 MAN SE 7
Divestments
Volkswagen Financial Services AG, Braunschweig, (VWFS) acquired the shares of MAN Finance
International GmbH, Munich, (MAN Finance) effective January 1, 2014. The bundling of the
infrastructure, resources, and expertise of VWFS and MAN Finance facilitates the development of
integrated transportation solutions for MAN Truck & Bus’s customers, including in other markets.
MAN Finance will remain MAN Truck & Bus’s exclusive sales support organization.
MAN Finance was presented as ―Financial Services‖ in MAN’s reporting until December 31, 2013, and
is included in all related prior-year information.
For further information, see the ―Notes to the Condensed Interim Consolidated Financial Statements.‖
The MAN Group’s order situation
The MAN Group’s order intake in the first three quarters was €11.1 billion, down significantly on the
prior-year level (€12.2 billion).
Order intake by business area
€ million
2014
Q1–Q3
2013
Q1–Q3
Change
in %
2014
Q3
2013
Q3
Change
in %
Commercial Vehicles1) 8,420 9,677 –13 2,636 3,516 –25
Power Engineering1) 2,749 2,701 2 843 863 –2
Others –22 –184 – –6 –31 –
MAN Group 11,147 12,195 –9 3,473 4,349 –20
1) Consolidated presentation of business areas starting in 2014.
Order intake in the Commercial Vehicles business area declined by 13% year-on-year to €8.4 billion
in the first nine months. Measured in terms of units, order intake was 16% lower at 89,627 vehicles.
MAN Truck & Bus generated an order intake of €6.8 billion in the first nine months, down 8% on the
previous year. The number of vehicles ordered decreased by 12% to 55,050 vehicles. Order intake in
the third quarter was substantially below the prior-year level at €2.1 billion (previous year: €2.8
billion). The decline was mainly attributable to the high order intake in Europe in the third quarter of
2013 due to truck purchases pulled forward ahead of the introduction of the Euro 6 emission
standard. Order intake also declined in Russia on the back of the effects of the crisis in Ukraine this
year.
MAN Latin America recorded an order intake of €1.7 billion in the first nine months, well below the
prior-year figure (€2.3 billion). This was largely due to lower unit sales, which declined by 21% to
36,168 vehicles as a result of the further deterioration of the business environment in Latin America.
The depreciation of the Brazilian real also had a negative effect.

Group Interim Financial Report for Q3/2014 MAN SE 8
The Power Engineering business area generated an order intake of €2.7 billion in the reporting
period, up slightly on the previous year. MAN Diesel & Turbo’s orders rose by 7% to over €2.4 billion.
The increase is mainly attributable to the Engines & Marine Systems strategic business unit, which
more than offset the slight declines in the Turbomachinery and Power Plants strategic business units.
At €321 million, Renk’s order intake in the first nine months was well below the prior-year figure
(€421 million).
The proportion of international orders in the MAN Group in the first nine months was on a level with
the previous year, at 78%.
The MAN Group’s order backlog as of September 30, 2014, was €6.4 billion, up €0.6 billion compared
with December 31, 2013. The Commercial Vehicles business area recorded an increase of
€0.5 billion and the order backlog in the Power Engineering business area rose by €0.1 billion.
Results of operations, financial position, and net assets
The MAN Group’s results of operations
The MAN Group’s sales revenue decreased by 10% year-on-year to €10.2 billion in the first nine
months (previous year: €11.3 billion).
Sales revenue by business area
€ million
2014
Q1–Q3
2013
Q1–Q3
Change
in %
2014
Q3
2013
Q3
Change
in %
Commercial Vehicles1) 7,586 8,755 –13 2,514 2,833 –11
Power Engineering1) 2,642 2,760 –4 1,008 919 10
Others –13 –174 – –7 –41 –
MAN Group 10,214 11,341 –10 3,515 3,712 –5
1) Consolidated presentation of the business areas starting in 2014.
The Commercial Vehicles business area reported sales revenue of €7.6 billion in the first three
quarters, 13% less than in the previous year (€8.8 billion). MAN Truck & Bus generated sales revenue
of €5.9 billion in the first three quarters, down €529 million on the prior-year figure. Unit sales
decreased by 4% to 50,987 vehicles. MAN Latin America saw sales revenue decline by 25% to
€1.7 billion (€2.3 billion) and unit sales by 21% to 36,168 vehicles.
Sales revenue in the Power Engineering business area declined by 4% year-on-year to €2.6 billion in
the first nine months. At €2.3 billion, MAN Diesel & Turbo’s sales revenue was down 4% on the prior-
year figure in the first nine months. Renk reported sales revenue of €347 million, on a level with the
previous year (€350 million).

Group Interim Financial Report for Q3/2014 MAN SE 9
The MAN Group’s domestic sales revenue declined by €0.2 billion year-on-year to €2.1 billion, while
international sales revenue fell by €0.9 billion. The proportion of international orders was on a level
with the previous year at 80%.
Operating profit/loss by business area
€ million
2014
Q1–Q3
2013
Q1–Q3
Change
€ million
2014
Q3
2013
Q3
Change
€ million
Commercial Vehicles1) 168 245 –77 18 98 –80
Power Engineering1) 197 –91 288 83 104 –20
Others –61 –119 57 –20 –42 23
MAN Group 304 36 268 82 159 –78
1) Consolidated presentation of business areas starting in 2014.
The MAN Group recorded an operating profit of €304 million in the first three quarters of fiscal 2014 —
a significant improvement compared with the no more than modest operating profit of €36 million in the
prior-year period.
This improvement is primarily attributable to the Power Engineering business area, which recorded an
operating profit of €197 million (previous year: operating loss of €91 million). In the Commercial
Vehicles business area, operating profit was significantly below the prior-year figure at €168 million
(previous year: €245 million) due to the decline in sales revenue. The operating loss attributable to
Others narrowed by €57 million year-on-year. The MAN Group’s operating profit for the first three
quarters includes income of approximately €46 million from the settlement relating to D&O insurance
and former Executive Board members as authorized by the 2014 Annual General Meeting.
The MAN Group’s operating return on sales in the first nine months was 3.0% (previous year: 0.3%).
The operating return on sales for the Commercial Vehicles business area declined to 2.2% (previous
year: 2.8%). In the Power Engineering business area, the operating return on sales improved to 7.5%
(previous year: –3.3%).
MAN Truck & Bus recorded an operating profit of €88 million in the first nine months, on a level with the
previous year (€92 million). This was primarily attributable to lower sales revenue and the deterioration
in capacity utilization, particularly in the third quarter and, at the same time, improved margins as a
result of reduced material costs. MAN Truck & Bus’s operating return on sales was 1.5% (previous
year: 1.4%). MAN Latin America generated an operating profit of €76 million in the reporting period
(previous year: €153 million). This decrease is mainly due to lower sales revenue, greater competition,
and the depreciation of the Brazilian real against the euro. The operating return on sales amounted to
4.4% (6.7%).
In the Power Engineering business area, MAN Diesel & Turbo again posted a significantly positive
operating profit of €147 million, after an operating loss of €138 million in the previous year. The
negative prior-year figure was primarily attributable to considerable additional provisions for a power

Group Interim Financial Report for Q3/2014 MAN SE 10
plant project that had not yet been completed. MAN Diesel & Turbo’s operating return on sales was
6.4% (previous year: –5.7%). Renk recorded an operating profit of €50 million in the first nine months,
on a level with the previous year (€47 million). The operating return on sales amounted to 14.3%
(13.4%).
The improvement in the operating loss attributable to Others is primarily due to lower purchase price
allocation effects and reduced nonpersonnel expenses and project costs.
The financial result deteriorated by €12 million year-on-year to €–101 million (previous year: €–89
million). Unlike in the prior-year period, no dividend was received from Scania in fiscal 2014. This was
partially offset by the impairment loss on the carrying amount of the Rheinmetall MAN Military Vehicle
GmbH, Munich, (RMMV) joint venture and proportionate restructuring expenses recognized in fiscal
2013.
All in all, the MAN Group’s profit before tax amounted to €203 million in the first nine months (previous
year: €–53 million). The Group recorded profit after tax of €118 million in the reporting period,
compared with a net loss of €596 million in the previous year. The prior-year figure was negatively
impacted by nonrecurring earnings effects of €–304 million from discontinued operations. The tax rate
was 42.0% (previous year: –450.4%). The comparative prior-year period comprised prior-period taxes
and valuation allowances on deferred tax assets in respect of tax loss carryforwards.
Earnings per share from continuing operations were €0.74 as against €–2.04 in the previous year.
The MAN Group’s financial position
Net cash flow from the MAN Group’s operating and investing activities attributable to operating
activities amounted to €–992 million after the first nine months (previous year: €–584 million).
Net cash flow by business area
€ million
2014
Q1–Q3
2013
Q1–Q3
Change
€ million
2014
Q3
2013
Q3
Change
€ million
Commercial Vehicles1) –368 –280 –87 101 126 –25
Power Engineering1) –90 –208 118 27 31 –4
Others –534 –96 –438 –435 –3 –433
MAN Group –992 –584 –408 –308 154 –463
1) Consolidated presentation of business areas starting in 2014.
This included the following nonrecurring items: a net inflow of €415 million from the sale of MAN
Finance in the first quarter, as well as the prepayment of the expected tax liability for fiscal 2013
(€130 million) in the second quarter. MAN also paid prior-period taxes in the amount of €691 million
including interest, of which €370 million related to discontinued operations, in the first nine months.
Excluding payments for prior-period taxes, net cash flow in the third quarter was positive, as in the
previous year, and amounted to €435 million.

Group Interim Financial Report for Q3/2014 MAN SE 11
At €101 million, the MAN Group’s gross cash flow in the first nine months was lower than in the
previous year (€557 million), despite a considerable improvement in the profit before tax. This was
primarily due to tax payments.
The increase in the MAN Group’s working capital reduced cash flows from operating activities by
€1,203 million (€838 million). This is primarily attributable to the €454 million increase in inventories in
the current year (previous year: €466 million), the €218 million decline in provisions (previous year:
increase of €140 million), and the €297 million decrease in trade payables (previous year:
€117 million). The increase in inventories and the decrease in trade payables is mainly due to higher
stockpiled inventories and lower procurement volumes at MAN Truck & Bus. The decline in provisions
is mainly attributable to tax interest payments by MAN SE. Within working capital, the €398 million
increase in assets leased out (previous year: €253 million) was largely offset by the depreciation of
assets leased out and by offsetting effects in cash flows from operating activities within other liabilities.
Net cash provided by investing activities attributable to operating activities amounted to €110 million
(previous year: net cash used in investing activities attributable to operating activities of €303 million)
and was dominated by the net cash inflow of €415 million from the sale of MAN Finance. Excluding this
effect, investments were on a level with the previous year.
In the Commercial Vehicles business area, net cash flow declined to €–368 million in the first three
quarters of 2014 (previous year: €–280 million). The Power Engineering business area recorded a net
cash flow of €–90 million in the reporting period (previous year: €–208 million). Net cash flow from
Others was €–534 million (previous year: €–96 million) and includes the cash inflow from the sale of
MAN Finance and the negative effects from tax payments.
Cash outflows from financing activities in the reporting period amounted to €114 million (previous year:
€358 million). This mainly relates to the €724 million loss absorption by Truck & Bus GmbH for 2013
and the MAN SE dividend of €21 million. In addition, bonds in the amount of €520 million were repaid
and other financial liabilities were reduced by €294 million.
The MAN Group’s net financial debt was €1,517 million on September 30, 2014, a deterioration of
€202 million as against December 31, 2013.
As announced, the cooperation with rating agency Moody’s was terminated at the end of March 2014.

Group Interim Financial Report for Q3/2014 MAN SE 12
Structure of the MAN Group’s balance sheet
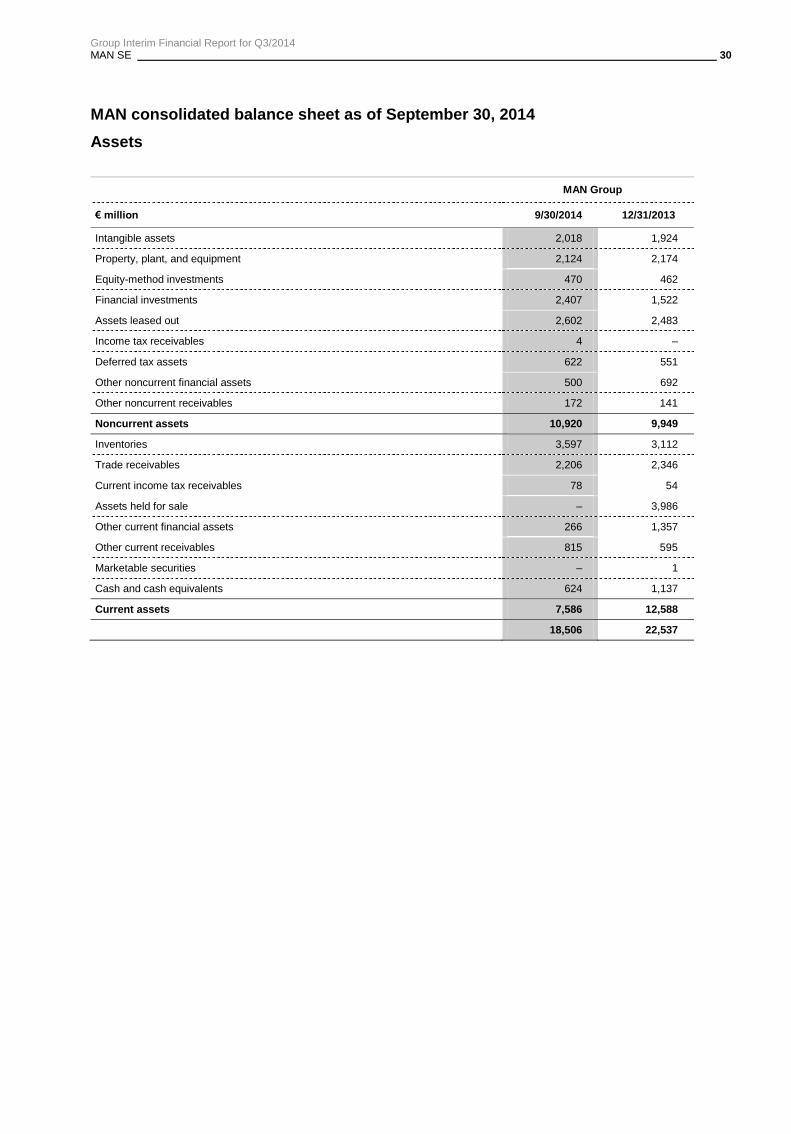
The MAN Group’s total assets amounted to €18,506 million at the end of the reporting period, 17.9%
lower than on December 31, 2013 (€22,537 million).
Current assets declined to €7,586 million in the reporting period (December 31, 2013: €12,588 million).
At the same time, current liabilities and provisions decreased by 35.6% to €7,443 million
(December 31, 2013: €11,561 million). Both effects related mainly to the sale of MAN Finance to VWFS
as of January 1, 2014. MAN Finance was presented as held for sale as of December 31, 2013. For
further information, see ―Divestments‖ and the ―Notes to the Condensed Interim Consolidated Financial
Statements.‖ Noncurrent and current financial liabilities declined by €823 million in the first nine months
of fiscal 2014. This change is primarily attributable to the repayment of bonds and the reduction of
other financial liabilities.
The higher carrying amount of the investment in Scania AB, Södertälje/Sweden, (Scania) as of
September 30, 2014, as against December 31, 2013, led to an increase in noncurrent assets of
€880 million.
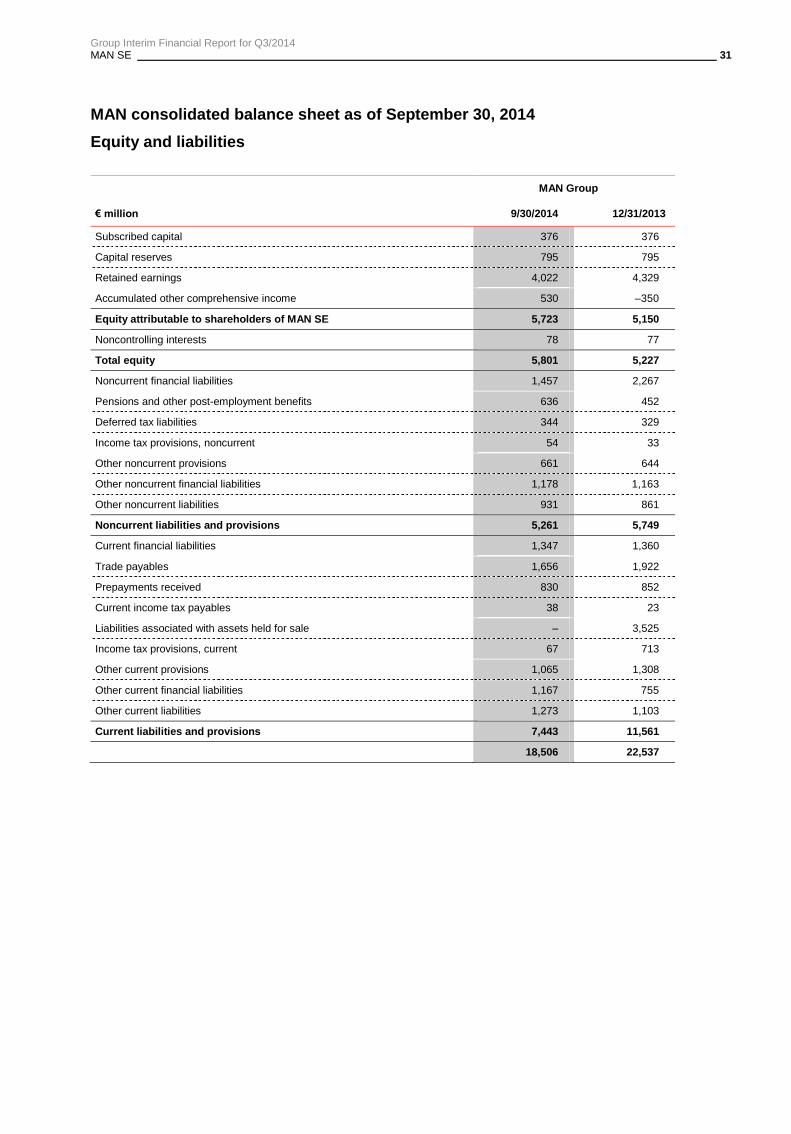
The MAN Group’s equity increased to €5,801 million as of September 30, 2014, compared with
December 31, 2013 (€5,227 million). This change is primarily attributable to the measurement of the
investment in Scania. The preparation of the condensed interim consolidated financial statements after
appropriation of net profit led to a decrease in reported equity as of September 30, 2014. The equity
ratio was 31.4% (previous year 23.2%).
MAN Group
€ million 9/30/2014 6/30/2014 3/31/2014 12/31/2013
Noncurrent assets 10,920 10,866 10,832 9,949
Current assets 7,586 7,708 8,125 12,588
Total assets 18,506 18,574 18,957 22,537
Total equity 5,801 5,844 5,711 5,227
Noncurrent liabilities and provisions 5,261 5,768 5,858 5,749
Current liabilities and provisions 7,443 6,961 7,388 11,561

Group Interim Financial Report for Q3/2014 MAN SE 13
Headcount
The definition of headcount was also adapted in line with Volkswagen’s reporting. It comprises active
employees, employees in the passive phase of partial retirement, and vocational trainees. It does not
include subcontracted employees. The comparable prior-year figures (as of December 31, 2013) were
adjusted accordingly.
The MAN Group had 52,128 (previous year: 52,182) active employees on September 30, 2014. A
further 597 (630) employees were in the passive phase of partial retirement, and 3,258 (3,290) young
people were in vocational traineeships. The MAN Group employed a total of 55,983 (previous year:
56,102) people worldwide at the end of the reporting period, on a level with the previous year. The
proportion of employees in Germany was unchanged as against December 31, 2013, at 58% or 32,488
employees (previous year: 32,430 employees).
The MAN Group also had 1,214 subcontracted employees at the end of the third quarter, compared
with 1,327 as of December 31, 2013.
Outlook for the MAN Group
The MAN Group’s Management anticipates slightly stronger global economic growth in 2014 compared
with the previous year. There are still significant uncertainties surrounding economic growth prospects
in the future. Among other things, these are due to the debt situation in many countries, which remains
strained, and geopolitical tensions and conflicts such as the crisis in Ukraine and the escalating
situation in the Middle East. Assuming that the moderate growth trend is not negatively impacted by
unforeseen events and the geopolitical situation does not escalate, MAN SE’s Executive Board
currently expects the following:
In the Commercial Vehicles business area, MAN expects unit sales for 2014 to be well below the prior-
year level on the back of declining markets in South America, Europe, and Russia. This means that
sales revenue will be down considerably year-on-year. Operating profit and the operating return on
sales will be well below the previous year, mainly as a result of lower volumes.
Order intake and sales revenue in the Power Engineering business area are expected to be close to
the prior-year figure in fiscal 2014. Operating profit and the operating return on sales will improve
significantly but will continue to be impacted by the fierce competition, the slow license business in the
marine sector, and customer reticence in the after-sales business. The Power Engineering business
area is therefore expected to record a higher single-digit operating return on sales in 2014.
As a result, the MAN Group will see a significant year-on-year decline in sales revenue and slightly
higher operating profit in 2014. The operating return on sales will slightly exceed the 2013 figure.

Group Interim Financial Report for Q3/2014 MAN SE 14
Report on Risks and Opportunities
The Report on Risks and Opportunities should be read in conjunction with our disclosures in the 2013
consolidated financial statements. The MAN Group’s risk position has not changed significantly as
against the assessment contained in that report.
With respect to current developments in connection with the economic situation and their effects on
MAN’s order situation in particular, as well as on its sales revenue and earnings, please see the
sections entitled ―Economic environment‖ and ―Outlook for the MAN Group,‖ along with the information
provided on the individual segments in ―The Divisions in Detail.‖
Litigation/legal proceedings
For information regarding ―Litigation/legal proceedings,‖ please see the ―Notes to the Condensed
Interim Consolidated Financial Statements.‖
MAN shares
Following the upward trend seen in the equity markets in the first half of 2014, the stock markets were
frequently unnerved by geopolitical crises in the third quarter of 2014. Accordingly, the economic
outlook for the euro zone darkened — the markets were impacted by the depreciation of the euro
against the dollar, deflationary trends, weaker exports and a drastic drop in order intake in Germany in
August. The markets were temporarily buoyed in the year to date by hopes that the Ukraine crisis would
ease and by the European Central Bank’s decision to cut its key interest rates to a record low of 0.05%
and to buy government bonds. The ongoing weak phase in the euro zone and a slight economic
downturn in China contrasted with the economic recovery in the U.S.A., which continued to pick up
speed in the reporting period.
The German benchmark index, the Dax, lost around 1% in the first nine months of 2014, closing trading
at 9,474 points on September 30, 2014. The MDax declined by 3.5% in the same period, closing at
15,995 points. MAN’s shares remained virtually unchanged in the period from January to September
2014 after closing at €89.25 on December 31, 2013. They weakened by approximately 1% in the third
quarter to close at €89.10 on September 30, 2014, compared with a closing price of €90.25 on June 30,
2014.
Group Interim Financial Report for Q3/2014 MAN SE 15
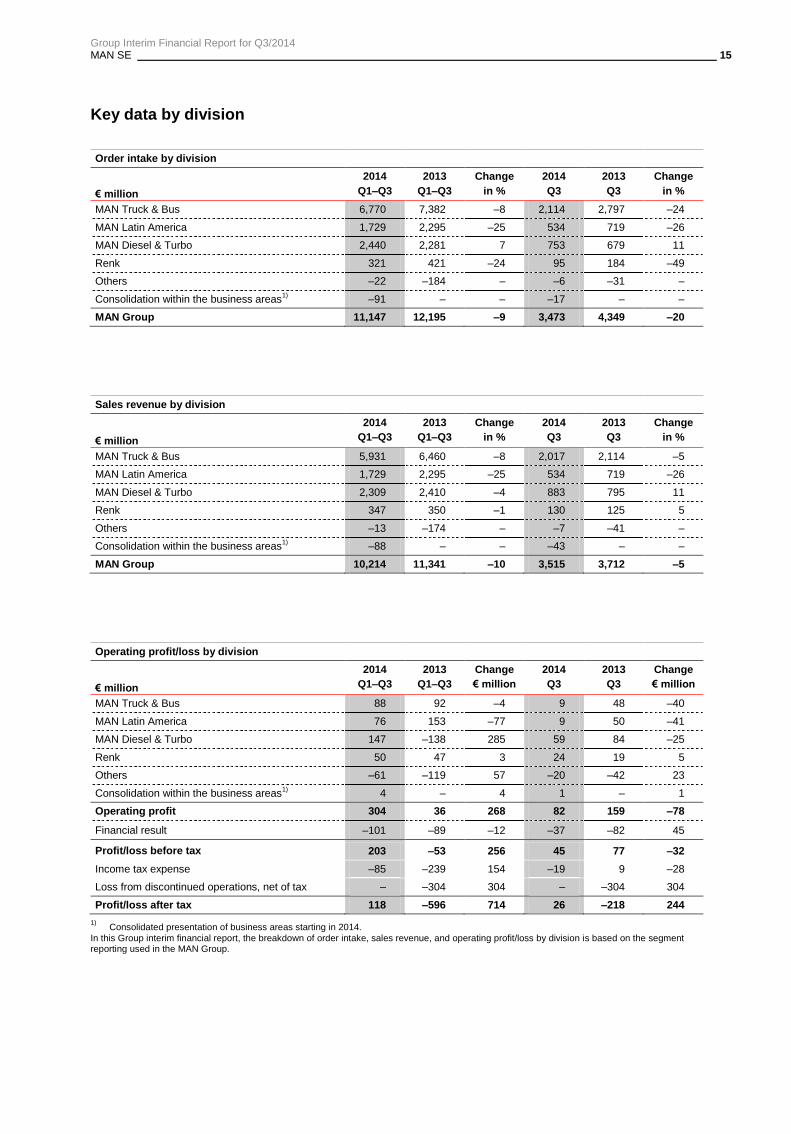
Key data by division
Order intake by division
€ million
2014
Q1–Q3
2013
Q1–Q3
Change
in %
2014
Q3
2013
Q3
Change
in %
MAN Truck & Bus 6,770 7,382 –8 2,114 2,797 –24
MAN Latin America 1,729 2,295 –25 534 719 –26
MAN Diesel & Turbo 2,440 2,281 7 753 679 11
Renk 321 421 –24 95 184 –49
Others –22 –184 – –6 –31 –
Consolidation within the business areas1) –91 – – –17 – –
MAN Group 11,147 12,195 –9 3,473 4,349 –20
Sales revenue by division
€ million
2014
Q1–Q3
2013
Q1–Q3
Change
in %
2014
Q3
2013
Q3
Change
in %
MAN Truck & Bus 5,931 6,460 –8 2,017 2,114 –5
MAN Latin America 1,729 2,295 –25 534 719 –26
MAN Diesel & Turbo 2,309 2,410 –4 883 795 11
Renk 347 350 –1 130 125 5
Others –13 –174 – –7 –41 –
Consolidation within the business areas1) –88 – – –43 – –
MAN Group 10,214 11,341 –10 3,515 3,712 –5
Operating profit/loss by division
€ million
2014
Q1–Q3
2013
Q1–Q3
Change
€ million
2014
Q3
2013
Q3
Change
€ million
MAN Truck & Bus 88 92 –4 9 48 –40
MAN Latin America 76 153 –77 9 50 –41
MAN Diesel & Turbo 147 –138 285 59 84 –25
Renk 50 47 3 24 19 5
Others –61 –119 57 –20 –42 23
Consolidation within the business areas1) 4 – 4 1 – 1
Operating profit 304 36 268 82 159 –78
Financial result –101 –89 –12 –37 –82 45
Profit/loss before tax 203 –53 256 45 77 –32
Income tax expense –85 –239 154 –19 9 –28
Loss from discontinued operations, net of tax – –304 304 – –304 304
Profit/loss after tax 118 –596 714 26 –218 244
1) Consolidated presentation of business areas starting in 2014.
In this Group interim financial report, the breakdown of order intake, sales revenue, and operating profit/loss by division is based on the segment reporting used in the MAN Group.

Group Interim Financial Report for Q3/2014 MAN SE 16
The Divisions in Detail MAN Truck & Bus
2014 2013 Change 2014 2013 Change
€ million Q1–Q3 Q1–Q3 in % Q3 Q3 in %
Order intake 6,770 7,382 –8 2,114 2,797 –24
of which: Trucks 5,679 6,090 –7 1,741 2,361 –26
of which: Buses 1,091 1,025 6 373 350 7
of which: Financial Services – 310 – – 105 –
of which: consolidation – –43 – – –19 –
Order intake (units)1) 55,050 62,511 –12 16,196 25,584 –37
of which: Trucks 50,947 58,491 –13 14,788 24,271 –39
of which: Buses 4,103 4,020 2 1,408 1,313 7
Sales revenue 5,931 6,460 –8 2,017 2,114 –5
of which: Trucks 5,016 5,246 –4 1,715 1,734 –1
of which: Buses 914 947 –3 302 291 4
of which: Financial Services – 310 – – 106 –
of which: consolidation – –43 – – –16 –
Vehicle sales (units)1) 50,987 53,232 –4 17,894 17,983 –
of which: Trucks 47,600 49,646 –4 16,766 16,874 –1
of which: Buses 3,387 3,586 –6 1,128 1,109 2
Production (units) 53,390 55,193 –3 17,980 19,671 –9
of which: Trucks 49,753 51,224 –3 16,713 18,431 –9
of which: Buses 3,637 3,969 –8 1,267 1,240 2
Headcount2) 36,560 36,887 –1 36,560 36,887 –1
€ million € million
Operating profit/loss3)
88 92 –4 9 48 –40
of which: Trucks 131 135 –4 18 58 –40
of which: Buses –42 –46 4 –9 –10 1
of which: Financial Services – 3 –3 – 1 –1
Operating return on sales (%) 1.5 1.4 – 0.4 2.3 –
1) No elimination of unit sales figures between Financial Services and Trucks/Buses.
2) Headcount as of September 30, 2014, vs. December 31, 2013.
3) 2013: Including consolidation effects between Financial Services and Trucks/Buses.
The Financial Services business is included in all related prior-year information.

Group Interim Financial Report for Q3/2014 MAN SE 17
In the first three quarters of the current fiscal year, the European truck market was down slightly on the
prior-year level. In the first quarter of 2014, the truck market was buoyed by a more positive economic
environment and additional registrations of Euro 5 vehicles. Some of these registrations related to
vehicles that were already produced or sold in the fourth quarter of 2013 due to the pull-forward effects
from the introduction of the Euro 6 emission standard. These two effects tailed off from the second
quarter of 2014, leading the figure to already fall short of the prior-period level in this quarter.
MAN Truck & Bus is expecting a sharp market downturn in full-year 2014, due to the fact that a
significant portion of demand was already pulled forward to 2013 in advance of the Euro 6 emission
rules in force starting in 2014, and given expectations of continued weak macroeconomic growth.
In the first three quarters, the European bus market was up slightly on the prior-year level. The
assumption for full-year 2014 is a modest downward trend, since some demand for 2014 had already
been pulled forward to the fourth quarter of 2013 in the bus market, too, due to the implementation of
the Euro 6 emission rules.
Order intake at MAN Truck & Bus in the first three quarters declined by 8% year-on-year to
€6,770 million. Measured in terms of units, order intake was down 12% on the previous year, at 55,050
vehicles (previous year: 62,511).
The Trucks business recorded an order intake of €5,679 million (previous year: €6,090 million). Order
intake measured in unit terms decreased by 13% year-on-year to 50,947 vehicles (previous year:
58,491), primarily due to the 39% year-on-year decrease in order intake in the third quarter. The
decline was mainly attributable to the high order intake in Europe in the third quarter of 2013, especially
in Germany, as a result of truck purchases pulled forward ahead of the introduction of the Euro 6
emission standard on January 1, 2014. Order intake also decreased in Russia due to the effects of the
crisis in Ukraine.
Order intake in the Buses business in the first three quarters was up 6% on the previous year, mainly
due to prices and the mix. Measured in unit terms, the order intake figure of 4,103 was slightly above
the 4,020 recorded in the previous year. The declining order intake observed in South Africa, France,
and Australia, among other countries, was offset by factors including a large chassis order from
Singapore, a major order for city buses from Sweden in the first quarter of 2014, and a large order for
city buses from Germany in the third quarter of 2014.
MAN Truck & Bus generated sales revenue of €5,931 million, an 8% decrease year-on-year
from €6,460 million. At 50,987 vehicles, unit sales were also down by 4% on the prior-year figure of
53,232.

Group Interim Financial Report for Q3/2014 MAN SE 18
The Trucks business recorded a decline in sales revenue to €5,016 million (previous year:
€5,246 million). At 47,600 trucks, unit sales decreased by 4% on the prior-year figure (49,646) in a
fiercely competitive market. Unit sales declined in Russia, Austria, and Saudi Arabia in particular. By
contrast, countries such as Spain, the United Arab Emirates, and South Korea saw increases in unit
sales. Overall, MAN Truck & Bus’s share of the European market for trucks over 6 t was 16.2% in the
first three quarters (previous year: 16.3%).
The Buses business generated sales revenue of €914 million, down on the prior-year figure of €947
million. It sold 3,387 buses (previous year: 3,586), a year-on-year decrease of 6%. The main drivers for
this were the city bus business in Turkey and Sweden, as well as the chassis business in France and
Australia. In the European market for buses over 8 t, MAN Truck & Bus had a market volume of 10.5%
(previous year: 12.3%) in the first three quarters.
While production volumes in the Trucks business remained similar to the prior-year level in the first half
of 2014, these were scaled back by 1,718 vehicles (9%) year-on-year in the third quarter due to weaker
demand. The drop in demand also led to a 332-vehicle (8%) year-on-year reduction in production
volumes in the Buses business in the first nine months.
The headcount as of September 30, 2014, decreased by 327 people to 36,560, compared with 36,887
as of December 31, 2013. This was mainly attributable to the sale of the Financial Services business to
VWFS as of January 1, 2014. On the reporting date of September 30, 2014, there were 33,647 active
employees. 450 employees were in the passive phase of their partial retirement. In addition, 2,463
young people were in vocational traineeships.
Nine months into 2014, operating profit was lower than the prior-year figure, at €88 million (previous
year: €92 million). This corresponds to an operating return on sales of 1.5% (previous year: 1.4%).
Operating profit in the Trucks business declined to €131 million (previous year: €135 million). This was
primarily attributable to lower sales revenue and the deterioration in capacity utilization, in particular in
the third quarter, and at the same time, improved margins as a result of reduced material costs. The
operating loss in the Buses business narrowed to €42 million (previous year: €46 million) despite the
decline in volumes and restructuring measures for the Plauen bus plant. In the prior-year period, the
loss included valuation allowances on receivables.
The Management of MAN Truck & Bus expects unit sales and sales revenue for 2014 to be
significantly less than the prior-year level. 2014 operating profit, and thus the operating return on sales,
are expected to be well below the prior-year level. MAN Truck & Bus is working systematically to
improve its earnings quality in the long term in a highly competitive market environment.
Comprehensive measures have already been taken to cut costs, increase efficiency, and introduce
more flexibility into production.

Group Interim Financial Report for Q3/2014 MAN SE 19
MAN Latin America
2014 2013 Change 2014 2013 Change
€ million Q1–Q3 Q1–Q3 in % Q3 Q3 in %
Order intake 1,729 2,295 –25 534 719 –26
Order intake (units) 36,168 45,789 –21 10,971 15,488 –29
Sales revenue 1,729 2,295 –25 534 719 –26
Vehicle sales (units) 36,168 45,789 –21 10,971 15,488 –29
Production (units) 35,924 49,490 –27 11,387 16,991 –33
Headcount1) 2,001 2,020 –1 2,001 2,020 –1
€ million € million
Operating profit 76 153 –77 9 50 –41
Operating return on sales (%) 4.4 6.7 – 1.6 6.9 –
1) Headcount as of September 30, 2014, vs. December 31, 2013.
MAN Latin America received orders of €1.7 billion in the first three quarters of 2014 (previous year:
€2.3 billion). Order intake was down 25% year-on-year due to the deteriorating market environment
and the depreciation of the Brazilian real. Measured in terms of units, order intake declined by 21% to
36,168 vehicles.
New registrations for trucks weighing 5 t and over in Brazil declined by 14% to 97,818 units. The
worsening business climate and a further slowing of the economy had a significant impact on this trend.
The Brazilian Development Bank has now returned to a simplified allocation method for subsidized
financing, and in addition is now also offering full financing. However, this has not yet led to any
measurable effects. MAN Latin America sold 26,646 trucks in the Brazilian truck market. This
corresponds to a decline of 17% as against the prior-year quarter. With a total of 26,332 new truck
registrations (previous year: 30,881), MAN Latin America maintained its eleven-year market leadership,
achieving a market share of 26.9% in the first nine months (previous year: 27.3%).

Group Interim Financial Report for Q3/2014 MAN SE 20
New registrations in the Brazilian bus market decreased by 17% in the first nine months, to 19,985
vehicles. MAN Latin America sold 5,122 bus chassis (previous year: 7,694) and achieved a market
share of 25.9% (previous year: 29.0%) in the declining market, with 5,171 new bus registrations
(previous year: 6,967). The decrease in market share is mainly attributable to lower registrations of
government-sponsored school buses. MAN Latin America was disproportionately represented in this
market segment. The company nevertheless again occupied the number two position in the Brazilian
bus market.
Brazil’s commercial vehicles exports declined by 19% year-on-year as a result of the currently weak
economy in Latin American markets, primarily Argentina. MAN Latin America remained one of Brazil’s
leading exporters, with 18% of the country’s commercial vehicle exports. The company sold 4,400
vehicles (previous year: 5,841) outside Brazil.
Production volumes declined by 27% compared with the prior-year period. MAN Latin America
produced 29,886 trucks (previous year: 40,303) and 6,038 bus chassis (previous year: 9,187) in the
first three quarters. Production volumes were adjusted to match the lower level of demand.
Operating profit declined to €76 million in the first nine months, as against the €153 million recorded in
the prior-year period. This was mainly caused by lower sales volumes, the depreciation of the Brazilian
real, and more intense competition. MAN Latin America’s operating return on sales was 4.4% (previous
year: 6.7%).
The Management of MAN Latin America is expecting considerably lower sales revenue in full-year
2014. The decrease is mainly attributable to lower market volumes, the resulting considerable decline
in unit sales, and negative currency effects. Operating profit will be impacted by lower unit sales,
intensifying competition, and the associated price pressure, as well as by the depreciation of the
Brazilian real. Operating profit and the operating return on sales are expected to be substantially below
the 2013 level.

Group Interim Financial Report for Q3/2014 MAN SE 21
MAN Diesel & Turbo
2014 2013 Change 2014 2013 Change
€ million Q1–Q3 Q1–Q3 in % Q3 Q3 in %
Order intake1) 2,440 2,281 7 753 679 11
of which: Engines & Marine Systems
1,301 1,091 19 436 346 26
of which: Power Plants 305 322 –5 59 69 –14
of which: Turbomachinery 834 868 –4 258 265 –3
Sales revenue1) 2,309 2,410 –4 883 795 11
of which: Engines & Marine Systems
1,012 972 4 354 324 9
of which: Power Plants 454 404 12 237 116 104
of which: Turbomachinery 843 1,034 –18 291 355 –18
Headcount2) 14,906 14,560 2 14,906 14,560 2
€ million € million
Operating profit/loss1) 147 –138 285 59 84 –25
of which: Engines & Marine Systems
108 95 13 42 51 –9
of which: Power Plants 21 –288 309 17 7 10
of which: Turbomachinery 18 55 –37 0 26 –26
Operating return on sales (%) 6.4 –5.7 – 6.7 10.6 –
1) Including consolidation adjustments between the Engines & Marine Systems, Power Plants, and Turbomachinery strategic business units.
2) Headcount as of September 30, 2014, vs. December 31, 2013.
As before, the situation in the market for large merchant ships such as container and freight ships
remains strained due to overcapacity. Despite this, the mood is improving slightly in the market amid
expectations of an upturn. Four-stroke applications for merchant and special-purpose ships saw
continued stable demand in the first nine months of 2014. Overall, the marine market exhibited
marginally positive tendencies as against the comparable prior-year period.
Demand for energy generation remains high, particularly in the developing countries and emerging
economies, with a strong trend towards higher flexibility and decentralized availability. There is also a
global trend towards gas as a fuel. However, there are signs of delays in awarding contracts,
particularly for larger projects, due to currency fluctuations and more difficult financing conditions for
customers. Compared with the same period in the previous year, the energy generation market proved
stable overall.

Group Interim Financial Report for Q3/2014 MAN SE 22
The market for new turbomachinery is significantly dominated by contracts awarded for global
investment projects in oil and chemical plants. Project volumes in the oil and gas industry remain at a
high level, while competitive pressure has intensified as a result of the weak U.S. dollar in the first half
of the year and the depreciation of the yen. Demand for turbomachinery in the processing industry was
at a low overall level in the first three quarters of 2014, with the already fierce competition becoming
even more intense due to the currency issues mentioned. Overall, the turbomachinery market declined
slightly as against the prior-year period.
MAN Diesel & Turbo’s order intake was €2,440 million in the first nine months of 2014 (previous year:
€2,281 million), a 7% increase year-on-year. Order intake amounted to €1,301 million in the Engines &
Marine Systems strategic business unit, an improvement of 19% compared with the previous year
(€1,091 million). In particular an increase in the license business had a positive effect, while the prior-
year figure was not reached in the new construction business despite continued healthy demand for
specialist applications such as cruise and offshore ships. In the Power Plants strategic business unit,
order intake was €305 million, falling slightly short of the prior-year figure of €322 million (–5%) due
mainly to fewer orders in the new construction business. At €834 million, order volumes in the
Turbomachinery strategic business unit were down 4% year-on-year (previous year: €868 million). The
decline in the new construction business, in particular in the processing industry, was only partly offset
by a rise in the after-sales business. A major order was received in the second quarter of 2014 in the
field of turbo applications for the oil and gas industry.
Sales revenue in the first three quarters amounted to €2,309 million, falling 4% short of the figure for
2013 (€2,410 million). At €1,012 million, sales revenue in the Engines & Marine Systems strategic
business unit was up 4% on the prior-year figure of €972 million. Sales revenue in the Power Plants
strategic business unit was €454 million, up 12% year-on-year (previous year: €404 million) for reasons
relating to billing. At €843 million, the Turbomachinery strategic business unit fell short of the 2013 sales
revenue figure (€1,034 million) by 18%. This mainly affected the new construction and after-sales
businesses.
MAN Diesel & Turbo’s operating profit was €147 million in the first nine months of 2014 (previous year:
loss of €138 million), corresponding to an operating return on sales of 6.4% (previous year: –5.7%).
Profit in the Engines & Marine Systems strategic business unit improved year-on-year to €108 million
(previous year: €95 million) as a result of increased capacity utilization. The Power Plants strategic
business unit recorded a modest €21 million profit between January and September 2014, after a
significant loss of €288 million in the prior-year period due to the recognition of additional provisions for
a power plant project that was not yet completed. Operating profit in the Turbomachinery strategic
business unit was €18 million (previous year: €55 million). This decline was due primarily to lower sales
revenue and decreased capacity utilization.

Group Interim Financial Report for Q3/2014 MAN SE 23
The slight rise in the headcount in the first three quarters of 2014 is mainly the result of switching
subcontracted employees to permanent contracts, and of newly consolidated companies. At 701 as of
September 30, 2014, the number of trainees was virtually unchanged on the figure as of December 31,
2013 (714).
For fiscal year 2014, MAN Diesel & Turbo expects order intake and sales revenue to again be roughly
on a level with the previous year. There should once again be a significantly positive operating profit,
although it will continue to be impacted by the fierce competition in all business markets, the slow
license business in the marine sector, and customer reticence in the after-sales business. However,
operating profit and the operating return on sales will not reach the very good results achieved in the
years up to and including 2012.

Group Interim Financial Report for Q3/2014 MAN SE 24
Renk
2014 2013 Change 2014 2013 Change
€ million Q1–Q3 Q1–Q3 in % Q3 Q3 in %
Order intake 321 421 –24 95 184 –49
Sales revenue 347 350 –1 130 125 5
Headcount1) 2,203 2,306 –4 2,203 2,306 –4
€ million € million
Operating profit 50 47 3 24 19 5
Operating return on sales (%) 14.3 13.4 – 18.4 15.6 –
1) Headcount as of September 30, 2014, vs. December 31, 2013.
The Renk group’s order intake for the first nine months of 2014 was almost 25% down on the figure for
the previous year, due in particular to declines in vehicle transmissions and special gear units. Order
intake for the third quarter of 2014 amounted to €95 million, almost 50% lower than the prior-year
figure, which was impacted by major orders in the Vehicle Transmissions and Special Gear Units
businesses. The figure for the Slide Bearings business remained roughly the same, while significant
growth was recorded in the Standard Gear Units business.
Renk generated sales revenue of €347 million in the first three quarters of 2014, remaining on a similar
level to the figure for the previous year of €350 million. The Vehicle Transmissions and Special Gear
Units businesses recorded increases year-on-year, while the Standard Gear Units and Slide Bearings
businesses experienced declines.
Renk recorded an operating profit of €50 million in the first nine months (previous year: €47 million),
resulting in a return on sales of 14.3% (previous year: 13.4%). All businesses generated positive
contributions to earnings.
Based on developments to date in the current fiscal year, Renk’s Management expects order intake for
2014 to remain unchanged at close to €500 million, with sales revenue slightly down on the prior-year
figure of €485 million. Operating profit is expected to exceed the €60 million mark, and thus the
operating return on sales will again be in double-digit territory.

Group Interim Financial Report for Q3/2014 MAN SE 25
Others
2014 2013 Change 2014 2013 Change
€ million Q1–Q3 Q1–Q3 in % Q3 Q3 in %
Headcount1) 313 329 –5 313 329 –5
of which: MAN Shared Services 56 66 –15 56 66 –15
of which: MAN SE 257 263 –2 257 263 –2
€ million € million
Operating loss –61 –119 57 –20 –42 23
of which: MAN SE and MAN Shared Services
–24 –66 42 –7 –30 23
of which: earnings effects from purchase price allocations –37 –60 23 –13 –16 4
of which: consolidation 0 7 –8 0 4 –4
1) Headcount as of September 30, 2014, vs. December 31, 2013.
―Others‖ comprises MAN SE and its Shared Services companies, the investments held directly by
MAN SE, and the consolidation adjustments between MAN Group business areas.
The operating loss amounted to €61 million after the first nine months (previous year: €119 million).
This narrowed year-on-year primarily because of lower purchase price allocation effects and lower
nonpersonnel expenses and project costs.
Related party disclosures
Please refer to the ―Notes to the Condensed Interim Consolidated Financial Statements‖ for related
party disclosures.

Group Interim Financial Report for Q3/2014 MAN SE 26
Condensed Interim Consolidated Financial Statements as of
September 30, 2014
MAN consolidated income statement
Reporting period January 1 to September 30
MAN Group
€ million 2014 2013
Sales revenue 10,214 11,341
Cost of sales –8,269 –9,431
Gross profit 1,946 1,910
Other operating income 380 343
Distribution expenses –1,165 –1,209
General and administrative expenses –580 –624
Other operating expenses –276 –384
Operating profit 304 36
Share of profits and losses of equity-method investments 16 –41
Finance costs –144 –150
Other financial result 27 103
Financial result –101 –89
Profit/loss before tax 203 –53
Income tax expense –85 –239
Loss from discontinued operations, net of tax – –304
Profit/loss after tax 118 –596
of which attributable to noncontrolling interests 9 8
of which attributable to shareholders of MAN SE 108 –604
Earnings per share from continuing operations in € 0.74 –2.04
Earnings per share from continuing and discontinued operations in € 0.74 –4.11

Group Interim Financial Report for Q3/2014 MAN SE 27
MAN consolidated income statement
Reporting period July 1 to September 30
MAN Group
€ million 2014 2013
Sales revenue 3,515 3,712
Cost of sales –2,848 –2,942
Gross profit 667 770
Other operating income 93 113
Distribution expenses –405 –393
General and administrative expenses –178 –191
Other operating expenses –95 –141
Operating profit 82 159
Share of profits and losses of equity-method investments 10 –34
Finance costs –47 –62
Other financial result 0 14
Financial result –37 –82
Profit before tax 45 77
Income tax expense –19 9
Loss from discontinued operations, net of tax – –304
Profit/loss after tax 26 –218
of which attributable to noncontrolling interests 4 3
of which attributable to shareholders of MAN SE 22 –221
Earnings per share from continuing operations in € 0.15 0.56
Earnings per share from continuing and discontinued operations in € 0.15 –1.51

Group Interim Financial Report for Q3/2014 MAN SE 28
MAN consolidated reconciliation of comprehensive income for the period
Reporting period January 1 to September 30
€ million 2014 2013
Profit/loss after tax 118 –596
Items that will not be reclassified to profit or loss
Remeasurements of pension plans –188 105
Deferred taxes 60 –25
Other comprehensive income for the period from equity-method investments –3 –
Items that will be reclassified subsequently to profit or loss
Currency translation differences 143 –259
Measurement of marketable securities and financial investments 880 –15
Change in fair values of derivatives –15 –13
Other comprehensive income for the period from equity-method investments –1 –2
Deferred taxes –9 –4
Other comprehensive income for the period 867 –213
Total comprehensive income for the period 985 –809
of which attributable to noncontrolling interests 7 9
of which attributable to shareholders of MAN SE 977 –818
The other comprehensive income of €867 million consists of €880 million from the measurement of the
investment in Scania AB, Sodertalje/Sweden (Scania), which is classified as an available-for-sale
financial asset, and currency translation gains of €143 million from the translation of the financial
statements of foreign consolidated Group companies, in particular due to the change in the exchange
rate of the Brazilian real to the euro. These items were offset in part by actuarial losses attributable to
pensions and other post-employment benefits of €188 million. These result primarily from the decrease
in the discount rate for obligations in Germany from 3.7% as of December 31, 2013, to 2.7%. In
connection with the sale of MAN Finance, €–10 million was reclassified from other comprehensive
income to profit or loss.
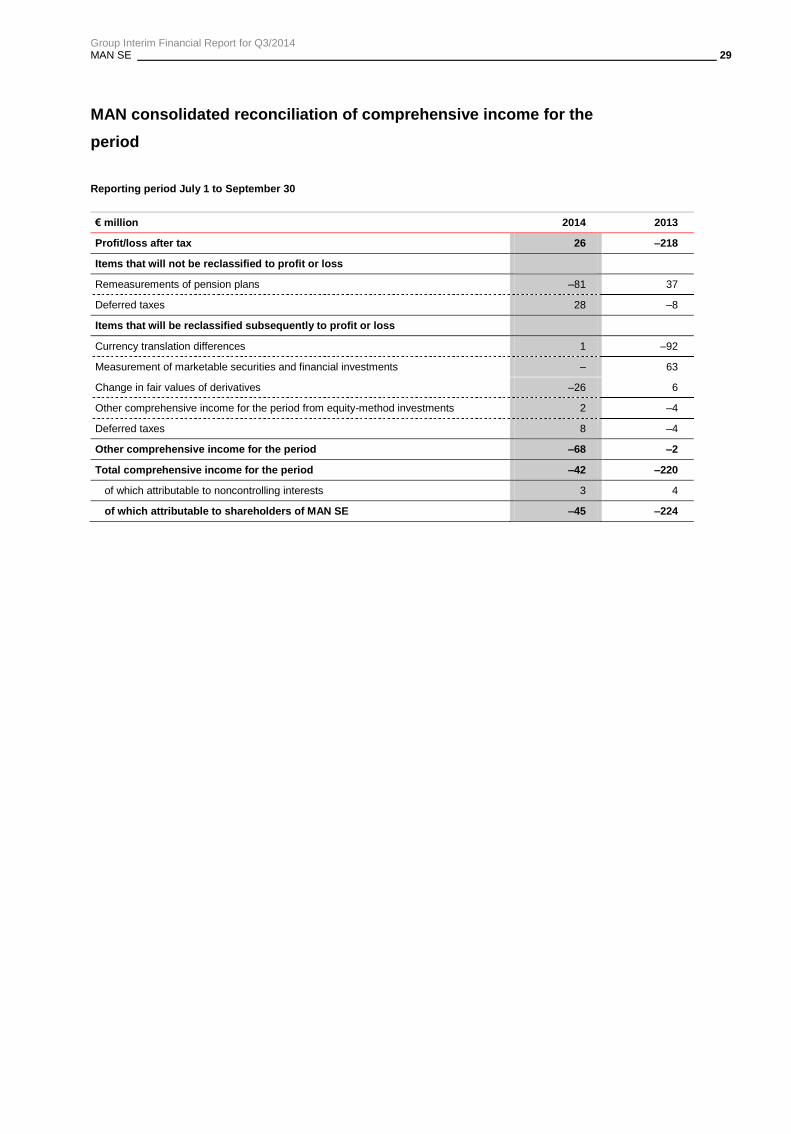
Group Interim Financial Report for Q3/2014 MAN SE 29
MAN consolidated reconciliation of comprehensive income for the
period
Reporting period July 1 to September 30
€ million 2014 2013
Profit/loss after tax 26 –218
Items that will not be reclassified to profit or loss
Remeasurements of pension plans –81 37
Deferred taxes 28 –8
Items that will be reclassified subsequently to profit or loss
Currency translation differences 1 –92
Measurement of marketable securities and financial investments – 63
Change in fair values of derivatives –26 6
Other comprehensive income for the period from equity-method investments 2 –4
Deferred taxes 8 –4
Other comprehensive income for the period –68 –2
Total comprehensive income for the period –42 –220
of which attributable to noncontrolling interests 3 4
of which attributable to shareholders of MAN SE –45 –224
Group Interim Financial Report for Q3/2014 MAN SE 30
MAN consolidated balance sheet as of September 30, 2014
Assets
MAN Group
€ million 9/30/2014 12/31/2013
Intangible assets 2,018 1,924
Property, plant, and equipment 2,124 2,174
Equity-method investments 470 462
Financial investments 2,407 1,522
Assets leased out 2,602 2,483
Income tax receivables 4 –
Deferred tax assets 622 551
Other noncurrent financial assets 500 692
Other noncurrent receivables 172 141
Noncurrent assets 10,920 9,949
Inventories 3,597 3,112
Trade receivables 2,206 2,346
Current income tax receivables 78 54
Assets held for sale – 3,986
Other current financial assets 266 1,357
Other current receivables 815 595
Marketable securities – 1
Cash and cash equivalents 624 1,137
Current assets 7,586 12,588
18,506 22,537
Group Interim Financial Report for Q3/2014 MAN SE 31
MAN consolidated balance sheet as of September 30, 2014
Equity and liabilities
MAN Group
€ million 9/30/2014 12/31/2013
Subscribed capital 376 376
Capital reserves 795 795
Retained earnings 4,022 4,329
Accumulated other comprehensive income 530 –350
Equity attributable to shareholders of MAN SE 5,723 5,150
Noncontrolling interests 78 77
Total equity 5,801 5,227
Noncurrent financial liabilities 1,457 2,267
Pensions and other post-employment benefits 636 452
Deferred tax liabilities 344 329
Income tax provisions, noncurrent 54 33
Other noncurrent provisions 661 644
Other noncurrent financial liabilities 1,178 1,163
Other noncurrent liabilities 931 861
Noncurrent liabilities and provisions 5,261 5,749
Current financial liabilities 1,347 1,360
Trade payables 1,656 1,922
Prepayments received 830 852
Current income tax payables 38 23
Liabilities associated with assets held for sale – 3,525
Income tax provisions, current 67 713
Other current provisions 1,065 1,308
Other current financial liabilities 1,167 755
Other current liabilities 1,273 1,103
Current liabilities and provisions 7,443 11,561
18,506 22,537

Group Interim Financial Report for Q3/2014 MAN SE 32
MAN consolidated statement of cash flows
Reporting period January 1 to September 30
MAN Group
€ million 2014 2013
Cash and cash equivalents at beginning of period 1,208 1,366
Profit/loss before tax of continuing operations 203 –53
Income taxes paid –726 –86
Depreciation and amortization of, and impairment losses on, intangible assets, property, plant, and equipment, and investment property
1) 275 302
Amortization of capitalized development costs1) 68 60
Impairment losses on equity investments1) 0 4
Depreciation of assets leased out1) 310 274
Change in pension provisions –1 –3
Loss on disposal of noncurrent assets –9 –1
Share of profits or losses of equity-method investments –9 46
Other noncash income and expense –10 14
Gross cash flow 101 557
Change in working capital –1,203 –838
Change in inventories –454 –466
Change in receivables –12 –139
Change in liabilities and prepayments received (excluding financial liabilities) –121 –27
Change in provisions –218 140
Change in assets leased out –398 –253
Change in financial services receivables – –93
Net cash used in operating activities –1,102 –281
Payments to acquire property, plant, and equipment, investment property, and intangible assets –182 –218
Additions to capitalized development costs –135 –98
Payments to acquire other investees –5 –2
Proceeds from the disposal of subsidiaries, net of cash disposed of 417 –
Proceeds from asset disposals (other than assets leased out) 15 15
Net cash provided by/used in investing activities attributable to operating activities 110 –303
Net cash flow –992 –584
1)
Net of impairment reversals.
Group Interim Financial Report for Q3/2014 MAN SE 33
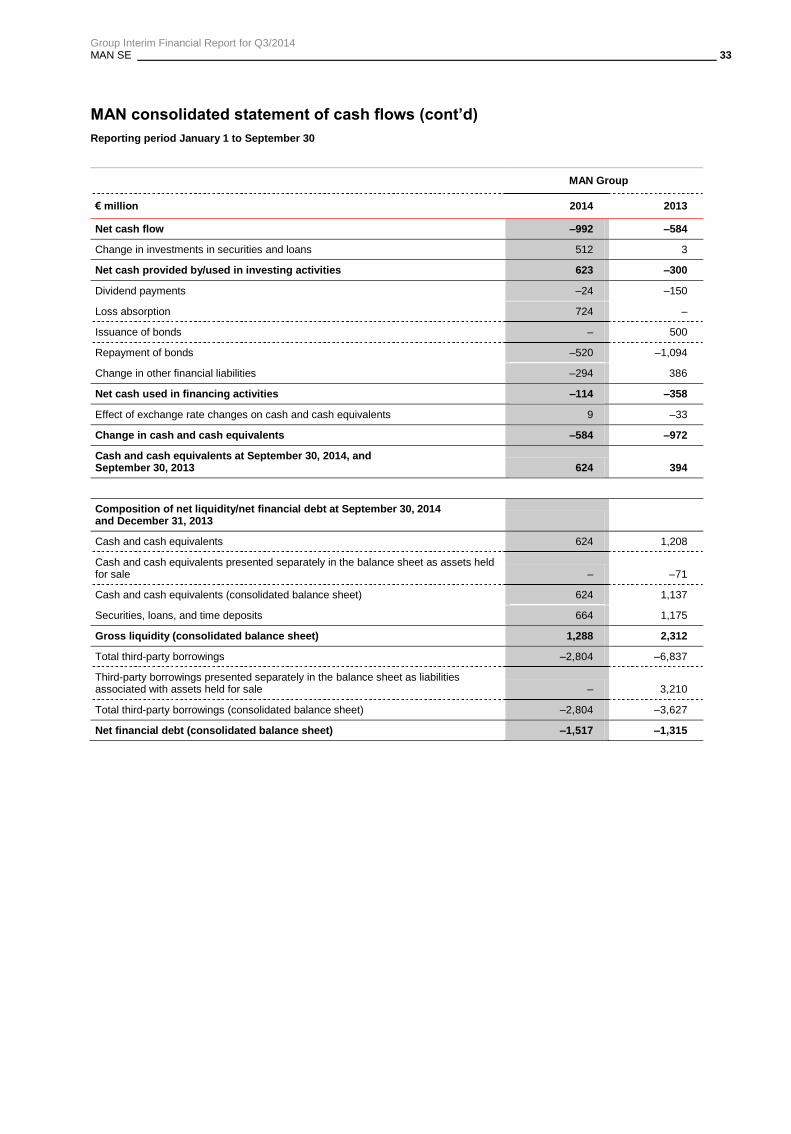
MAN consolidated statement of cash flows (cont’d)
Reporting period January 1 to September 30
MAN Group
€ million 2014 2013
Net cash flow –992 –584
Change in investments in securities and loans 512 3
Net cash provided by/used in investing activities 623 –300
Dividend payments –24 –150
Loss absorption 724 –
Issuance of bonds – 500
Repayment of bonds –520 –1,094
Change in other financial liabilities –294 386
Net cash used in financing activities –114 –358
Effect of exchange rate changes on cash and cash equivalents 9 –33
Change in cash and cash equivalents –584 –972
Cash and cash equivalents at September 30, 2014, and September 30, 2013 624 394
Composition of net liquidity/net financial debt at September 30, 2014 and December 31, 2013
Cash and cash equivalents 624 1,208
Cash and cash equivalents presented separately in the balance sheet as assets held for sale – –71
Cash and cash equivalents (consolidated balance sheet) 624 1,137
Securities, loans, and time deposits 664 1,175
Gross liquidity (consolidated balance sheet) 1,288 2,312
Total third-party borrowings –2,804 –6,837
Third-party borrowings presented separately in the balance sheet as liabilities associated with assets held for sale – 3,210
Total third-party borrowings (consolidated balance sheet) –2,804 –3,627
Net financial debt (consolidated balance sheet) –1,517 –1,315

Group Interim Financial Report for Q3/2014 MAN SE 34
MAN consolidated statement of changes in equity
€ million
Sub-
scribed
capital
Capital
reserves
Retained
earnings
Other com-
prehensive
income
Equity
attributa-
ble to
share-
holders
of MAN
SE
Non-
controlling
interests Total
Balance at December 31, 2013 376 795 4,329 –350 5,150 77 5,227
Profit after tax – – 108 – 108 9 118
Other comprehensive income – – – 869 869 –2 867
Total comprehensive income – – 108 869 977 7 985
Dividend payments – – –21 – –21 –3 –24
Other changes1) – – –393 11 –382 –4 –387
Balance at September 30, 2014 376 795 4,022 530 5,723 78 5,801
Balance at December 31, 2012 376 795 4,263 116 5,550 69 5,619
Change in accounting policy due to IAS 19 (2011) – – 13 – 13 0 13
Adjusted balance at January 1, 2013 376 795 4,276 116 5,563 69 5,632
Loss after tax – – –604 – –604 8 –596
Other comprehensive income – – – –214 –214 1 –213
Total comprehensive income – – –604 –214 –818 9 –809
Dividend payments – – –147 – –147 –3 –150
Other changes – – – 0 0 1 1
Balance at September 30, 2013 376 795 3,525 –98 4,598 76 4,674
1) Retained earnings include the share of profit/loss to which Truck & Bus GmbH is entitled in the event of profit transfer based on profit/loss
under German GAAP, see also ―Accounting policies.‖
The Annual General Meeting of MAN SE on May 15, 2014, resolved to distribute a dividend to the
shareholders totaling €21 million (€0.14 per share). The dividend was paid on May 16, 2014.
See page 29 for information on changes in other comprehensive income for the period.

Group Interim Financial Report for Q3/2014 MAN SE 35
Notes to the Condensed Interim Consolidated Financial Statements Basis of presentation
In accordance with Regulation No. 1606/2002 of the European Parliament and of the Council, MAN SE,
Munich, prepared its consolidated financial statements for 2013 in compliance with the International
Financial Reporting Standards (IFRSs), as adopted by the European Union. The accompanying
condensed interim consolidated financial statements (interim consolidated financial statements) as of
September 30, 2014, were prepared in accordance with IAS 34 and do not contain all the information
and disclosures required by IFRSs for full-year consolidated financial statements, and should be read
in conjunction with the Company’s published IFRS consolidated financial statements for fiscal 2013.
Unless expressly indicated otherwise, the accounting policies applied to these interim consolidated
financial statements are identical to those adopted for the most recent full-year consolidated financial
statements; a detailed description of these accounting policies is given in the notes to the consolidated
financial statements for the year ended December 31, 2013. All figures shown are rounded, so minor
discrepancies may arise from addition of these amounts.
From the Executive Board’s perspective, the accompanying unaudited interim financial report reflects
all standard intraperiod adjustments required for the presentation of a true and fair view of the Group’s
net assets, financial position, and results of operations. The results presented for the first nine months
of fiscal 2014 and for the third quarter of the fiscal year are not necessarily indicative of future results.
Preparation of the interim consolidated financial statements requires the Executive Board to make
certain assumptions and estimates affecting the measurement and presentation of assets and
liabilities, and income and expenses, for the period. Actual amounts may differ from these estimates. In
addition to the amounts contained in the financial statements, the interim financial report contains
explanatory notes on selected financial statement line items. Due to the integration into Volkswagen’s
reporting and to enhance comparability, certain amounts relating to the previous fiscal year have been
adjusted to conform to the current presentation. For further information, see ―Accounting policies‖ and
―Harmonization of income statement presentation with Volkswagen Group.‖
As of January 1, 2014, MAN sold the shares of MAN Finance International GmbH, Munich (MAN
Finance) to Volkswagen Financial Services AG, Braunschweig (VWFS). See ―Divestments‖ for further
information. Until December, 31, 2013, MAN Finance was presented under the ―Financial Services‖
heading in MAN’s financial reporting. Due to the sale of MAN Finance to VWFS, the classification of
figures into the Industrial Business and Financial Services presented as additional information until
December 31, 2013, is no longer disclosed.

Group Interim Financial Report for Q3/2014 MAN SE 36
Basis of consolidation
The interim financial statements as of September 30, 2014, include 101 companies (December 31,
2013: 122), including 21 (28) in Germany and 80 (94) outside Germany. See ―Divestments‖ for
information on the effects of the changes in the basis of consolidation.
Income tax expense
As a general principle, the current income tax expense presented in the interim financial statements
has been determined on the basis of the expected full-year income tax rate.
Accounting policies
MAN has applied all accounting pronouncements adopted by the EU and required to be applied as
from January 1, 2014.
The pronouncements contained in the ―consolidation package‖ must be applied effective January 1,
2014. These relate to the new standards IFRS 10 ―Consolidated Financial Statements,‖ IFRS 11
―Joint Arrangements,‖ and IFRS 12 ―Disclosure of Interests in Other Entities,‖ as well as amendments
to IAS 28 ―Investments in Associates and Joint Ventures.‖ The basis of consolidation and the
subsidiaries to be included in the consolidated financial statements are now defined by IFRS 10. All
entities that MAN SE can control directly or indirectly must be included in the basis of consolidation.
The switch from IAS 27 to IFRS 10 did not require the MAN Group to make any adjustments because
the parent/subsidiary relationships and other control relationships are attributable almost entirely to
voting rights majorities. There was therefore no requirement to consolidate additional entities or
deconsolidate existing ones.
IFRS 11 governs the definition of and accounting for ―joint arrangements‖ in the consolidated financial
statements. Joint arrangements are classified into ―joint ventures‖ and ―joint operations.‖ Because all
entities that are jointly controlled by MAN SE or one of its subsidiaries are required to be classified as
joint ventures, there were no effects from applying IFRS 11.
IFRS 12 governs all disclosures on interests in other entities and thus combines all of the information
required to be disclosed in the notes on subsidiaries, joint arrangements, associates, and
consolidated and unconsolidated structured entities. The scope of the information to be disclosed was
expanded in some cases.
Under IAS 28, only the equity method may be applied to joint ventures and associates effective
January 1, 2014. The option to include these entities in the consolidated financial statements using
proportionate consolidation was eliminated. Because proportionate consolidation was not used in the
past in the MAN Group, the elimination of this option did not result in any adjustments.
The other accounting pronouncements required to be applied in fiscal year 2014 for the first time do
not have any material effects on the presentation of the net assets, financial position, and results of

Group Interim Financial Report for Q3/2014 MAN SE 37
operations in MAN’s consolidated interim financial statements. A detailed list of these accounting
pronouncements is contained in the notes to the consolidated financial statements in the 2013 Annual
Report.
In addition, starting in 2014, the following voluntary changes were made to the accounting policies
due to the integration into Volkswagen’s financial reporting:
To enhance balance sheet comparability, the prior-year figures for deferred tax assets and liabilities
as of December 31, 2013, were changed to reflect the offsetting methodology applied in the
Volkswagen Group. This resulted in a €481 million reduction in both the assets and liabilities side of
the balance sheet.
Liabilities from other taxes, which were reported in other current liabilities until December 31, 2013,
have been classified into noncurrent and current liabilities according to their maturity, so as to ensure
their appropriate presentation and to improve comparability. This change is limited to a
reclassification within the liabilities side of the balance sheet. As a result, €131 million was
reclassified from other current liabilities to other noncurrent liabilities as of September 30, 2014. The
prior-year figures were adjusted accordingly (€102 million).
As a rule, until December 31, 2013, financial liabilities from intragroup finance transactions were
included in current financial liabilities at the level of the companies consolidated. Starting in fiscal year
2014, items are allocated to noncurrent or current financial liabilities according to their maturity. This
did not result in any changes for the MAN Group.
In addition, the financial assets previously reported in ―Other assets‖ are reported separately as
current and noncurrent items starting in fiscal 2014. The prior-year figures were adjusted to reflect
this change in presentation.
The financial statements of foreign MAN Group companies are translated into euros using the
functional currency concept. Until December 31, 2013, income statement items were translated at the
average exchange rate for the year, which was generally derived from monthly average exchange
rates. Starting in fiscal 2014, income statement items are translated into euros at weighted average
rates.
Financial instruments are no longer accounted for at the trade date as they were until December 31,
2013, but at the settlement date — that is, at the date on which the asset is delivered. These two
changes did not have a material effect.
See ―Harmonization of income statement presentation with Volkswagen Group‖ for information on the
changes to income statement presentation.
In light of the domination and profit and loss transfer agreement entered into by Truck & Bus GmbH, a
wholly owned subsidiary of Volkswagen Aktiengesellschaft, Wolfsburg (Volkswagen AG), and MAN

Group Interim Financial Report for Q3/2014 MAN SE 38
SE, the accompanying condensed interim financial statements have been prepared after
appropriation of net profit.
Divestments
MAN SE entered into an agreement with VWFS to sell the shares of MAN Finance. MAN Finance
primarily operates the sales financing business for MAN Truck & Bus and has been presented under
the ―Financial Services‖ heading in MAN’s financial reporting to date. The transaction was completed
on January 1, 2014. See the ―Related party disclosures‖ for further information. The bundling of the
infrastructure, resources, and expertise of VWFS and MAN Finance facilitates the development of
integrated transportation solutions for MAN Truck & Bus’s customers, including in other markets.
MAN Finance will remain MAN Truck & Bus’s exclusive sales support organization.
The assets and liabilities of MAN Finance transferred during the transaction were presented as held for
sale as of December 31, 2013. The figures were presented in the MAN Truck & Bus segment. The
following table provides information about the carrying amounts of these assets and liabilities as of
December 31, 2013, and completion of the transaction:
€ million 2013
Intangible assets, property, plant, and equipment, and investments 49
Assets leased out 273
Deferred tax assets 404
Inventories 155
Trade receivables 78
Financial services receivables 2,841
Cash and cash equivalents 71
Miscellaneous other assets 115
Assets held for sale 3,986
Financial liabilities 3,210
Deferred tax liabilities 179
Trade payables 55
Other liabilities 81
Liabilities associated with assets held for sale 3,525
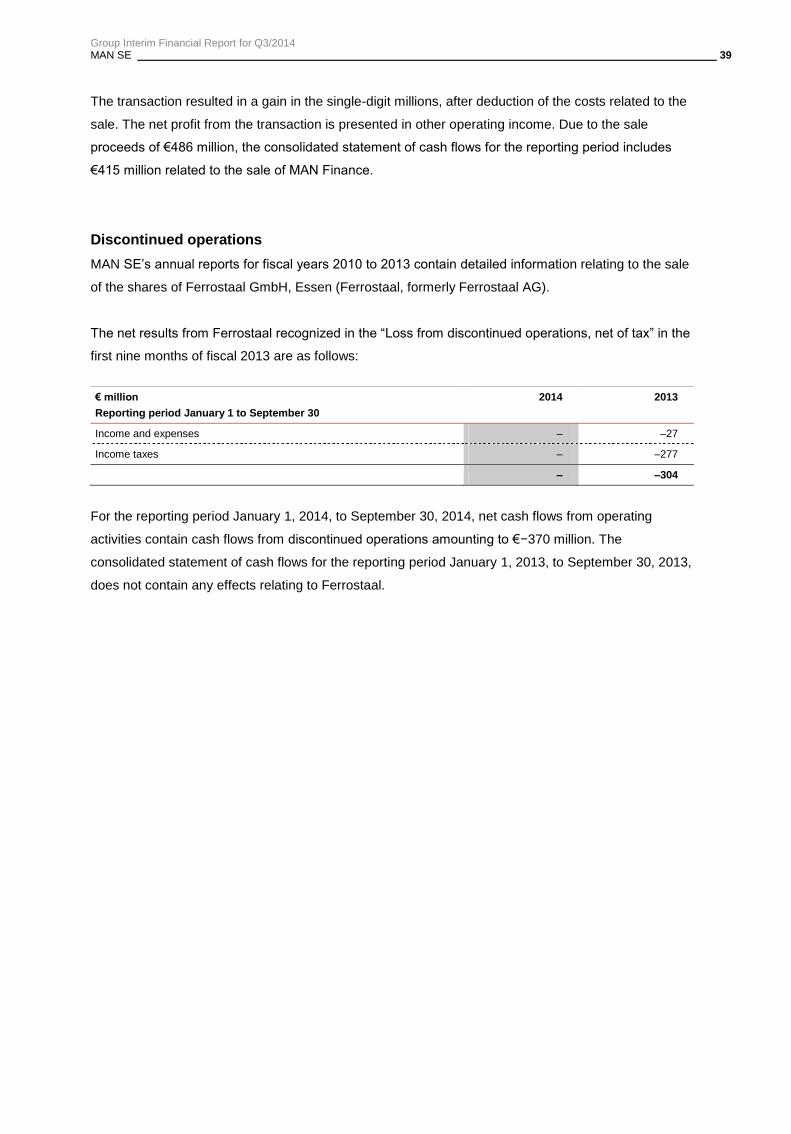
Group Interim Financial Report for Q3/2014 MAN SE 39
The transaction resulted in a gain in the single-digit millions, after deduction of the costs related to the
sale. The net profit from the transaction is presented in other operating income. Due to the sale
proceeds of €486 million, the consolidated statement of cash flows for the reporting period includes
€415 million related to the sale of MAN Finance.
Discontinued operations
MAN SE’s annual reports for fiscal years 2010 to 2013 contain detailed information relating to the sale
of the shares of Ferrostaal GmbH, Essen (Ferrostaal, formerly Ferrostaal AG).
The net results from Ferrostaal recognized in the ―Loss from discontinued operations, net of tax‖ in the
first nine months of fiscal 2013 are as follows:
€ million
Reporting period January 1 to September 30
2014 2013
Income and expenses – –27
Income taxes – –277
– –304
For the reporting period January 1, 2014, to September 30, 2014, net cash flows from operating
activities contain cash flows from discontinued operations amounting to €−370 million. The
consolidated statement of cash flows for the reporting period January 1, 2013, to September 30, 2013,
does not contain any effects relating to Ferrostaal.

Group Interim Financial Report for Q3/2014 MAN SE 40
Income Statement Disclosures
Harmonization of income statement presentation with Volkswagen Group
As part of the integration into the Volkswagen Group, starting in fiscal 2014 the presentation of MAN’s
income statement is consistent with the structure used by Volkswagen. The income statements for the
comparable prior-year periods have been adjusted to conform to the new presentation, as shown in the
following tables.
Reporting period January 1 to September 30, 2013
Previous structure
Adjustments due to change in presentation New structure
€ million
(1) (2) (3) (4) (5) (6)
€ million
Sales revenue 11,203 158 –20 11,341 Sales revenue
Cost of sales –9,096 –87 –406 –63 353 –132 –9,431 Cost of sales
Gross profit 2,107 1,910 Gross profit
Other operating income 346 –158 155 343 Other operating income
Distribution expenses –855 –353 –1 –1,209 Distribution expenses
General and administrative expenses –624 –624
General and administrative expenses
Other operating expenses –914 87 406 63 –26 –384 Other operating expenses
Share of profits and losses of equity-method investments –16 16 –
No longer included in operating profit/loss
Impairment losses on equity-method investments –26 26 –
No longer included in operating profit/loss
Profits and losses of financial investments 58 –58 –
No longer included in operating profit/loss
Earnings before interest and taxes (EBIT) 76 36 Operating profit
–41 –41 Share of profits and losses of
equity-method investments
Interest income 21 58 24 103 Other financial result
Interest expense –150 –150 Finance costs
–89 Financial result
Loss before tax –53 –53 Loss before tax
Income tax expense –239 –239 Income tax expense
Loss from discontinued operations, net of tax –304 –304
Loss from discontinued operations, net of tax
Loss after tax –596 –596 Loss after tax
of which attributable to noncontrolling interests 8 8
of which attributable to noncontrolling interests
of which attributable to shareholders of MAN SE –604 –604
of which attributable to shareholders of MAN SE

Group Interim Financial Report for Q3/2014 MAN SE 41
Reporting period July 1 to September 30, 2013
Previous structure
Adjustments due to change in presentation New structure
€ million
(1) (2) (3) (4) (5) (6)
€ million
Sales revenue 3,664 52 –4 3,712 Sales revenue
Cost of sales –2,860 –29 –135 30 112 –60 –2,942 Cost of sales
Gross profit 804 770 Gross profit
Other operating income 126 –52 40 113 Other operating income
Distribution expenses –277 –112 –3 –393 Distribution expenses
General and administrative expenses –191 –191
General and administrative expenses
Other operating expenses –294 29 135 –30 19 –141 Other operating expenses
Share of profits and losses of equity-method investments –9 9 –
No longer included in operating profit/loss
Impairment losses on equity-method investments –26 26 –
No longer included in operating profit/loss
Profits and losses of financial investments 0 0 –
No longer included in operating profit/loss
Earnings before interest and taxes (EBIT) 133 159 Operating profit
–34 –34
Share of profits and losses of equity-method
investments
Interest income 6 0 8 14 Other financial result
Interest expense –62 –62 Finance costs
–82 Financial result
Profit before tax 77 77 Profit before tax
Income tax expense 9 9 Income tax expense
Loss from discontinued operations, net of tax –304 –304
Loss from discontinued operations, net of tax
Loss after tax –218 –218 Loss after tax
of which attributable to noncontrolling interests 3 3
of which attributable to noncontrolling interests
of which attributable to shareholders of MAN SE –221 –221
of which attributable to shareholders of MAN SE
The main effects of the change from the income statement structure used by the MAN Group until
December 31, 2013, to presentation in accordance with the structure used by Volkswagen are
described in the following:
(1) Income and expenses from financial services, which were previously presented in other operating
income and other operating expenses, were reclassified to sales revenue and the cost of sales,
respectively. See ―Divestments‖ for further information.
(2) Research costs and development costs not eligible for capitalization, and amortization of
capitalized development costs, which is included in the cost of inventories, are now recognized in
the cost of sales, rather than in other operating expenses as they were until December 31, 2013.
(3) Additions to provisions for expected losses from executory contracts, which were previously
recognized in other operating expenses, are now included in the cost of sales.
(4) Order-related distribution expenses, particularly expenses for commissions, freight, and packaging
were previously presented in the cost of sales. Starting in fiscal 2014, these expenses are

Group Interim Financial Report for Q3/2014 MAN SE 42
generally presented in distribution expenses, unless they are closely related to the production
process.
(5) The profits and losses of equity-method investments and financial investments are no longer
included in operating profit/loss as they were until December 31, 2013, due to the change in the
definition of operating profit/loss. Instead, they are presented in the financial result.
(6) The other changes concern the following areas:
In the case of sale transactions, when the hedged item in a cash flow hedge affects profit or
loss, the portion recognized in accumulated other comprehensive income is now reclassified to
other operating income and other operating expenses, instead of to sales revenue as was the
case until December 31, 2013.
Valuation allowances, reversals of valuation allowances, and inventory scrapping are now
recognized in the cost of sales, rather than as other operating expenses.
Gains and losses from the measurement and settlement of freestanding derivatives and cash
flow hedge ineffectiveness, which were presented in other operating income and other
operating expenses until December 31, 2013, are now presented in other financial result.
Reversals of provisions and accruals are no longer reported in the costs in which the item was
recognized, but in other operating income.
In the past, warranty costs that were passed on to a supplier were deducted from the cost of
sales. Starting in this fiscal year, they are presented in other operating income.
Income and expenses due to changes in exchange rates were previously presented as a net
amount in other operating income or other operating expenses. Starting in fiscal 2014, gross
figures are presented.
Currency effects from the measurement of items included in net liquidity are recognized in the
financial result. Until December 31, 2013, these effects were presented in other operating
income or other operating expenses along with currency effects from receivables and liabilities
denominated in foreign currencies.

Group Interim Financial Report for Q3/2014 MAN SE 43
Other operating income
€ million
Reporting period January 1 to September 30 2014 2013
Income from foreign exchange gains 110 103
Income from reversal of provisions and accruals 98 92
Income from reversal of valuation allowances on receivables and other assets 18 17
Gains on disposal of property, plant, and equipment, and intangible assets 8 5
Income from foreign currency hedging derivatives 7 20
Miscellaneous other income 138 106
380 343
Foreign exchange gains comprise gains from changes in exchange rates between the dates of
recognition and payment of receivables and liabilities denominated in foreign currencies, as well as
exchange rate gains resulting from measurement at the closing rate. Likewise, foreign exchange losses
from these items are included in other operating expenses.
Miscellaneous other income includes a total of €46 million from the settlement with D&O insurers and
the individual settlements with former members of MAN SE’s Executive Board and individual Group
companies. The resolutions regarding these settlements were adopted in the first half of 2014.
Other operating expenses
€ million
Reporting period January 1 to September 30 2014 2013
Foreign exchange losses 94 138
Losses from foreign currency hedging derivatives 18 1
Valuation allowances on receivables and other assets 16 83
Miscellaneous other expenses 148 162
276 384
Other operating expenses comprise those expenses that are not allocated to the function expenses,
and in particular to cost of sales.

Group Interim Financial Report for Q3/2014 MAN SE 44
Research and development costs
€ million
Reporting period January 1 to September 30 2014 2013
Total research and development costs 495 444
of which: capitalized development costs –135 –98
Capitalization ratio in % 27.2 22.0
Amortization of capitalized development costs 68 60
Research and development costs reported in the income statement 429 406
Finance costs
€ million
Reporting period January 1 to September 30 2014 2013
Interest and similar expenses 126 174
less: interest expenses reclassified as cost of sales – –33
Interest expense 126 141
Interest component of additions to pension provisions less return on CTA plan assets 12 12
Unwinding of discount and effect of change in discount rate on other liabilities 6 –3
Interest cost on liabilities 18 9
Finance costs 144 150
The finance costs primarily contain interest expenses for financial liabilities and the interest cost from
unwinding of discounts on liabilities.
Earnings per share
€ million (unless otherwise stated)
Reporting period January 1 to September 30 2014 2013
Profit/loss after tax attributable to shareholders of MAN SE 108 –604
of which: loss from discontinued operations, net of tax – –304
Profit/loss from continuing operations attributable to shareholders of MAN SE 108 –300
Number of shares outstanding (weighted average, million) 147.0 147.0
Earnings per share from continuing operations in € 0.74 –2.04
Earnings per share are calculated by dividing consolidated net income from continuing operations by
the average number of shares outstanding in the year. The number of shares outstanding includes both
common and preferred shares because both share classes carry the same dividend rights in 2014, as
in the previous year.
There were no outstanding options on shares as of September 30, 2014, and September 30, 2013, that
dilute earnings per share. Any exercise of MAN SE’s contingent capital in future periods will be dilutive.

Group Interim Financial Report for Q3/2014 MAN SE 45
Balance Sheet Disclosures
Intangible assets
€ million 9/30/2014 12/31/2013
Licenses, software, similar rights, customer relationships, brands, and other assets 377 398
Capitalized development costs 841 766
Goodwill 800 760
2,018 1,924
Property, plant, and equipment
€ million 9/30/2014 12/31/2013
Land and buildings 963 960
Production plant and machinery 591 611
Other plant, operating and office equipment 415 437
Prepayments and construction in progress 155 166
2,124 2,174
Special tools and equipment amounting to €155 million as of September 30, 2014 (December 31,
2013: €178 million), which were previously allocated to production plant and machinery, are allocated
to operating and office equipment as of fiscal year 2014. The prior-year figures were adjusted
accordingly.
Equity-method investments
The most significant equity-method investment as of September 30, 2014, is the 25% equity interest
in the Sinotruk Ltd., Hong Kong/China, associate (Sinotruk). The 49% interest in the Rheinmetall
MAN Military Vehicles GmbH, Munich, associate is also accounted for using the equity method.
Summarized financial information for Sinotruk (on a 100% basis and thus not adjusted for the equity
interest held by MAN) is presented in the following tables:
Balance sheet
€ million 20141) 2013
2)
Current assets 4,112 3,694
Noncurrent assets 1,922 2,065
Current liabilities 3,377 2,580
Noncurrent liabilities 168 605
Total assets 6,034 5,759
1) Fiscal 2014: Amounts shown relate to the reporting period ended June 30, 2014. 2) Fiscal 2013: Amounts shown relate to the reporting period ended June 30, 2013.

Group Interim Financial Report for Q3/2014 MAN SE 46
Statement of comprehensive income
€ million 20141) 2013
2)
Sales revenue 3,886 3,417
Profit before tax from continuing operations 89 52
Income tax expense –19 –22
Profit after tax from continuing operations 70 30
Other comprehensive income –1 –2
Total comprehensive income 69 28 28
1) Fiscal 2014: Amounts shown relate to the reporting period from July 1, 2013, to June 30, 2014.
2) Fiscal 2013: Amounts shown relate to the reporting period from July 1, 2012, to June 30, 2013.
The carrying amounts of other associates amounted to €56 million as of September 30, 2014
(December 31, 2013: €59 million). The following table contains summarized financial information on
the other associates; the disclosures relate in all cases to the Group’s share of the investees:
€ million 20141) 2013
2)
Profit/loss after tax from continuing operations 2 –18
Other comprehensive income –2 –1
Total comprehensive income 0 –19
1) Fiscal 2014: Amounts shown relate to the reporting period from October 1, 2013, to June 30, 2014.
2) Fiscal 2013: Amounts shown relate to the reporting period from October 1, 2012, to June 30, 2013.
Inventories
€ million 9/30/2014 12/31/2013
Raw materials, consumables, and supplies 490 458
Work in progress 1,065 897
Finished goods and purchased merchandise 1,923 1,655
Prepayments 119 102
3,597 3,112
There was no requirement to recognize or reverse significant impairment losses on inventories in the
reporting period.
Trade receivables
€ million 9/30/2014 12/31/2013
Customer receivables 1,905 2,031
PoC receivables 248 241
Receivables from investees 53 74
2,206 2,346

Group Interim Financial Report for Q3/2014 MAN SE 47
Financial liabilities
€ million 9/30/2014 12/31/2013
Bonds 2,206 2,724
Liabilities to banks 454 598
Liabilities from loans 33 23
Other liabilities to affiliated companies 107 278
Liabilities under finance leases 4 5
2,804 3,627
Financial liabilities are reported in the following balance sheet items:
€ million 9/30/2014 12/31/2013
Noncurrent financial liabilities 1,457 2,267
Current financial liabilities 1,347 1,360
As announced, the cooperation with rating agency Moody’s was ended at the end of March 2014.
Other provisions
€ million 9/30/2014 12/31/2013
Warranties 863 853
Outstanding costs 242 265
Obligations to employees 119 128
Other liabilities arising from operating activities 176 213
Miscellaneous provisions 327 493
1,727 1,952
The miscellaneous provisions relate to obligations in the single-digit millions arising from the
restructuring measures for the bus plant in Plauen announced in the second quarter of 2014, as well as
to project-related provisions in MAN Diesel & Turbo’s Power Plants strategic business unit and to
obligations in the Commercial Vehicles business area.
Other provisions are reported in the following balance sheet items:
€ million 9/30/2014 12/31/2013
Other noncurrent provisions 661 644
Other current provisions 1,065 1,308

Group Interim Financial Report for Q3/2014 MAN SE 48
Contingent liabilities
The maximum total potential contingent liability for Ferrostaal under MAN’s obligations from
guarantees is €55 million. MAN’s guarantees for Ferrostaal are largely covered by indemnities,
depending on the origination date of the guarantee.
Litigation/legal proceedings
MAN SE’s Annual Report for fiscal 2013 contains detailed information on litigation and legal
proceedings.
The antitrust investigation of several commercial vehicle manufacturers that was launched in 2011 by
the South Korean antitrust authorities was terminated at the end of 2013 with the imposition of
administrative fines on all the manufacturers involved. An administrative fine of €2 million was
imposed on MAN Truck & Bus Korea Ltd. MAN has filed an appeal against this fine with the
competent court.
There have been no other significant developments for MAN since the publication of the Annual
Report.

Group Interim Financial Report for Q3/2014 MAN SE 49
Statement of cash flows
The statement of cash flows was modified at the beginning of 2014. The presentation has been
adapted to the structure used by Volkswagen. The changes affected the following area:
Starting in 2014, depreciation of assets leased out, gains and losses from asset disposals, and
changes in tax assets and liabilities are reported in gross cash flow. These items were previously
presented outside of gross cash flow in the MAN Group’s financial statements, in net cash provided
by/used in operating activities. The prior-year figures were adjusted accordingly. This reclassification
increased gross cash flow in the first three quarters of 2014 by €410 million. Net cash provided
by/used in operating activities was not affected by the reclassification.
The following table shows an overview of the adjustments made to the prior-year figures in the MAN
Group’s statement of cash flows.
€ million
Reporting period January 1 to September 30
2013
Unadjusted Adjustment Adjusted
Income taxes paid (previously Current income taxes) –223 137 –86
Depreciation of assets leased out – 274 274
Gain on disposal of noncurrent assets – –1 –1
Gross cash flow (previously Cash earnings) 147 410 557
Change in assets leased out 21 –274 –253
Change in tax assets and liabilities 137 –137 –
Gain on disposal of noncurrent assets –1 1 –
Net cash used in operating activities –281 – –281
Based on the domination and profit and loss transfer agreement between Truck & Bus GmbH and
MAN SE, the loss of €724 million for fiscal 2013 was absorbed on March 14, 2014. The loss
absorption was recognized in net cash provided by financing activities.

Group Interim Financial Report for Q3/2014 MAN SE 50
Fair value disclosures
The following table contains an overview of the financial assets and liabilities measured at fair value:
€ million 9/30/2014 Level 1 Level 2 Level 3
Noncurrent assets
Other financial assets 31 – 31 –
Current assets
Other financial assets 16 – 16 –
Noncurrent liabilities
Other financial liabilities 28 – 28 –
Current liabilities
Other financial liabilities 48 – 48 –
€ million 12/31/2013 Level 1 Level 2 Level 3
Noncurrent assets
Financial investments 1,485 1,485 – –
Other financial assets 26 – 26 –
Current assets
Other financial assets 28 – 28 –
Marketable securities 1 – 1 –
Noncurrent liabilities
Other financial liabilities 33 – 33 –
Current liabilities
Other financial liabilities 32 – 32 –
Fair value hierarchy:
Measurement and presentation of the fair values of financial instruments are based on a fair value
hierarchy that reflects the availability of the inputs used for measurement and is classified as follows:
Level 1: Quoted prices (unadjusted) in active markets for identical assets or liabilities that the entity
can access at the measurement date.
Level 2: Inputs other than quoted prices included within Level 1 that are observable for the asset or
liability, either directly or indirectly. This level includes currency forwards and options, commodity
futures, interest rate swaps, and cross-currency swaps. The fair value of these financial instruments
is determined on the basis of the conditions prevailing at the end of the reporting period, such as
interest rates or exchange rates, and using recognized models such as discounted cash flow or
option pricing models.

Group Interim Financial Report for Q3/2014 MAN SE 51
Level 3: Unobservable inputs for the asset or liability.
During the first nine months, there were no reclassifications between Level 1 and Level 2 in fair value
measurement, and there were no reclassifications into or out of Level 3 in relation to fair value
measurement. If circumstances arise that require a different classification, they are taken into account
on a quarterly basis.
Assets and liabilities measured at fair value through profit or loss consist of derivatives or
components of derivatives that are not included in hedge accounting.
Available-for-sale financial assets include the investment in Scania. The carrying amount of this
investment was €2,365 million as of September 30, 2014 (December 31, 2013: €1,485 million). The
shares of Scania have not been measured at fair value since June 2014. Other investments and
shares that are measured at cost have a carrying amount of €42 million (December 31, 2013: €37
million). These are investments in and shares of unlisted entities that were not measured using a
discounted cash flow method because the related cash flows could not be reliably measured. No
quoted market prices are available for the shares of unlisted entities as no active market exists for
these shares. The Company currently has no intention to sell these shares.
Financial instruments are divided into the following classes:
financial instruments measured at fair value,
financial instruments measured at amortized cost, and
financial instruments not falling within the scope of IFRS 7.
The following table shows the reconciliation of the balance sheet items to the relevant classes of
financial instruments, broken down by the carrying amount and fair value of the financial instruments.
The fair value of financial instruments measured at amortized cost, such as receivables and liabilities,
is calculated by discounting using a market rate of interest for a similar risk and matching maturity.
For reasons of materiality, the fair value of current balance sheet items is deemed to be the same as
their carrying amount.
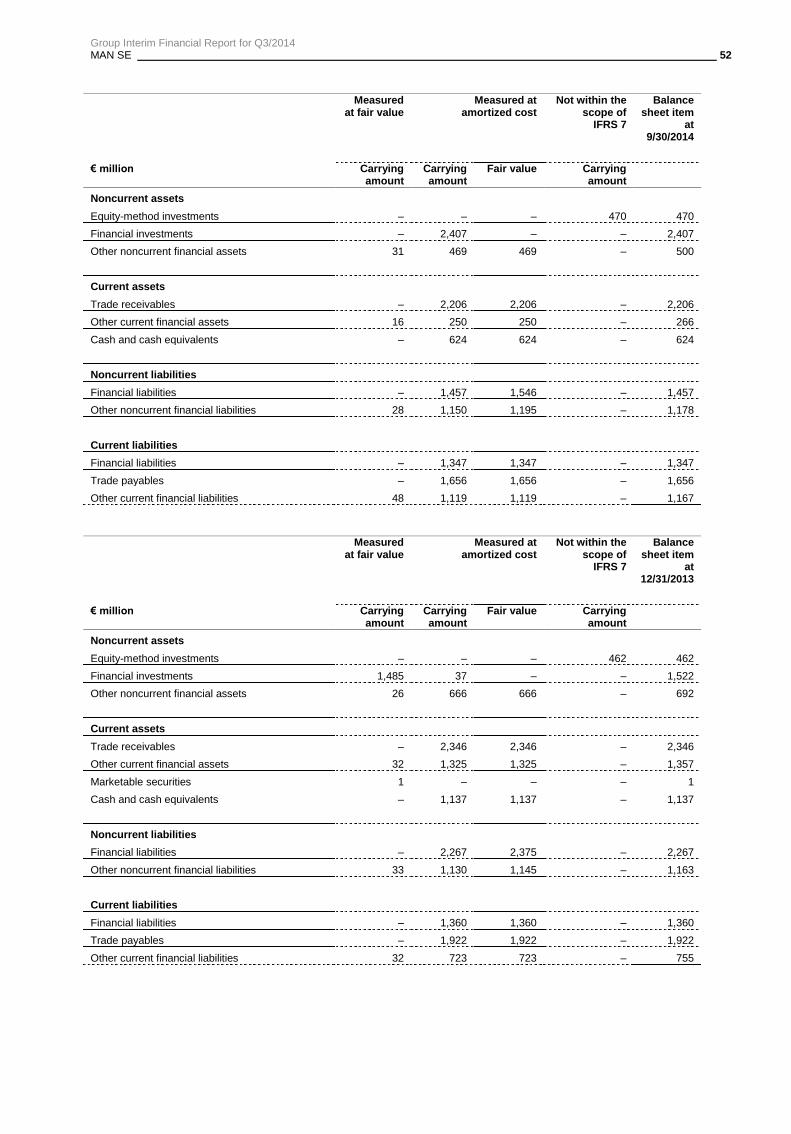
Group Interim Financial Report for Q3/2014 MAN SE 52
Measured at fair value
Measured at amortized cost
Not within the scope of
IFRS 7
Balance sheet item
at 9/30/2014
€ million Carrying amount
Carrying amount
Fair value Carrying amount
Noncurrent assets
Equity-method investments – – – 470 470
Financial investments – 2,407 – – 2,407
Other noncurrent financial assets 31 469 469 – 500
Current assets
Trade receivables – 2,206 2,206 – 2,206
Other current financial assets 16 250 250 – 266
Cash and cash equivalents – 624 624 – 624
Noncurrent liabilities
Financial liabilities – 1,457 1,546 – 1,457
Other noncurrent financial liabilities 28 1,150 1,195 – 1,178
Current liabilities
Financial liabilities – 1,347 1,347 – 1,347
Trade payables – 1,656 1,656 – 1,656
Other current financial liabilities 48 1,119 1,119 – 1,167
Measured
at fair value Measured at
amortized cost Not within the
scope of IFRS 7
Balance sheet item
at 12/31/2013
€ million Carrying amount
Carrying amount
Fair value Carrying amount
Noncurrent assets
Equity-method investments – – – 462 462
Financial investments 1,485 37 – – 1,522
Other noncurrent financial assets 26 666 666 – 692
Current assets
Trade receivables – 2,346 2,346 – 2,346
Other current financial assets 32 1,325 1,325 – 1,357
Marketable securities 1 – – – 1
Cash and cash equivalents – 1,137 1,137 – 1,137
Noncurrent liabilities
Financial liabilities – 2,267 2,375 – 2,267
Other noncurrent financial liabilities 33 1,130 1,145 – 1,163
Current liabilities
Financial liabilities – 1,360 1,360 – 1,360
Trade payables – 1,922 1,922 – 1,922
Other current financial liabilities 32 723 723 – 755

Group Interim Financial Report for Q3/2014 MAN SE 53
Related party disclosures
Following completion of the sale of MAN Finance to VWFS on January 1, 2014, MAN SE no longer
exercises any influence over MAN Finance. The relationships with MAN Finance are presented with
the relationships with other Volkswagen AG subsidiaries and equity investments that are not part of
the MAN Group. See ―Divestments‖ for further information.
There have been no other material changes in relationships with related parties compared with the
disclosures in the consolidated financial statements for the period ended December 31, 2013.
The following table shows the volume of relationships with related parties.
€ million
Reporting period January 1 to September 30
Sales and services to Purchases from and services rendered by
2014 2013 2014 2013
Truck & Bus GmbH, Volkswagen AG, and Porsche Stuttgart
1) 5 5 12 9
Other subsidiaries and equity investments of Volkswagen AG that are not part of the MAN Group 846 114 38 16
Unconsolidated subsidiaries of the MAN Group 33 33 2 1
MAN Group joint ventures and associates 126 178 141 167
1) Porsche Automobil Holding SE, Stuttgart, including its affiliated companies and related parties.
Receivables from related parties amounted to €972 million as of September 30, 2014 (December 31,
2013: €866 million). Liabilities to related parties increased in the same period from €1,510 million to
€2,279 million. This includes the share of profit/loss to which Truck & Bus GmbH is entitled; see
―Accounting policies.‖ Liabilities to MAN Finance in the amount of €1,668 million are also included.
Furthermore, customer liabilities to MAN Finance are covered by standard industry buyback
guarantees.
See ―Statement of cash flows‖ for information on the absorption of the loss for fiscal 2013 by
Truck & Bus GmbH.
On September 30, 2014, Truck & Bus GmbH, Wolfsburg (Truck & Bus GmbH), a wholly owned direct
subsidiary of Volkswagen Aktiengesellschaft, Wolfsburg, held 75.27% of MAN SE’s voting rights and
74.03% of its share capital.

Group Interim Financial Report for Q3/2014 MAN SE 54
Segment reporting
The activities of the MAN Group are classified into the following reportable segments: MAN Truck &
Bus, MAN Latin America, MAN Diesel & Turbo, and the Renk industrial subsidiary. In order to make
decisions about the allocation of resources and the assessment of performance, the results of these
segments are regularly reviewed by MAN SE’s Executive Board in its role as chief operating decision-
maker. ―Others‖ mainly comprises MAN’s Corporate Center. Companies with no operating activities
and the Scania and Sinotruk investments are allocated to the Corporate Center. Consolidation
adjustments between a business area’s segments are presented in the business area itself. Other
consolidation adjustments and the earnings effects of purchase price allocations in the event of the
acquisition of an individual segment are reported in the ―Others‖ item.
Description of the reportable segments:
MAN Truck & Bus is a leading supplier of commercial vehicles and transportation solutions and is
expanding from its core Western European market into the growth markets of Eastern Europe and
Asia.
MAN Latin America is the largest truck manufacturer in Latin America. It leads the truck market in
Brazil and is a leading supplier of commercial vehicles and bus chassis for growth markets, with one
of the most advanced production facilities worldwide for trucks and buses.
MAN Diesel & Turbo is a global leader in large-bore marine diesel engines and stationary engines
and is also one of the leading suppliers of turbomachinery on the global market.
Renk is a globally recognized manufacturer of high-quality special gear units, propulsion
components, and testing systems.
MAN’s business activities focus on two business areas: Commercial Vehicles, comprising
MAN Truck & Bus and MAN Latin America, and Power Engineering, featuring MAN Diesel & Turbo
and Renk. MAN is a leading provider in the international commercial vehicles industry and offers
customer-focused products and services worldwide. Power Engineering is MAN’s second strategic
business area and provides a suitable counterbalance to Commercial Vehicles.
Segment assets and liabilities correspond to the total assets and liabilities of the individual business
areas.

Group Interim Financial Report for Q3/2014 MAN SE 55
Since January 1, 2014, MAN has used operating profit as defined by the Volkswagen Group as the
earnings measure for calculating a segment’s results of operations. Operating profit previously
corresponded to earnings before interest and taxes (EBIT). An adjustment was made for earnings
effects from purchase price allocation and, in individual cases, for nonrecurring items. According to
the Volkswagen Group’s definition, operating profit is calculated as profit before tax and before the
financial result. As a result, net investment income in particular is no longer part of operating profit.
However, earnings effects relating to tangible and intangible assets resulting from the acquisition of
an individual segment are eliminated from the operating profit of that segment. Details on the
definition of the new earnings measure can be found in the notes to the interim consolidated financial
statements under ―Income statement disclosures.‖ The figures for the prior-year period have been
adjusted accordingly.
Net cash flow comprises cash flows from operating activities and cash flows from investing activities
attributable to operating activities.
Segment financial information is presented in accordance with the disclosure and measurement
policies applied to preparation of the interim consolidated financial statements. Sales revenues
between the segments are transacted on an arm’s length basis. Depreciation, amortization, and
impairment losses relate to the intangible assets, property, plant, and equipment, financial
investments, and assets leased out allocated to the individual divisions.
The following table contains segment-related information and a reconciliation from operating profit to
earnings before tax.

Group Interim Financial Report for Q3/2014 MAN SE 56
Segment information (1/3)
Reporting period January 1 to September 30 and as of September 30
Commercial Vehicles
MAN Truck & Bus incl. MAN Finance
3)
MAN Latin America
Commercial Vehicles1)
€ million 2014 20132) 2014 2013
2) 2014 2013
2)
Segment order intake 6,770 7,382 1,729 2,295 8,420 9,677
of which: Germany 2,122 2,328 – 1 2,122 2,329
of which: other countries 4,648 5,054 1,729 2,294 6,297 7,348
Intersegment order intake –93 –156 –8 –10 –21 –165
Group order intake 6,677 7,226 1,721 2,285 8,398 9,512
Segment sales revenue 5,931 6,460 1,729 2,295 7,586 8,755
of which: Germany 1,737 1,973 – 1 1,737 1,974
of which: other countries 4,193 4,487 1,729 2,294 5,848 6,781
Intersegment sales revenue –79 –146 –8 –10 –12 –155
Group sales revenue 5,851 6,314 1,721 2,285 7,573 8,600
Order backlog at September 30, 2014, and December 31, 2013 2,425 1,902 – – 2,415 1,902
Segment assets at September 30, 2014, and December 31, 2013 9,084 13,039 1,954 1,935 10,907 14,974
Segment liabilities at September 30, 2014, and December 31, 2013 6,647 10,175 1,085 1,137 7,596 11,312
Segment profit (operating profit) 88 92 76 153 168 245
Share of profits and losses of equity-method investments –2 –51 – – –2 –51
Net interest income and other financial result –20 –16 –48 –28 –65 –44
Profit before tax of continuing operations 67 25 28 126 102 151
of which: depreciation and amortization –507 –460 –31 –42 –534 –502
of which: impairment losses – –26 –1 – –1 –26
Net cash flow –286 –123 –80 –157 –368 –280
of which: net cash used in operating activities –119 39 –34 –110 –157 –71
of which: net cash used in investing activities attributable to operating activities –167 –162 –45 –47 –211 –209
Capital expenditures 174 174 45 55 218 229
Operating return on sales (%) 1.5 1.4 4.4 6.7 2.2 2.8
1) Consolidated presentation of business areas starting in 2014.
2) Sales revenue and operating profit were adjusted due to the retrospective application of the income statement structure used by Volkswagen,
see also ―Income statement disclosures.‖ See ―Accounting Policies‖ for an explanation of the adjustments made to the segment assets and liabilities.
3) MAN Finance was sold as of January 1, 2014. See ―Divestments‖ for further information.

Group Interim Financial Report for Q3/2014 MAN SE 57
Segment information (2/3)
Reporting period January 1 to September 30 and as of September 30
Power Engineering
MAN Diesel & Turbo Renk Power Engineering
1)
€ million 2014 20132) 2014 2013
2) 2014 2013
2)
Segment order intake 2,440 2,281 321 421 2,749 2,701
of which: Germany 216 261 79 168 289 429
of which: other countries 2,224 2,020 243 253 2,460 2,273
Intersegment order intake –2 –3 –12 –18 –1 –20
Group order intake 2,438 2,278 310 403 2,748 2,681
Segment sales revenue 2,309 2,410 347 350 2,642 2,760
of which: Germany 229 212 120 116 342 328
of which: other countries 2,080 2,198 226 234 2,300 2,432
Intersegment sales revenue –3 –2 –12 –18 –2 –20
Group sales revenue 2,306 2,408 334 332 2,640 2,740
Order backlog at September 30, 2014, and December 31, 2013 3,383 3,245 616 648 3,991 3,893
Segment assets at September 30, 2014, and December 31, 2013 3,641 3,691 585 581 4,221 4,268
Segment liabilities at September 30, 2014, and December 31, 2013 2,286 2,284 271 278 2,551 2,559
Segment profit or loss (operating profit or loss) 147 –138 50 47 197 –91
Share of profits and losses of equity-method investments 4 4 – – 4 4
Net interest income and other financial result –4 –2 0 0 –4 –1
Profit/loss before tax of continuing operations 148 –135 50 47 197 –88
of which: depreciation and amortization –65 –61 –12 –12 –76 –73
of which: impairment losses – –4 – – – –4
Net cash flow –99 –254 5 46 –90 –208
of which: net cash provided by/used in operating activities –14 –178 17 61 3 –117
of which: net cash used in investing activities attributable to operating activities –84 –76 –12 –15 –93 –91
Capital expenditures 85 77 12 15 98 92
Operating return on sales (%) 6.4 –5.7 14.3 13.4 7.5 –3.3
1) Consolidated presentation of business areas starting in 2014.
2) Sales revenue and operating profit were adjusted due to the retrospective application of the income statement structure used by Volkswagen,
see also ―Income statement disclosures.‖ See ―Accounting Policies‖ for an explanation of the adjustments made to the segment assets and liabilities.

Group Interim Financial Report for Q3/2014 MAN SE 58
Segment information (3/3)
Reporting period January 1 to September 30 and as of September 30
Others Group
Corporate Center
2) Cons./Reconcil. Total
€ million 2014 20131) 2014 2013
1) 2014 2013
1) 2014 2013
1)
Segment order intake 13 12 –35 –196 –22 –184 11,147 12,195
of which: Germany 12 12 –13 –24 –1 –12 2,411 2,745
of which: other countries 1 – –22 –172 –21 –172 8,736 9,450
Intersegment order intake –12 –10 35 196 23 186 – –
Group order intake 1 2 – – 1 2 11,147 12,195
Segment sales revenue 13 12 –26 –186 –13 –174 10,214 11,341
of which: Germany 12 12 –13 –26 –1 –14 2,079 2,288
of which: other countries 1 – –13 –160 –12 –160 8,135 9,053
Intersegment sales revenue –12 –10 26 186 14 176 – –
Group sales revenue 1 2 – – 1 2 10,214 11,341
Order backlog at September 30, 2014, and December 31, 2013 – – –12 –19 –12 –19 6,394 5,776
Segment assets at September 30, 2014, and December 31, 2013 7,498 5,321 –4,120 –2,026 3,379 3,295 18,506 22,537
Segment liabilities at September 30, 2014, and December 31, 2013 4,335 6,074 –1,777 –2,635 2,558 3,439 12,705 17,310
Segment profit or loss (operating profit or loss) –24 –66 –37 –52 –61 –119 304 36
Share of profits and losses of equity-method investments 12 4 2 2 14 6 16 –41
Net interest income and other financial result 55 –8 –103 5 –48 –3 –117 –48
Profit/loss before tax of continuing operations 43 –70 –139 –46 –96 –116 203 –53
of which: depreciation and amortization –6 –6 –37 –55 –42 –61 –653 –636
of which: impairment losses 0 0 – – 0 0 –1 –30
Net cash flow –513 –72 –20 –24 –534 –96 –992 –584
of which: net cash provided by/used in operating activities –1,000 –67 52 –26 –948 –93 –1,102 –281
of which: net cash provided by/used in investing activities attributable to operating activities 487 –5 –73 2 414 –3 110 –303
Capital expenditures 7 7 –1 –10 7 –3 323 318
Operating return on sales (%) – – – – – – 3.0 0.3
1) Sales revenue and operating profit were adjusted due to the retrospective application of the income statement structure used by Volkswagen,
see also ―Income statement disclosures.‖ See ―Accounting Policies‖ for an explanation of the adjustments made to the segment assets and liabilities.
2) Corporate Center: MAN SE, Shared Services, and holding companies.

Group Interim Financial Report for Q3/2014 MAN SE 59
Executive Board
Dr. René Umlauft left the Executive Board of MAN SE effective the end of August 31, 2014, due to the
regular end of his term of office.
Munich, October 22, 2014
MAN SE
The Executive Board

Group Interim Financial Report for Q3/2014 MAN SE 60
Overview by Quarter (1/3) 2014 2013
€ million Q1-Q3 Q3 Q2 Q1 Total 2013 Q4 Q3 Q2 Q1
Order intake by division2)
MAN Truck & Bus 6,770 2,114 2,390 2,267 9,551 2,169 2,797 2,392 2,194
MAN Latin America 1,729 534 625 570 2,955 660 719 754 822
Commercial Vehicles1) 8,420 2,636 2,984 2,800 12,506 2,829 3,516 3,146 3,015
MAN Diesel & Turbo 2,440 753 901 786 3,407 1,126 679 874 727
Renk 321 95 102 125 504 83 184 121 116
Power Engineering1) 2,749 843 1,001 905 3,911 1,209 863 995 843
Others –22 –6 –9 –6 –211 –27 –31 –102 –52
Order intake 11,147 3,473 3,976 3,699 16,207 4,012 4,349 4,039 3,806
Commercial Vehicles order intake (units)
1) 89,627 26,981 32,874 29,772 139,271 30,971 41,072 34,054 33,174
MAN Truck & Bus 55,050 16,196 20,657 18,197 78,914 16,403 25,584 18,838 18,089
MAN Latin America 36,168 10,971 12,806 12,391 60,357 14,568 15,488 15,216 15,085
Intersegment order intake –1,591 –186 –589 –816 –1,528 –206 –310 –467 –545
Group order intake 89,627 26,981 32,874 29,772 137,743 30,765 40,762 33,587 32,629
Sales revenue by division2)
MAN Truck & Bus 5,931 2,017 2,131 1,782 9,251 2,791 2,114 2,404 1,942
MAN Latin America 1,729 534 625 570 2,955 660 719 754 822
Commercial Vehicles1) 7,586 2,514 2,735 2,336 12,207 3,452 2,833 3,158 2,764
MAN Diesel & Turbo 2,309 883 726 700 3,390 980 795 872 743
Renk 347 130 108 108 485 135 125 103 123
Power Engineering1) 2,642 1,008 830 804 3,875 1,115 919 975 865
Others –13 –7 –4 –2 –221 –47 –41 –98 –36
Sales revenue 10,214 3,515 3,561 3,138 15,861 4,520 3,712 4,036 3,594
Commercial Vehicles unit sales (units)1) 85,678 28,043 31,249 26,386 141,919 42,898 33,471 34,752 30,798
MAN Truck & Bus 50,987 17,894 18,827 14,266 81,562 28,330 17,983 19,536 15,713
MAN Latin America 36,168 10,971 12,806 12,391 60,357 14,568 15,488 15,216 15,085
Intersegment sales –1,477 –822 –384 –271 –1,586 –447 –442 –371 –326
Group sales 85,678 28,043 31,249 26,386 140,333 42,451 33,029 34,381 30,472
Order backlog3) 6,394 6,394 6,583 6,297 5,776 5,776 6,710 6,184 6,169
Commercial Vehicles production (units)
1) 87,830 28,906 29,367 29,557 142,517 37,834 36,662 35,941 32,080
MAN Truck & Bus 53,390 17,980 19,961 15,449 81,193 26,000 19,671 19,085 16,437
MAN Latin America 35,924 11,387 10,063 14,474 61,324 11,834 16,991 16,856 15,643
Intersegment production –1,484 –461 –657 –366 –1,306 –308 –393 –307 –298
Group production 87,830 28,906 29,367 29,557 141,211 37,526 36,269 35,634 31,782
1) Consolidated presentation of business areas starting in 2014.
2) 2013: Adjusted to reflect the retrospective application of the income statement structure used by Volkswagen, see also ―Income statement disclosures.‖
3) As of the reporting date.
This information is reported on a voluntary basis.

Group Interim Financial Report for Q3/2014 MAN SE 61
Overview by Quarter (2/3)
2014 2013
€ million Q1-Q3 Q3 Q2 Q1 Total 2013 Q4 Q3 Q2 Q1
Operating profit/loss by division2)
MAN Truck & Bus 88 9 68 11 244 152 48 66 –22
MAN Latin America 76 9 36 32 220 67 50 45 59
Commercial Vehicles1) 168 18 107 42 464 219 98 111 37
MAN Diesel & Turbo 147 59 55 33 –41 97 84 –104 –118
Renk 50 24 12 14 66 19 19 11 17
Power Engineering1) 197 83 67 47 25 116 104 –93 –101
Others –61 –20 –20 –21 –180 –62 –42 –44 –34
Operating profit/loss 304 82 154 68 309 273 159 –26 –98
Financial result –101 –37 –39 –26 –137 –48 –82 39 –46
Profit/loss before tax 203 45 116 42 172 225 77 14 –144
Income tax expense –85 –19 –52 –14 –377 –138 9 –55 –193
Loss from discontinued operations, net of tax – – – – –308 –4 –304 – –
Profit/loss after tax 118 26 63 28 –513 83 –218 –41 –337
Operating return on sales (%) 3.0 2.3 4.3 2.2 1.9 6.0 4.3 –0.6 –2.7
MAN Truck & Bus 1.5 0.4 3.2 0.6 2.6 5.4 2.3 2.7 –1.1
MAN Latin America 4.4 1.6 5.7 5.5 7.4 10.1 6.9 6.0 7.1
Commercial Vehicles1) 2.2 0.7 3.9 1.8 3.8 6.3 3.5 3.5 1.3
MAN Diesel & Turbo 6.4 6.7 7.5 4.8 –1.2 9.9 10.6 –11.9 –15.9
Renk 14.3 18.4 11.0 12.8 13.5 14.0 15.6 10.2 13.8
Power Engineering1)
7.5 8.3 8.0 5.9 0.6 10.4 11.3 –9.6 –11.7
1) Consolidated presentation of business areas starting in 2014.
2) 2013: Adjusted to reflect the retrospective application of the income statement structure used by Volkswagen, see also ―Income statement disclosures.‖
This information is reported on a voluntary basis.

Group Interim Financial Report for Q3/2014 MAN SE 62
Overview by Quarter (3/3)
2014 2013
€ million Q1-Q3 Q3 Q2 Q1 Total 2013 Q4 Q3 Q2 Q1
Gross cash flow1) 101 –74 215 –40 986 429 358 193 6
Net cash provided by/used in operating activities –1,102 –194 –220 –688 136 417 254 –385 –150
Net cash provided by/used in investing activities attributable to operating activities 110 –115 –113 338 –526 –223 –100 –118 –85
Net cash flow –992 –308 –333 –350 –390 194 154 –503 –235
Net financial debt2) –1,517 –1,517 –1,225 –864 –1,315 –1,315 –4,641 –4,797 –4,152
ROCE (%)
3) 6.3 4.9 8.9 5.3 6.9 17.4 11.0 4.1 –4.7
ROS (%)3)
3.4 2.7 4.5 3.0 3.0 6.7 5.2 1.8 –2.3
Headcount2) 4)
55,983 55,983 55,480 55,462 56,102 56,102 56,178 55,455 55,896
Capital markets information
Earnings per share from continuing operations (€) 0.74 0.15 0.42 0.17 –1.47 0.57 0.56 –0.29 –2.31
MAN share price5)
High 93.80 90.80 93.30 93.80 89.74 89.72 88.14 86.51 89.74
Low 87.99 87.99 89.75 89.25 82.35 88.02 84.00 83.76 82.35
Quarter-end 89.10 89.10 90.25 92.50 89.25 89.25 88.14 83.90 83.87
MAN share performance (%)
Performance of MAN shares –0.2 –1.3 –2.4 3.6 10.5 1.3 5.1 0.0 3.9
Dax performance –0.8 –3.6 2.9 0.0 25.5 11.1 8.0 2.1 2.4
MDax performance –3.5 –4.9 2.1 –0.7 39.1 10.2 9.7 2.9 11.8
1) Gross cash flow is presented in accordance with the new statement of cash flows presentation. See ―Statement of cash flows‖ in the notes to the
condensed interim consolidated financial statements for further information 2)
As of the reporting date. 3) For the actual ROCE and ROS values, operating profit is compared with the average capital employed — in accordance with the methodology applied to
date — with the previous income statement structure used to determine operating profit. 4) Including employees in the passive phase of partial retirement and trainees, excluding subcontracted employees. The prior-year figures were adjusted
accordingly. 5)
Xetra closing prices, Frankfurt.
This information is reported on a voluntary basis.

Group Interim Financial Report for Q3/2014
MAN SE 63
MAN SE Financial Diary*
Annual press conference March 11, 2015
Internet publication of annual report March 11, 2015
Report on Q1/2015 April 28, 2015
Annual General Meeting for fiscal 2014, Hanover May 6, 2015
Half-yearly report 2015 July 28, 2015
Report on Q3/2015 October 27, 2015
*The latest information can be found on MAN’s website at www.man.eu/corporate under ―Investor Relations‖
MAN SE Ungererstr. 69 80805 Munich, Germany www.man.eu

This is a translation of the German original. In the event of discrepancies between the German language version and any translation thereof, the German language version will prevail.
MAN SEUngererstr. 6980805 MunichPhone: +49 89 36098-0Fax: +49 89 36098-250www.man.eu