Embed Size (px)
Citation preview
Q3 2016 Third Quarter Report
Financial and Operating Highlights2016 2015 2016 2015
Financial ($000, except as otherwise indicated)Sales including realized hedging 56,697$ 44,980$ 143,937$ 122,400$ Funds from operations 45,132$ 34,474$ 112,251$ 91,974$
per share (1) 0.24$ 0.20$ 0.62$ 0.54$ Total capital expenditures 35,640$ 39,234$ 97,971$ 137,379$ Working capital deficit (2) 5,023$ 12,273$ 5,023$ 12,273$ Bank indebtedness 178,971$ 285,707$ 178,971$ 285,707$ Basic weighted average shares (000) 184,572 170,715 181,188 170,563 OperatingDaily Production
Natural gas (mcf/d) 207,332 147,574 191,970 135,104 Liquids (bbls/d) 1,205 212 903 146 Total mcfe/d (3) 214,562 148,846 197,388 135,980 Total boe/d (3) 35,760 24,808 32,898 22,663
Average prices (including hedging)Natural gas ($/mcf) 2.71$ 3.25$ 2.52$ 3.27$ Liquids ($/bbl) 45.58$ 45.43$ 46.19$ 45.16$
Cash netbacks ($/mcfe) (3)
Natural gas and liquids sales 2.27$ 2.70$ 1.80$ 2.65$ Realized gains on derivatives 0.60 0.58 0.86 0.65 Royalty expense (0.08) (0.12) (0.02) (0.12) Operating expense (0.25) (0.36) (0.29) (0.36) Transportation expense (0.05) - (0.03) -
Operating netback 2.49 2.80 2.32 2.82 General and administrative (0.09) (0.11) (0.11) (0.15) Finance expense (0.11) (0.20) (0.14) (0.20) Other income - 0.02 0.01 0.01
Cash netbacks 2.29$ 2.51$ 2.08$ 2.48$
(1) Based on basic weighted average shares outstanding.
(2) Working capital deficit includes trade and other receivables, prepaid expenses and deposits, and trade and other accrued liabilities.
(3) A boe and mcfe conversion ratio has been calculated using a conversion rate of six thousand cubic feet of natural gas equivalent to
one barrel of liquids.
Three months ended Nine months endedSeptember 30 September 30
Advantage Oil & Gas Ltd. - 2
MESSAGE TO SHAREHOLDERS
44% Production Growth & 27% Reduction in Total Corporate Cash Costs Drives Surplus
Cash Flow
Advantage Oil & Gas Ltd. (“Advantage” or the “Corporation”) is pleased to report that the Corporation’s strategy to maintain a profitable and sustainable growth plan is demonstrated by its third quarter 2016 production per share and cash flow per share increases of 33% and 20%, respectively, while reducing Advantage’s total debt by 37% since year-end 2015. Advantage’s continued production growth with further improvements in its industry leading capital and operating efficiencies have generated year-to-date surplus cash flow of $14 million (funds from operations net of capital expenditures) including $9 million in the third quarter of 2016. The surplus cash flow has further reduced the Corporation’s total debt to $184 million at the end of the third quarter of 2016, down from $294 million at year-end 2015. These accomplishments were achieved despite a 20% reduction in the average AECO daily natural gas price to Cdn $2.32/mcf compared to Cdn $2.90/mcf in the same period of 2015. Advantage estimates its annual surplus cash flow could grow to approximately $36 million by year-end 2016 based on current commodity prices, resulting in an estimated year-end 2016 total debt-to-trailing cash flow ratio of 1.0 times.
During the third quarter of 2016, production increased 44% to 215 mmcfe/d (35,760 boe/d) and total corporate cash costs were reduced 27% to $0.58/mcfe ($3.48/boe) which helped drive cash flow up 31% to $45.1 million ($0.24/share) as compared to the third quarter of 2015. Advantage’s cash flow was also supported by realized hedging gains of $11.9 million during the third quarter of 2016.
Advantage’s focus on operational excellence demonstrated by production outperformance of its Glacier Montney wells (please refer to our operational update released on October 12, 2016) and continued cost reductions further reinforces the Corporation’s solid foundation for Advantage’s announced expansion of its 100% owned Glacier gas plant to 350 mmcf/d (58,330 boe/d). Advantage anticipates disclosing development plan details for the 2017 to 2019 period before year-end 2016.
Advantage Oil & Gas Ltd. - 3
Third Quarter 2016 Operating and Financial Highlights
Production increased 44% to average 215 mmcfe/d (35,760 boe/d) including 468% growth in natural gas liquids to 1,205 bbls/d for the third quarter of 2016 as compared to the same period in 2015. The Corporation’s 2016 annual production is expected to be within our previously announced Budget production guidance range of 190 to 210 mmcfe/d generating a year-on-year production growth of approximately 40% or 34% on a per share basis. Liquids production is expected to remain flat to slightly lower in the fourth quarter due to Pembina Pipeline Corporation’s maintenance work in October 2016.
Cash flow (Funds from Operations) for the third quarter of 2016 was up 31% to $45.1 million or 20% on a per share basis to $0.24 per share. Cash netbacks for the three months ended September 30, 2016 were $2.29/mcfe ($13.74/boe) which represents 80% of the realized sales price, including hedging. Excluding hedging, positive cash flow of $33.2 million was realized on an average AECO daily natural gas price of Cdn $2.32/mcf demonstrating the economic resilience of Advantage’s Montney development.
Total corporate cash costs were reduced to a record low of $0.58/mcfe in the third quarter of 2016 which is a 27% decrease compared to the same period of 2015. Total corporate cash costs includes royalties ($0.08/mcfe), operating costs ($0.25/mcfe), liquids transportation ($0.05/mcfe), cash general and administrative ($0.09/mcfe), and cash finance expense ($0.11/mcfe). Liquids transportation costs were up slightly during the third quarter of 2016 due to additional trucking costs resulting from wet weather conditions which are extending into the fourth quarter of 2016.
Total capital expenditures during the quarter were on-track at $36 million. Drilling operations resumed during the quarter on a six well pad, with five of these wells rig released at the end of the third quarter of 2016. As communicated in Advantage’s October 12, 2016 operational update, eight previously drilled wells were completed and production tested in the third quarter of 2016. The remaining capital activity in the third quarter was invested in expanding our plant utilities for future processing capacity growth. A 16 well pad commenced drilling during the fourth quarter of 2016 with well completions planned to start on this pad by mid-year 2017. Wet weather conditions have delayed recent drilling and completions activities; however, Advantage anticipates minimal impacts to our fourth quarter 2016 plans.
Total debt (including working capital deficit) as of September 30, 2016 was $184 million or 46% drawn against Advantage’s $400 million borrowing base Credit Facility. Third quarter cash flow exceeded capital expenditures by $9.5 million and resulted in a decrease in bank debt. Advantage estimates approximately $36 million of surplus cash flow could be realized for calendar 2016 resulting in a year-end 2016 total debt-to-trailing cash flow of approximately 1.0x based on current commodity prices for the balance of 2016.
Natural gas hedge positions extended into 2019. Advantage’s hedging positions include an average 48% of forecast production for the fourth quarter of 2016 at an average AECO floor price of $3.56/mcf, 45% of forecast 2017 annual production at an average AECO floor price of $3.19/mcf, 22% of forecast 2018 annual production at an average AECO floor price of $3.02/mcf and 18% of forecast production for the first quarter of 2019 at an average AECO floor price of $3.00/mcf.
Advantage Oil & Gas Ltd. - 4
Advisory The information in this report contains certain forward-looking statements, including within the meaning of the United States Private Securities Litigation Reform Act of 1995. These statements relate to future events or our future intentions or performance. All statements other than statements of historical fact may be forward-looking statements. Forward-looking statements are often, but not always, identified by the use of words such as “seek”, “anticipate”, “plan”, “continue”, “estimate”, “guidance”, “demonstrate”, “expect”, “may”, “can”, “will”, “project”, “predict”, “potential”, “target”, “intend”, “could”, “might”, “should”, “believe”, “would” and similar expressions and include statements relating to, among other things; the Corporation’s expectation that its 2016 annual production will be within its previously announced budget production guidance range; the Corporation’s expectation that liquids production will remain flat or slightly lower in the fourth quarter of 2016; Advantage’s drilling plans, including timing of commencing drilling on a 16 well pad and anticipated timing of completions starting on such pad; Advantage’s estimated year-end 2016 total net debt to trailing cash flow and anticipated annual surplus cash flow; the Corporation's hedging arrangements; anticipated timing of disclosing Advantage’s development plan for the 2017 to 2019 period; and other matters. Advantage’s actual decisions, activities, results, performance or achievement could differ materially from those expressed in, or implied by, such forward-looking statements and accordingly, no assurances can be given that any of the events anticipated by the forward-looking statements will transpire or occur or, if any of them do, what benefits that Advantage will derive from them.
These statements involve substantial known and unknown risks and uncertainties, certain of which are beyond Advantage’s control, including, but not limited to: changes in general economic, market and business conditions; industry conditions; impact of significant declines in market prices for oil and natural gas; actions by governmental or regulatory authorities including increasing taxes and changes in investment or other regulations; changes in tax laws, royalty regimes and incentive programs relating to the oil and gas industry; the effect of acquisitions; Advantage's success at acquisition, exploitation and development of reserves; unexpected drilling results; changes in commodity prices, currency exchange rates, capital expenditures, reserves or reserves estimates and debt service requirements; the occurrence of unexpected events involved in the exploration for, and the operation and development of, oil and gas properties, including hazards such as fire, explosion, blowouts, cratering, and spills, each of which could result in substantial damage to wells, production facilities, other property and the environment or in personal injury; changes or fluctuations in production levels; delays in anticipated timing of drilling and completion of wells; delays in completion of the expansion of the Glacier gas plant; lack of available capacity on pipelines; individual well productivity; competition from other producers; the lack of availability of qualified personnel or management; credit risk; changes in laws and regulations including the adoption of new environmental laws and regulations and changes in how they are interpreted and enforced; Advantage's ability to comply with current and future environmental or other laws; stock market volatility and market valuations; liabilities inherent in oil and natural gas operations; uncertainties associated with estimating oil and natural gas reserves; competition for, among other things, capital, acquisitions of reserves, undeveloped lands and skilled personnel; incorrect assessments of the value of acquisitions; geological, technical, drilling and processing problems and other difficulties in producing petroleum reserves; ability to obtain required approvals of regulatory authorities; and ability to access sufficient capital from internal and external sources. Many of these risks and uncertainties and additional risk factors are described in the Corporation’s Annual Information Form which is available at www.Sedar.com and www.advantageog.com. Readers are also referred to risk factors described in other documents Advantage files with Canadian securities authorities.
With respect to forward-looking statements contained in this report, Advantage has made assumptions regarding, but not limited to: conditions in general economic and financial markets; effects of regulation by governmental agencies; current and future commodity prices and royalty regimes; future exchange rates; royalty rates; future operating costs; availability of skilled labor; availability of drilling and related equipment; timing and amount of capital expenditures; the impact of increasing competition; the price of crude oil and natural gas; that the Corporation will have sufficient cash flow, debt or equity sources or other financial resources required to fund its capital and operating expenditures and requirements as needed; that the Corporation’s conduct and results of operations will be consistent with its expectations; that the Corporation will have the ability to develop the Corporation’s properties in the manner currently contemplated; available pipeline capacity; that the Corporation will be able to complete the expansion and increase capacity at the Glacier gas plant; that Advantage's production will increase; current or, where applicable, proposed assumed industry conditions, laws and regulations will continue in effect or as anticipated; and the estimates of the Corporation’s production and reserves volumes and the assumptions related thereto (including commodity prices and development costs) are accurate in all material respects. Production estimates contained herein for the year ended December 31, 2016 are expressed as anticipated average production over the calendar year. In determining anticipated production for the year ended December 31, 2016, Advantage considered historical drilling, completion and production results for prior years and took into account the estimated impact on production of the Corporation's 2016 expected drilling and completion activities. Advantage has also assumed TCPL's northwest Alberta pipeline restrictions and maintenance activity level will result in minimal firm service restrictions and frequent interruptible service availability during the second half of 2016 based on the most recent information available.
Management has included the above summary of assumptions and risks related to forward-looking information provided above and in its continuous disclosure documents filed on Sedar in order to provide shareholders with a more complete perspective on Advantage's future operations and such information may not be appropriate for other purposes. Advantage’s actual results, performance or achievement could differ materially from those expressed in, or implied by, these forward-looking statements and, accordingly, no assurance can be given that any of the events anticipated by the forward-looking statements will transpire or occur, or if any of them do so, what benefits that Advantage will derive there from. Readers are cautioned that the foregoing lists of factors are not exhaustive. Forward-looking statements contained herein are made as of the date of this report and Advantage disclaims any intent or obligation to update publicly any forward-looking statements, whether as a result of new information, future events or results or otherwise, other than as required by applicable securities laws.
This report contains certain oil and gas metrics, including cash netbacks and operating netbacks, which do not have standardized meanings or standard methods of calculation and therefore such measures may not be comparable to similar measures used by other companies and should
Advantage Oil & Gas Ltd. - 5
not be used to make comparisons. Such metrics have been included herein to provide readers with additional measures to evaluate the Corporation's performance; however, such measures are not reliable indicators of the future performance of the Corporation and future performance may not compare to the performance in previous periods and therefore such metrics should not be unduly relied upon.
Barrels of oil equivalent (boe) and thousand cubic feet of natural gas equivalent (mcfe) may be misleading, particularly if used in isolation. Boe and mcfe conversion ratios have been calculated using a conversion rate of six thousand cubic feet of natural gas equivalent to one barrel of oil. A boe and mcfe conversion ratio of 6 mcf: 1 bbl is based on an energy equivalency conversion method primarily applicable at the burner tip and does not represent a value equivalency at the wellhead. Given that the value ratio based on the current price of crude oil as compared to natural gas is significantly different from the energy equivalency of 6:1, utilizing a conversion on a 6:1 basis may be misleading as an indication of value.
The Corporation discloses several financial measures that do not have any standardized meaning prescribed under International Financial Reporting Standards ("IFRS"). These financial measures include funds from operations, cash netbacks, operating netbacks, surplus cash flow and total debt to cash flow ratio. Funds from operations is based on cash provided by operating activities, before expenditures on decommissioning liability and changes in non-cash working capital, reduced for finance expense excluding accretion. Cash netbacks are dependent on the determination of funds from operations and include the primary cash sales and expenses on a per mcfe basis that comprise funds from operations. Surplus cash flow represents the amount by which funds from operations exceeds net capital expenditures. Total debt to cash flow ratio is calculated as indebtedness under the Corporation's credit facilities plus working capital deficit (surplus) divided by funds from operations for the prior twelve month period. Management believes that these financial measures are useful supplemental information to analyze operating performance and provide an indication of the results generated by the Corporation’s principal business activities. Investors should be cautioned that these measures should not be construed as an alternative to net income or other measures of financial performance as determined in accordance with IFRS. Advantage’s method of calculating these measures may differ from other companies, and accordingly, they may not be comparable to similar measures used by other companies. Please see the Corporation’s most recent Management’s Discussion and Analysis, which is available at www.sedar.com and www.advantageog.com for additional information about these financial measures, including a reconciliation of funds from operations to cash provided by operating activities.
This report and, in particular the information in respect of the Corporation's prospective surplus cash flow and total debt to cash flow ratio, may contain future oriented financial information ("FOFI") within the meaning of applicable securities laws. The FOFI has been prepared by management to provide an outlook of the Corporation's activities and results and may not be appropriate for other purposes. The FOFI has been prepared based on a number of assumptions including the assumptions discussed above. The actual results of operations of the Corporation and the resulting financial results may vary from the amounts set forth herein, and such variations may be material. The Corporation and management believe that the FOFI has been prepared on a reasonable basis, reflecting management’s best estimates and judgments. FOFI contained in this report was made as of the date of this report and the Corporation disclaims any intention or obligations to update or revise any FOFI contained in this report, whether as a result of new information, future events or otherwise, unless required pursuant to applicable law.
The following abbreviations used in this report have the meanings set forth below:
boe barrels of oil equivalent of natural gas, on the basis of one barrel of oil or NGLs for six thousand cubic feet of natural gas boe/d barrels of oil equivalent per day mcf thousand cubic feet mcfe thousand cubic feet equivalent on the basis of six thousand cubic feet of natural gas for one barrel of oil or NGLs mmcf million cubic feet mmcf/d million cubic feet per day mmcfe million cubic feet equivalent mmcfe/d million cubic feet equivalent per day
Advantage Oil & Gas Ltd. - 6
CONSOLIDATED MANAGEMENT’S DISCUSSION & ANALYSIS
The following Management’s Discussion and Analysis (“MD&A”), dated as of November 3, 2016, provides a detailed explanation of the consolidated financial and operating results of Advantage Oil & Gas Ltd. (“Advantage”, the “Corporation”, “us”, “we” or “our”) for the three and nine months ended September 30, 2016 and should be read in conjunction with the unaudited consolidated financial statements for the three and nine months ended September 30, 2016 and the audited consolidated financial statements and MD&A for the year ended December 31, 2015. The consolidated financial statements have been prepared in accordance with International Financial Reporting Standards (“IFRS”), representing generally accepted accounting principles (“GAAP”) for publicly accountable enterprises in Canada. All references in the MD&A and consolidated financial statements are to Canadian dollars unless otherwise indicated. The term “boe” or barrels of oil equivalent and “mcfe” or thousand cubic feet equivalent may be misleading, particularly if used in isolation. A boe or mcfe conversion ratio of six thousand cubic feet of natural gas equivalent to one barrel of oil (6 mcf: 1 bbl) is based on an energy equivalency conversion method primarily applicable at the burner tip and does not represent a value equivalency at the wellhead. As the value ratio between natural gas and crude oil based on the current prices of natural gas and crude oil is significantly different from the energy equivalency of 6:1, utilizing a conversion on a 6:1 basis may be misleading as an indication of value.
Forward‐Looking Information and Other Advisories
This MD&A contains certain forward-looking statements, which are based on our current internal expectations, estimates, projections, assumptions and beliefs. These statements relate to future events or our future performance. All statements other than statements of historical fact may be forward-looking statements. Forward-looking statements are often, but not always, identified by the use of words such as "seek", "anticipate", "plan", "continue", "estimate", "expect", "may", "will", "project", "predict", "potential", "targeting", "intend", "could", "might", "should", "believe", "would" and similar or related expressions. These statements are not guarantees of future performance.
In particular, forward-looking statements included in this MD&A include, but are not limited to, the Corporation's expectation that annual production will be within its previously announced budget guidance; effect of commodity prices on the Corporation's financial results, condition and performance; industry conditions, including effect of changes in commodity prices, weather and general economic conditions on the crude oil and natural gas industry and demand for crude oil and natural gas; the Corporation's hedging activities; terms of the Corporation's derivative contracts, including the timing of settlement of such contracts; effect of fluctuations in commodity prices as compared to valuation assumptions on actual gains or losses realized on cash settlement of derivatives; average royalty rates and the impact of well depths, well production rates, commodity prices and gas cost allowance on average corporate royalty rates; future anticipated royalty rates; terms of the Corporation's equity compensation plans; the Corporation's expectation that it will realize lower cash finance expense in future periods of 2016; future commitments and contractual obligations; terms of the Corporation's credit facilities, including timing of the next review of the credit facilities, effect of revisions or changes in reserve estimates and commodity prices on the borrowing base, and limitations on the utilization of hedging contracts; the Corporation's expectations regarding extension of Advantage's credit facilities at each annual review; the Corporation's strategy for managing its capital structure, including the use of equity financing arrangements, share repurchases, obtaining additional financing through bank indebtedness, refinancing current debt, issuing other financial or equity-based instruments, declaring a dividend or adjusting capital spending; the timing of reviews of capital structure and forecast information by management and the Board of Directors; effect of the Corporation's continual financial assessment processes on the Corporation's ability to mitigate risks; the Corporation's belief that its annual funds from operations will exceed its planned 2016 capital program; anticipated surplus cash flow and year-end total debt to trailing funds from operations for 2016; the Corporation's ability to satisfy all liabilities and commitments, including a working capital deficit, and meet future obligations as they become due; the Corporation's plans to put additional wells on-stream and the expected timing thereof; the focus of the Corporation's capital expenditures and operations, including the Corporation's drilling plans; the Corporation's expectation that its net capital expenditures will be fully funded with funds from operations; the Corporation's intentions to monitor debt levels to ensure an optimal mix of financing and cost of capital to provide a maximum return to the Corporation's shareholders; and the statements under "critical accounting estimates" in this MD&A.
These forward-looking statements involve substantial known and unknown risks and uncertainties, many of which are beyond our control, including, but not limited to, risks related to changes in general economic, market and business conditions; continued volatility in market prices for oil and natural gas; the impact of significant declines in market prices for oil and natural gas; stock market volatility; changes to legislation and regulations and how they are interpreted and enforced; our ability to comply with current and future environmental or other laws; actions by governmental or regulatory authorities including increasing taxes, changes in investment or other regulations; changes in tax laws, royalty regimes and incentive programs relating to the oil and gas industry; the effect of acquisitions; our success at acquisition, exploitation and development of reserves; unexpected drilling results; failure to achieve production targets on timelines anticipated or at all; changes in commodity prices, currency exchange rates, capital expenditures,
Advantage Oil & Gas Ltd. - 7
reserves or reserves estimates and debt service requirements; the occurrence of unexpected events involved in the exploration for, and the operation and development of, oil and gas properties; hazards such as fire, explosion, blowouts, cratering, and spills, each of which could result in substantial damage to wells, production facilities, other property and the environment or in personal injury; changes or fluctuations in production levels; individual well productivity; delays in anticipated timing of drilling and completion of wells; lack of available capacity on pipelines; the failure to extend our credit facilities at each annual review; competition from other producers; the lack of availability of qualified personnel or management; ability to access sufficient capital from internal and external sources; credit risk; and the risks and uncertainties described in the Corporation’s Annual Information Form which is available at www.sedar.com and www.advantageog.com. Readers are also referred to risk factors described in other documents Advantage files with Canadian securities authorities.
With respect to forward-looking statements contained in this MD&A, in addition to other assumptions identified herein, Advantage has made assumptions regarding, but not limited to: current and future prices of oil and natural gas; that the current commodity price and foreign exchange environment will continue or improve; conditions in general economic and financial markets; effects of regulation by governmental agencies; receipt of required regulatory approvals; royalty regimes; future exchange rates; royalty rates; future operating costs; availability of skilled labour; availability of drilling and related equipment; timing and amount of capital expenditures; the impact of increasing competition; the price of crude oil and natural gas; that the Corporation will have sufficient cash flow, debt or equity sources or other financial resources required to fund its capital and operating expenditures and requirements as needed; that the Corporation’s conduct and results of operations will be consistent with its expectations; that the Corporation will have the ability to develop the Corporation’s crude oil and natural gas properties in the manner currently contemplated; availability of pipeline capacity; that current or, where applicable, proposed assumed industry conditions, laws and regulations will continue in effect or as anticipated as described herein; and that the estimates of the Corporation’s production, reserves and resources volumes and the assumptions related thereto (including commodity prices and development costs) are accurate in all material respects.
Management has included the above summary of assumptions and risks related to forward-looking information provided in this MD&A in order to provide shareholders with a more complete perspective on Advantage's future operations and such information may not be appropriate for other purposes. Advantage’s actual results, performance or achievement could differ materially from those expressed in, or implied by, these forward-looking statements and, accordingly, no assurance can be given that any of the events anticipated by the forward-looking statements will transpire or occur, or if any of them do so, what benefits that Advantage will derive there from. Readers are cautioned that the foregoing lists of factors are not exhaustive. These forward-looking statements are made as of the date of this MD&A and Advantage disclaims any intent or obligation to update publicly any forward-looking statements, whether as a result of new information, future events or results or otherwise, other than as required by applicable securities laws.
This MD&A and, in particular the information in respect of the Corporation's prospective annual surplus cash flow and debt to trailing cash flow, may contain future oriented financial information ("FOFI") within the meaning of applicable securities laws. The FOFI has been prepared by management to provide an outlook of the Corporation's activities and results and may not be appropriate for other purposes. The FOFI has been prepared based on a number of assumptions, including the assumptions discussed above. The actual results of operations of the Corporation and the resulting financial results may vary from the amounts set forth herein, and such variations may be material. The Corporation and management believe that the FOFI has been prepared on a reasonable basis, reflecting management’s best estimates and judgments. FOFI contained in this MD&A was made as of the date of this MD&A and the Corporation disclaims any intention or obligations to update or revise any FOFI contained in this MD&A, whether as a result of new information, future events or otherwise, unless required pursuant to applicable law.
References in this MD&A to production test rates are useful in confirming the presence of hydrocarbons, however such rates are not determinative of the rates at which such wells will commence production and decline thereafter and are not indicative of long term performance or of ultimate recovery. Additionally, such rates may also include recovered "load oil" fluids used in well completion stimulation. While encouraging, readers are cautioned not to place reliance on such rates in calculating the aggregate production for Advantage. A pressure transient analysis or well-test interpretation has not been carried out in respect of all wells. Accordingly, the Corporation cautions that the test results should be considered to be preliminary.
Advantage Oil & Gas Ltd. - 8
Non‐GAAP Measures
The Corporation discloses several financial measures in the MD&A that do not have any standardized meaning prescribed under GAAP. These financial measures include funds from operations and cash netbacks. Management believes that these financial measures are useful supplemental information to analyze operating performance and provide an indication of the results generated by the Corporation’s principal business activities. Investors should be cautioned that these measures should not be construed as an alternative to net income, comprehensive income, and cash provided by operating activities or other measures of financial performance as determined in accordance with GAAP. Advantage’s method of calculating these measures may differ from other companies, and accordingly, they may not be comparable to similar measures used by other companies.
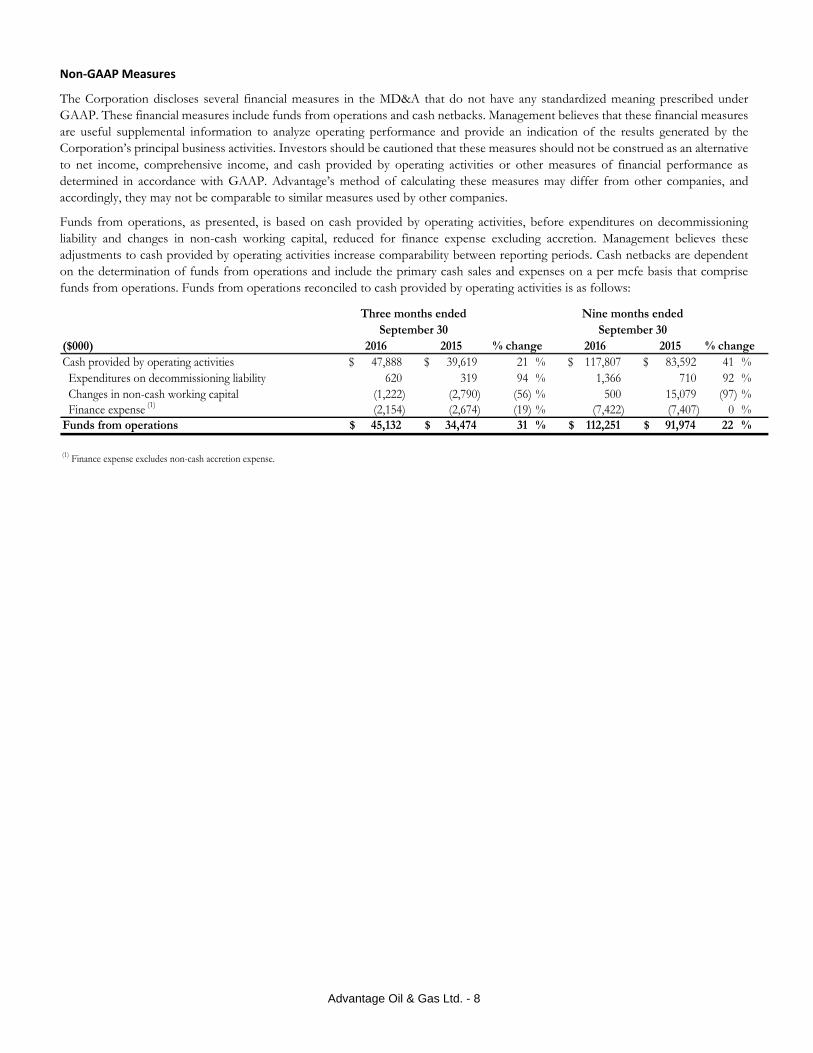
Funds from operations, as presented, is based on cash provided by operating activities, before expenditures on decommissioning liability and changes in non-cash working capital, reduced for finance expense excluding accretion. Management believes these adjustments to cash provided by operating activities increase comparability between reporting periods. Cash netbacks are dependent on the determination of funds from operations and include the primary cash sales and expenses on a per mcfe basis that comprise funds from operations. Funds from operations reconciled to cash provided by operating activities is as follows:
September 30 September 30($000) 2016 2015 2016 2015Cash provided by operating activities 47,888$ 39,619$ 21 % 117,807$ 83,592$ 41 % Expenditures on decommissioning liability 620 319 94 % 1,366 710 92 % Changes in non-cash working capital (1,222) (2,790) (56) % 500 15,079 (97) % Finance expense (1) (2,154) (2,674) (19) % (7,422) (7,407) 0 %Funds from operations 45,132$ 34,474$ 31 % 112,251$ 91,974$ 22 %
(1) Finance expense excludes non-cash accretion expense.
% change
Three months ended Nine months ended
% change
Advantage Oil & Gas Ltd. - 9
Overview
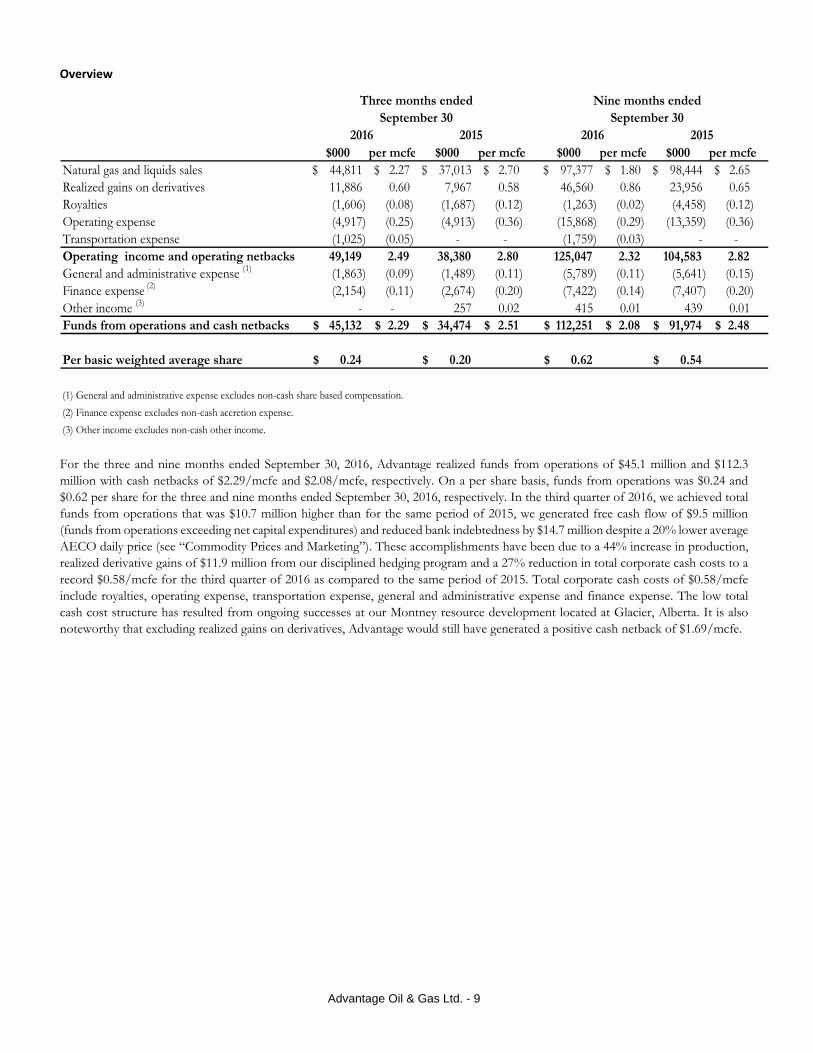
$000 per mcfe $000 per mcfe $000 per mcfe $000 per mcfeNatural gas and liquids sales 44,811$ 2.27$ 37,013$ 2.70$ 97,377$ 1.80$ 98,444$ 2.65$ Realized gains on derivatives 11,886 0.60 7,967 0.58 46,560 0.86 23,956 0.65 Royalties (1,606) (0.08) (1,687) (0.12) (1,263) (0.02) (4,458) (0.12) Operating expense (4,917) (0.25) (4,913) (0.36) (15,868) (0.29) (13,359) (0.36) Transportation expense (1,025) (0.05) - - (1,759) (0.03) - - Operating income and operating netbacks 49,149 2.49 38,380 2.80 125,047 2.32 104,583 2.82 General and administrative expense (1) (1,863) (0.09) (1,489) (0.11) (5,789) (0.11) (5,641) (0.15) Finance expense (2) (2,154) (0.11) (2,674) (0.20) (7,422) (0.14) (7,407) (0.20) Other income (3) - - 257 0.02 415 0.01 439 0.01 Funds from operations and cash netbacks 45,132$ 2.29$ 34,474$ 2.51$ 112,251$ 2.08$ 91,974$ 2.48$
Per basic weighted average share 0.24$ 0.20$ 0.62$ 0.54$
(1) General and administrative expense excludes non-cash share based compensation.
(2) Finance expense excludes non-cash accretion expense.
(3) Other income excludes non-cash other income.
Three months endedSeptember 30
Nine months endedSeptember 30
2016 2015 2016 2015
For the three and nine months ended September 30, 2016, Advantage realized funds from operations of $45.1 million and $112.3 million with cash netbacks of $2.29/mcfe and $2.08/mcfe, respectively. On a per share basis, funds from operations was $0.24 and $0.62 per share for the three and nine months ended September 30, 2016, respectively. In the third quarter of 2016, we achieved total funds from operations that was $10.7 million higher than for the same period of 2015, we generated free cash flow of $9.5 million (funds from operations exceeding net capital expenditures) and reduced bank indebtedness by $14.7 million despite a 20% lower average AECO daily price (see “Commodity Prices and Marketing”). These accomplishments have been due to a 44% increase in production, realized derivative gains of $11.9 million from our disciplined hedging program and a 27% reduction in total corporate cash costs to a record $0.58/mcfe for the third quarter of 2016 as compared to the same period of 2015. Total corporate cash costs of $0.58/mcfe include royalties, operating expense, transportation expense, general and administrative expense and finance expense. The low total cash cost structure has resulted from ongoing successes at our Montney resource development located at Glacier, Alberta. It is also noteworthy that excluding realized gains on derivatives, Advantage would still have generated a positive cash netback of $1.69/mcfe.
Advantage Oil & Gas Ltd. - 10
Natural Gas and Liquids Sales and Hedging
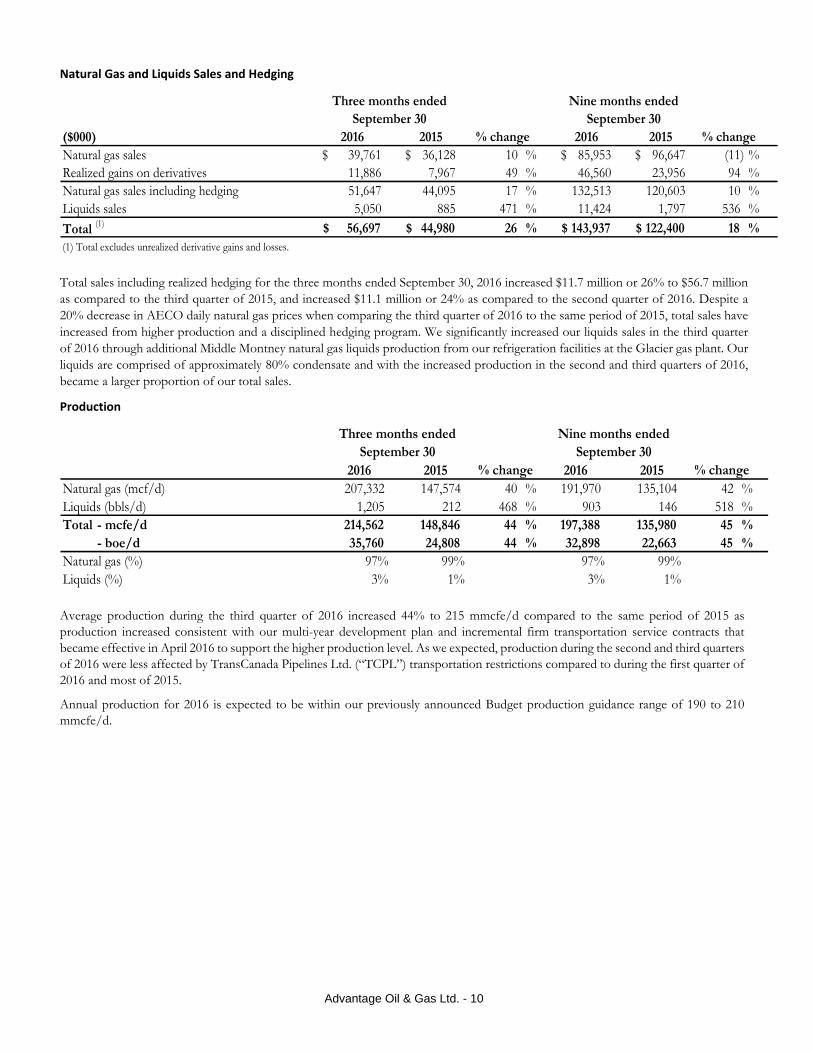
($000) 2016 2015 2016 2015Natural gas sales 39,761$ 36,128$ 10 % 85,953$ 96,647$ (11) %Realized gains on derivatives 11,886 7,967 49 % 46,560 23,956 94 %Natural gas sales including hedging 51,647 44,095 17 % 132,513 120,603 10 %Liquids sales 5,050 885 471 % 11,424 1,797 536 %
Total (1) 56,697$ 44,980$ 26 % 143,937$ 122,400$ 18 %(1) Total excludes unrealized derivative gains and losses.
% change % change
Three months endedSeptember 30
Nine months endedSeptember 30
Total sales including realized hedging for the three months ended September 30, 2016 increased $11.7 million or 26% to $56.7 million as compared to the third quarter of 2015, and increased $11.1 million or 24% as compared to the second quarter of 2016. Despite a 20% decrease in AECO daily natural gas prices when comparing the third quarter of 2016 to the same period of 2015, total sales have increased from higher production and a disciplined hedging program. We significantly increased our liquids sales in the third quarter of 2016 through additional Middle Montney natural gas liquids production from our refrigeration facilities at the Glacier gas plant. Our liquids are comprised of approximately 80% condensate and with the increased production in the second and third quarters of 2016, became a larger proportion of our total sales.
Production
2016 2015 2016 2015Natural gas (mcf/d) 207,332 147,574 40 % 191,970 135,104 42 %Liquids (bbls/d) 1,205 212 468 % 903 146 518 %Total - mcfe/d 214,562 148,846 44 % 197,388 135,980 45 %
- boe/d 35,760 24,808 44 % 32,898 22,663 45 %Natural gas (%) 97% 99% 97% 99%Liquids (%) 3% 1% 3% 1%
% change % change
Three months endedSeptember 30
Nine months endedSeptember 30
Average production during the third quarter of 2016 increased 44% to 215 mmcfe/d compared to the same period of 2015 as production increased consistent with our multi-year development plan and incremental firm transportation service contracts that became effective in April 2016 to support the higher production level. As we expected, production during the second and third quarters of 2016 were less affected by TransCanada Pipelines Ltd. (“TCPL”) transportation restrictions compared to during the first quarter of 2016 and most of 2015.
Annual production for 2016 is expected to be within our previously announced Budget production guidance range of 190 to 210 mmcfe/d.
Advantage Oil & Gas Ltd. - 11
Commodity Prices and Marketing
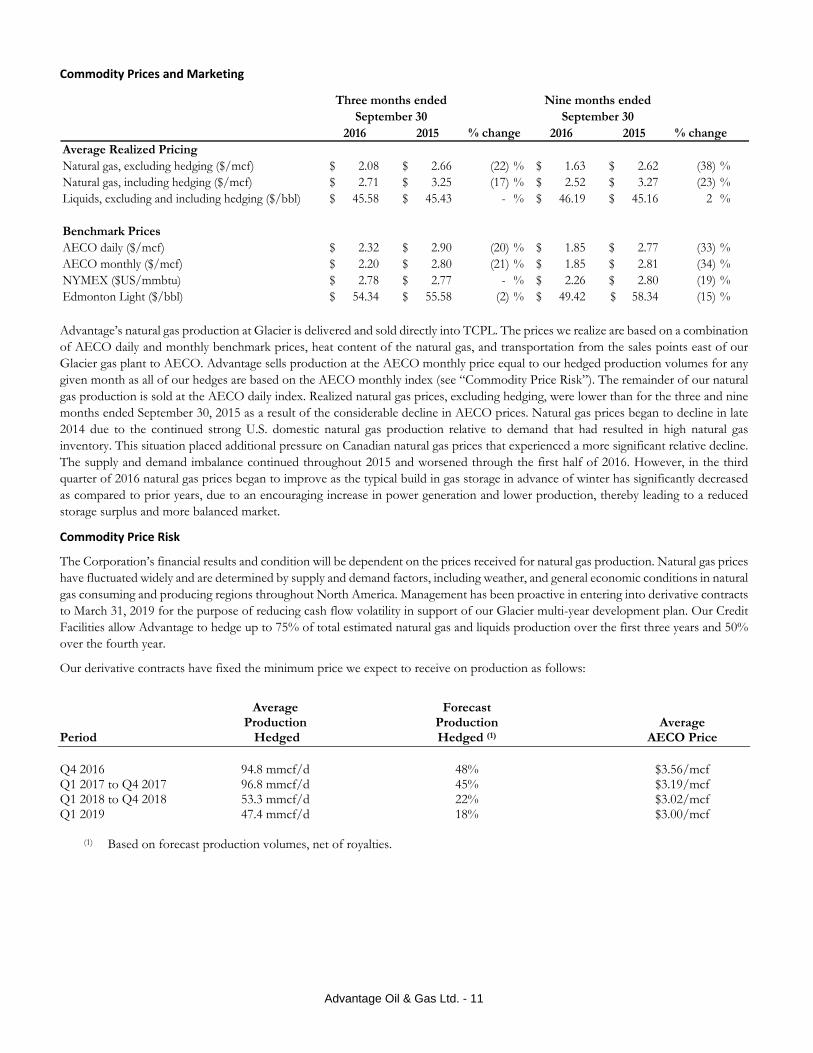
2016 2015 2016 2015Average Realized PricingNatural gas, excluding hedging ($/mcf) 2.08$ 2.66$ (22) % 1.63$ 2.62$ (38) %Natural gas, including hedging ($/mcf) 2.71$ 3.25$ (17) % 2.52$ 3.27$ (23) %Liquids, excluding and including hedging ($/bbl) 45.58$ 45.43$ - % 46.19$ 45.16$ 2 %
Benchmark PricesAECO daily ($/mcf) 2.32$ 2.90$ (20) % 1.85$ 2.77$ (33) %AECO monthly ($/mcf) 2.20$ 2.80$ (21) % 1.85$ 2.81$ (34) %NYMEX ($US/mmbtu) 2.78$ 2.77$ - % 2.26$ 2.80$ (19) %Edmonton Light ($/bbl) 54.34$ 55.58$ (2) % 49.42$ 58.34$ (15) %
% change % change
Three months endedSeptember 30
Nine months endedSeptember 30
Advantage’s natural gas production at Glacier is delivered and sold directly into TCPL. The prices we realize are based on a combination of AECO daily and monthly benchmark prices, heat content of the natural gas, and transportation from the sales points east of our Glacier gas plant to AECO. Advantage sells production at the AECO monthly price equal to our hedged production volumes for any given month as all of our hedges are based on the AECO monthly index (see “Commodity Price Risk”). The remainder of our natural gas production is sold at the AECO daily index. Realized natural gas prices, excluding hedging, were lower than for the three and nine months ended September 30, 2015 as a result of the considerable decline in AECO prices. Natural gas prices began to decline in late 2014 due to the continued strong U.S. domestic natural gas production relative to demand that had resulted in high natural gas inventory. This situation placed additional pressure on Canadian natural gas prices that experienced a more significant relative decline. The supply and demand imbalance continued throughout 2015 and worsened through the first half of 2016. However, in the third quarter of 2016 natural gas prices began to improve as the typical build in gas storage in advance of winter has significantly decreased as compared to prior years, due to an encouraging increase in power generation and lower production, thereby leading to a reduced storage surplus and more balanced market.
Commodity Price Risk
The Corporation’s financial results and condition will be dependent on the prices received for natural gas production. Natural gas prices have fluctuated widely and are determined by supply and demand factors, including weather, and general economic conditions in natural gas consuming and producing regions throughout North America. Management has been proactive in entering into derivative contracts to March 31, 2019 for the purpose of reducing cash flow volatility in support of our Glacier multi-year development plan. Our Credit Facilities allow Advantage to hedge up to 75% of total estimated natural gas and liquids production over the first three years and 50% over the fourth year.
Our derivative contracts have fixed the minimum price we expect to receive on production as follows:
Average Forecast Production Production Average Period Hedged Hedged (1) AECO Price Q4 2016 94.8 mmcf/d 48% $3.56/mcf Q1 2017 to Q4 2017 96.8 mmcf/d 45% $3.19/mcf Q1 2018 to Q4 2018 53.3 mmcf/d 22% $3.02/mcf Q1 2019 47.4 mmcf/d 18% $3.00/mcf
(1) Based on forecast production volumes, net of royalties.
Advantage Oil & Gas Ltd. - 12
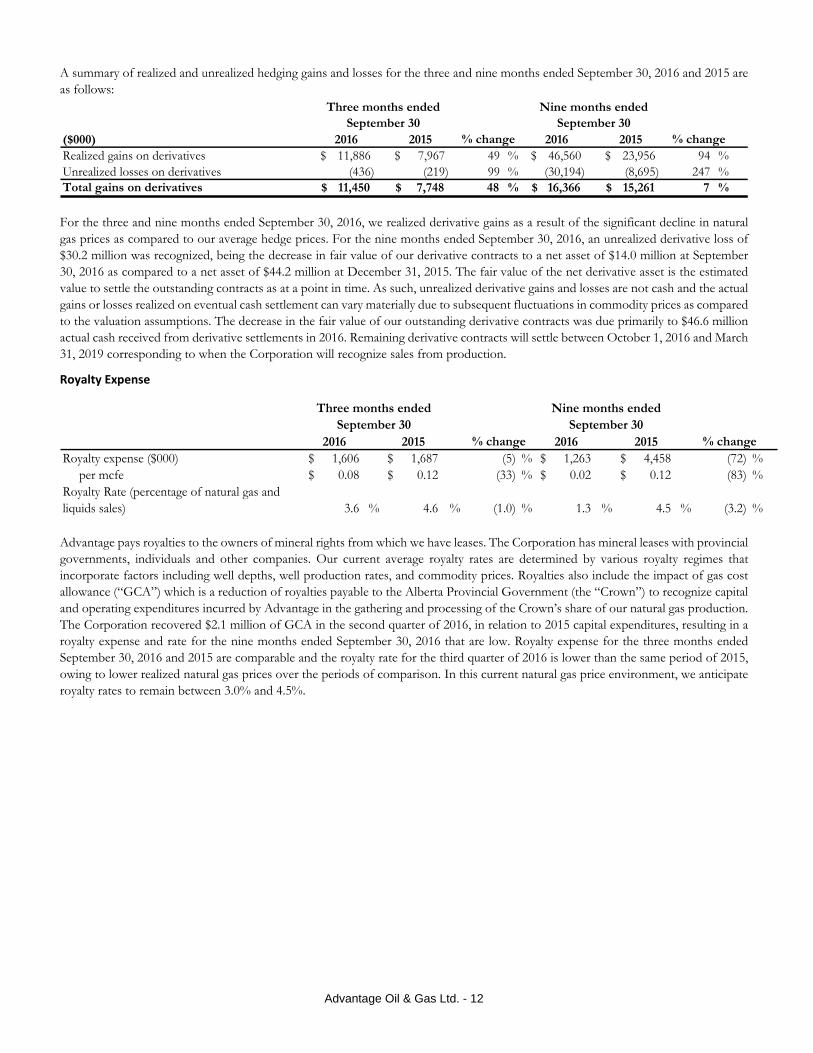
A summary of realized and unrealized hedging gains and losses for the three and nine months ended September 30, 2016 and 2015 are as follows:
($000) 2016 2015 2016 2015Realized gains on derivatives 11,886$ 7,967$ 49 % 46,560$ 23,956$ 94 %Unrealized losses on derivatives (436) (219) 99 % (30,194) (8,695) 247 %Total gains on derivatives 11,450$ 7,748$ 48 % 16,366$ 15,261$ 7 %
% change % change
Three months endedSeptember 30
Nine months endedSeptember 30
For the three and nine months ended September 30, 2016, we realized derivative gains as a result of the significant decline in natural gas prices as compared to our average hedge prices. For the nine months ended September 30, 2016, an unrealized derivative loss of $30.2 million was recognized, being the decrease in fair value of our derivative contracts to a net asset of $14.0 million at September 30, 2016 as compared to a net asset of $44.2 million at December 31, 2015. The fair value of the net derivative asset is the estimated value to settle the outstanding contracts as at a point in time. As such, unrealized derivative gains and losses are not cash and the actual gains or losses realized on eventual cash settlement can vary materially due to subsequent fluctuations in commodity prices as compared to the valuation assumptions. The decrease in the fair value of our outstanding derivative contracts was due primarily to $46.6 million actual cash received from derivative settlements in 2016. Remaining derivative contracts will settle between October 1, 2016 and March 31, 2019 corresponding to when the Corporation will recognize sales from production.
Royalty Expense
2016 2015 2016 2015Royalty expense ($000) 1,606$ 1,687$ (5) % 1,263$ 4,458$ (72) % per mcfe 0.08$ 0.12$ (33) % 0.02$ 0.12$ (83) %Royalty Rate (percentage of natural gas and liquids sales) 3.6 % 4.6 % (1.0) % 1.3 % 4.5 % (3.2) %
% change % change
Three months endedSeptember 30
Nine months endedSeptember 30
Advantage pays royalties to the owners of mineral rights from which we have leases. The Corporation has mineral leases with provincial governments, individuals and other companies. Our current average royalty rates are determined by various royalty regimes that incorporate factors including well depths, well production rates, and commodity prices. Royalties also include the impact of gas cost allowance (“GCA”) which is a reduction of royalties payable to the Alberta Provincial Government (the “Crown”) to recognize capital and operating expenditures incurred by Advantage in the gathering and processing of the Crown’s share of our natural gas production. The Corporation recovered $2.1 million of GCA in the second quarter of 2016, in relation to 2015 capital expenditures, resulting in a royalty expense and rate for the nine months ended September 30, 2016 that are low. Royalty expense for the three months ended September 30, 2016 and 2015 are comparable and the royalty rate for the third quarter of 2016 is lower than the same period of 2015, owing to lower realized natural gas prices over the periods of comparison. In this current natural gas price environment, we anticipate royalty rates to remain between 3.0% and 4.5%.
Advantage Oil & Gas Ltd. - 13
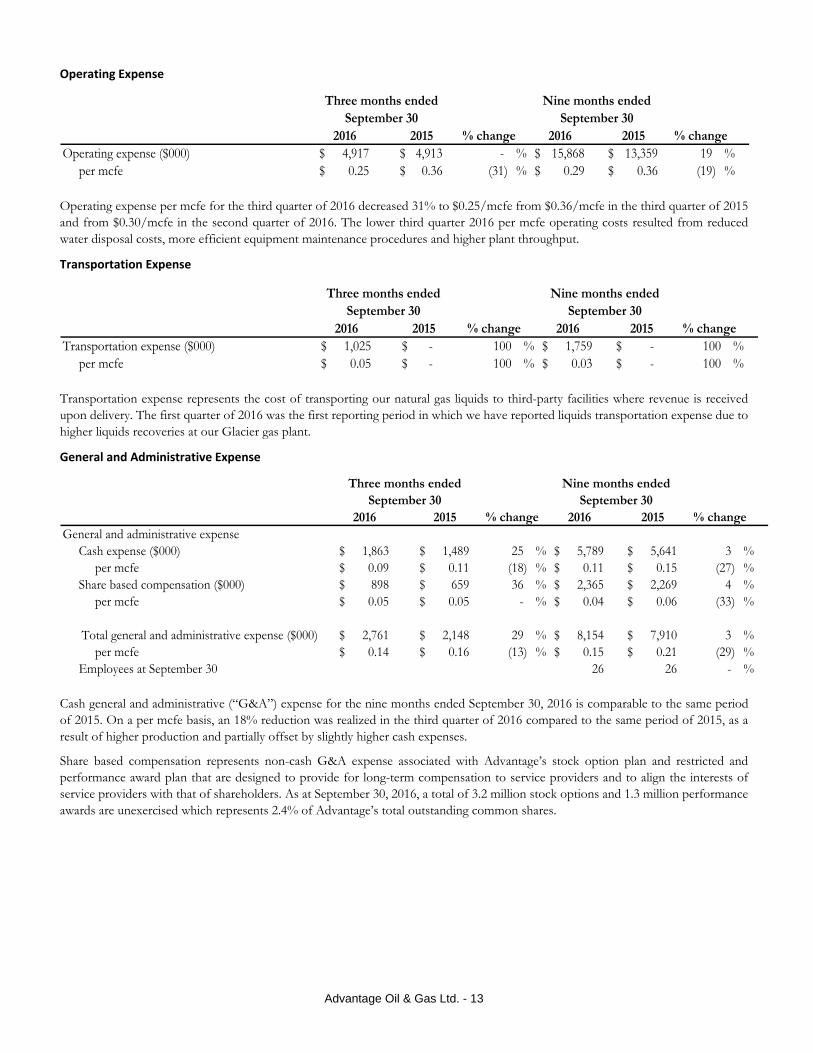
Operating Expense
2016 2015 2016 2015Operating expense ($000) 4,917$ 4,913$ - % 15,868$ 13,359$ 19 % per mcfe 0.25$ 0.36$ (31) % 0.29$ 0.36$ (19) %
% change % change
Three months endedSeptember 30
Nine months endedSeptember 30
Operating expense per mcfe for the third quarter of 2016 decreased 31% to $0.25/mcfe from $0.36/mcfe in the third quarter of 2015 and from $0.30/mcfe in the second quarter of 2016. The lower third quarter 2016 per mcfe operating costs resulted from reduced water disposal costs, more efficient equipment maintenance procedures and higher plant throughput.
Transportation Expense
2016 2015 2016 2015Transportation expense ($000) 1,025$ -$ 100 % 1,759$ -$ 100 % per mcfe 0.05$ -$ 100 % 0.03$ -$ 100 %
% change % change
Three months endedSeptember 30
Nine months endedSeptember 30
Transportation expense represents the cost of transporting our natural gas liquids to third-party facilities where revenue is received upon delivery. The first quarter of 2016 was the first reporting period in which we have reported liquids transportation expense due to higher liquids recoveries at our Glacier gas plant.
General and Administrative Expense
2016 2015 2016 2015General and administrative expense Cash expense ($000) 1,863$ 1,489$ 25 % 5,789$ 5,641$ 3 % per mcfe 0.09$ 0.11$ (18) % 0.11$ 0.15$ (27) % Share based compensation ($000) 898$ 659$ 36 % 2,365$ 2,269$ 4 % per mcfe 0.05$ 0.05$ - % 0.04$ 0.06$ (33) %
Total general and administrative expense ($000) 2,761$ 2,148$ 29 % 8,154$ 7,910$ 3 % per mcfe 0.14$ 0.16$ (13) % 0.15$ 0.21$ (29) % Employees at September 30 26 26 - %
% change % change
Three months endedSeptember 30
Nine months endedSeptember 30
Cash general and administrative (“G&A”) expense for the nine months ended September 30, 2016 is comparable to the same period of 2015. On a per mcfe basis, an 18% reduction was realized in the third quarter of 2016 compared to the same period of 2015, as a result of higher production and partially offset by slightly higher cash expenses.
Share based compensation represents non-cash G&A expense associated with Advantage’s stock option plan and restricted and performance award plan that are designed to provide for long-term compensation to service providers and to align the interests of service providers with that of shareholders. As at September 30, 2016, a total of 3.2 million stock options and 1.3 million performance awards are unexercised which represents 2.4% of Advantage’s total outstanding common shares.
Advantage Oil & Gas Ltd. - 14
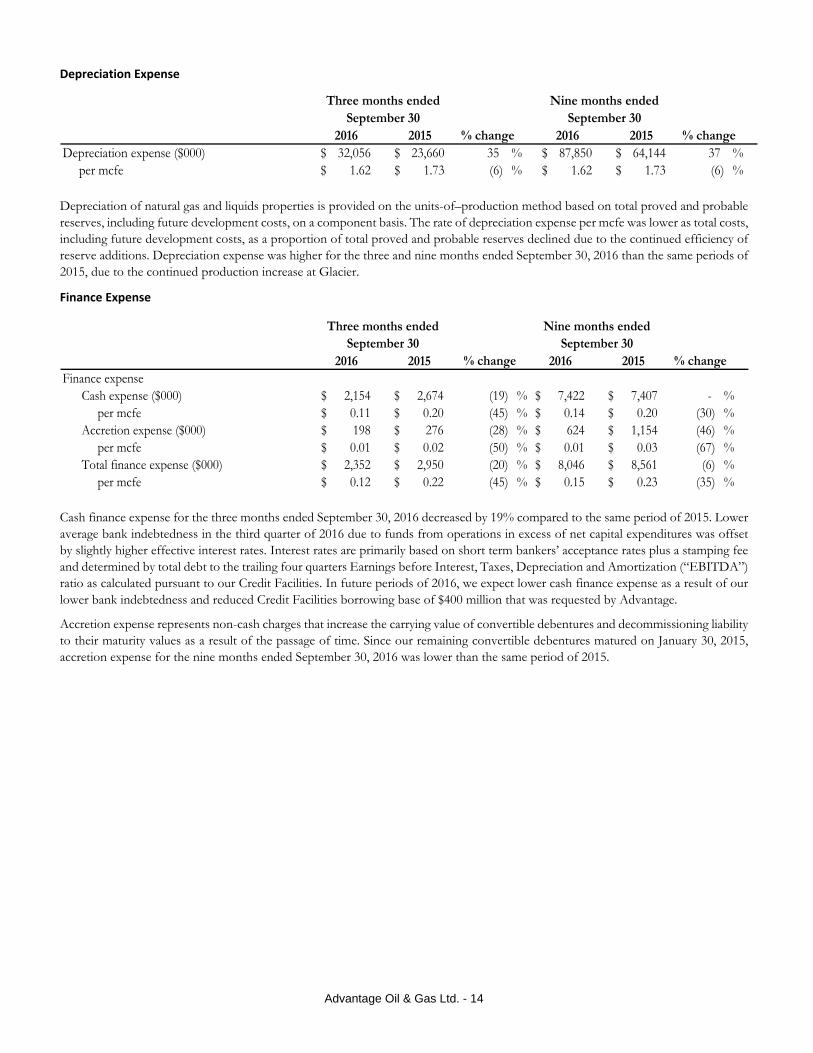
Depreciation Expense
2016 2015 2016 2015Depreciation expense ($000) 32,056$ 23,660$ 35 % 87,850$ 64,144$ 37 % per mcfe 1.62$ 1.73$ (6) % 1.62$ 1.73$ (6) %
% change % change
Three months endedSeptember 30
Nine months endedSeptember 30
Depreciation of natural gas and liquids properties is provided on the units-of–production method based on total proved and probable reserves, including future development costs, on a component basis. The rate of depreciation expense per mcfe was lower as total costs, including future development costs, as a proportion of total proved and probable reserves declined due to the continued efficiency of reserve additions. Depreciation expense was higher for the three and nine months ended September 30, 2016 than the same periods of 2015, due to the continued production increase at Glacier.
Finance Expense
2016 2015 2016 2015Finance expense
Cash expense ($000) 2,154$ 2,674$ (19) % 7,422$ 7,407$ - % per mcfe 0.11$ 0.20$ (45) % 0.14$ 0.20$ (30) %Accretion expense ($000) 198$ 276$ (28) % 624$ 1,154$ (46) % per mcfe 0.01$ 0.02$ (50) % 0.01$ 0.03$ (67) %Total finance expense ($000) 2,352$ 2,950$ (20) % 8,046$ 8,561$ (6) % per mcfe 0.12$ 0.22$ (45) % 0.15$ 0.23$ (35) %
% change % change
Three months endedSeptember 30
Nine months endedSeptember 30
Cash finance expense for the three months ended September 30, 2016 decreased by 19% compared to the same period of 2015. Lower average bank indebtedness in the third quarter of 2016 due to funds from operations in excess of net capital expenditures was offset by slightly higher effective interest rates. Interest rates are primarily based on short term bankers’ acceptance rates plus a stamping fee and determined by total debt to the trailing four quarters Earnings before Interest, Taxes, Depreciation and Amortization (“EBITDA”) ratio as calculated pursuant to our Credit Facilities. In future periods of 2016, we expect lower cash finance expense as a result of our lower bank indebtedness and reduced Credit Facilities borrowing base of $400 million that was requested by Advantage.
Accretion expense represents non-cash charges that increase the carrying value of convertible debentures and decommissioning liability to their maturity values as a result of the passage of time. Since our remaining convertible debentures matured on January 30, 2015, accretion expense for the nine months ended September 30, 2016 was lower than the same period of 2015.
Advantage Oil & Gas Ltd. - 15
Taxes
Deferred income taxes arise from differences between the accounting and tax bases of our assets and liabilities. For the nine months ended September 30, 2016, the Corporation recognized a deferred income tax recovery of $1.9 million as a result of the $8.8 million loss before taxes and credited $1.3 million to share capital related to share issue costs. The net deferred tax liability decreased by $3.2 million to $37.9 million at September 30, 2016 from the December 31, 2015 balance of $41.1 million.
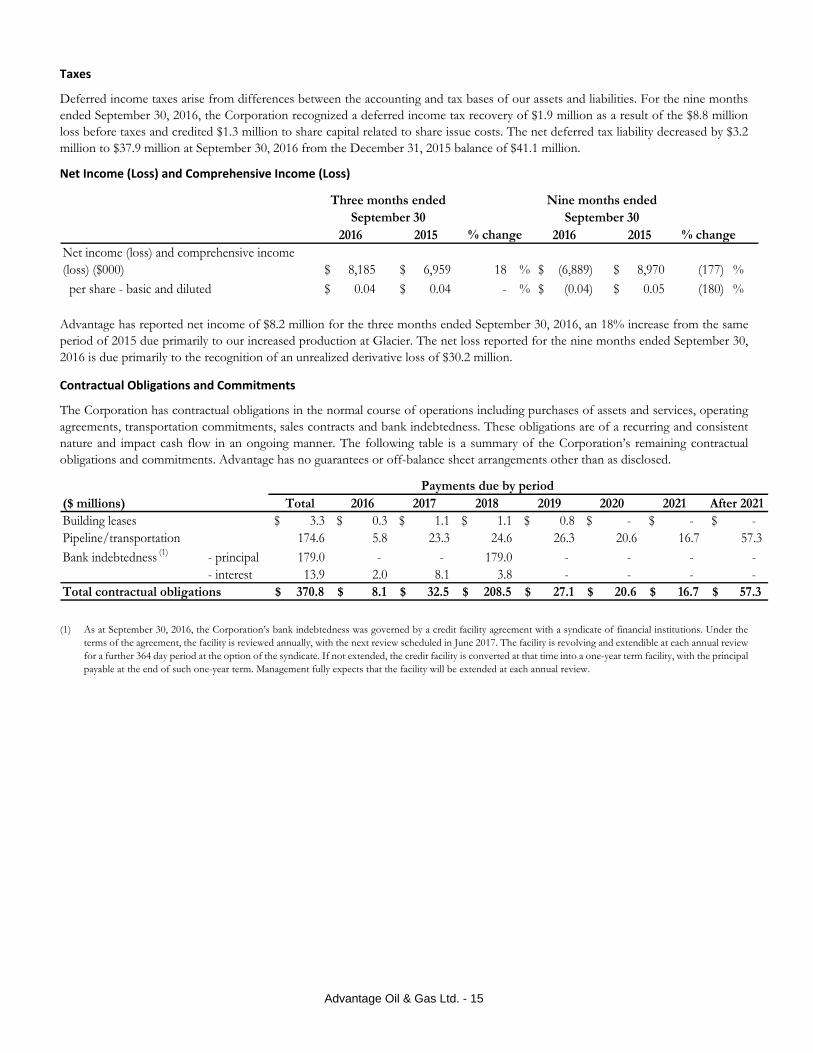
Net Income (Loss) and Comprehensive Income (Loss)
2016 2015 2016 2015Net income (loss) and comprehensive income (loss) ($000) 8,185$ 6,959$ 18 % (6,889)$ 8,970$ (177) % per share - basic and diluted 0.04$ 0.04$ - % (0.04)$ 0.05$ (180) %
% change % change
Three months endedSeptember 30
Nine months endedSeptember 30
Advantage has reported net income of $8.2 million for the three months ended September 30, 2016, an 18% increase from the same period of 2015 due primarily to our increased production at Glacier. The net loss reported for the nine months ended September 30, 2016 is due primarily to the recognition of an unrealized derivative loss of $30.2 million.
Contractual Obligations and Commitments
The Corporation has contractual obligations in the normal course of operations including purchases of assets and services, operating agreements, transportation commitments, sales contracts and bank indebtedness. These obligations are of a recurring and consistent nature and impact cash flow in an ongoing manner. The following table is a summary of the Corporation’s remaining contractual obligations and commitments. Advantage has no guarantees or off-balance sheet arrangements other than as disclosed.
($ millions) Total 2016 2017 2018 2019 2020 2021 After 2021Building leases 3.3$ 0.3$ 1.1$ 1.1$ 0.8$ -$ -$ -$ Pipeline/transportation 174.6 5.8 23.3 24.6 26.3 20.6 16.7 57.3 Bank indebtedness (1) - principal 179.0 - - 179.0 - - - -
- interest 13.9 2.0 8.1 3.8 - - - - Total contractual obligations 370.8$ 8.1$ 32.5$ 208.5$ 27.1$ 20.6$ 16.7$ 57.3$
Payments due by period
(1) As at September 30, 2016, the Corporation’s bank indebtedness was governed by a credit facility agreement with a syndicate of financial institutions. Under the terms of the agreement, the facility is reviewed annually, with the next review scheduled in June 2017. The facility is revolving and extendible at each annual review for a further 364 day period at the option of the syndicate. If not extended, the credit facility is converted at that time into a one-year term facility, with the principal payable at the end of such one-year term. Management fully expects that the facility will be extended at each annual review.
Advantage Oil & Gas Ltd. - 16
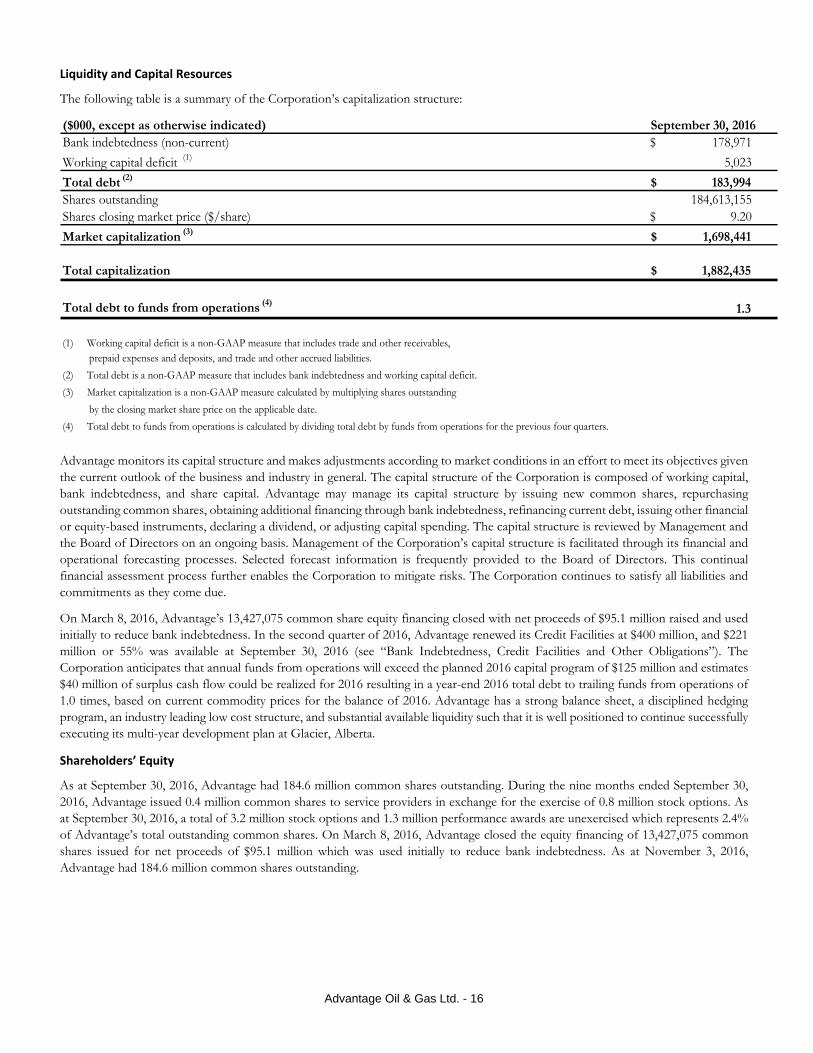
Liquidity and Capital Resources
The following table is a summary of the Corporation’s capitalization structure:
($000, except as otherwise indicated) September 30, 2016Bank indebtedness (non-current) 178,971$
Working capital deficit (1) 5,023
Total debt (2) 183,994$ Shares outstanding 184,613,155 Shares closing market price ($/share) 9.20$
Market capitalization (3) 1,698,441$
Total capitalization 1,882,435$
Total debt to funds from operations (4)1.3
(1) Working capital deficit is a non-GAAP measure that includes trade and other receivables, prepaid expenses and deposits, and trade and other accrued liabilities.
(2) Total debt is a non-GAAP measure that includes bank indebtedness and working capital deficit.
(3) Market capitalization is a non-GAAP measure calculated by multiplying shares outstanding
by the closing market share price on the applicable date.
(4) Total debt to funds from operations is calculated by dividing total debt by funds from operations for the previous four quarters.
Advantage monitors its capital structure and makes adjustments according to market conditions in an effort to meet its objectives given the current outlook of the business and industry in general. The capital structure of the Corporation is composed of working capital, bank indebtedness, and share capital. Advantage may manage its capital structure by issuing new common shares, repurchasing outstanding common shares, obtaining additional financing through bank indebtedness, refinancing current debt, issuing other financial or equity-based instruments, declaring a dividend, or adjusting capital spending. The capital structure is reviewed by Management and the Board of Directors on an ongoing basis. Management of the Corporation’s capital structure is facilitated through its financial and operational forecasting processes. Selected forecast information is frequently provided to the Board of Directors. This continual financial assessment process further enables the Corporation to mitigate risks. The Corporation continues to satisfy all liabilities and commitments as they come due.
On March 8, 2016, Advantage’s 13,427,075 common share equity financing closed with net proceeds of $95.1 million raised and used initially to reduce bank indebtedness. In the second quarter of 2016, Advantage renewed its Credit Facilities at $400 million, and $221 million or 55% was available at September 30, 2016 (see “Bank Indebtedness, Credit Facilities and Other Obligations”). The Corporation anticipates that annual funds from operations will exceed the planned 2016 capital program of $125 million and estimates $40 million of surplus cash flow could be realized for 2016 resulting in a year-end 2016 total debt to trailing funds from operations of 1.0 times, based on current commodity prices for the balance of 2016. Advantage has a strong balance sheet, a disciplined hedging program, an industry leading low cost structure, and substantial available liquidity such that it is well positioned to continue successfully executing its multi-year development plan at Glacier, Alberta.
Shareholders’ Equity
As at September 30, 2016, Advantage had 184.6 million common shares outstanding. During the nine months ended September 30, 2016, Advantage issued 0.4 million common shares to service providers in exchange for the exercise of 0.8 million stock options. As at September 30, 2016, a total of 3.2 million stock options and 1.3 million performance awards are unexercised which represents 2.4% of Advantage’s total outstanding common shares. On March 8, 2016, Advantage closed the equity financing of 13,427,075 common shares issued for net proceeds of $95.1 million which was used initially to reduce bank indebtedness. As at November 3, 2016, Advantage had 184.6 million common shares outstanding.
Advantage Oil & Gas Ltd. - 17
Bank Indebtedness, Credit Facilities and Other Obligations
At September 30, 2016, Advantage had bank indebtedness outstanding of $179.0 million, a decrease of $107.6 million since December 31, 2015. The change in bank indebtedness was consistent with planned capital expenditure activity in our approved 2016 budget and the equity financing that closed on March 8, 2016 in which net proceeds of $95.1 million was raised. Advantage’s credit facilities have a borrowing base of $400 million and is collateralized by a $1 billion floating charge demand debenture covering all assets of the Corporation (the “Credit Facilities”). The borrowing base for the Credit Facilities is determined by the banking syndicate through a thorough evaluation of our reserve estimates based upon their own commodity price expectations. Revisions or changes in the reserve estimates and commodity prices can have either a positive or a negative impact on the borrowing base. In the second quarter of 2016, the Credit Facilities borrowing base was renewed at $400 million comprised of a $20 million extendible revolving operating loan facility from one financial institution and a $380 million extendible revolving loan facility from a syndicate of financial institutions. Advantage requested a reduction from the prior $450 million borrowing base as its strong balance sheet and estimated capital requirements for future growth provides ample flexibility and we expect to save interest costs of $0.4 million per year. The only prior financial covenant to maintain a minimum cash flow to interest expense ratio of 3.5:1 was removed. The next annual review is scheduled to occur in June 2017. There can be no assurance that the Credit Facilities will be renewed at the current borrowing base level at that time.
Advantage had a working capital deficit of $5.0 million as at September 30, 2016, as compared to $7.2 million at December 31, 2015 due to a combination of higher trade receivables caused by increasing revenues, offset by slightly higher trade payables caused by increased capital activity at September 30, 2016 as compared to December 31, 2015. Our working capital includes items expected for normal operations such as trade receivables, prepaid expenses, deposits, and trade payables and accruals. Working capital varies primarily due to the timing of such items, the current level of business activity including our capital expenditure program, commodity price volatility, and seasonal fluctuations. Our working capital is normally in a deficit position due to our capital development activities. We do not anticipate any problems in meeting future obligations as they become due as they can be satisfied with funds from operations and our available Credit Facilities.
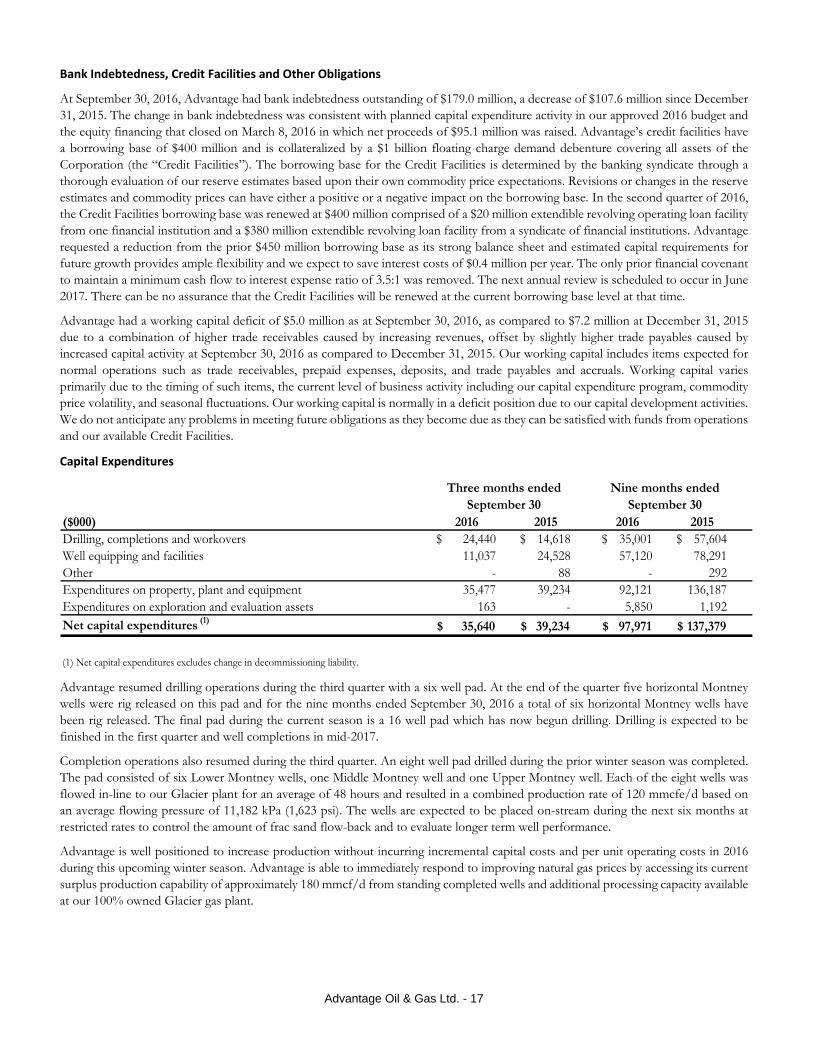
Capital Expenditures
($000) 2016 2015 2016 2015Drilling, completions and workovers 24,440$ 14,618$ 35,001$ 57,604$ Well equipping and facilities 11,037 24,528 57,120 78,291 Other - 88 - 292 Expenditures on property, plant and equipment 35,477 39,234 92,121 136,187 Expenditures on exploration and evaluation assets 163 - 5,850 1,192 Net capital expenditures (1)
35,640$ 39,234$ 97,971$ 137,379$
(1) Net capital expenditures excludes change in decommissioning liability.
Three months endedSeptember 30
Nine months endedSeptember 30
Advantage resumed drilling operations during the third quarter with a six well pad. At the end of the quarter five horizontal Montney wells were rig released on this pad and for the nine months ended September 30, 2016 a total of six horizontal Montney wells have been rig released. The final pad during the current season is a 16 well pad which has now begun drilling. Drilling is expected to be finished in the first quarter and well completions in mid-2017.
Completion operations also resumed during the third quarter. An eight well pad drilled during the prior winter season was completed. The pad consisted of six Lower Montney wells, one Middle Montney well and one Upper Montney well. Each of the eight wells was flowed in-line to our Glacier plant for an average of 48 hours and resulted in a combined production rate of 120 mmcfe/d based on an average flowing pressure of 11,182 kPa (1,623 psi). The wells are expected to be placed on-stream during the next six months at restricted rates to control the amount of frac sand flow-back and to evaluate longer term well performance.
Advantage is well positioned to increase production without incurring incremental capital costs and per unit operating costs in 2016 during this upcoming winter season. Advantage is able to immediately respond to improving natural gas prices by accessing its current surplus production capability of approximately 180 mmcf/d from standing completed wells and additional processing capacity available at our 100% owned Glacier gas plant.
Advantage Oil & Gas Ltd. - 18
During the third quarter of 2016, work continued on back-up utility systems including an additional acid gas compressor and inlet compression which provides operational flexibility, costs savings and incremental capacity for future growth. Advantage invested $98 million during the nine months ended September 30, 2016 of which $57 million (58%) was directed to infrastructure projects that process and transport production such as the looping of our sales gas pipeline which increased take-away capacity to approximately 400 mmcf/d to TCPL, installation of a 6 km loop to expand our gas gathering system upstream of the plant and back-up utility systems for the plant.
Since January 2016, Advantage has acquired Montney and Doig mineral rights in 13 additional sections for a total cost of $6 million. The majority of these lands are within and proximal to our existing land holdings at Glacier with additional acreage also acquired at Valhalla and Wembley.
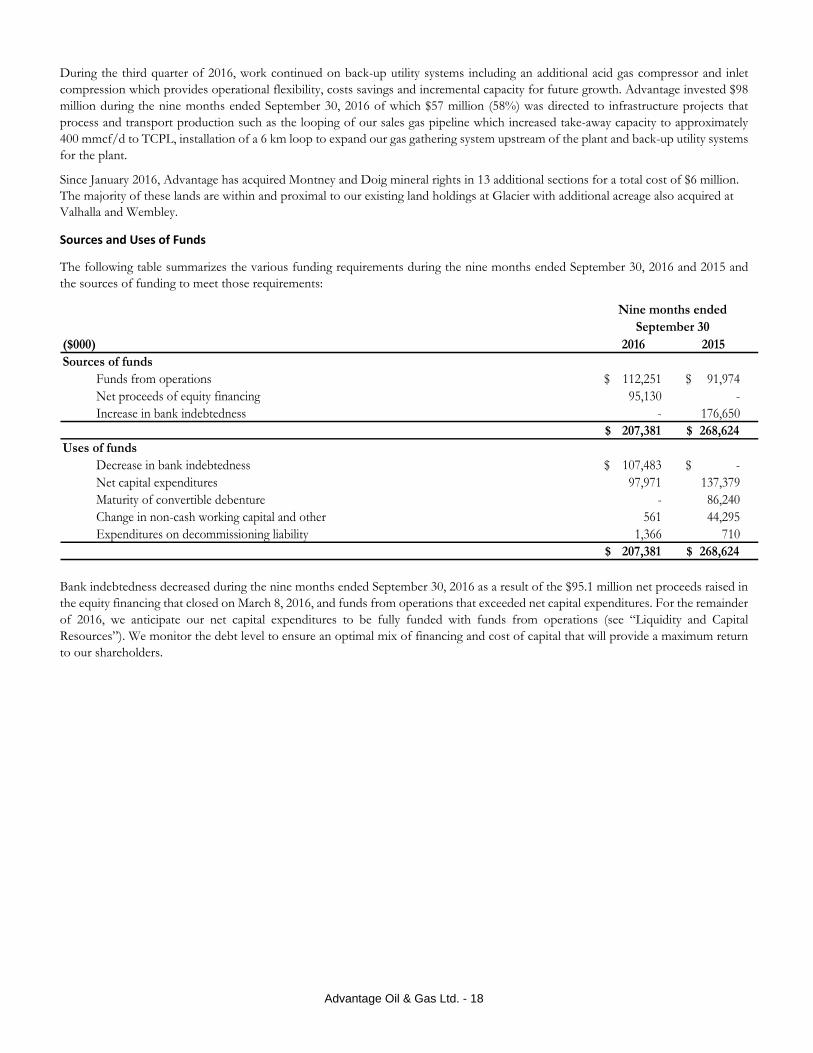
Sources and Uses of Funds
The following table summarizes the various funding requirements during the nine months ended September 30, 2016 and 2015 and the sources of funding to meet those requirements:
($000) 2016 2015Sources of funds
Funds from operations 112,251$ 91,974$ Net proceeds of equity financing 95,130 - Increase in bank indebtedness - 176,650
207,381$ 268,624$ Uses of funds
Decrease in bank indebtedness 107,483$ -$ Net capital expenditures 97,971 137,379 Maturity of convertible debenture - 86,240 Change in non-cash working capital and other 561 44,295 Expenditures on decommissioning liability 1,366 710
207,381$ 268,624$
Nine months endedSeptember 30
Bank indebtedness decreased during the nine months ended September 30, 2016 as a result of the $95.1 million net proceeds raised in the equity financing that closed on March 8, 2016, and funds from operations that exceeded net capital expenditures. For the remainder of 2016, we anticipate our net capital expenditures to be fully funded with funds from operations (see “Liquidity and Capital Resources”). We monitor the debt level to ensure an optimal mix of financing and cost of capital that will provide a maximum return to our shareholders.
Advantage Oil & Gas Ltd. - 19
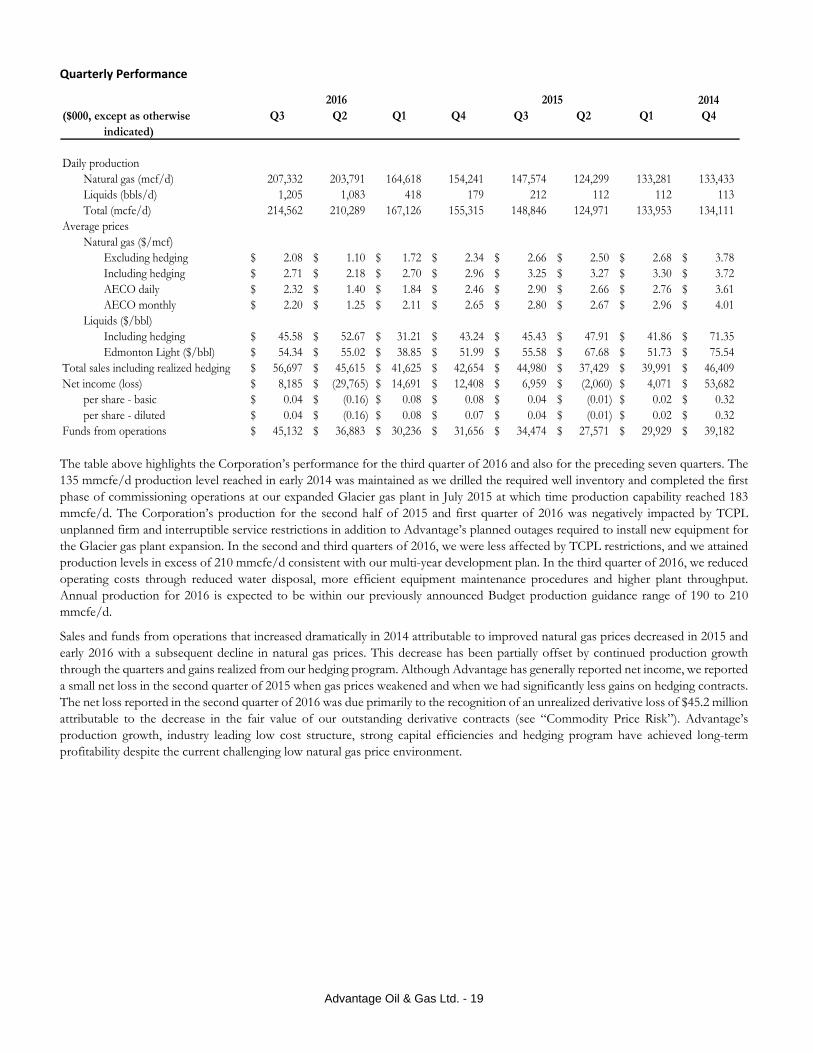
Quarterly Performance
2014($000, except as otherwise Q3 Q2 Q1 Q4 Q3 Q2 Q1 Q4
indicated)
Daily productionNatural gas (mcf/d) 207,332 203,791 164,618 154,241 147,574 124,299 133,281 133,433 Liquids (bbls/d) 1,205 1,083 418 179 212 112 112 113 Total (mcfe/d) 214,562 210,289 167,126 155,315 148,846 124,971 133,953 134,111
Average pricesNatural gas ($/mcf)
Excluding hedging 2.08$ 1.10$ 1.72$ 2.34$ 2.66$ 2.50$ 2.68$ 3.78$ Including hedging 2.71$ 2.18$ 2.70$ 2.96$ 3.25$ 3.27$ 3.30$ 3.72$ AECO daily 2.32$ 1.40$ 1.84$ 2.46$ 2.90$ 2.66$ 2.76$ 3.61$ AECO monthly 2.20$ 1.25$ 2.11$ 2.65$ 2.80$ 2.67$ 2.96$ 4.01$
Liquids ($/bbl)Including hedging 45.58$ 52.67$ 31.21$ 43.24$ 45.43$ 47.91$ 41.86$ 71.35$ Edmonton Light ($/bbl) 54.34$ 55.02$ 38.85$ 51.99$ 55.58$ 67.68$ 51.73$ 75.54$
Total sales including realized hedging 56,697$ 45,615$ 41,625$ 42,654$ 44,980$ 37,429$ 39,991$ 46,409$ Net income (loss) 8,185$ (29,765)$ 14,691$ 12,408$ 6,959$ (2,060)$ 4,071$ 53,682$
per share - basic 0.04$ (0.16)$ 0.08$ 0.08$ 0.04$ (0.01)$ 0.02$ 0.32$ per share - diluted 0.04$ (0.16)$ 0.08$ 0.07$ 0.04$ (0.01)$ 0.02$ 0.32$
Funds from operations 45,132$ 36,883$ 30,236$ 31,656$ 34,474$ 27,571$ 29,929$ 39,182$
20152016
The table above highlights the Corporation’s performance for the third quarter of 2016 and also for the preceding seven quarters. The 135 mmcfe/d production level reached in early 2014 was maintained as we drilled the required well inventory and completed the first phase of commissioning operations at our expanded Glacier gas plant in July 2015 at which time production capability reached 183 mmcfe/d. The Corporation’s production for the second half of 2015 and first quarter of 2016 was negatively impacted by TCPL unplanned firm and interruptible service restrictions in addition to Advantage’s planned outages required to install new equipment for the Glacier gas plant expansion. In the second and third quarters of 2016, we were less affected by TCPL restrictions, and we attained production levels in excess of 210 mmcfe/d consistent with our multi-year development plan. In the third quarter of 2016, we reduced operating costs through reduced water disposal, more efficient equipment maintenance procedures and higher plant throughput. Annual production for 2016 is expected to be within our previously announced Budget production guidance range of 190 to 210 mmcfe/d.
Sales and funds from operations that increased dramatically in 2014 attributable to improved natural gas prices decreased in 2015 and early 2016 with a subsequent decline in natural gas prices. This decrease has been partially offset by continued production growth through the quarters and gains realized from our hedging program. Although Advantage has generally reported net income, we reported a small net loss in the second quarter of 2015 when gas prices weakened and when we had significantly less gains on hedging contracts. The net loss reported in the second quarter of 2016 was due primarily to the recognition of an unrealized derivative loss of $45.2 million attributable to the decrease in the fair value of our outstanding derivative contracts (see “Commodity Price Risk”). Advantage’s production growth, industry leading low cost structure, strong capital efficiencies and hedging program have achieved long-term profitability despite the current challenging low natural gas price environment.
Advantage Oil & Gas Ltd. - 20
Critical Accounting Estimates
The preparation of financial statements in accordance with IFRS requires Management to make certain judgments and estimates. Changes in these judgments and estimates could have a material impact on the Corporation’s financial results and financial condition.
Management relies on the estimate of reserves as prepared by the Corporation’s independent qualified reserves evaluator. The process of estimating reserves is critical to several accounting estimates. The process of estimating reserves is complex and requires significant judgments and decisions based on available geological, geophysical, engineering and economic data. These estimates may change substantially as additional data from ongoing development and production activities becomes available and as economic conditions impact natural gas and liquids prices, operating expense, royalty burden changes, and future development costs. Reserve estimates impact net income and comprehensive income through depreciation and impairment of natural gas and liquids properties. The reserve estimates are also used to assess the borrowing base for the Corporation’s Credit Facilities. Revision or changes in the reserve estimates can have either a positive or a negative impact on asset values, net income, comprehensive income and the borrowing base of the Corporation.
Management’s process of determining the provision for deferred income taxes and the provision for decommissioning liability costs and related accretion expense are based on estimates. These estimates are significant and can include proved and probable reserves, future production rates, future commodity prices, future costs, future interest rates, future tax rates and other relevant assumptions. Revisions or changes in any of these estimates can have either a positive or a negative impact on asset and liability values, net income and comprehensive income.
In accordance with IFRS, derivative assets and liabilities are recorded at their fair values at the reporting date, with gains and losses recognized directly into comprehensive income in the same period. The fair value of derivatives outstanding is an estimate based on pricing models, estimates, assumptions and market data available at that time. As such, the recognized amounts are non-cash items and the actual gains or losses realized on eventual cash settlement can vary materially due to subsequent fluctuations in commodity prices as compared to the valuation assumptions.
Changes in Accounting Policies
There have been no changes in accounting policies during the nine months ended September 30, 2016.
Accounting Pronouncements not yet Adopted
Standards issued but not yet effective up to the date of issuance of the Corporation’s financial statements are evaluated as to whether we expect changes to our financial reporting when they become effective. As at November 3, 2016, we are evaluating standards issued but not effective and we do not anticipate there to be material changes to our current financial reporting when they become effective.
Evaluation of Disclosure Controls and Procedures
Advantage’s Chief Executive Officer and Chief Financial Officer have designed disclosure controls and procedures (“DC&P”), or caused it to be designed under their supervision, to provide reasonable assurance that material information relating to the Corporation is made known to them by others, particularly during the period in which the annual filings are being prepared, and information required to be disclosed by the Corporation in its annual filings, interim filings or other reports filed or submitted by it under securities legislation is recorded, processed, summarized and reported within the time periods specified in securities legislation. Management of Advantage, including our Chief Executive Officer and Chief Financial Officer, evaluate the effectiveness of the Corporation’s DC&P annually.
Advantage Oil & Gas Ltd. - 21
Evaluation of Internal Controls over Financial Reporting
Advantage’s Chief Executive Officer and Chief Financial Officer are responsible for establishing and maintaining internal control over financial reporting (“ICFR”). They have designed ICFR, or caused it to be designed under their supervision, to provide reasonable assurance regarding the reliability of financial reporting and the preparation of financial statements for external purposes in accordance with IFRS. The control framework Advantage’s officers used to design the Corporation’s ICFR is the Internal Control – Integrated Framework (2013) issued by the Committee of Sponsoring Organizations. Management of Advantage, including our Chief Executive Officer and Chief Financial Officer, evaluate the effectiveness of the Corporation’s ICFR annually.
Advantage’s Chief Executive Officer and Chief Financial Officer are required to disclose any change in the ICFR that occurred during our most recent interim period that has materially affected, or is reasonably likely to materially affect, the Corporation’s ICFR. No material changes in the ICFR were identified during the interim period ended September 30, 2016 that have materially affected, or are reasonably likely to materially affect, our ICFR.
It should be noted that while the Chief Executive Officer and Chief Financial Officer believe that the Corporation’s design of DC&P and ICFR provide a reasonable level of assurance that they are effective, they do not expect that the control system will prevent all errors and fraud. A control system, no matter how well conceived or operated, does not provide absolute, but rather is designed to provide reasonable assurance that the objective of the control system is met. The Corporation’s ICFR may not prevent or detect all misstatements because of inherent limitations. Additionally, projections of any evaluation of effectiveness to future periods are subject to the risk that controls may become inadequate because of changes in conditions or deterioration in the degree of compliance with the Corporation’s policies and procedures.
Additional Information
Additional information relating to Advantage can be found on SEDAR at www.sedar.com and the Corporation’s website at www.advantageog.com. Such other information includes the annual information form, the management information circular, press releases, material change reports, material contracts and agreements, and other financial reports. The annual information form will be of particular interest for current and potential shareholders as it discusses a variety of subject matter including the nature of the business, description of our operations, general and recent business developments, risk factors, reserves data and other oil and gas information.
November 3, 2016
Advantage Oil & Gas Ltd. - 22
CONSOLIDATED FINANCIAL STATEMENTS
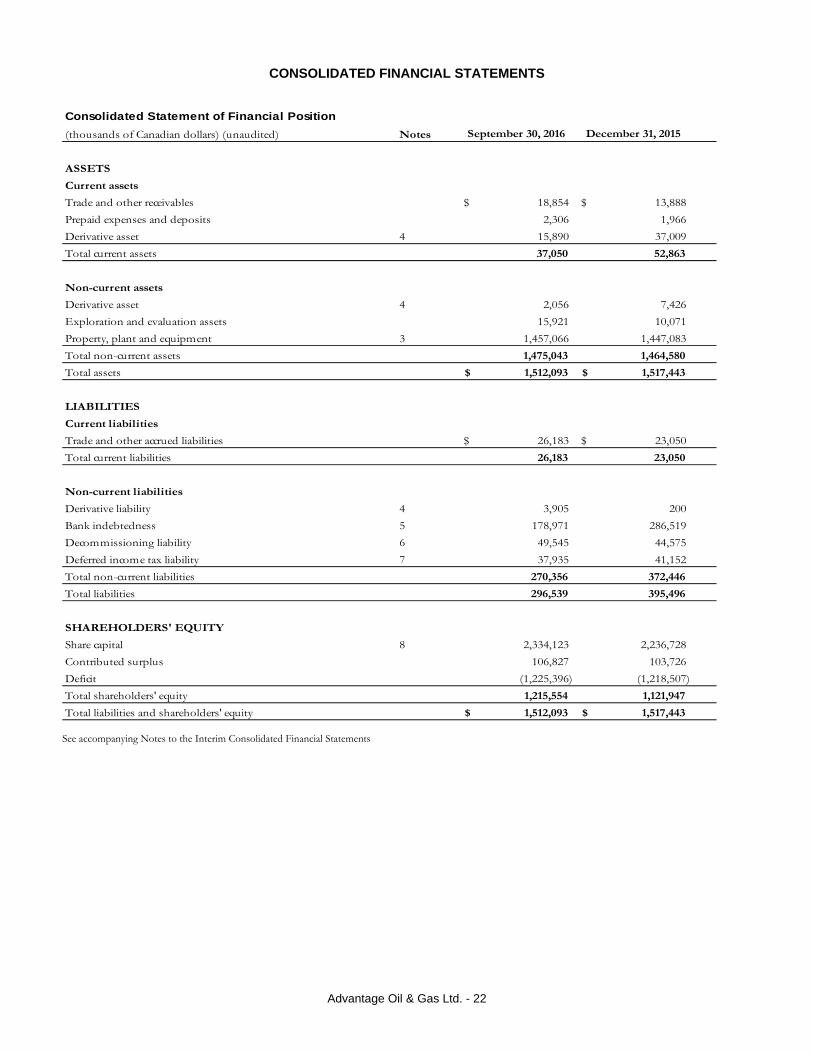
Consolidated Statement of Financial Position
(thousands of Canadian dollars) (unaudited) Notes September 30, 2016 December 31, 2015
ASSETS
Current assets
Trade and other receivables 18,854$ 13,888$
Prepaid expenses and deposits 2,306 1,966
Derivative asset 4 15,890 37,009
Total current assets 37,050 52,863
Non-current assets
Derivative asset 4 2,056 7,426
Exploration and evaluation assets 15,921 10,071
Property, plant and equipment 3 1,457,066 1,447,083
Total non-current assets 1,475,043 1,464,580
Total assets 1,512,093$ 1,517,443$
LIABILITIES
Current liabilities
Trade and other accrued liabilities 26,183$ 23,050$
Total current liabilities 26,183 23,050
Non-current liabilities
Derivative liability 4 3,905 200
Bank indebtedness 5 178,971 286,519
Decommissioning liability 6 49,545 44,575
Deferred income tax liability 7 37,935 41,152
Total non-current liabilities 270,356 372,446
Total liabilities 296,539 395,496
SHAREHOLDERS' EQUITY
Share capital 8 2,334,123 2,236,728
Contributed surplus 106,827 103,726
Deficit (1,225,396) (1,218,507)
Total shareholders' equity 1,215,554 1,121,947
Total liabilities and shareholders' equity 1,512,093$ 1,517,443$
See accompanying Notes to the Interim Consolidated Financial Statements
Advantage Oil & Gas Ltd. - 23
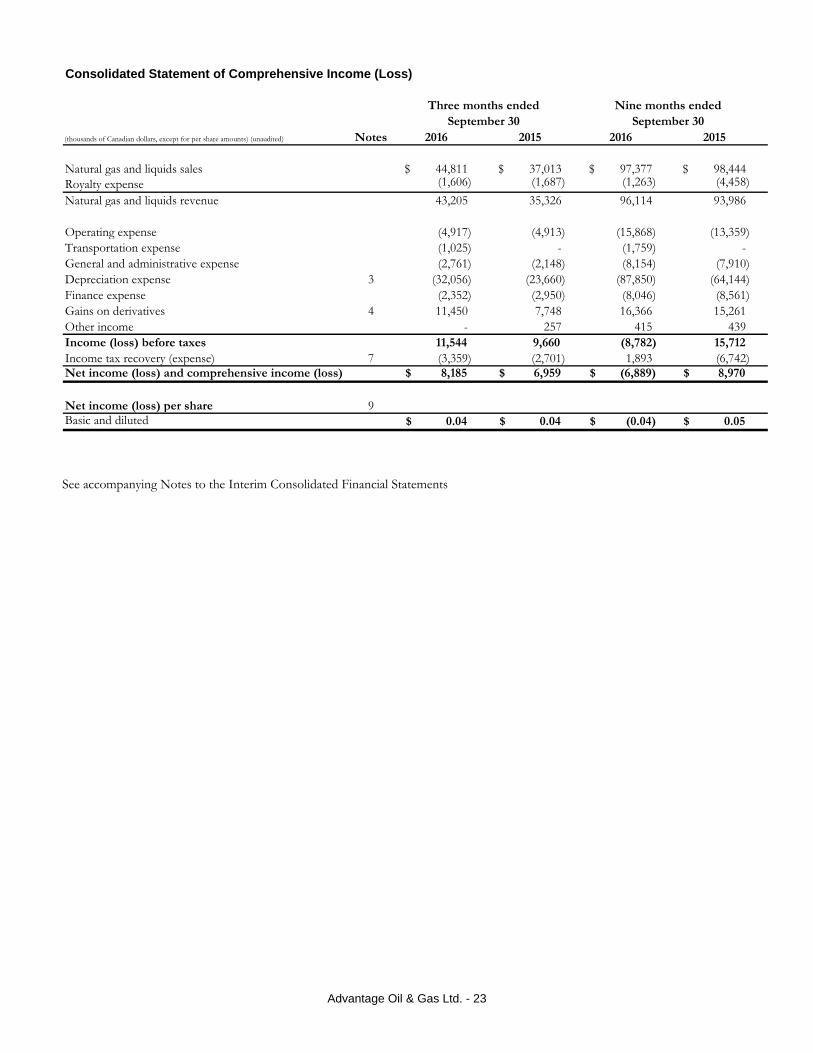
Consolidated Statement of Comprehensive Income (Loss)
(thousands of Canadian dollars, except for per share amounts) (unaudited) Notes 2016 2015 2016 2015
Natural gas and liquids sales 44,811$ 37,013$ 97,377$ 98,444$ Royalty expense (1,606) (1,687) (1,263) (4,458)
Natural gas and liquids revenue 43,205 35,326 96,114 93,986
Operating expense (4,917) (4,913) (15,868) (13,359) Transportation expense (1,025) - (1,759) - General and administrative expense (2,761) (2,148) (8,154) (7,910) Depreciation expense 3 (32,056) (23,660) (87,850) (64,144) Finance expense (2,352) (2,950) (8,046) (8,561) Gains on derivatives 4 11,450 7,748 16,366 15,261 Other income - 257 415 439 Income (loss) before taxes 11,544 9,660 (8,782) 15,712 Income tax recovery (expense) 7 (3,359) (2,701) 1,893 (6,742) Net income (loss) and comprehensive income (loss) 8,185$ 6,959$ (6,889)$ 8,970$
Net income (loss) per share 9Basic and diluted 0.04$ 0.04$ (0.04)$ 0.05$
Three months ended Nine months endedSeptember 30 September 30
See accompanying Notes to the Interim Consolidated Financial Statements
Advantage Oil & Gas Ltd. - 24
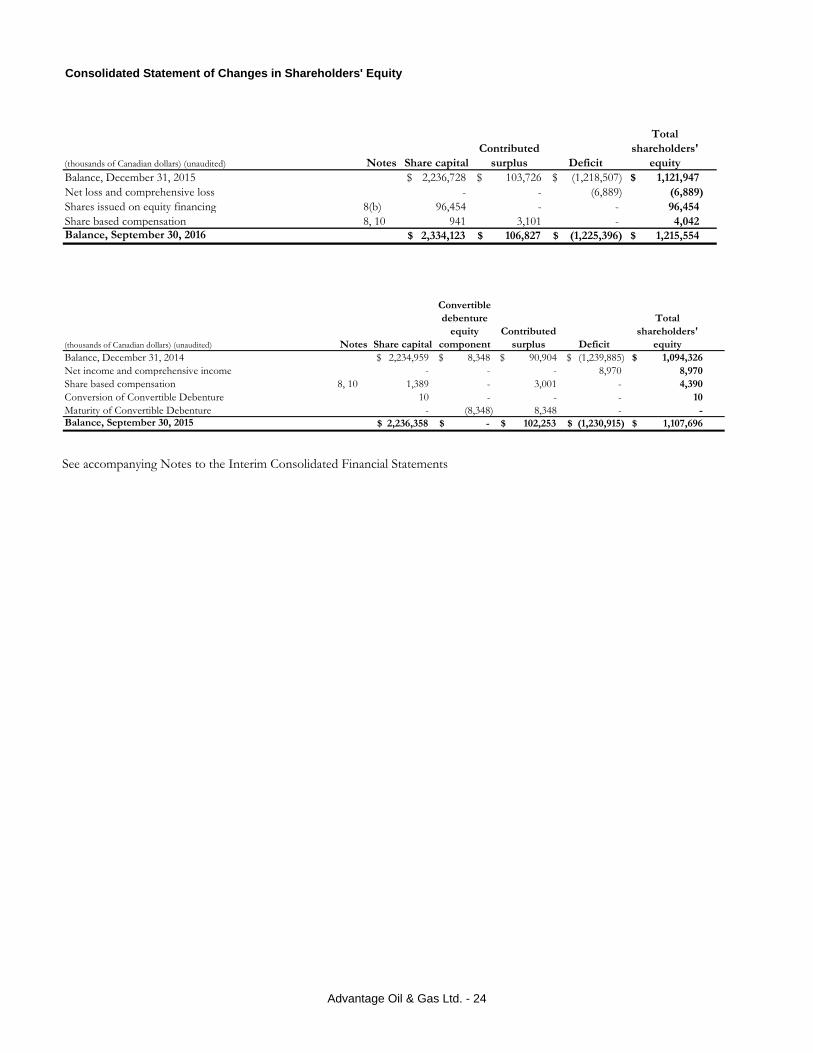
Consolidated Statement of Changes in Shareholders' Equity
(thousands of Canadian dollars) (unaudited) Notes Share capitalContributed
surplus Deficit
Total shareholders'
equityBalance, December 31, 2015 2,236,728$ 103,726$ (1,218,507)$ 1,121,947$ Net loss and comprehensive loss - - (6,889) (6,889) Shares issued on equity financing 8(b) 96,454 - - 96,454 Share based compensation 8, 10 941 3,101 - 4,042 Balance, September 30, 2016 2,334,123$ 106,827$ (1,225,396)$ 1,215,554$
(thousands of Canadian dollars) (unaudited) Notes Share capital
Convertible debenture
equity component
Contributed surplus Deficit
Total shareholders'
equityBalance, December 31, 2014 2,234,959$ 8,348$ 90,904$ (1,239,885)$ 1,094,326$ Net income and comprehensive income - - - 8,970 8,970 Share based compensation 8, 10 1,389 - 3,001 - 4,390 Conversion of Convertible Debenture 10 - - - 10 Maturity of Convertible Debenture - (8,348) 8,348 - - Balance, September 30, 2015 2,236,358$ -$ 102,253$ (1,230,915)$ 1,107,696$
See accompanying Notes to the Interim Consolidated Financial Statements
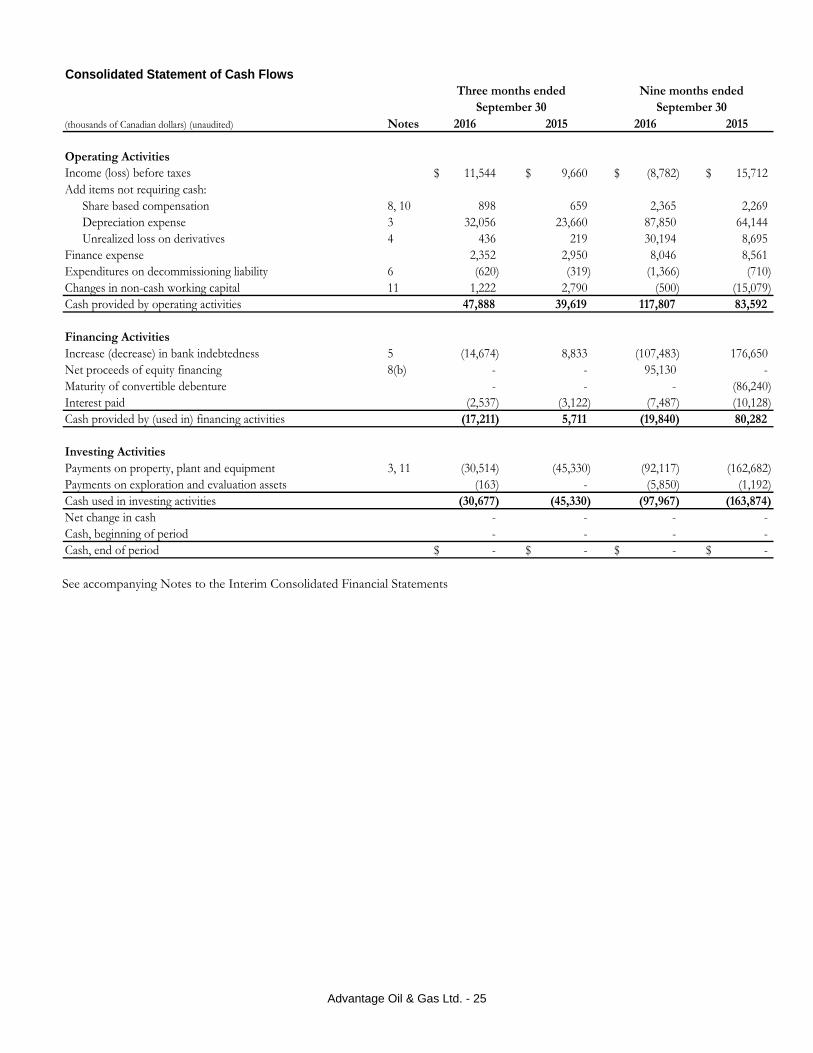
Advantage Oil & Gas Ltd. - 25
Consolidated Statement of Cash Flows
(thousands of Canadian dollars) (unaudited) Notes 2016 2015 2016 2015
Operating Activities11,544$ 9,660$ (8,782)$ 15,712$
Add items not requiring cash:Share based compensation 8, 10 898 659 2,365 2,269 Depreciation expense 3 32,056 23,660 87,850 64,144 Unrealized loss on derivatives 4 436 219 30,194 8,695
Finance expense 2,352 2,950 8,046 8,561 Expenditures on decommissioning liability 6 (620) (319) (1,366) (710) Changes in non-cash working capital 11 1,222 2,790 (500) (15,079) Cash provided by operating activities 47,888 39,619 117,807 83,592
Financing ActivitiesIncrease (decrease) in bank indebtedness 5 (14,674) 8,833 (107,483) 176,650 Net proceeds of equity financing 8(b) - - 95,130 - Maturity of convertible debenture - - - (86,240) Interest paid (2,537) (3,122) (7,487) (10,128) Cash provided by (used in) financing activities (17,211) 5,711 (19,840) 80,282
Investing ActivitiesPayments on property, plant and equipment 3, 11 (30,514) (45,330) (92,117) (162,682) Payments on exploration and evaluation assets (163) - (5,850) (1,192) Cash used in investing activities (30,677) (45,330) (97,967) (163,874) Net change in cash - - - - Cash, beginning of period - - - - Cash, end of period -$ -$ -$ -$
Income (loss) before taxes
Three months ended Nine months endedSeptember 30 September 30
See accompanying Notes to the Interim Consolidated Financial Statements
Advantage Oil & Gas Ltd. - 26
NOTES TO THE INTERIM CONSOLIDATED FINANCIAL STATEMENTS
September 30, 2016 (unaudited)
All tabular amounts are in thousands of Canadian dollars except as otherwise indicated.
1. Business and structure of Advantage Oil & Gas Ltd.
Advantage Oil & Gas Ltd. and its subsidiaries (together “Advantage” or the “Corporation”) is an intermediate natural gas and liquids development and production corporation with a significant position in the Montney resource play located in Western Canada.
Advantage is domiciled and incorporated in Canada under the Business Corporations Act (Alberta). Advantage’s head office address is 300, 440 – 2nd Avenue SW, Calgary, Alberta, Canada. The Corporation’s primary listing is on the Toronto Stock Exchange and is also traded on the New York Stock Exchange as a Foreign Private Issuer, under the symbol “AAV”.
2. Basis of preparation
(a) Statement of compliance
The Corporation prepares its interim consolidated financial statements in accordance with Canadian generally accepted accounting principles (“GAAP”) as defined in the Handbook of the Canadian Institute of Chartered Accountants (“CICA Handbook”). The CICA Handbook incorporates International Financial Reporting Standards (“IFRS”) as issued by the International Accounting Standards Board, including IAS 34, Interim Financial Reporting. The Corporation has consistently applied the same accounting policies as those set out in the audited consolidated financial statements for the year ended December 31, 2015. Certain disclosures included in the notes to the annual consolidated financial statements have been condensed in the following note disclosures or have been disclosed on an annual basis only. Accordingly, these condensed interim consolidated financial statements should be read in conjunction with the audited consolidated financial statements for the year ended December 31, 2015, which have been prepared in accordance with IFRS as issued by the IASB.
The accounting policies applied in these interim consolidated financial statements are based on IFRS issued and outstanding as of November 3, 2016, the date the Board of Directors approved the statements.
(b) Basis of measurement
The interim consolidated financial statements have been prepared on the historical cost basis, except as detailed in the Corporation’s accounting policies in the audited consolidated financial statements for the year ended December 31, 2015.
The methods used to measure fair values of derivative instruments are discussed in note 4.
(c) Functional and presentation currency
These interim consolidated financial statements are presented in Canadian dollars, which is the Corporation’s functional currency.
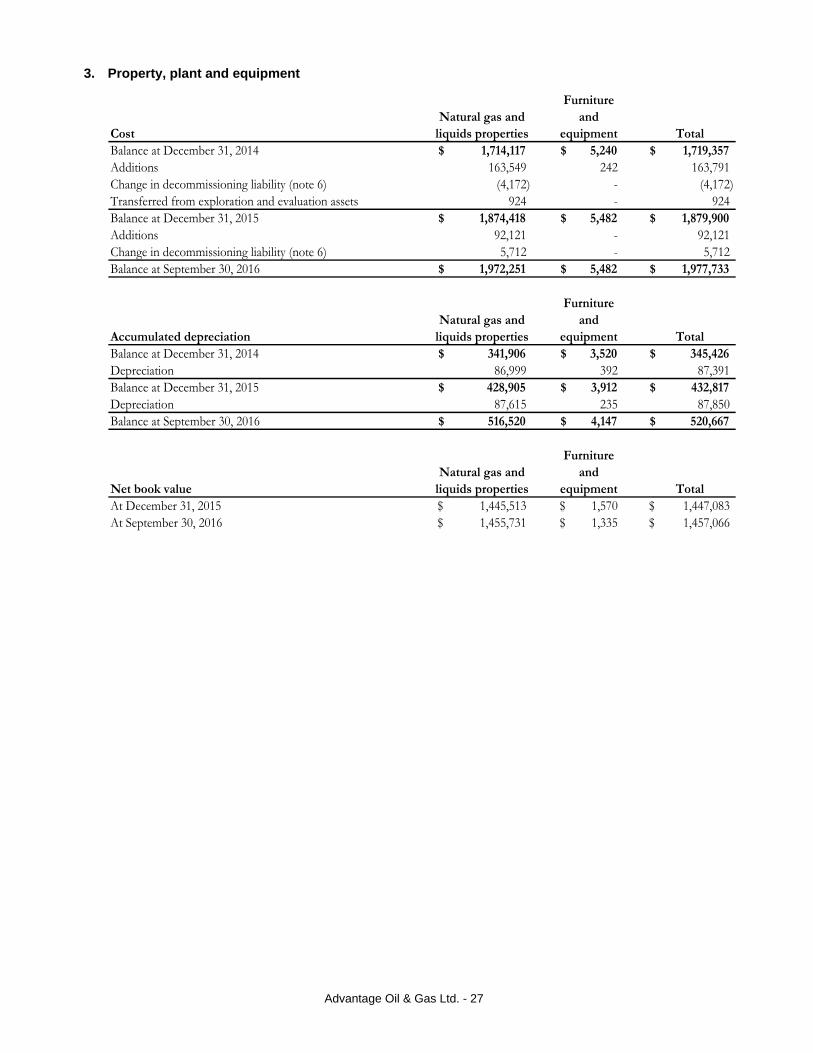
Advantage Oil & Gas Ltd. - 27
3. Property, plant and equipment
CostNatural gas and
liquids properties
Furniture and
equipment TotalBalance at December 31, 2014 1,714,117$ 5,240$ 1,719,357$ Additions 163,549 242 163,791 Change in decommissioning liability (note 6) (4,172) - (4,172) Transferred from exploration and evaluation assets 924 - 924 Balance at December 31, 2015 1,874,418$ 5,482$ 1,879,900$ Additions 92,121 - 92,121 Change in decommissioning liability (note 6) 5,712 - 5,712 Balance at September 30, 2016 1,972,251$ 5,482$ 1,977,733$
Accumulated depreciationNatural gas and
liquids properties
Furniture and
equipment TotalBalance at December 31, 2014 341,906$ 3,520$ 345,426$ Depreciation 86,999 392 87,391 Balance at December 31, 2015 428,905$ 3,912$ 432,817$ Depreciation 87,615 235 87,850 Balance at September 30, 2016 516,520$ 4,147$ 520,667$
Net book valueNatural gas and
liquids properties
Furniture and
equipment TotalAt December 31, 2015 1,445,513$ 1,570$ 1,447,083$ At September 30, 2016 1,455,731$ 1,335$ 1,457,066$
Advantage Oil & Gas Ltd. - 28
4. Financial risk management
Financial instruments of the Corporation include trade and other receivables, deposits, trade and other accrued liabilities, bank indebtedness, and derivative assets and liabilities.
Trade and other receivables and deposits are classified as loans and receivables and measured at amortized cost. Trade and other accrued liabilities and bank indebtedness are all classified as financial liabilities at amortized cost. As at September 30, 2016, there were no significant differences between the carrying amounts reported on the Interim Consolidated Statement of Financial Position and the estimated fair values of these financial instruments due to the short terms to maturity and the floating interest rate on the bank indebtedness.
Fair value is determined following a three level hierarchy:
Level 1: Quoted prices in active markets for identical assets and liabilities. The Corporation does not have any financial assets or liabilities that require level 1 inputs.
Level 2: Inputs other than quoted prices included within Level 1 that are observable, either directly or indirectly. Such inputs can be corroborated with other observable inputs for substantially the complete term of the contract. Derivative assets and liabilities are measured at fair value on a recurring basis. For derivative assets and liabilities, pricing inputs include quoted forward prices for commodities, foreign exchange rates, volatility and risk-free rate discounting, all of which can be observed or corroborated in the marketplace. The actual gains and losses realized on eventual cash settlement can vary materially due to subsequent fluctuations in commodity prices as compared to the valuation assumptions.
Level 3: Under this level, fair value is determined using inputs that are not observable. Advantage has no assets or liabilities that use level 3 inputs.
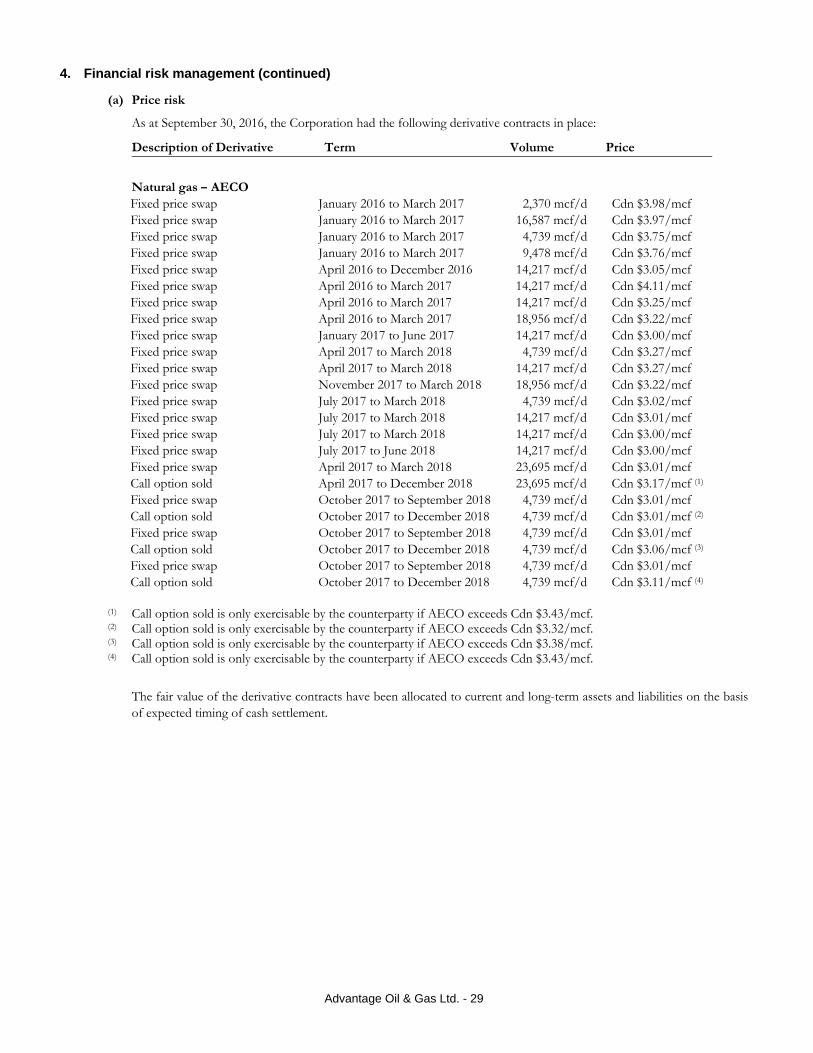
Advantage Oil & Gas Ltd. - 29
4. Financial risk management (continued)
(a) Price risk
As at September 30, 2016, the Corporation had the following derivative contracts in place:
Description of Derivative Term Volume Price
Natural gas – AECO Fixed price swap January 2016 to March 2017 2,370 mcf/d Cdn $3.98/mcfFixed price swap January 2016 to March 2017 16,587 mcf/d Cdn $3.97/mcfFixed price swap January 2016 to March 2017 4,739 mcf/d Cdn $3.75/mcfFixed price swap January 2016 to March 2017 9,478 mcf/d Cdn $3.76/mcfFixed price swap April 2016 to December 2016 14,217 mcf/d Cdn $3.05/mcfFixed price swap April 2016 to March 2017 14,217 mcf/d Cdn $4.11/mcfFixed price swap April 2016 to March 2017 14,217 mcf/d Cdn $3.25/mcfFixed price swap April 2016 to March 2017 18,956 mcf/d Cdn $3.22/mcfFixed price swap January 2017 to June 2017 14,217 mcf/d Cdn $3.00/mcfFixed price swap April 2017 to March 2018 4,739 mcf/d Cdn $3.27/mcfFixed price swap April 2017 to March 2018 14,217 mcf/d Cdn $3.27/mcfFixed price swap November 2017 to March 2018 18,956 mcf/d Cdn $3.22/mcfFixed price swap July 2017 to March 2018 4,739 mcf/d Cdn $3.02/mcfFixed price swap July 2017 to March 2018 14,217 mcf/d Cdn $3.01/mcfFixed price swap July 2017 to March 2018 14,217 mcf/d Cdn $3.00/mcfFixed price swap July 2017 to June 2018 14,217 mcf/d Cdn $3.00/mcfFixed price swap April 2017 to March 2018 23,695 mcf/d Cdn $3.01/mcfCall option sold April 2017 to December 2018 23,695 mcf/d Cdn $3.17/mcf (1)
Fixed price swap October 2017 to September 2018 4,739 mcf/d Cdn $3.01/mcfCall option sold October 2017 to December 2018 4,739 mcf/d Cdn $3.01/mcf (2)
Fixed price swap October 2017 to September 2018 4,739 mcf/d Cdn $3.01/mcfCall option sold October 2017 to December 2018 4,739 mcf/d Cdn $3.06/mcf (3)
Fixed price swap October 2017 to September 2018 4,739 mcf/d Cdn $3.01/mcfCall option sold October 2017 to December 2018 4,739 mcf/d Cdn $3.11/mcf (4)
(1) Call option sold is only exercisable by the counterparty if AECO exceeds Cdn $3.43/mcf. (2) Call option sold is only exercisable by the counterparty if AECO exceeds Cdn $3.32/mcf. (3) Call option sold is only exercisable by the counterparty if AECO exceeds Cdn $3.38/mcf. (4) Call option sold is only exercisable by the counterparty if AECO exceeds Cdn $3.43/mcf.
The fair value of the derivative contracts have been allocated to current and long-term assets and liabilities on the basis of expected timing of cash settlement.
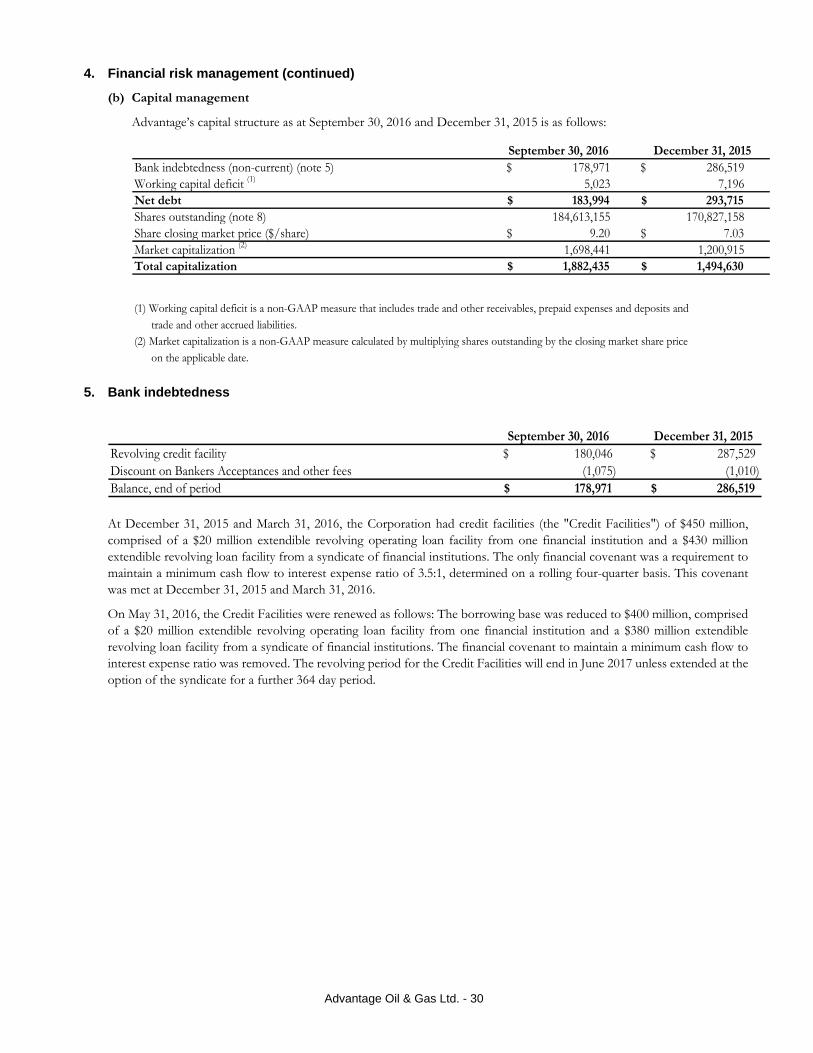
Advantage Oil & Gas Ltd. - 30
4. Financial risk management (continued)
(b) Capital management
Advantage’s capital structure as at September 30, 2016 and December 31, 2015 is as follows:
Bank indebtedness (non-current) (note 5) 178,971$ 286,519$ Working capital deficit (1) 5,023 7,196 Net debt 183,994$ 293,715$ Shares outstanding (note 8) 184,613,155 170,827,158 Share closing market price ($/share) 9.20$ 7.03$ Market capitalization (2) 1,698,441 1,200,915 Total capitalization 1,882,435$ 1,494,630$
trade and other accrued liabilities.
on the applicable date.
December 31, 2015
(1) Working capital deficit is a non-GAAP measure that includes trade and other receivables, prepaid expenses and deposits and
(2) Market capitalization is a non-GAAP measure calculated by multiplying shares outstanding by the closing market share price
September 30, 2016
5. Bank indebtedness
September 30, 2016 December 31, 2015Revolving credit facility 180,046$ 287,529$ Discount on Bankers Acceptances and other fees (1,075) (1,010) Balance, end of period 178,971$ 286,519$
At December 31, 2015 and March 31, 2016, the Corporation had credit facilities (the "Credit Facilities") of $450 million, comprised of a $20 million extendible revolving operating loan facility from one financial institution and a $430 million extendible revolving loan facility from a syndicate of financial institutions. The only financial covenant was a requirement to maintain a minimum cash flow to interest expense ratio of 3.5:1, determined on a rolling four-quarter basis. This covenant was met at December 31, 2015 and March 31, 2016.
On May 31, 2016, the Credit Facilities were renewed as follows: The borrowing base was reduced to $400 million, comprised of a $20 million extendible revolving operating loan facility from one financial institution and a $380 million extendible revolving loan facility from a syndicate of financial institutions. The financial covenant to maintain a minimum cash flow to interest expense ratio was removed. The revolving period for the Credit Facilities will end in June 2017 unless extended at the option of the syndicate for a further 364 day period.
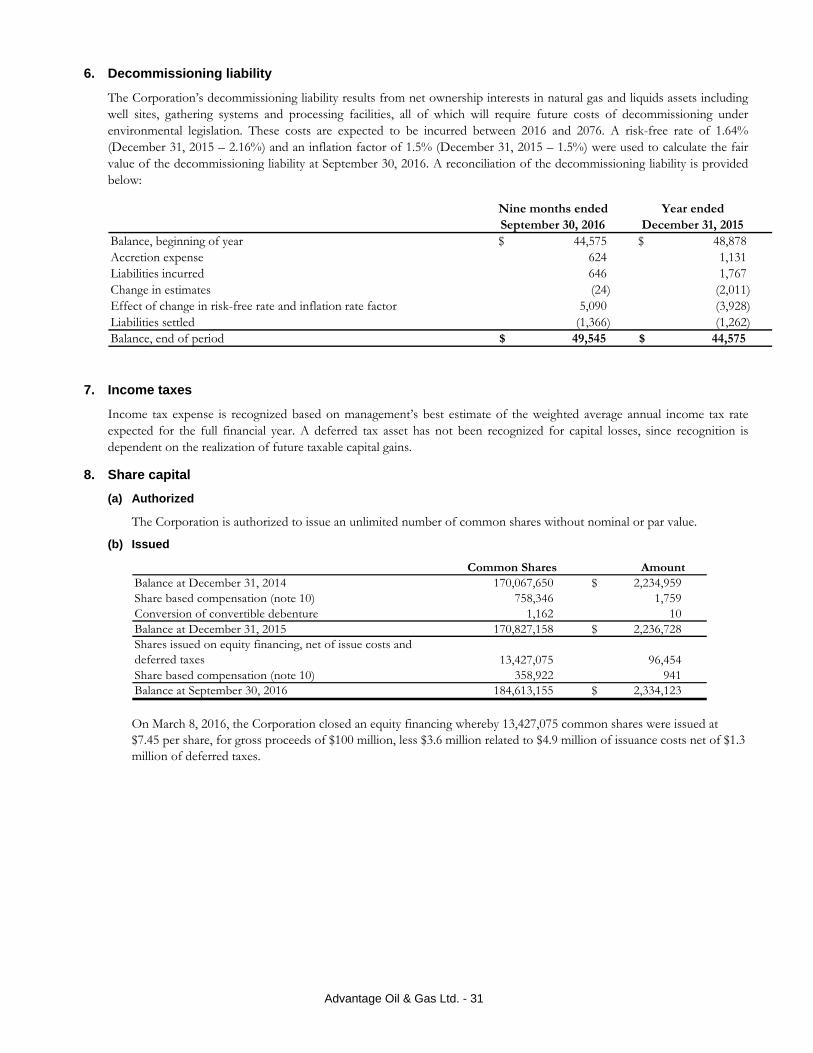
Advantage Oil & Gas Ltd. - 31
6. Decommissioning liability
The Corporation’s decommissioning liability results from net ownership interests in natural gas and liquids assets including well sites, gathering systems and processing facilities, all of which will require future costs of decommissioning under environmental legislation. These costs are expected to be incurred between 2016 and 2076. A risk-free rate of 1.64% (December 31, 2015 – 2.16%) and an inflation factor of 1.5% (December 31, 2015 – 1.5%) were used to calculate the fair value of the decommissioning liability at September 30, 2016. A reconciliation of the decommissioning liability is provided below:
Nine months ended Year endedSeptember 30, 2016 December 31, 2015
Balance, beginning of year 44,575$ 48,878$ Accretion expense 624 1,131 Liabilities incurred 646 1,767 Change in estimates (24) (2,011) Effect of change in risk-free rate and inflation rate factor 5,090 (3,928) Liabilities settled (1,366) (1,262) Balance, end of period 49,545$ 44,575$
7. Income taxes
Income tax expense is recognized based on management’s best estimate of the weighted average annual income tax rate expected for the full financial year. A deferred tax asset has not been recognized for capital losses, since recognition is dependent on the realization of future taxable capital gains.
8. Share capital
(a) Authorized
The Corporation is authorized to issue an unlimited number of common shares without nominal or par value.
(b) Issued
Common Shares AmountBalance at December 31, 2014 170,067,650 2,234,959$ Share based compensation (note 10) 758,346 1,759 Conversion of convertible debenture 1,162 10 Balance at December 31, 2015 170,827,158 2,236,728$
13,427,075 96,454 Share based compensation (note 10) 358,922 941 Balance at September 30, 2016 184,613,155 2,334,123$
Shares issued on equity financing, net of issue costs and deferred taxes
On March 8, 2016, the Corporation closed an equity financing whereby 13,427,075 common shares were issued at
$7.45 per share, for gross proceeds of $100 million, less $3.6 million related to $4.9 million of issuance costs net of $1.3 million of deferred taxes.
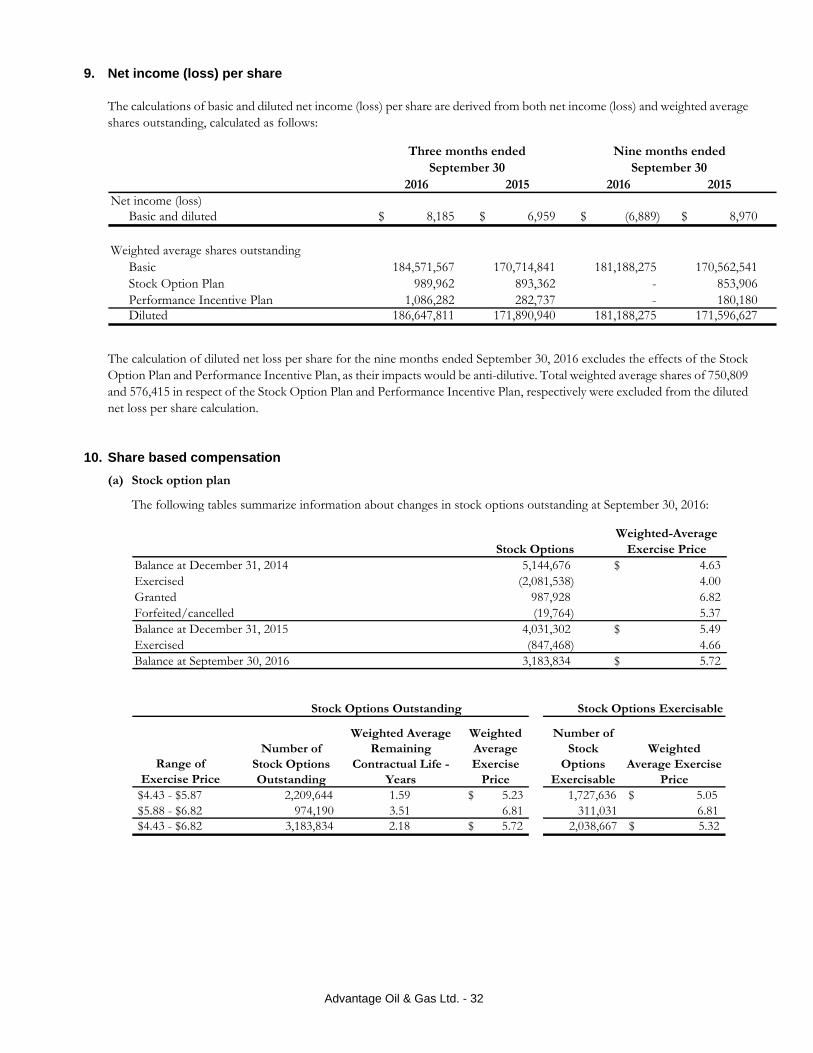
Advantage Oil & Gas Ltd. - 32
9. Net income (loss) per share
The calculations of basic and diluted net income (loss) per share are derived from both net income (loss) and weighted average shares outstanding, calculated as follows:
2016 2015 2016 2015
Basic and diluted 8,185$ 6,959$ (6,889)$ 8,970$
Basic 184,571,567 170,714,841 181,188,275 170,562,541 Stock Option Plan 989,962 893,362 - 853,906 Performance Incentive Plan 1,086,282 282,737 - 180,180 Diluted 186,647,811 171,890,940 181,188,275 171,596,627
Three months ended
Net income (loss)
Weighted average shares outstanding
Nine months endedSeptember 30September 30
The calculation of diluted net loss per share for the nine months ended September 30, 2016 excludes the effects of the Stock Option Plan and Performance Incentive Plan, as their impacts would be anti-dilutive. Total weighted average shares of 750,809 and 576,415 in respect of the Stock Option Plan and Performance Incentive Plan, respectively were excluded from the diluted net loss per share calculation.
10. Share based compensation
(a) Stock option plan
The following tables summarize information about changes in stock options outstanding at September 30, 2016:
Stock OptionsWeighted-Average
Exercise PriceBalance at December 31, 2014 5,144,676 4.63$ Exercised (2,081,538) 4.00 Granted 987,928 6.82 Forfeited/cancelled (19,764) 5.37 Balance at December 31, 2015 4,031,302 5.49$ Exercised (847,468) 4.66 Balance at September 30, 2016 3,183,834 5.72$
Number of Stock Options Outstanding
Weighted Average Remaining
Contractual Life - Years
Weighted Average Exercise
Price
Number of Stock
Options Exercisable
Weighted Average Exercise
Price $4.43 - $5.87 2,209,644 1.59 5.23$ 1,727,636 $ 5.05 $5.88 - $6.82 974,190 3.51 6.81 311,031 6.81 $4.43 - $6.82 3,183,834 2.18 5.72$ 2,038,667 5.32$
Stock Options ExercisableStock Options Outstanding
Range of Exercise Price
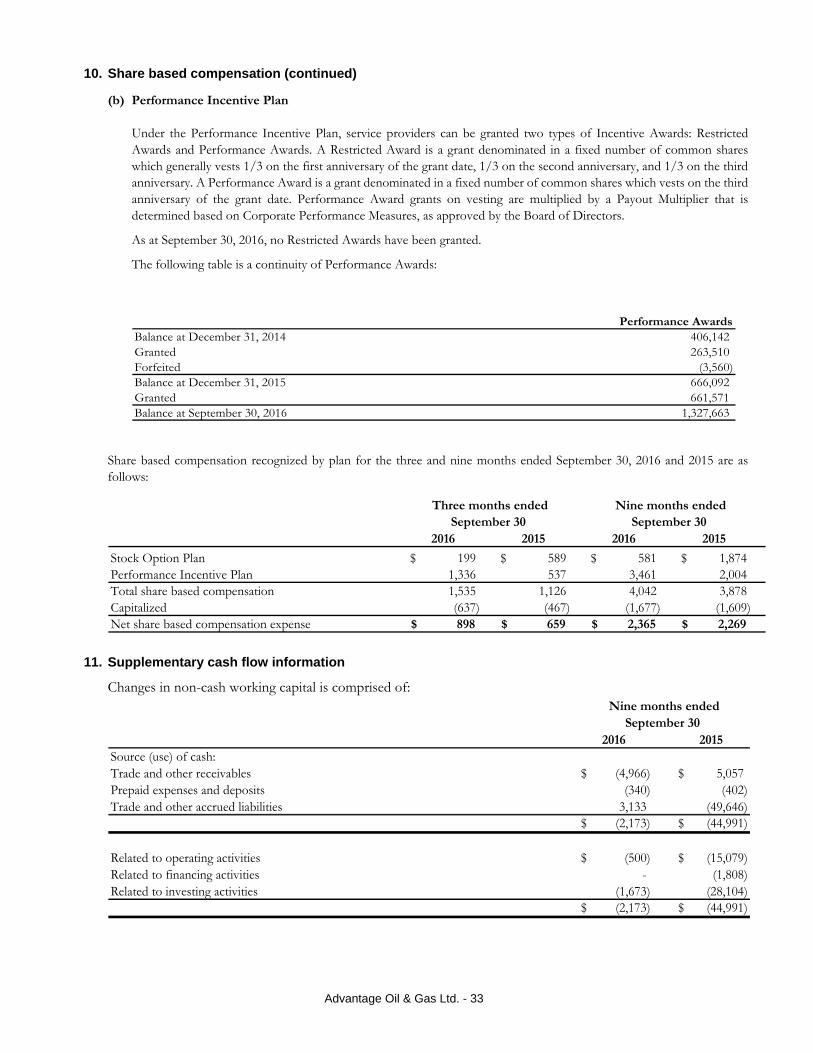
Advantage Oil & Gas Ltd. - 33
10. Share based compensation (continued)
(b) Performance Incentive Plan Under the Performance Incentive Plan, service providers can be granted two types of Incentive Awards: Restricted Awards and Performance Awards. A Restricted Award is a grant denominated in a fixed number of common shares which generally vests 1/3 on the first anniversary of the grant date, 1/3 on the second anniversary, and 1/3 on the third anniversary. A Performance Award is a grant denominated in a fixed number of common shares which vests on the third anniversary of the grant date. Performance Award grants on vesting are multiplied by a Payout Multiplier that is determined based on Corporate Performance Measures, as approved by the Board of Directors.
As at September 30, 2016, no Restricted Awards have been granted.
The following table is a continuity of Performance Awards:
Performance AwardsBalance at December 31, 2014 406,142 Granted 263,510 Forfeited (3,560) Balance at December 31, 2015 666,092 Granted 661,571 Balance at September 30, 2016 1,327,663
Share based compensation recognized by plan for the three and nine months ended September 30, 2016 and 2015 are as follows:
2016 2015 2016 2015
Stock Option Plan 199$ 589$ 581$ 1,874$ Performance Incentive Plan 1,336 537 3,461 2,004 Total share based compensation 1,535 1,126 4,042 3,878 Capitalized (637) (467) (1,677) (1,609) Net share based compensation expense 898$ 659$ 2,365$ 2,269$
Nine months ended Three months ended September 30 September 30
11. Supplementary cash flow information
Changes in non-cash working capital is comprised of:
2016 2015Source (use) of cash: Trade and other receivables (4,966)$ 5,057$ Prepaid expenses and deposits (340) (402) Trade and other accrued liabilities 3,133 (49,646)
(2,173)$ (44,991)$
Related to operating activities (500)$ (15,079)$ Related to financing activities - (1,808) Related to investing activities (1,673) (28,104)
(2,173)$ (44,991)$
Nine months ended September 30
Advantage Oil & Gas Ltd. - 34
Directors
Jill Angevine (1)(3) Stephen E. Balog (1)(2)(3) Grant Fagerheim (2)(3)
Paul G. Haggis (1)(2)(3)
Andy J. Mah Ronald A. McIntosh (2)(3)
(1) Member of Audit Committee (2) Member of Reserve Evaluation Committee (3) Member of Human Resources, Compensation & Corporate Governance
Committee
Officers
Andy J. Mah, President and CEO Craig Blackwood, Vice President, Finance and CFO Neil Bokenfohr, Senior Vice President
Corporate Secretary
Jay P. Reid, Partner Burnet, Duckworth and Palmer LLP
Auditors
PricewaterhouseCoopers LLP
Bankers
The Bank of Nova Scotia National Bank of Canada Royal Bank of Canada Canadian Imperial Bank of Commerce Union Bank, Canada Branch Alberta Treasury Branches Wells Fargo Bank N.A., /Canada Branch
Independent Reserve Evaluators
Sproule Associates Limited
Legal Counsel
Burnet, Duckworth and Palmer LLP
Transfer Agent
Computershare Trust Company of Canada
Abbreviations
bbls - barrels bbls/d - barrels per day boe - barrels of oil equivalent (6 mcf = 1 bbl) boe/d - barrels of oil equivalent per day mcf - thousand cubic feet mcf/d - thousand cubic feet per day mmcf - million cubic feet mmcf/d - million cubic feet per day bcf - billion cubic feet gj - gigajoules NGLs - natural gas liquids WTI - West Texas Intermediate
Corporate Office
300, 440 – 2nd Avenue SW Calgary, Alberta T2P 5E9 (403) 718-8000
Contact Us
Toll free: 1-866-393-0393 Email: [email protected] Visit our website at www.advantageog.com
Stock Exchange Trading Symbol
(Toronto Stock Exchange and New York Stock Exchange)
Shares: AAV


![Inside Kepler.pptx [Read-Only]developer.download.nvidia.com/.../PresentationPDF/... · Power-Aware SMX Architecture Clocks & Feature Size SMX result - ... Area Power 1.0x 1.0x 1.0x](https://img.pdfslide.us/doc/110x75/5f908f10b0fb56519d51966d/inside-read-onlydeveloperdownloadnvidiacompresentationpdf-power-aware.jpg)