Embed Size (px)
Citation preview
Q3 – 2017Interim reportJanuary – September 2017
Contents
Highlights and Group performance 1Outlook for 2017 1
Interim report 5Telenor’s operations 5
Group performance 11
Interim condensed financial information 14Notes to the interim consolidated financial statements 19
Definitions 24
1 TELENOR THIRD QUARTER 2017
Key figures Telenor Group
Third quarter First three quarters Year
(NOK in millions) 2017 2016 2017 2016 2016
Revenues 30 735 31 249 92 663 93 669 125 395
Organic revenue growth (%) 1.0 1.3 1.1 0.8 0.8
EBITDA before other income and other expenses 12 976 12 307 37 157 35 317 45 966
EBITDA before other income and other expenses/Revenues (%) 42.2 39.4 40.1 37.7 36.7
Net income attributable to equity holders of Telenor ASA 5 756 (4 821) 9 758 546 2 832
Capex excl. licences and spectrum/Revenues (%) 12.4 15.6 13.8 16.1 17.4
Capex/Revenues (%) 16.1 16.0 16.3 19.8 20.2
Free cash flow 9 426 9 064 21 539 8 792 10 300
Mobile subscriptions - Change in quarter/Total (mill.) 1.9 (0.7) 176 166 170
With effect from the first quarter 2017, Telenor India is treated as an asset held for sale and discontinued operations in Telenor’s financial reporting.
Third quarter 2017 summary
• Total organic revenues increased by 1%. Organic mobile subscription and traffic revenues increased by 3%.• Reported EBITDA before other items was NOK 13 billion, corresponding to a record high EBITDA margin of 42%, an increase of
3 percentage points from last year. • Capex excluding spectrum licences was NOK 3.8 billion, resulting in a capex to sales ratio of 12%.• Free cash flow for the quarter was NOK 9.4 billion.
Outlook
• Based on the performance in the first nine months of 2017 and our current expectations for the remainder of the year, we keep the financial guidance for 2017. We expect organic revenue growth in the range of 1% to 2%, EBITDA margin of 38% to 39% and capex to sales ratio excluding spectrum licences of 15% to 16%.
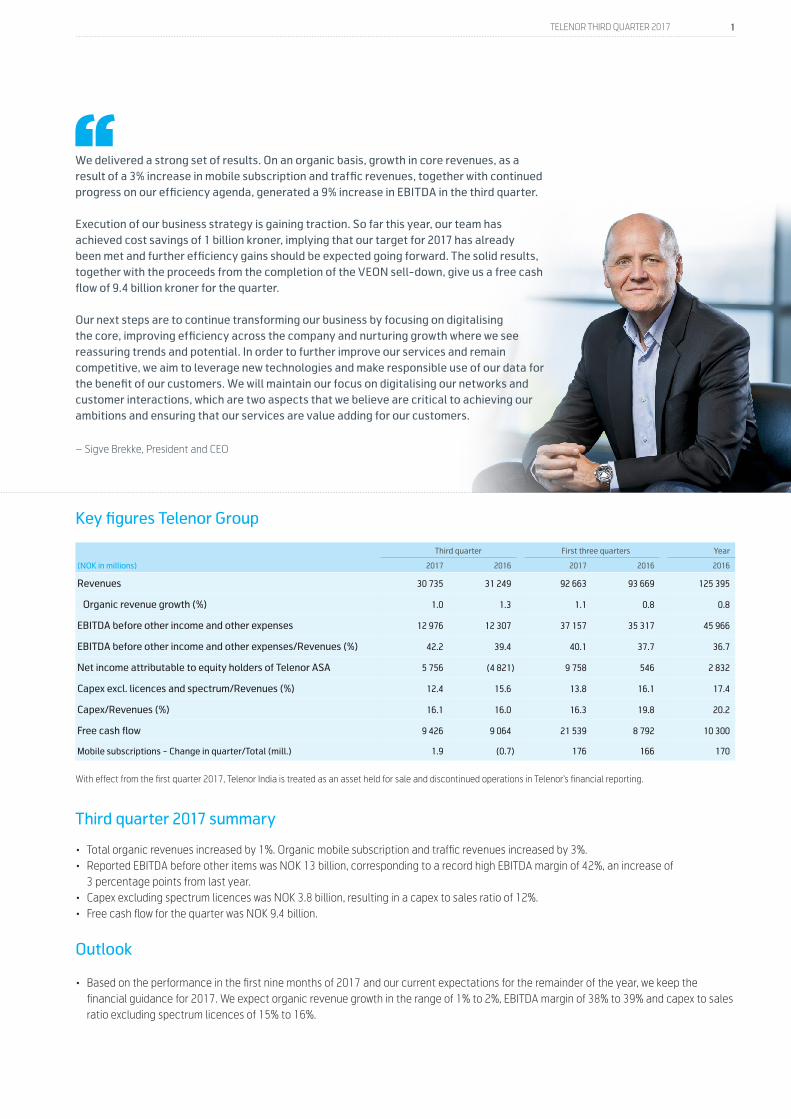
We delivered a strong set of results. On an organic basis, growth in core revenues, as a result of a 3% increase in mobile subscription and traffic revenues, together with continued progress on our efficiency agenda, generated a 9% increase in EBITDA in the third quarter.
Execution of our business strategy is gaining traction. So far this year, our team has achieved cost savings of 1 billion kroner, implying that our target for 2017 has already been met and further efficiency gains should be expected going forward. The solid results, together with the proceeds from the completion of the VEON sell-down, give us a free cash flow of 9.4 billion kroner for the quarter.
Our next steps are to continue transforming our business by focusing on digitalising the core, improving efficiency across the company and nurturing growth where we see reassuring trends and potential. In order to further improve our services and remain competitive, we aim to leverage new technologies and make responsible use of our data for the benefit of our customers. We will maintain our focus on digitalising our networks and customer interactions, which are two aspects that we believe are critical to achieving our ambitions and ensuring that our services are value adding for our customers.
– Sigve Brekke, President and CEO
2 TELENOR THIRD QUARTER 2017
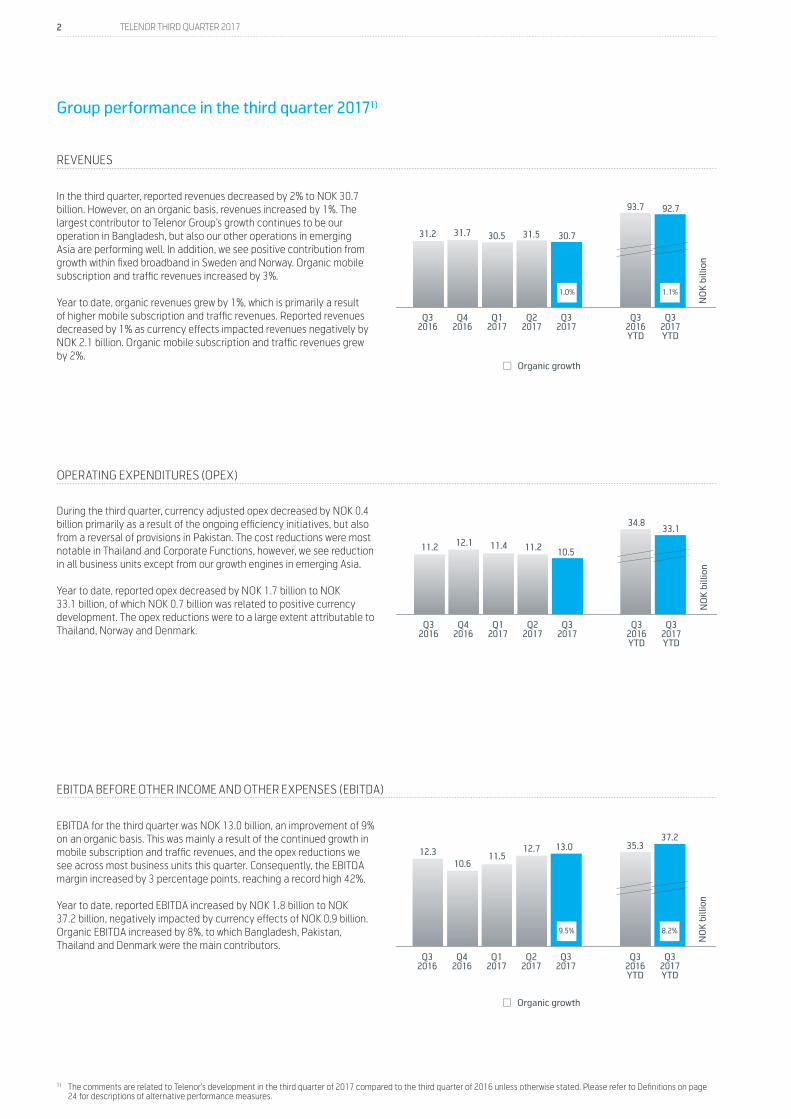
REVENUES
OPERATING EXPENDITURES (OPEX)
EBITDA BEFORE OTHER INCOME AND OTHER EXPENSES (EBITDA)
Group performance in the third quarter 20171)
1) The comments are related to Telenor’s development in the third quarter of 2017 compared to the third quarter of 2016 unless otherwise stated. Please refer to Definitions on page 24 for descriptions of alternative performance measures.
In the third quarter, reported revenues decreased by 2% to NOK 30.7 billion. However, on an organic basis, revenues increased by 1%. The largest contributor to Telenor Group’s growth continues to be our operation in Bangladesh, but also our other operations in emerging Asia are performing well. In addition, we see positive contribution from growth within fixed broadband in Sweden and Norway. Organic mobile subscription and traffic revenues increased by 3%.
Year to date, organic revenues grew by 1%, which is primarily a result of higher mobile subscription and traffic revenues. Reported revenues decreased by 1% as currency effects impacted revenues negatively by NOK 2.1 billion. Organic mobile subscription and traffic revenues grew by 2%.
EBITDA for the third quarter was NOK 13.0 billion, an improvement of 9% on an organic basis. This was mainly a result of the continued growth in mobile subscription and traffic revenues, and the opex reductions we see across most business units this quarter. Consequently, the EBITDA margin increased by 3 percentage points, reaching a record high 42%.
Year to date, reported EBITDA increased by NOK 1.8 billion to NOK 37.2 billion, negatively impacted by currency effects of NOK 0.9 billion. Organic EBITDA increased by 8%, to which Bangladesh, Pakistan, Thailand and Denmark were the main contributors.
During the third quarter, currency adjusted opex decreased by NOK 0.4 billion primarily as a result of the ongoing efficiency initiatives, but also from a reversal of provisions in Pakistan. The cost reductions were most notable in Thailand and Corporate Functions, however, we see reduction in all business units except from our growth engines in emerging Asia.
Year to date, reported opex decreased by NOK 1.7 billion to NOK 33.1 billion, of which NOK 0.7 billion was related to positive currency development. The opex reductions were to a large extent attributable to Thailand, Norway and Denmark.
Revenues
Opex
EBITDA
Capex
Net income
Free cash flow
Mobile
0
10
20
30
40
50
0
14
28
42
56
70
NO
K b
illio
n
Q32016
Q42016
Q12017
Q22017
Q32017
Q32016YTD
Q32017YTD
Q32016
Q42016
Q12017
Q22017
Q32017
Q32016YTD
Q32017YTD
Q32016
Q42016
Q12017
Q22017
Q32017
Q32016YTD
Q32017YTD
Q32016
Q42016
Q12017
Q22017
Q32017
Q32016YTD
Q32017YTD
Q32016
Q42016
Q12017
Q22017
Q32017
Q32016YTD
Q32017YTD
Q32016
Q42016
Q12017
Q22017
Q32017
Q32016YTD
Q32017YTD
31.2 31.7 30.5 31.5 30.7
93.7 92.7
0
5
10
15
20
0
5
10
15
20
25
30
NO
K b
illio
n
11.2 12.1 11.4 11.2 10.5
34.833.1
1.0% 1.1%
0
5
10
15
150,00
156,25
162,50
168,75
175,00
0
5
10
15
20
25
NO
K b
illio
n
12.310.6
11.512.7 13.0 35.3
37.2
5.06.8
4.55.6 5.0
18.6
15.1
-4.8
2.3
4.2
-0.2
5.8
0.5
9.8
9.49.1
1.5 2.2
9.98.8
21.5
9.5% 8.2%
0
5
10
15
0,000000
2,833333
5,666667
8,500000
11,333333
14,166667
17,000000
-5,000000-3,333333-1,6666670,0000001,6666673,3333335,0000006,6666678,333333
10,000000
NO
K b
illio
nN
OK
bill
ion
NO
K b
illio
n
Q32016
Q42016
Q12017
Q22017
Q32017
165.8
169.8172.0
173.9175.8
49% 50% 50% 50% 52%
20
40
60
Q42015
Q12016
Q22016
Q32016
Q42016
203208 211 211
214
0
5
10
15
20
25
Mobile subscriptions of which active data users (%)
Capex Capex/Sales
Organic growth
Organic growth
0
20
40
60
80
16% 21%15% 18% 16%
20% 16%
3 TELENOR THIRD QUARTER 2017
NET INCOME
FREE CASH FLOW
CAPITAL EXPENDITURES (CAPEX)
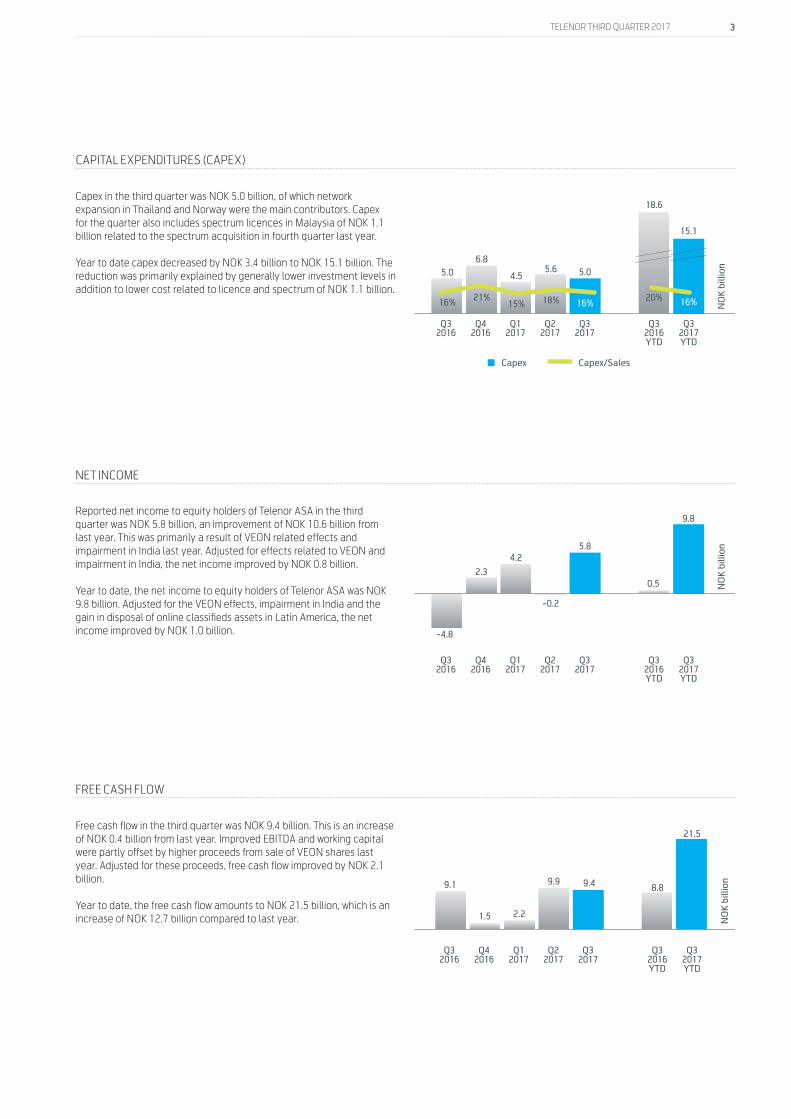
Capex in the third quarter was NOK 5.0 billion, of which network expansion in Thailand and Norway were the main contributors. Capex for the quarter also includes spectrum licences in Malaysia of NOK 1.1 billion related to the spectrum acquisition in fourth quarter last year.
Year to date capex decreased by NOK 3.4 billion to NOK 15.1 billion. The reduction was primarily explained by generally lower investment levels in addition to lower cost related to licence and spectrum of NOK 1.1 billion.
Free cash flow in the third quarter was NOK 9.4 billion. This is an increase of NOK 0.4 billion from last year. Improved EBITDA and working capital were partly offset by higher proceeds from sale of VEON shares last year. Adjusted for these proceeds, free cash flow improved by NOK 2.1 billion.
Year to date, the free cash flow amounts to NOK 21.5 billion, which is an increase of NOK 12.7 billion compared to last year.
Reported net income to equity holders of Telenor ASA in the third quarter was NOK 5.8 billion, an improvement of NOK 10.6 billion from last year. This was primarily a result of VEON related effects and impairment in India last year. Adjusted for effects related to VEON and impairment in India, the net income improved by NOK 0.8 billion.
Year to date, the net income to equity holders of Telenor ASA was NOK 9.8 billion. Adjusted for the VEON effects, impairment in India and the gain in disposal of online classifieds assets in Latin America, the net income improved by NOK 1.0 billion.
Revenues
Opex
EBITDA
Capex
Net income
Free cash flow
Mobile
0
10
20
30
40
50
0
14
28
42
56
70
NO
K b
illio
n
Q32016
Q42016
Q12017
Q22017
Q32017
Q32016YTD
Q32017YTD
Q32016
Q42016
Q12017
Q22017
Q32017
Q32016YTD
Q32017YTD
Q32016
Q42016
Q12017
Q22017
Q32017
Q32016YTD
Q32017YTD
Q32016
Q42016
Q12017
Q22017
Q32017
Q32016YTD
Q32017YTD
Q32016
Q42016
Q12017
Q22017
Q32017
Q32016YTD
Q32017YTD
Q32016
Q42016
Q12017
Q22017
Q32017
Q32016YTD
Q32017YTD
31.2 31.7 30.5 31.5 30.7
93.7 92.7
0
5
10
15
20
0
5
10
15
20
25
30
NO
K b
illio
n
11.2 12.1 11.4 11.2 10.5
34.833.1
1.0% 1.1%
0
5
10
15
150,00
156,25
162,50
168,75
175,00
0
5
10
15
20
25
NO
K b
illio
n
12.310.6
11.512.7 13.0 35.3
37.2
5.06.8
4.55.6 5.0
18.6
15.1
-4.8
2.3
4.2
-0.2
5.8
0.5
9.8
9.49.1
1.5 2.2
9.98.8
21.5
9.5% 8.2%
0
5
10
15
0,000000
2,833333
5,666667
8,500000
11,333333
14,166667
17,000000
-5,000000-3,333333-1,6666670,0000001,6666673,3333335,0000006,6666678,333333
10,000000
NO
K b
illio
nN
OK
bill
ion
NO
K b
illio
n
Q32016
Q42016
Q12017
Q22017
Q32017
165.8
169.8172.0
173.9175.8
49% 50% 50% 50% 52%
20
40
60
Q42015
Q12016
Q22016
Q32016
Q42016
203208 211 211
214
0
5
10
15
20
25
Mobile subscriptions of which active data users (%)
Capex Capex/Sales
Organic growth
Organic growth
0
20
40
60
80
16% 21%15% 18% 16%
20% 16%
4 TELENOR THIRD QUARTER 2017
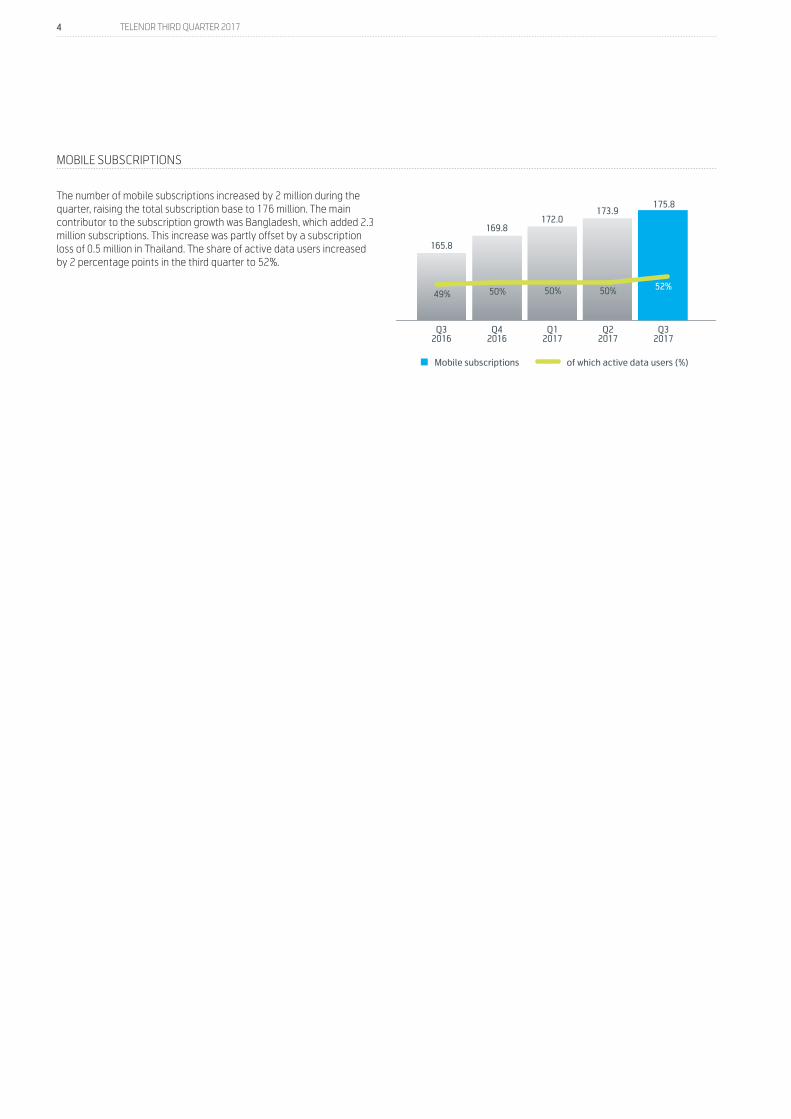
The number of mobile subscriptions increased by 2 million during the quarter, raising the total subscription base to 176 million. The main contributor to the subscription growth was Bangladesh, which added 2.3 million subscriptions. This increase was partly offset by a subscription loss of 0.5 million in Thailand. The share of active data users increased by 2 percentage points in the third quarter to 52%.
MOBILE SUBSCRIPTIONS
Revenues
Opex
EBITDA
Capex
Net income
Free cash flow
Mobile
0
10
20
30
40
50
0
14
28
42
56
70
NO
K b
illio
n
Q32016
Q42016
Q12017
Q22017
Q32017
Q32016YTD
Q32017YTD
Q32016
Q42016
Q12017
Q22017
Q32017
Q32016YTD
Q32017YTD
Q32016
Q42016
Q12017
Q22017
Q32017
Q32016YTD
Q32017YTD
Q32016
Q42016
Q12017
Q22017
Q32017
Q32016YTD
Q32017YTD
Q32016
Q42016
Q12017
Q22017
Q32017
Q32016YTD
Q32017YTD
Q32016
Q42016
Q12017
Q22017
Q32017
Q32016YTD
Q32017YTD
31.2 31.7 30.5 31.5 30.7
93.7 92.7
0
5
10
15
20
0
5
10
15
20
25
30
NO
K b
illio
n
11.2 12.1 11.4 11.2 10.5
34.833.1
1.0% 1.1%
0
5
10
15
150,00
156,25
162,50
168,75
175,00
0
5
10
15
20
25
NO
K b
illio
n
12.310.6
11.512.7 13.0 35.3
37.2
5.06.8
4.55.6 5.0
18.6
15.1
-4.8
2.3
4.2
-0.2
5.8
0.5
9.8
9.49.1
1.5 2.2
9.98.8
21.5
9.5% 8.2%
0
5
10
15
0,000000
2,833333
5,666667
8,500000
11,333333
14,166667
17,000000
-5,000000-3,333333-1,6666670,0000001,6666673,3333335,0000006,6666678,333333
10,000000
NO
K b
illio
nN
OK
bill
ion
NO
K b
illio
n
Q32016
Q42016
Q12017
Q22017
Q32017
165.8
169.8172.0
173.9175.8
49% 50% 50% 50% 52%
20
40
60
Q42015
Q12016
Q22016
Q32016
Q42016
203208 211 211
214
0
5
10
15
20
25
Mobile subscriptions of which active data users (%)
Capex Capex/Sales
Organic growth
Organic growth
0
20
40
60
80
16% 21%15% 18% 16%
20% 16%
5 TELENOR THIRD QUARTER 2017
Norway
Third quarter First three quarters Year
(NOK in millions)2017 2016
Restated*2017 2016
Restated*2016
Restated*
Revenues mobile operation
Subscription and traffic 2 852 2 892 8 283 8 514 11 288
Interconnect revenues 135 144 412 444 585
Other mobile revenues 320 288 869 797 1 064
Non-mobile revenues 498 517 1 492 1 413 2 114
Total revenues mobile operation 3 804 3 841 11 056 11 169 15 052
Revenues fixed operation
Telephony 362 435 1 150 1 378 1 806
Internet and TV 1 495 1 371 4 343 4 039 5 446
Data services 124 123 372 376 503
Other fixed revenues 357 378 1 190 1 231 1 715
Total retail revenues 2 337 2 308 7 055 7 024 9 470
Wholesale revenues 367 367 1 092 1 140 1 508
Total revenues fixed operation 2 704 2 675 8 148 8 165 10 978
Total revenues 6 509 6 516 19 203 19 333 26 030
Operating expenditures 2 186 2 243 6 803 7 049 9 493
EBITDA before other items 2 973 2 906 8 391 8 303 10 946
Operating profit 1 990 1 919 5 420 5 366 6 726
EBITDA before other items/Total revenues (%) 45.7 44.6 43.7 42.9 42.1
Capex 1 181 1 175 3 891 3 267 4 780
Investments in businesses 198 - 211 100 100
Statistics (monthly in NOK):
Mobile ARPU 332 327 320 319 319
Fixed Telephony ARPU 242 253 247 259 259
Fixed Internet ARPU 375 359 365 349 352
TV ARPU 320 283 309 282 284
No. of subscriptions - Change in quarter/Total (in thousands):
Mobile (13) (24) 2 994 3 081 3 066
Fixed telephony (16) (17) 491 564 546
Fixed Internet 1 - 863 859 865
TV (1) 6 546 533 541
* Refer to note 9.
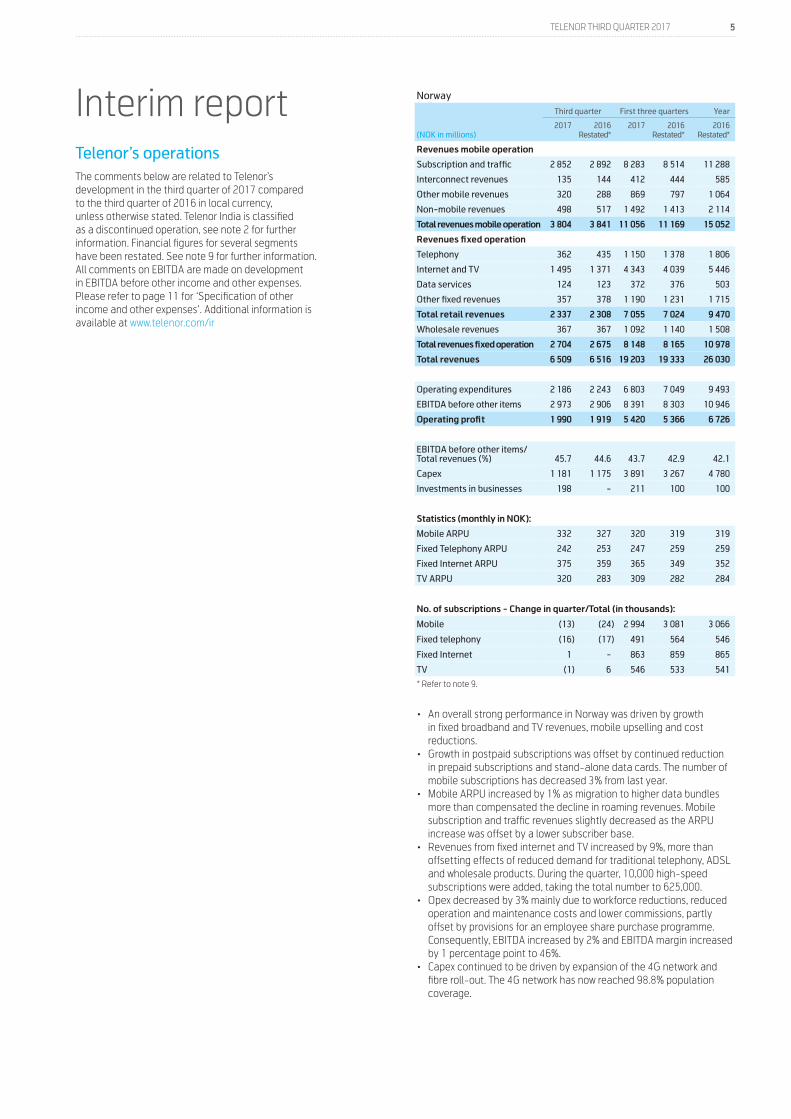
• An overall strong performance in Norway was driven by growth in fixed broadband and TV revenues, mobile upselling and cost reductions.
• Growth in postpaid subscriptions was offset by continued reduction in prepaid subscriptions and stand-alone data cards. The number of mobile subscriptions has decreased 3% from last year.
• Mobile ARPU increased by 1% as migration to higher data bundles more than compensated the decline in roaming revenues. Mobile subscription and traffic revenues slightly decreased as the ARPU increase was offset by a lower subscriber base.
• Revenues from fixed internet and TV increased by 9%, more than offsetting effects of reduced demand for traditional telephony, ADSL and wholesale products. During the quarter, 10,000 high-speed subscriptions were added, taking the total number to 625,000.
• Opex decreased by 3% mainly due to workforce reductions, reduced operation and maintenance costs and lower commissions, partly offset by provisions for an employee share purchase programme. Consequently, EBITDA increased by 2% and EBITDA margin increased by 1 percentage point to 46%.
• Capex continued to be driven by expansion of the 4G network and fibre roll-out. The 4G network has now reached 98.8% population coverage.
Interim report Telenor’s operations The comments below are related to Telenor’s development in the third quarter of 2017 compared to the third quarter of 2016 in local currency, unless otherwise stated. Telenor India is classified as a discontinued operation, see note 2 for further information. Financial figures for several segments have been restated. See note 9 for further information. All comments on EBITDA are made on development in EBITDA before other income and other expenses. Please refer to page 11 for ‘Specification of other income and other expenses’. Additional information is available at www.telenor.com/ir
6 TELENOR THIRD QUARTER 2017
Sweden
Third quarter First three quarters Year
(NOK in millions)2017 2016
Restated*2017 2016
Restated*2016
Restated*
Revenues mobile operation
Subscription and traffic 1 574 1 546 4 565 4 691 5 926
Interconnect revenues 133 139 459 430 557
Other mobile revenues 104 94 277 265 351
Non-mobile revenues 505 492 1 485 1 434 2 256
Total revenues mobile operation 2 316 2 271 6 787 6 820 9 090
Revenues fixed operation
Telephony 70 78 219 271 346
Internet and TV 675 617 1 954 1 855 2 492
Data services 49 42 148 132 171
Other fixed revenues 75 24 190 72 97
Total retail revenues 869 761 2 510 2 331 3 106
Wholesale revenues 44 46 126 142 188
Total revenues fixed operation 912 808 2 637 2 473 3 294
Total revenues 3 229 3 078 9 424 9 294 12 384
Operating expenditures 975 1 001 3 135 3 258 4 375
EBITDA before other items 1 141 1 040 3 070 2 924 3 538
Operating profit 790 651 2 003 1 716 1 759
EBITDA before other items/Total revenues (%) 35.3 33.8 32.6 31.5 28.6
Capex 346 303 1 079 974 1 560
Investments in businesses 1 - 113 - -
Statistics (monthly in NOK):
Mobile ARPU 213 219 210 223 210
Fixed Telephony ARPU 65 72 68 78 75
Fixed Internet ARPU 215 215 212 220 216
TV ARPU 142 125 136 122 122
No. of subscriptions - Change in quarter/Total (in thousands):
Mobile 21 35 2 682 2 590 2 624
Fixed telephony (7) (8) 194 222 215
Fixed Internet 6 4 680 651 657
TV 8 3 476 490 469
Exchange rate (SEK) 0.9637 1.0003 0.9814
* Refer to note 9.
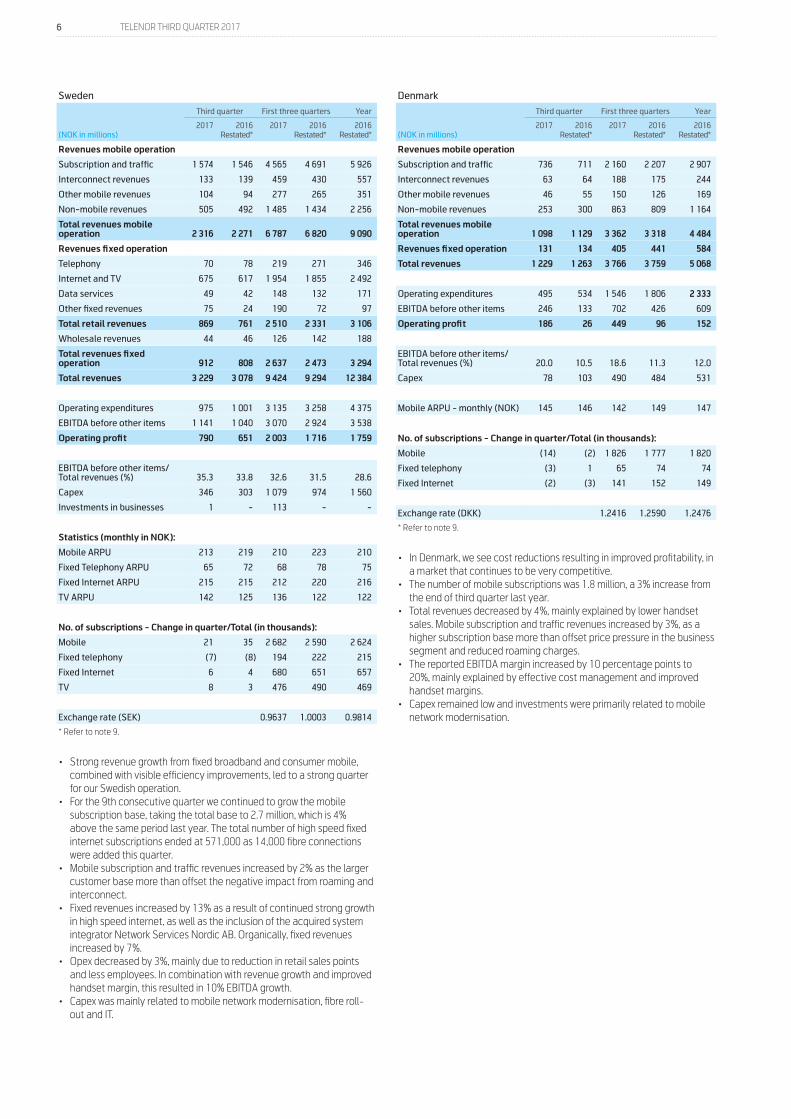
• Strong revenue growth from fixed broadband and consumer mobile, combined with visible efficiency improvements, led to a strong quarter for our Swedish operation.
• For the 9th consecutive quarter we continued to grow the mobile subscription base, taking the total base to 2.7 million, which is 4% above the same period last year. The total number of high speed fixed internet subscriptions ended at 571,000 as 14,000 fibre connections were added this quarter.
• Mobile subscription and traffic revenues increased by 2% as the larger customer base more than offset the negative impact from roaming and interconnect.
• Fixed revenues increased by 13% as a result of continued strong growth in high speed internet, as well as the inclusion of the acquired system integrator Network Services Nordic AB. Organically, fixed revenues increased by 7%.
• Opex decreased by 3%, mainly due to reduction in retail sales points and less employees. In combination with revenue growth and improved handset margin, this resulted in 10% EBITDA growth.
• Capex was mainly related to mobile network modernisation, fibre roll-out and IT.
Denmark
Third quarter First three quarters Year
(NOK in millions)2017 2016
Restated*2017 2016
Restated*2016
Restated*
Revenues mobile operation
Subscription and traffic 736 711 2 160 2 207 2 907
Interconnect revenues 63 64 188 175 244
Other mobile revenues 46 55 150 126 169
Non-mobile revenues 253 300 863 809 1 164
Total revenues mobile operation 1 098 1 129 3 362 3 318 4 484
Revenues fixed operation 131 134 405 441 584
Total revenues 1 229 1 263 3 766 3 759 5 068
Operating expenditures 495 534 1 546 1 806 2 333
EBITDA before other items 246 133 702 426 609
Operating profit 186 26 449 96 152
EBITDA before other items/Total revenues (%) 20.0 10.5 18.6 11.3 12.0
Capex 78 103 490 484 531
Mobile ARPU - monthly (NOK) 145 146 142 149 147
No. of subscriptions - Change in quarter/Total (in thousands):
Mobile (14) (2) 1 826 1 777 1 820
Fixed telephony (3) 1 65 74 74
Fixed Internet (2) (3) 141 152 149
Exchange rate (DKK) 1.2416 1.2590 1.2476
* Refer to note 9.
• In Denmark, we see cost reductions resulting in improved profitability, in a market that continues to be very competitive.
• The number of mobile subscriptions was 1.8 million, a 3% increase from the end of third quarter last year.
• Total revenues decreased by 4%, mainly explained by lower handset sales. Mobile subscription and traffic revenues increased by 3%, as a higher subscription base more than offset price pressure in the business segment and reduced roaming charges.
• The reported EBITDA margin increased by 10 percentage points to 20%, mainly explained by effective cost management and improved handset margins.
• Capex remained low and investments were primarily related to mobile network modernisation.
7 TELENOR THIRD QUARTER 2017
Hungary
Third quarter First three quarters Year
(NOK in millions) 2017 2016 2017 2016 2016
Revenues
Subscription and traffic 955 906 2 732 2 698 3 561
Interconnect revenues 69 67 202 202 269
Other mobile revenues 33 23 73 61 80
Non-mobile revenues 138 128 390 380 526
Total revenues 1 195 1 124 3 397 3 342 4 436
Operating expenditures 365 364 1 100 1 172 1 576
EBITDA before other items 415 389 1 161 1 075 1 369
Operating profit 289 239 760 602 773
EBITDA before other items/ Total revenues (%) 34.8 34.6 34.2 32.2 30.9
Capex 119 104 221 227 390
No. of subscriptions - Change in quarter/Total (in thousands): (39) 10 3 082 3 189 3 148
ARPU - monthly (NOK) 109 102 104 102 101
Exchange rate (HUF) 0.0299 0.0300 0.0298
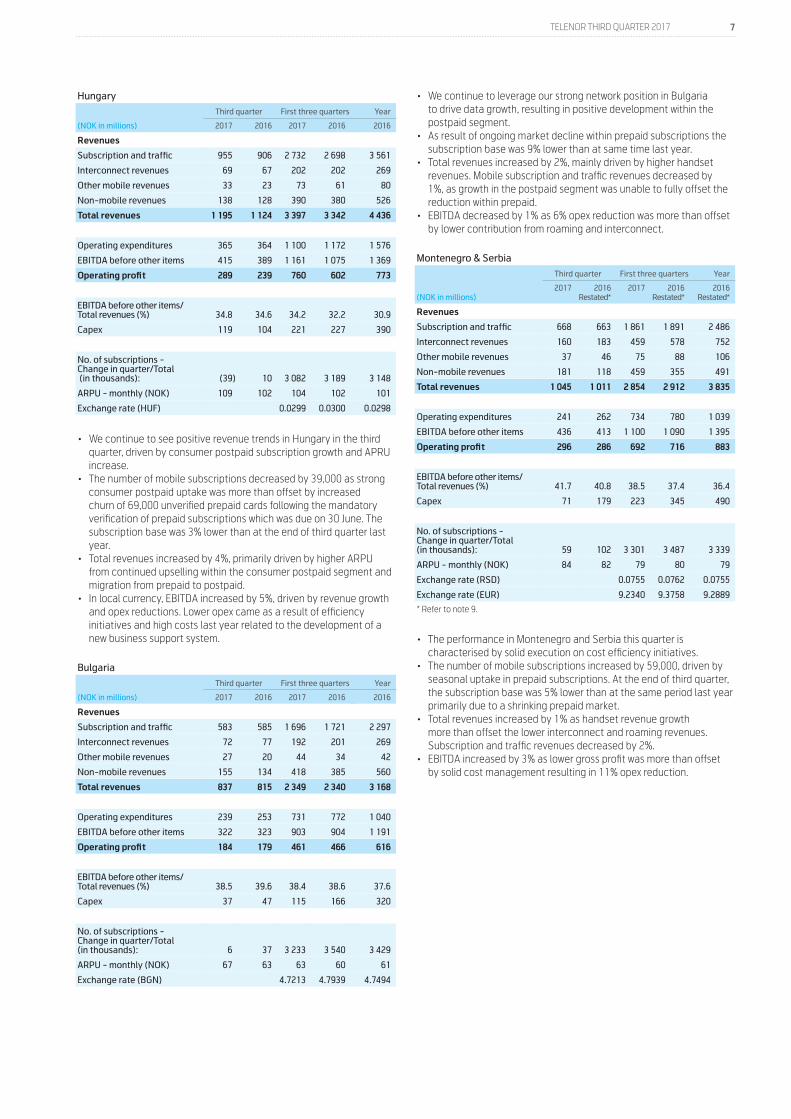
• We continue to see positive revenue trends in Hungary in the third quarter, driven by consumer postpaid subscription growth and APRU increase.
• The number of mobile subscriptions decreased by 39,000 as strong consumer postpaid uptake was more than offset by increased churn of 69,000 unverified prepaid cards following the mandatory verification of prepaid subscriptions which was due on 30 June. The subscription base was 3% lower than at the end of third quarter last year.
• Total revenues increased by 4%, primarily driven by higher ARPU from continued upselling within the consumer postpaid segment and migration from prepaid to postpaid.
• In local currency, EBITDA increased by 5%, driven by revenue growth and opex reductions. Lower opex came as a result of efficiency initiatives and high costs last year related to the development of a new business support system.
Bulgaria
Third quarter First three quarters Year
(NOK in millions) 2017 2016 2017 2016 2016
Revenues
Subscription and traffic 583 585 1 696 1 721 2 297
Interconnect revenues 72 77 192 201 269
Other mobile revenues 27 20 44 34 42
Non-mobile revenues 155 134 418 385 560
Total revenues 837 815 2 349 2 340 3 168
Operating expenditures 239 253 731 772 1 040
EBITDA before other items 322 323 903 904 1 191
Operating profit 184 179 461 466 616
EBITDA before other items/ Total revenues (%) 38.5 39.6 38.4 38.6 37.6
Capex 37 47 115 166 320
No. of subscriptions - Change in quarter/Total (in thousands): 6 37 3 233 3 540 3 429
ARPU - monthly (NOK) 67 63 63 60 61
Exchange rate (BGN) 4.7213 4.7939 4.7494
• We continue to leverage our strong network position in Bulgaria to drive data growth, resulting in positive development within the postpaid segment.
• As result of ongoing market decline within prepaid subscriptions the subscription base was 9% lower than at same time last year.
• Total revenues increased by 2%, mainly driven by higher handset revenues. Mobile subscription and traffic revenues decreased by 1%, as growth in the postpaid segment was unable to fully offset the reduction within prepaid.
• EBITDA decreased by 1% as 6% opex reduction was more than offset by lower contribution from roaming and interconnect.
Montenegro & Serbia
Third quarter First three quarters Year
(NOK in millions)2017 2016
Restated*2017 2016
Restated*2016
Restated*
Revenues
Subscription and traffic 668 663 1 861 1 891 2 486
Interconnect revenues 160 183 459 578 752
Other mobile revenues 37 46 75 88 106
Non-mobile revenues 181 118 459 355 491
Total revenues 1 045 1 011 2 854 2 912 3 835
Operating expenditures 241 262 734 780 1 039
EBITDA before other items 436 413 1 100 1 090 1 395
Operating profit 296 286 692 716 883
EBITDA before other items/ Total revenues (%) 41.7 40.8 38.5 37.4 36.4
Capex 71 179 223 345 490
No. of subscriptions - Change in quarter/Total (in thousands): 59 102 3 301 3 487 3 339
ARPU - monthly (NOK) 84 82 79 80 79
Exchange rate (RSD) 0.0755 0.0762 0.0755
Exchange rate (EUR) 9.2340 9.3758 9.2889
* Refer to note 9.
• The performance in Montenegro and Serbia this quarter is characterised by solid execution on cost efficiency initiatives.
• The number of mobile subscriptions increased by 59,000, driven by seasonal uptake in prepaid subscriptions. At the end of third quarter, the subscription base was 5% lower than at the same period last year primarily due to a shrinking prepaid market.
• Total revenues increased by 1% as handset revenue growth more than offset the lower interconnect and roaming revenues. Subscription and traffic revenues decreased by 2%.
• EBITDA increased by 3% as lower gross profit was more than offset by solid cost management resulting in 11% opex reduction.
8 TELENOR THIRD QUARTER 2017
dtac - Thailand
Third quarter First three quarters Year
(NOK in millions) 2017 2016 2017 2016 2016
Revenues
Subscription and traffic 3 778 3 848 11 640 11 481 15 237
Interconnect revenues 201 269 633 827 1 085
Other mobile revenues 29 21 139 137 174
Non-mobile revenues 479 533 1 645 2 116 3 151
Total revenues 4 487 4 671 14 056 14 561 19 647
Operating expenditures 1 664 1 803 5 207 5 576 7 404
EBITDA before other items 1 846 1 727 5 475 5 046 6 645
Operating profit 282 341 858 1 030 1 160
EBITDA before other items/Total revenues (%) 41.1 37.0 39.0 34.7 33.8
Capex 840 1 280 2 939 3 422 4 835
No. of subscriptions - Change in quarter/Total (in thousands): (492) (132)
23 112 24 820 24 480
ARPU - monthly (NOK) 57 55 57 54 54
Exchange rate (THB) 0.2422 0.2385 0.2381
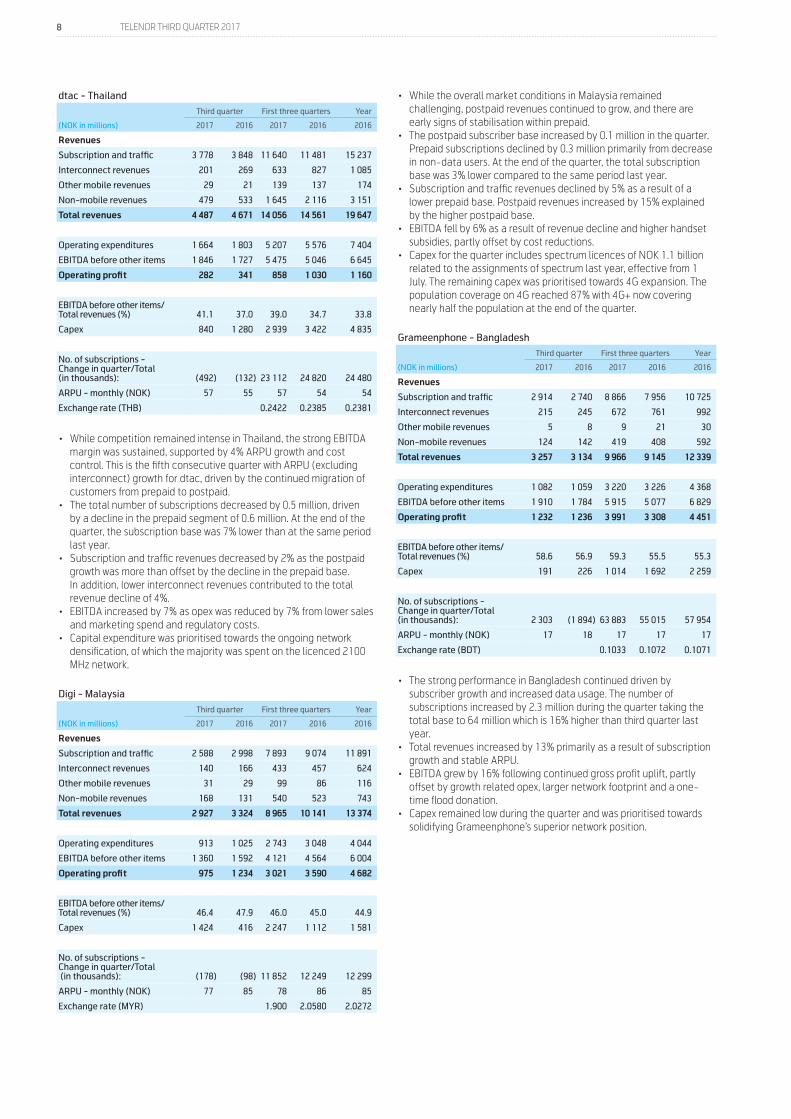
• While competition remained intense in Thailand, the strong EBITDA margin was sustained, supported by 4% ARPU growth and cost control. This is the fifth consecutive quarter with ARPU (excluding interconnect) growth for dtac, driven by the continued migration of customers from prepaid to postpaid.
• The total number of subscriptions decreased by 0.5 million, driven by a decline in the prepaid segment of 0.6 million. At the end of the quarter, the subscription base was 7% lower than at the same period last year.
• Subscription and traffic revenues decreased by 2% as the postpaid growth was more than offset by the decline in the prepaid base. In addition, lower interconnect revenues contributed to the total revenue decline of 4%.
• EBITDA increased by 7% as opex was reduced by 7% from lower sales and marketing spend and regulatory costs.
• Capital expenditure was prioritised towards the ongoing network densification, of which the majority was spent on the licenced 2100 MHz network.
Digi - Malaysia
Third quarter First three quarters Year
(NOK in millions) 2017 2016 2017 2016 2016
Revenues
Subscription and traffic 2 588 2 998 7 893 9 074 11 891
Interconnect revenues 140 166 433 457 624
Other mobile revenues 31 29 99 86 116
Non-mobile revenues 168 131 540 523 743
Total revenues 2 927 3 324 8 965 10 141 13 374
Operating expenditures 913 1 025 2 743 3 048 4 044
EBITDA before other items 1 360 1 592 4 121 4 564 6 004
Operating profit 975 1 234 3 021 3 590 4 682
EBITDA before other items/Total revenues (%) 46.4 47.9 46.0 45.0 44.9
Capex 1 424 416 2 247 1 112 1 581
No. of subscriptions - Change in quarter/Total (in thousands): (178) (98)
11 852 12 249 12 299
ARPU - monthly (NOK) 77 85 78 86 85
Exchange rate (MYR) 1.900 2.0580 2.0272
• While the overall market conditions in Malaysia remained challenging, postpaid revenues continued to grow, and there are early signs of stabilisation within prepaid.
• The postpaid subscriber base increased by 0.1 million in the quarter. Prepaid subscriptions declined by 0.3 million primarily from decrease in non-data users. At the end of the quarter, the total subscription base was 3% lower compared to the same period last year.
• Subscription and traffic revenues declined by 5% as a result of a lower prepaid base. Postpaid revenues increased by 15% explained by the higher postpaid base.
• EBITDA fell by 6% as a result of revenue decline and higher handset subsidies, partly offset by cost reductions.
• Capex for the quarter includes spectrum licences of NOK 1.1 billion related to the assignments of spectrum last year, effective from 1 July. The remaining capex was prioritised towards 4G expansion. The population coverage on 4G reached 87% with 4G+ now covering nearly half the population at the end of the quarter.
Grameenphone - Bangladesh
Third quarter First three quarters Year
(NOK in millions) 2017 2016 2017 2016 2016
Revenues
Subscription and traffic 2 914 2 740 8 866 7 956 10 725
Interconnect revenues 215 245 672 761 992
Other mobile revenues 5 8 9 21 30
Non-mobile revenues 124 142 419 408 592
Total revenues 3 257 3 134 9 966 9 145 12 339
Operating expenditures 1 082 1 059 3 220 3 226 4 368
EBITDA before other items 1 910 1 784 5 915 5 077 6 829
Operating profit 1 232 1 236 3 991 3 308 4 451
EBITDA before other items/Total revenues (%) 58.6 56.9 59.3 55.5 55.3
Capex 191 226 1 014 1 692 2 259
No. of subscriptions - Change in quarter/Total (in thousands): 2 303 (1 894)
63 883 55 015 57 954
ARPU - monthly (NOK) 17 18 17 17 17
Exchange rate (BDT) 0.1033 0.1072 0.1071
• The strong performance in Bangladesh continued driven by subscriber growth and increased data usage. The number of subscriptions increased by 2.3 million during the quarter taking the total base to 64 million which is 16% higher than third quarter last year.
• Total revenues increased by 13% primarily as a result of subscription growth and stable ARPU.
• EBITDA grew by 16% following continued gross profit uplift, partly offset by growth related opex, larger network footprint and a one-time flood donation.
• Capex remained low during the quarter and was prioritised towards solidifying Grameenphone’s superior network position.
9 TELENOR THIRD QUARTER 2017
Pakistan
Third quarter First three quarters Year
(NOK in millions)2017 2016
Restated*2017 2016
Restated*2016
Restated*
Revenues
Subscription and traffic 1 671 1 574 5 041 4 703 6 315
Interconnect revenues 291 295 892 865 1 162
Other mobile revenues 5 6 14 (31) (25)
Non-mobile revenues 64 58 225 185 247
Total revenues 2 031 1 933 6 173 5 722 7 698
Operating expenditures 539 721 2 073 2 210 3 050
EBITDA before other items 1 232 920 3 237 2 597 3 441
Operating profit 875 585 2 126 1 695 2 166
EBITDA before other items/Total revenues (%) 60.6 47.6 52.4 45.4 44.7
Capex 207 300 906 4 277 4 898
No. of subscriptions - Change in quarter/Total (in thousands): (96) 319
40 701 38 233 39 428
ARPU - monthly (NOK) 16 16 16 17 17
Exchange rate (PKR) 0.0790 0.0803 0.0802
* Refer to note 9.
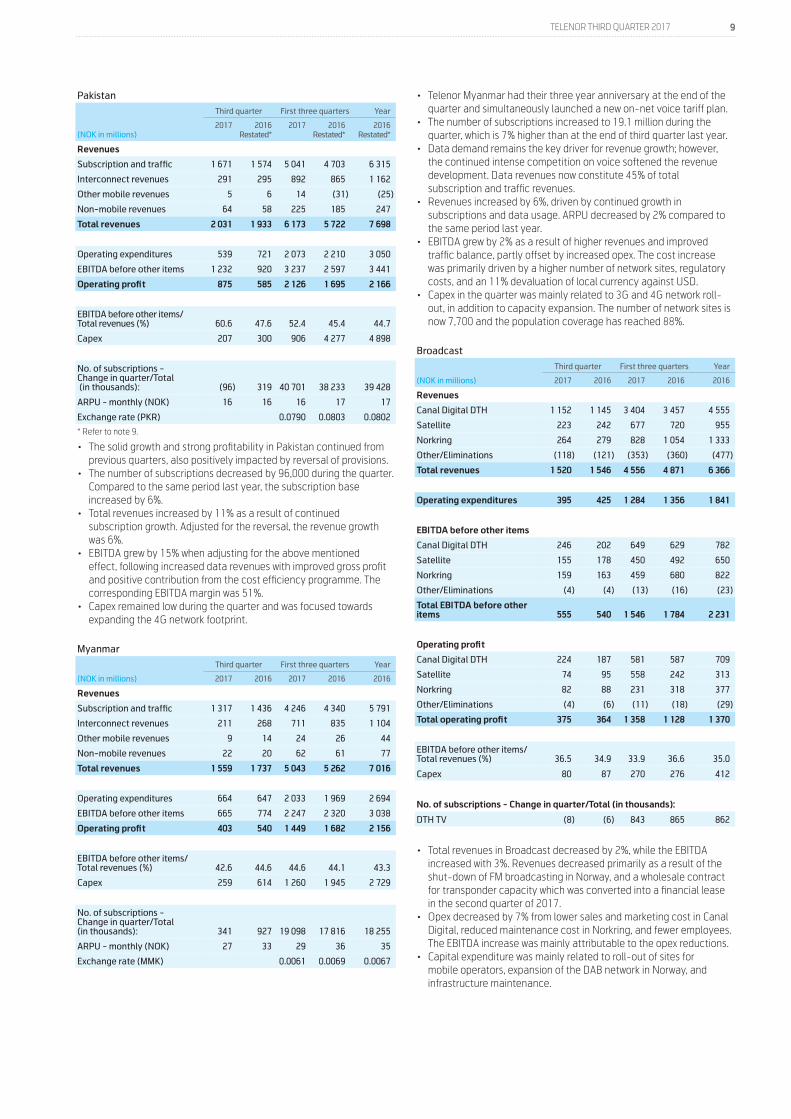
• The solid growth and strong profitability in Pakistan continued from previous quarters, also positively impacted by reversal of provisions.
• The number of subscriptions decreased by 96,000 during the quarter. Compared to the same period last year, the subscription base increased by 6%.
• Total revenues increased by 11% as a result of continued subscription growth. Adjusted for the reversal, the revenue growth was 6%.
• EBITDA grew by 15% when adjusting for the above mentioned effect, following increased data revenues with improved gross profit and positive contribution from the cost efficiency programme. The corresponding EBITDA margin was 51%.
• Capex remained low during the quarter and was focused towards expanding the 4G network footprint.
Myanmar
Third quarter First three quarters Year
(NOK in millions) 2017 2016 2017 2016 2016
Revenues
Subscription and traffic 1 317 1 436 4 246 4 340 5 791
Interconnect revenues 211 268 711 835 1 104
Other mobile revenues 9 14 24 26 44
Non-mobile revenues 22 20 62 61 77
Total revenues 1 559 1 737 5 043 5 262 7 016
Operating expenditures 664 647 2 033 1 969 2 694
EBITDA before other items 665 774 2 247 2 320 3 038
Operating profit 403 540 1 449 1 682 2 156
EBITDA before other items/ Total revenues (%) 42.6 44.6 44.6 44.1 43.3
Capex 259 614 1 260 1 945 2 729
No. of subscriptions - Change in quarter/Total (in thousands): 341 927
19 098 17 816 18 255
ARPU - monthly (NOK) 27 33 29 36 35
Exchange rate (MMK) 0.0061 0.0069 0.0067
• Telenor Myanmar had their three year anniversary at the end of the quarter and simultaneously launched a new on-net voice tariff plan.
• The number of subscriptions increased to 19.1 million during the quarter, which is 7% higher than at the end of third quarter last year.
• Data demand remains the key driver for revenue growth; however, the continued intense competition on voice softened the revenue development. Data revenues now constitute 45% of total subscription and traffic revenues.
• Revenues increased by 6%, driven by continued growth in subscriptions and data usage. ARPU decreased by 2% compared to the same period last year.
• EBITDA grew by 2% as a result of higher revenues and improved traffic balance, partly offset by increased opex. The cost increase was primarily driven by a higher number of network sites, regulatory costs, and an 11% devaluation of local currency against USD.
• Capex in the quarter was mainly related to 3G and 4G network roll-out, in addition to capacity expansion. The number of network sites is now 7,700 and the population coverage has reached 88%.
Broadcast
Third quarter First three quarters Year
(NOK in millions) 2017 2016 2017 2016 2016
Revenues
Canal Digital DTH 1 152 1 145 3 404 3 457 4 555
Satellite 223 242 677 720 955
Norkring 264 279 828 1 054 1 333
Other/Eliminations (118) (121) (353) (360) (477)
Total revenues 1 520 1 546 4 556 4 871 6 366
Operating expenditures 395 425 1 284 1 356 1 841
EBITDA before other items
Canal Digital DTH 246 202 649 629 782
Satellite 155 178 450 492 650
Norkring 159 163 459 680 822
Other/Eliminations (4) (4) (13) (16) (23)
Total EBITDA before other items 555 540 1 546 1 784 2 231
Operating profit
Canal Digital DTH 224 187 581 587 709
Satellite 74 95 558 242 313
Norkring 82 88 231 318 377
Other/Eliminations (4) (6) (11) (18) (29)
Total operating profit 375 364 1 358 1 128 1 370
EBITDA before other items/Total revenues (%) 36.5 34.9 33.9 36.6 35.0
Capex 80 87 270 276 412
No. of subscriptions - Change in quarter/Total (in thousands):
DTH TV (8) (6) 843 865 862
• Total revenues in Broadcast decreased by 2%, while the EBITDA increased with 3%. Revenues decreased primarily as a result of the shut-down of FM broadcasting in Norway, and a wholesale contract for transponder capacity which was converted into a financial lease in the second quarter of 2017.
• Opex decreased by 7% from lower sales and marketing cost in Canal Digital, reduced maintenance cost in Norkring, and fewer employees. The EBITDA increase was mainly attributable to the opex reductions.
• Capital expenditure was mainly related to roll-out of sites for mobile operators, expansion of the DAB network in Norway, and infrastructure maintenance.
10 TELENOR THIRD QUARTER 2017
Other units
Third quarter First three quarters Year
(NOK in millions)2017 2016
Restated*2017 2016
Restated*2016
Restated*
Revenues
Global wholesale 746 906 2 326 2 340 3 117
Corporate functions 753 774 2 349 2 267 2 933
Digital Businesses incl. Financial services 632 545 1 790 1 598 2 263
Other / eliminations 105 152 291 449 557
Total revenues 2 237 2 377 6 756 6 653 8 870
Operating expenditures 1 479 1 562 4 787 4 736 6 483
EBITDA before other items
Global wholesale 46 50 107 106 120
Corporate functions (122) (218) (581) (767) (1 125)
Digital Businesses incl. Financial services (45) (97) (250) (168) (295)
Other / eliminations 4 32 31 37 34
Total EBITDA before other items (117) (233) (693) (793) (1 266)
Operating profit (loss)
Global wholesale 28 38 49 70 72
Corporate functions 286 (344) (399) (1 102) (1 162)
Digital Businesses incl. Financial services (276) (137) (940) (279) (1 476)
Other / eliminations (11) 31 58 7 (18)
Total operating profit (loss) 27 (411) (1 233) (1 304) (2 585)
Capex 122 154 489 382 564
Investments in businesses 26 42 1 875 3 467 3 488
* Refer to note 9.
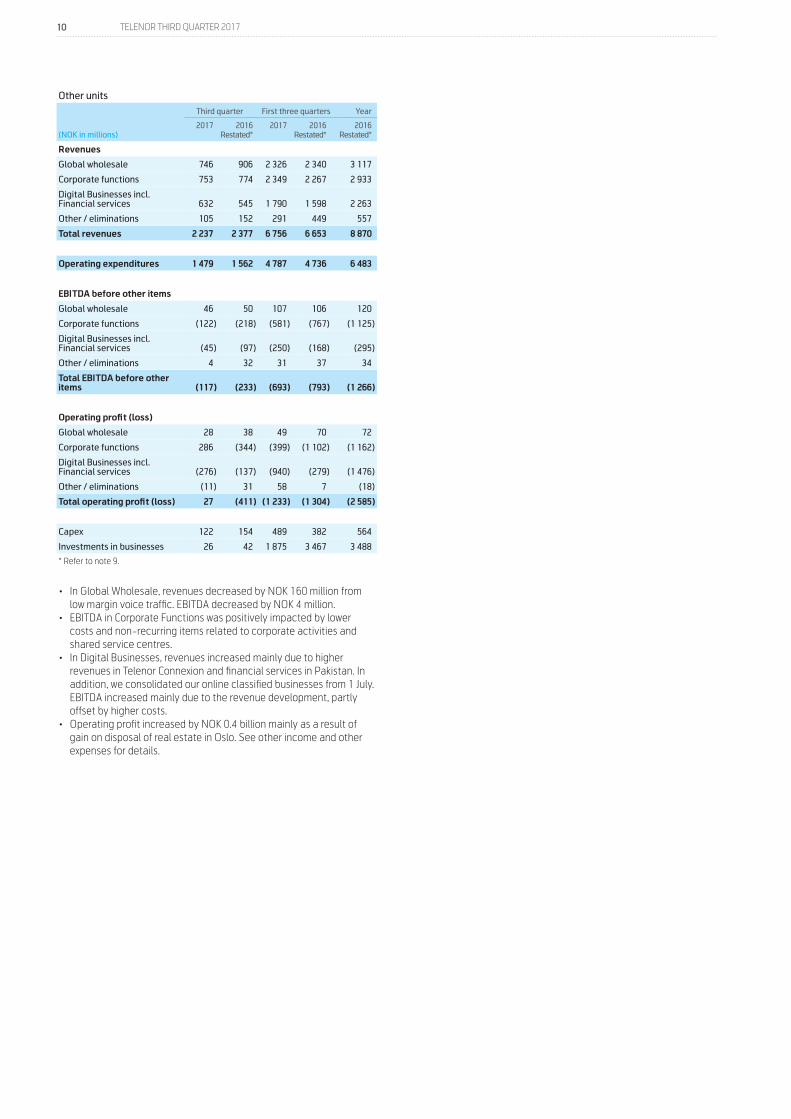
• In Global Wholesale, revenues decreased by NOK 160 million from low margin voice traffic. EBITDA decreased by NOK 4 million.
• EBITDA in Corporate Functions was positively impacted by lower costs and non-recurring items related to corporate activities and shared service centres.
• In Digital Businesses, revenues increased mainly due to higher revenues in Telenor Connexion and financial services in Pakistan. In addition, we consolidated our online classified businesses from 1 July. EBITDA increased mainly due to the revenue development, partly offset by higher costs.
• Operating profit increased by NOK 0.4 billion mainly as a result of gain on disposal of real estate in Oslo. See other income and other expenses for details.
11 TELENOR THIRD QUARTER 2017
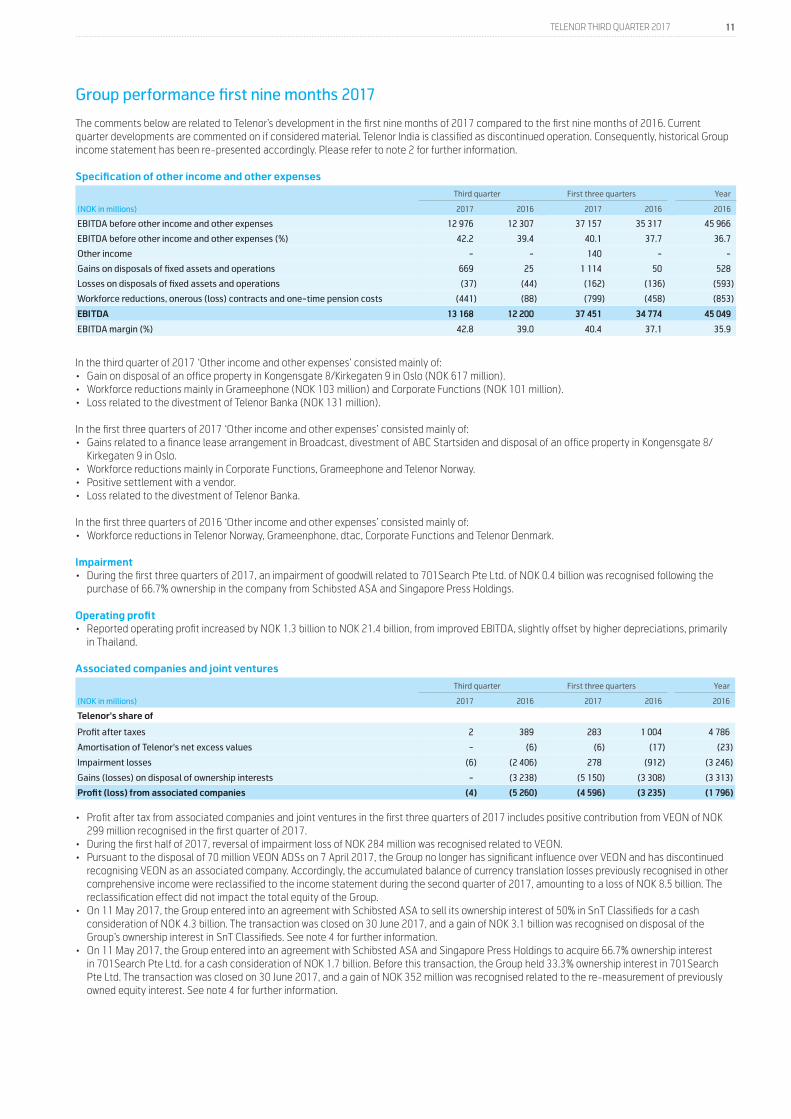
Group performance first nine months 2017
The comments below are related to Telenor’s development in the first nine months of 2017 compared to the first nine months of 2016. Current quarter developments are commented on if considered material. Telenor India is classified as discontinued operation. Consequently, historical Group income statement has been re-presented accordingly. Please refer to note 2 for further information.
Specification of other income and other expenses
Third quarter First three quarters Year
(NOK in millions) 2017 2016 2017 2016 2016
EBITDA before other income and other expenses 12 976 12 307 37 157 35 317 45 966
EBITDA before other income and other expenses (%) 42.2 39.4 40.1 37.7 36.7
Other income - - 140 - -
Gains on disposals of fixed assets and operations 669 25 1 114 50 528
Losses on disposals of fixed assets and operations (37) (44) (162) (136) (593)
Workforce reductions, onerous (loss) contracts and one-time pension costs (441) (88) (799) (458) (853)
EBITDA 13 168 12 200 37 451 34 774 45 049
EBITDA margin (%) 42.8 39.0 40.4 37.1 35.9
In the third quarter of 2017 ‘Other income and other expenses’ consisted mainly of:• Gain on disposal of an office property in Kongensgate 8/Kirkegaten 9 in Oslo (NOK 617 million).• Workforce reductions mainly in Grameephone (NOK 103 million) and Corporate Functions (NOK 101 million).• Loss related to the divestment of Telenor Banka (NOK 131 million).
In the first three quarters of 2017 ‘Other income and other expenses’ consisted mainly of:• Gains related to a finance lease arrangement in Broadcast, divestment of ABC Startsiden and disposal of an office property in Kongensgate 8/
Kirkegaten 9 in Oslo.• Workforce reductions mainly in Corporate Functions, Grameephone and Telenor Norway.• Positive settlement with a vendor.• Loss related to the divestment of Telenor Banka.
In the first three quarters of 2016 ‘Other income and other expenses’ consisted mainly of:• Workforce reductions in Telenor Norway, Grameenphone, dtac, Corporate Functions and Telenor Denmark.
Impairment• During the first three quarters of 2017, an impairment of goodwill related to 701Search Pte Ltd. of NOK 0.4 billion was recognised following the
purchase of 66.7% ownership in the company from Schibsted ASA and Singapore Press Holdings. Operating profit• Reported operating profit increased by NOK 1.3 billion to NOK 21.4 billion, from improved EBITDA, slightly offset by higher depreciations, primarily
in Thailand.
Associated companies and joint ventures
Third quarter First three quarters Year
(NOK in millions) 2017 2016 2017 2016 2016
Telenor's share of
Profit after taxes 2 389 283 1 004 4 786
Amortisation of Telenor's net excess values - (6) (6) (17) (23)
Impairment losses (6) (2 406) 278 (912) (3 246)
Gains (losses) on disposal of ownership interests - (3 238) (5 150) (3 308) (3 313)
Profit (loss) from associated companies (4) (5 260) (4 596) (3 235) (1 796)
• Profit after tax from associated companies and joint ventures in the first three quarters of 2017 includes positive contribution from VEON of NOK 299 million recognised in the first quarter of 2017.
• During the first half of 2017, reversal of impairment loss of NOK 284 million was recognised related to VEON. • Pursuant to the disposal of 70 million VEON ADSs on 7 April 2017, the Group no longer has significant influence over VEON and has discontinued
recognising VEON as an associated company. Accordingly, the accumulated balance of currency translation losses previously recognised in other comprehensive income were reclassified to the income statement during the second quarter of 2017, amounting to a loss of NOK 8.5 billion. The reclassification effect did not impact the total equity of the Group.
• On 11 May 2017, the Group entered into an agreement with Schibsted ASA to sell its ownership interest of 50% in SnT Classifieds for a cash consideration of NOK 4.3 billion. The transaction was closed on 30 June 2017, and a gain of NOK 3.1 billion was recognised on disposal of the Group’s ownership interest in SnT Classifieds. See note 4 for further information.
• On 11 May 2017, the Group entered into an agreement with Schibsted ASA and Singapore Press Holdings to acquire 66.7% ownership interest in 701Search Pte Ltd. for a cash consideration of NOK 1.7 billion. Before this transaction, the Group held 33.3% ownership interest in 701Search Pte Ltd. The transaction was closed on 30 June 2017, and a gain of NOK 352 million was recognised related to the re-measurement of previously owned equity interest. See note 4 for further information.
12 TELENOR THIRD QUARTER 2017
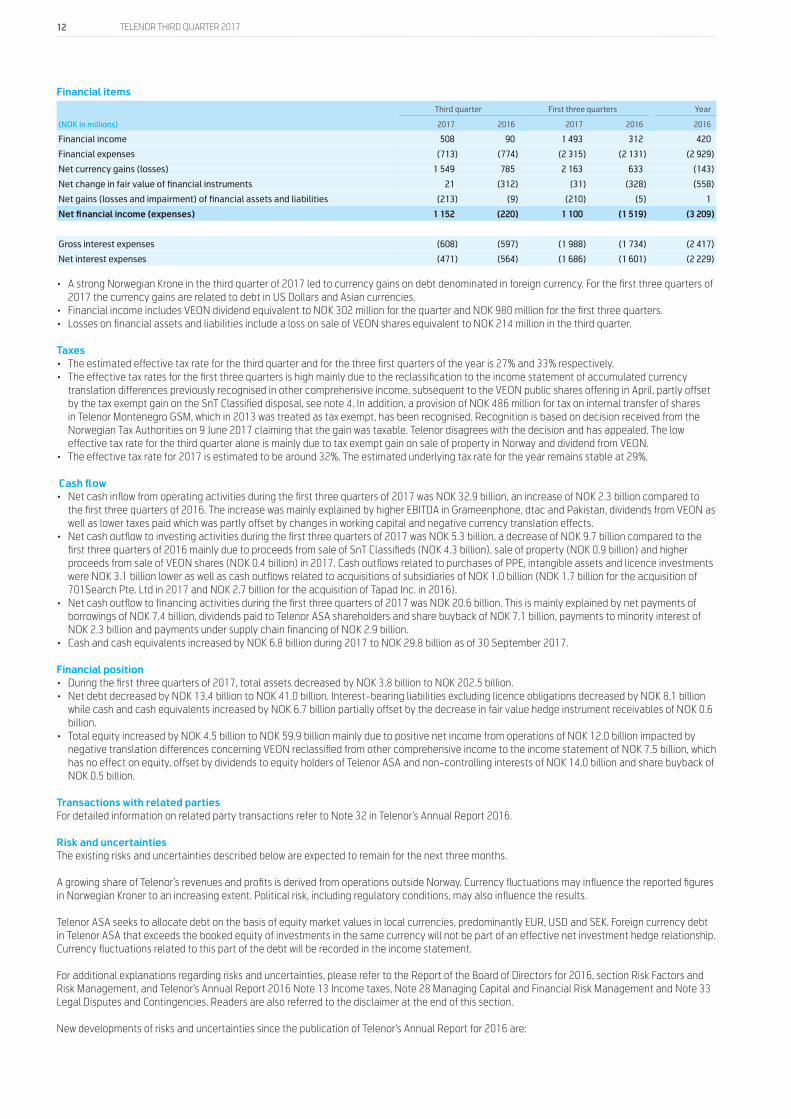
Financial items
Third quarter First three quarters Year
(NOK in millions) 2017 2016 2017 2016 2016
Financial income 508 90 1 493 312 420
Financial expenses (713) (774) (2 315) (2 131) (2 929)
Net currency gains (losses) 1 549 785 2 163 633 (143)
Net change in fair value of financial instruments 21 (312) (31) (328) (558)
Net gains (losses and impairment) of financial assets and liabilities (213) (9) (210) (5) 1
Net financial income (expenses) 1 152 (220) 1 100 (1 519) (3 209)
Gross interest expenses (608) (597) (1 988) (1 734) (2 417)
Net interest expenses (471) (564) (1 686) (1 601) (2 229)
• A strong Norwegian Krone in the third quarter of 2017 led to currency gains on debt denominated in foreign currency. For the first three quarters of 2017 the currency gains are related to debt in US Dollars and Asian currencies.
• Financial income includes VEON dividend equivalent to NOK 302 million for the quarter and NOK 980 million for the first three quarters.• Losses on financial assets and liabilities include a loss on sale of VEON shares equivalent to NOK 214 million in the third quarter.
Taxes• The estimated effective tax rate for the third quarter and for the three first quarters of the year is 27% and 33% respectively. • The effective tax rates for the first three quarters is high mainly due to the reclassification to the income statement of accumulated currency
translation differences previously recognised in other comprehensive income, subsequent to the VEON public shares offering in April, partly offset by the tax exempt gain on the SnT Classified disposal, see note 4. In addition, a provision of NOK 486 million for tax on internal transfer of shares in Telenor Montenegro GSM, which in 2013 was treated as tax exempt, has been recognised. Recognition is based on decision received from the Norwegian Tax Authorities on 9 June 2017 claiming that the gain was taxable. Telenor disagrees with the decision and has appealed. The low effective tax rate for the third quarter alone is mainly due to tax exempt gain on sale of property in Norway and dividend from VEON.
• The effective tax rate for 2017 is estimated to be around 32%. The estimated underlying tax rate for the year remains stable at 29%.
Cash flow• Net cash inflow from operating activities during the first three quarters of 2017 was NOK 32.9 billion, an increase of NOK 2.3 billion compared to
the first three quarters of 2016. The increase was mainly explained by higher EBITDA in Grameenphone, dtac and Pakistan, dividends from VEON as well as lower taxes paid which was partly offset by changes in working capital and negative currency translation effects.
• Net cash outflow to investing activities during the first three quarters of 2017 was NOK 5.3 billion, a decrease of NOK 9.7 billion compared to the first three quarters of 2016 mainly due to proceeds from sale of SnT Classifieds (NOK 4.3 billion), sale of property (NOK 0.9 billion) and higher proceeds from sale of VEON shares (NOK 0.4 billion) in 2017. Cash outflows related to purchases of PPE, intangible assets and licence investments were NOK 3.1 billion lower as well as cash outflows related to acquisitions of subsidiaries of NOK 1.0 billion (NOK 1.7 billion for the acquisition of 701Search Pte. Ltd in 2017 and NOK 2.7 billion for the acquisition of Tapad Inc. in 2016).
• Net cash outflow to financing activities during the first three quarters of 2017 was NOK 20.6 billion. This is mainly explained by net payments of borrowings of NOK 7.4 billion, dividends paid to Telenor ASA shareholders and share buyback of NOK 7.1 billion, payments to minority interest of NOK 2.3 billion and payments under supply chain financing of NOK 2.9 billion.
• Cash and cash equivalents increased by NOK 6.8 billion during 2017 to NOK 29.8 billion as of 30 September 2017.
Financial position• During the first three quarters of 2017, total assets decreased by NOK 3.8 billion to NOK 202.5 billion. • Net debt decreased by NOK 13.4 billion to NOK 41.0 billion. Interest-bearing liabilities excluding licence obligations decreased by NOK 8.1 billion
while cash and cash equivalents increased by NOK 6.7 billion partially offset by the decrease in fair value hedge instrument receivables of NOK 0.6 billion.
• Total equity increased by NOK 4.5 billion to NOK 59.9 billion mainly due to positive net income from operations of NOK 12.0 billion impacted by negative translation differences concerning VEON reclassified from other comprehensive income to the income statement of NOK 7.5 billion, which has no effect on equity, offset by dividends to equity holders of Telenor ASA and non-controlling interests of NOK 14.0 billion and share buyback of NOK 0.5 billion.
Transactions with related partiesFor detailed information on related party transactions refer to Note 32 in Telenor’s Annual Report 2016.
Risk and uncertaintiesThe existing risks and uncertainties described below are expected to remain for the next three months.
A growing share of Telenor’s revenues and profits is derived from operations outside Norway. Currency fluctuations may influence the reported figures in Norwegian Kroner to an increasing extent. Political risk, including regulatory conditions, may also influence the results.
Telenor ASA seeks to allocate debt on the basis of equity market values in local currencies, predominantly EUR, USD and SEK. Foreign currency debt in Telenor ASA that exceeds the booked equity of investments in the same currency will not be part of an effective net investment hedge relationship. Currency fluctuations related to this part of the debt will be recorded in the income statement.
For additional explanations regarding risks and uncertainties, please refer to the Report of the Board of Directors for 2016, section Risk Factors and Risk Management, and Telenor’s Annual Report 2016 Note 13 Income taxes, Note 28 Managing Capital and Financial Risk Management and Note 33 Legal Disputes and Contingencies. Readers are also referred to the disclaimer at the end of this section.
New developments of risks and uncertainties since the publication of Telenor’s Annual Report for 2016 are:

13 TELENOR THIRD QUARTER 2017
Legal disputesSee note 7 for details.
Financial aspectsIn relation to the licence issuance in Myanmar, a performance bond of USD 110 million has been issued to Myanmar authorities as a guarantee towards coverage and quality of service commitments during the next two years of the licence.
DisclaimerThis report contains statements regarding the future in connection with Telenor’s growth initiatives, profit figures, outlook, strategies and objectives. In particular, the section ‘Outlook for 2017’ contains forward-looking statements regarding the Group’s expectations. All statements regarding the future are subject to inherent risks and uncertainties, and many factors can lead to actual profits and developments deviating substantially from what has been expressed or implied in such statements.
Fornebu, 24 October 2017The Board of Directors of Telenor ASA
14 TELENOR THIRD QUARTER 2017
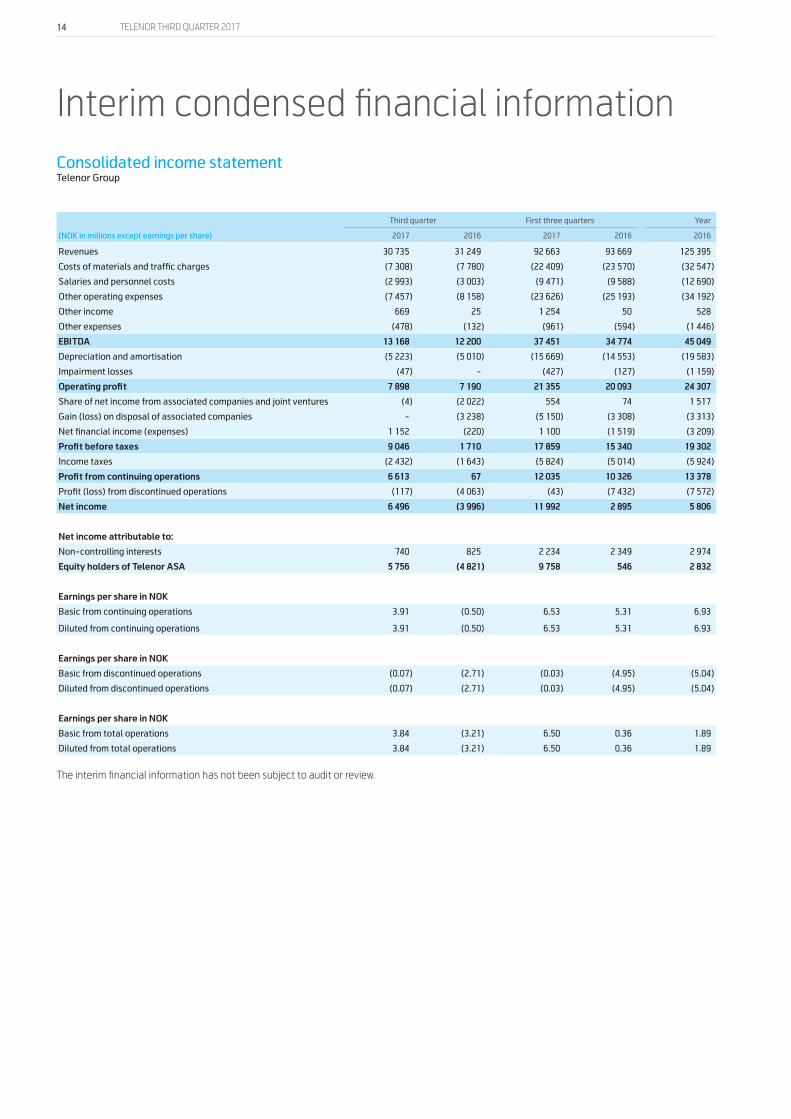
Consolidated income statementTelenor Group
Third quarter First three quarters Year
(NOK in millions except earnings per share) 2017 2016 2017 2016 2016
Revenues 30 735 31 249 92 663 93 669 125 395
Costs of materials and traffic charges (7 308) (7 780) (22 409) (23 570) (32 547)
Salaries and personnel costs (2 993) (3 003) (9 471) (9 588) (12 690)
Other operating expenses (7 457) (8 158) (23 626) (25 193) (34 192)
Other income 669 25 1 254 50 528
Other expenses (478) (132) (961) (594) (1 446)
EBITDA 13 168 12 200 37 451 34 774 45 049
Depreciation and amortisation (5 223) (5 010) (15 669) (14 553) (19 583)
Impairment losses (47) - (427) (127) (1 159)
Operating profit 7 898 7 190 21 355 20 093 24 307
Share of net income from associated companies and joint ventures (4) (2 022) 554 74 1 517
Gain (loss) on disposal of associated companies - (3 238) (5 150) (3 308) (3 313)
Net financial income (expenses) 1 152 (220) 1 100 (1 519) (3 209)
Profit before taxes 9 046 1 710 17 859 15 340 19 302
Income taxes (2 432) (1 643) (5 824) (5 014) (5 924)
Profit from continuing operations 6 613 67 12 035 10 326 13 378
Profit (loss) from discontinued operations (117) (4 063) (43) (7 432) (7 572)
Net income 6 496 (3 996) 11 992 2 895 5 806
Net income attributable to:
Non-controlling interests 740 825 2 234 2 349 2 974
Equity holders of Telenor ASA 5 756 (4 821) 9 758 546 2 832
Earnings per share in NOK
Basic from continuing operations 3.91 (0.50) 6.53 5.31 6.93
Diluted from continuing operations 3.91 (0.50) 6.53 5.31 6.93
Earnings per share in NOK
Basic from discontinued operations (0.07) (2.71) (0.03) (4.95) (5.04)
Diluted from discontinued operations (0.07) (2.71) (0.03) (4.95) (5.04)
Earnings per share in NOK
Basic from total operations 3.84 (3.21) 6.50 0.36 1.89
Diluted from total operations 3.84 (3.21) 6.50 0.36 1.89
The interim financial information has not been subject to audit or review.
Interim condensed financial information
15 TELENOR THIRD QUARTER 2017
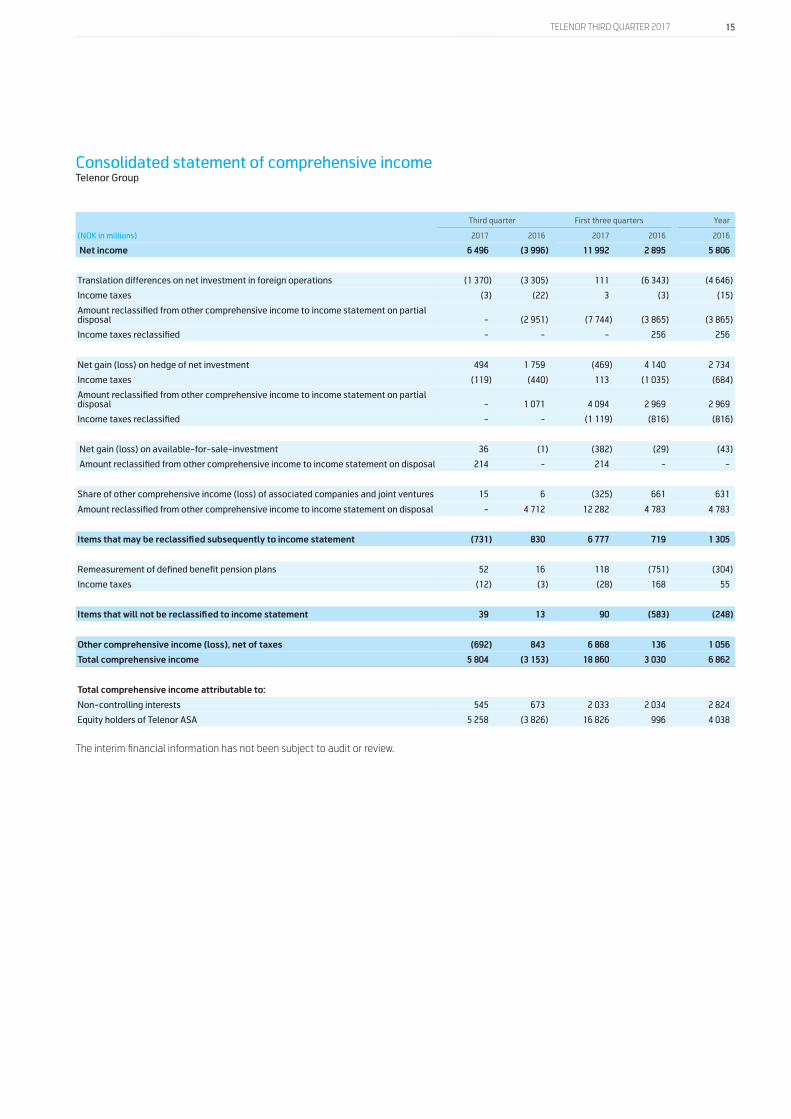
Consolidated statement of comprehensive income Telenor Group
Third quarter First three quarters Year
(NOK in millions) 2017 2016 2017 2016 2016
Net income 6 496 (3 996) 11 992 2 895 5 806
Translation differences on net investment in foreign operations (1 370) (3 305) 111 (6 343) (4 646)
Income taxes (3) (22) 3 (3) (15)
Amount reclassified from other comprehensive income to income statement on partial disposal - (2 951) (7 744) (3 865) (3 865)
Income taxes reclassified - - - 256 256
Net gain (loss) on hedge of net investment 494 1 759 (469) 4 140 2 734
Income taxes (119) (440) 113 (1 035) (684)
Amount reclassified from other comprehensive income to income statement on partial disposal - 1 071 4 094 2 969 2 969
Income taxes reclassified - - (1 119) (816) (816)
Net gain (loss) on available-for-sale-investment 36 (1) (382) (29) (43)
Amount reclassified from other comprehensive income to income statement on disposal 214 - 214 - -
Share of other comprehensive income (loss) of associated companies and joint ventures 15 6 (325) 661 631
Amount reclassified from other comprehensive income to income statement on disposal - 4 712 12 282 4 783 4 783
Items that may be reclassified subsequently to income statement (731) 830 6 777 719 1 305
Remeasurement of defined benefit pension plans 52 16 118 (751) (304)
Income taxes (12) (3) (28) 168 55
Items that will not be reclassified to income statement 39 13 90 (583) (248)
Other comprehensive income (loss), net of taxes (692) 843 6 868 136 1 056
Total comprehensive income 5 804 (3 153) 18 860 3 030 6 862
Total comprehensive income attributable to:
Non-controlling interests 545 673 2 033 2 034 2 824
Equity holders of Telenor ASA 5 258 (3 826) 16 826 996 4 038
The interim financial information has not been subject to audit or review.
16 TELENOR THIRD QUARTER 2017
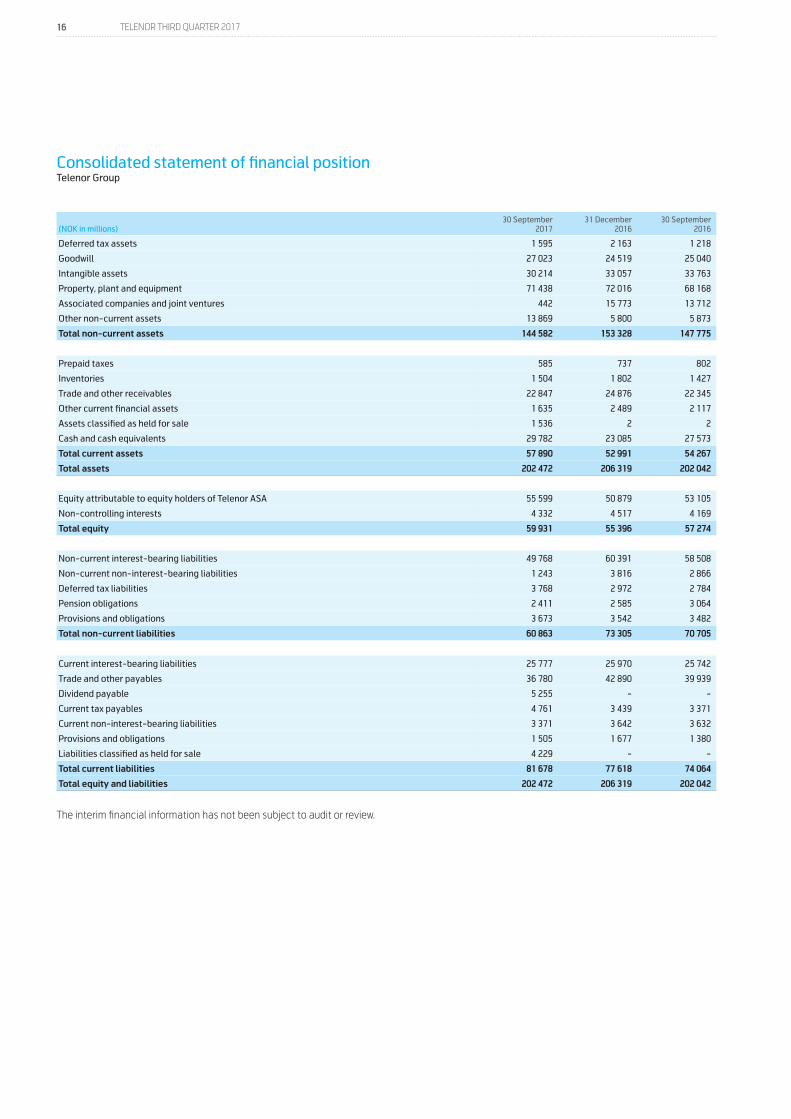
Consolidated statement of financial position Telenor Group
(NOK in millions)30 September
201731 December
201630 September
2016
Deferred tax assets 1 595 2 163 1 218
Goodwill 27 023 24 519 25 040
Intangible assets 30 214 33 057 33 763
Property, plant and equipment 71 438 72 016 68 168
Associated companies and joint ventures 442 15 773 13 712
Other non-current assets 13 869 5 800 5 873
Total non-current assets 144 582 153 328 147 775
Prepaid taxes 585 737 802
Inventories 1 504 1 802 1 427
Trade and other receivables 22 847 24 876 22 345
Other current financial assets 1 635 2 489 2 117
Assets classified as held for sale 1 536 2 2
Cash and cash equivalents 29 782 23 085 27 573
Total current assets 57 890 52 991 54 267
Total assets 202 472 206 319 202 042
Equity attributable to equity holders of Telenor ASA 55 599 50 879 53 105
Non-controlling interests 4 332 4 517 4 169
Total equity 59 931 55 396 57 274
Non-current interest-bearing liabilities 49 768 60 391 58 508
Non-current non-interest-bearing liabilities 1 243 3 816 2 866
Deferred tax liabilities 3 768 2 972 2 784
Pension obligations 2 411 2 585 3 064
Provisions and obligations 3 673 3 542 3 482
Total non-current liabilities 60 863 73 305 70 705
Current interest-bearing liabilities 25 777 25 970 25 742
Trade and other payables 36 780 42 890 39 939
Dividend payable 5 255 - -
Current tax payables 4 761 3 439 3 371
Current non-interest-bearing liabilities 3 371 3 642 3 632
Provisions and obligations 1 505 1 677 1 380
Liabilities classified as held for sale 4 229 - -
Total current liabilities 81 678 77 618 74 064
Total equity and liabilities 202 472 206 319 202 042
The interim financial information has not been subject to audit or review.
17 TELENOR THIRD QUARTER 2017
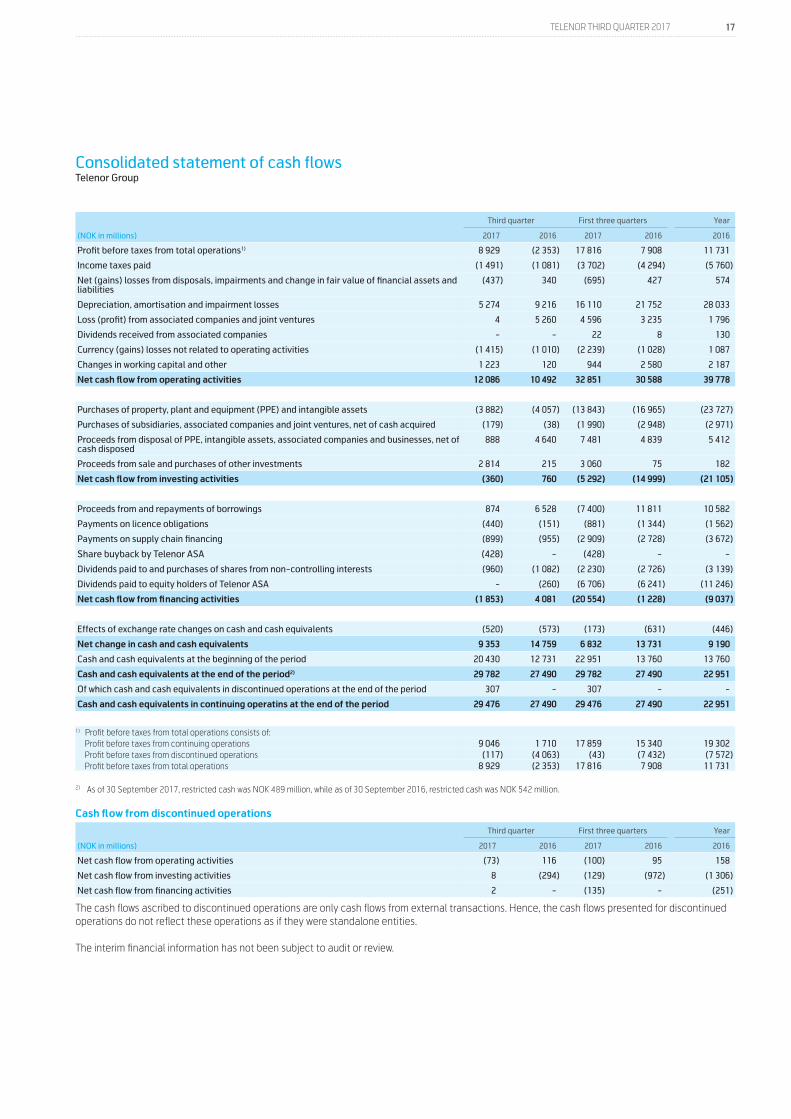
Consolidated statement of cash flows Telenor Group
Third quarter First three quarters Year
(NOK in millions) 2017 2016 2017 2016 2016
Profit before taxes from total operations1) 8 929 (2 353) 17 816 7 908 11 731
Income taxes paid (1 491) (1 081) (3 702) (4 294) (5 760)
Net (gains) losses from disposals, impairments and change in fair value of financial assets and liabilities
(437) 340 (695) 427 574
Depreciation, amortisation and impairment losses 5 274 9 216 16 110 21 752 28 033
Loss (profit) from associated companies and joint ventures 4 5 260 4 596 3 235 1 796
Dividends received from associated companies - - 22 8 130
Currency (gains) losses not related to operating activities (1 415) (1 010) (2 239) (1 028) 1 087
Changes in working capital and other 1 223 120 944 2 580 2 187
Net cash flow from operating activities 12 086 10 492 32 851 30 588 39 778
Purchases of property, plant and equipment (PPE) and intangible assets (3 882) (4 057) (13 843) (16 965) (23 727)
Purchases of subsidiaries, associated companies and joint ventures, net of cash acquired (179) (38) (1 990) (2 948) (2 971)
Proceeds from disposal of PPE, intangible assets, associated companies and businesses, net of cash disposed
888 4 640 7 481 4 839 5 412
Proceeds from sale and purchases of other investments 2 814 215 3 060 75 182
Net cash flow from investing activities (360) 760 (5 292) (14 999) (21 105)
Proceeds from and repayments of borrowings 874 6 528 (7 400) 11 811 10 582
Payments on licence obligations (440) (151) (881) (1 344) (1 562)
Payments on supply chain financing (899) (955) (2 909) (2 728) (3 672)
Share buyback by Telenor ASA (428) - (428) - -
Dividends paid to and purchases of shares from non-controlling interests (960) (1 082) (2 230) (2 726) (3 139)
Dividends paid to equity holders of Telenor ASA - (260) (6 706) (6 241) (11 246)
Net cash flow from financing activities (1 853) 4 081 (20 554) (1 228) (9 037)
Effects of exchange rate changes on cash and cash equivalents (520) (573) (173) (631) (446)
Net change in cash and cash equivalents 9 353 14 759 6 832 13 731 9 190
Cash and cash equivalents at the beginning of the period 20 430 12 731 22 951 13 760 13 760
Cash and cash equivalents at the end of the period2) 29 782 27 490 29 782 27 490 22 951
Of which cash and cash equivalents in discontinued operations at the end of the period 307 - 307 - -
Cash and cash equivalents in continuing operatins at the end of the period 29 476 27 490 29 476 27 490 22 951
1) Profit before taxes from total operations consists of: Profit before taxes from continuing operations 9 046 1 710 17 859 15 340 19 302 Profit before taxes from discontinued operations (117) (4 063) (43) (7 432) (7 572) Profit before taxes from total operations 8 929 (2 353) 17 816 7 908 11 731
2) As of 30 September 2017, restricted cash was NOK 489 million, while as of 30 September 2016, restricted cash was NOK 542 million.
Cash flow from discontinued operations
Third quarter First three quarters Year
(NOK in millions) 2017 2016 2017 2016 2016
Net cash flow from operating activities (73) 116 (100) 95 158
Net cash flow from investing activities 8 (294) (129) (972) (1 306)
Net cash flow from financing activities 2 - (135) - (251)
The cash flows ascribed to discontinued operations are only cash flows from external transactions. Hence, the cash flows presented for discontinued operations do not reflect these operations as if they were standalone entities.
The interim financial information has not been subject to audit or review.
18 TELENOR THIRD QUARTER 2017
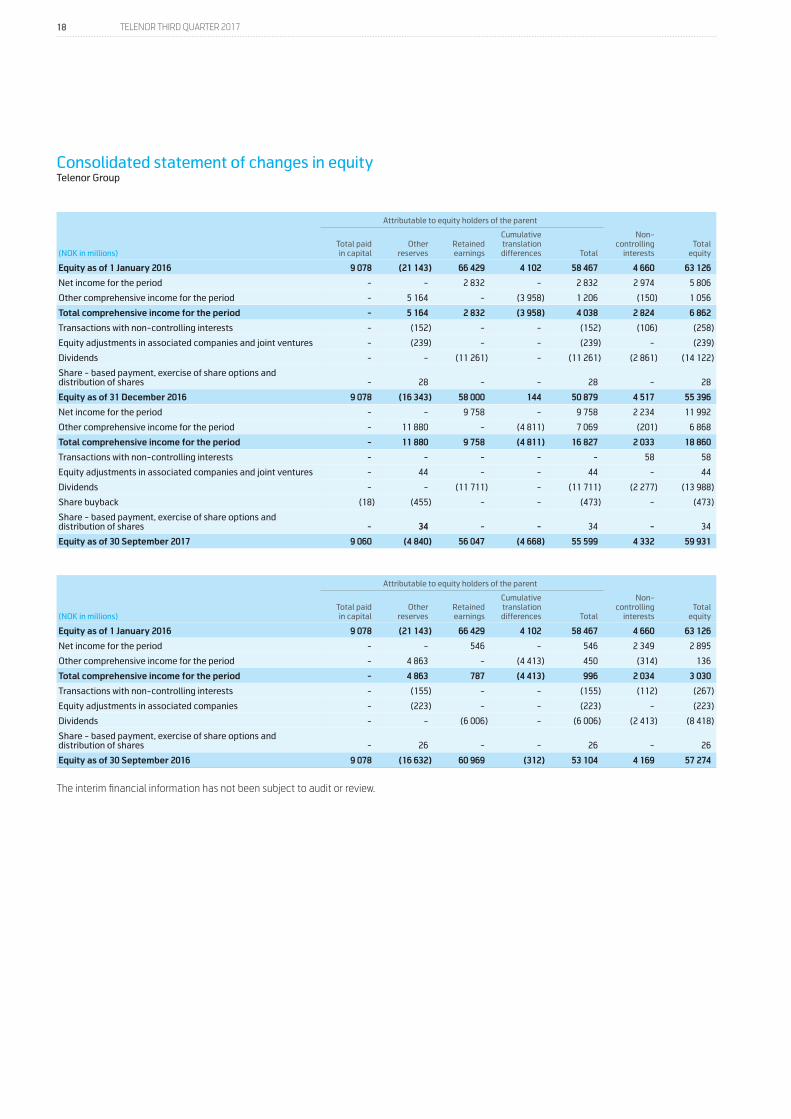
Consolidated statement of changes in equity Telenor Group
Attributable to equity holders of the parent
(NOK in millions) Total paid
in capital Other
reserves Retained earnings
Cumulative translation differences Total
Non-controlling
interests Total
equity
Equity as of 1 January 2016 9 078 (21 143) 66 429 4 102 58 467 4 660 63 126
Net income for the period - - 2 832 - 2 832 2 974 5 806
Other comprehensive income for the period - 5 164 - (3 958) 1 206 (150) 1 056
Total comprehensive income for the period - 5 164 2 832 (3 958) 4 038 2 824 6 862
Transactions with non-controlling interests - (152) - - (152) (106) (258)
Equity adjustments in associated companies and joint ventures - (239) - - (239) - (239)
Dividends - - (11 261) - (11 261) (2 861) (14 122)
Share - based payment, exercise of share options and distribution of shares - 28 - - 28 - 28
Equity as of 31 December 2016 9 078 (16 343) 58 000 144 50 879 4 517 55 396
Net income for the period - - 9 758 - 9 758 2 234 11 992
Other comprehensive income for the period - 11 880 - (4 811) 7 069 (201) 6 868
Total comprehensive income for the period - 11 880 9 758 (4 811) 16 827 2 033 18 860
Transactions with non-controlling interests - - - - - 58 58
Equity adjustments in associated companies and joint ventures - 44 - - 44 - 44
Dividends - - (11 711) - (11 711) (2 277) (13 988)
Share buyback (18) (455) - - (473) - (473)
Share - based payment, exercise of share options and distribution of shares - 34 - - 34 - 34
Equity as of 30 September 2017 9 060 (4 840) 56 047 (4 668) 55 599 4 332 59 931
Attributable to equity holders of the parent
(NOK in millions) Total paid
in capital Other
reserves Retained earnings
Cumulative translation differences Total
Non-controlling
interests Total
equity
Equity as of 1 January 2016 9 078 (21 143) 66 429 4 102 58 467 4 660 63 126
Net income for the period - - 546 - 546 2 349 2 895
Other comprehensive income for the period - 4 863 - (4 413) 450 (314) 136
Total comprehensive income for the period - 4 863 787 (4 413) 996 2 034 3 030
Transactions with non-controlling interests - (155) - - (155) (112) (267)
Equity adjustments in associated companies - (223) - - (223) - (223)
Dividends - - (6 006) - (6 006) (2 413) (8 418)
Share - based payment, exercise of share options and distribution of shares - 26 - - 26 - 26
Equity as of 30 September 2016 9 078 (16 632) 60 969 (312) 53 104 4 169 57 274
The interim financial information has not been subject to audit or review.
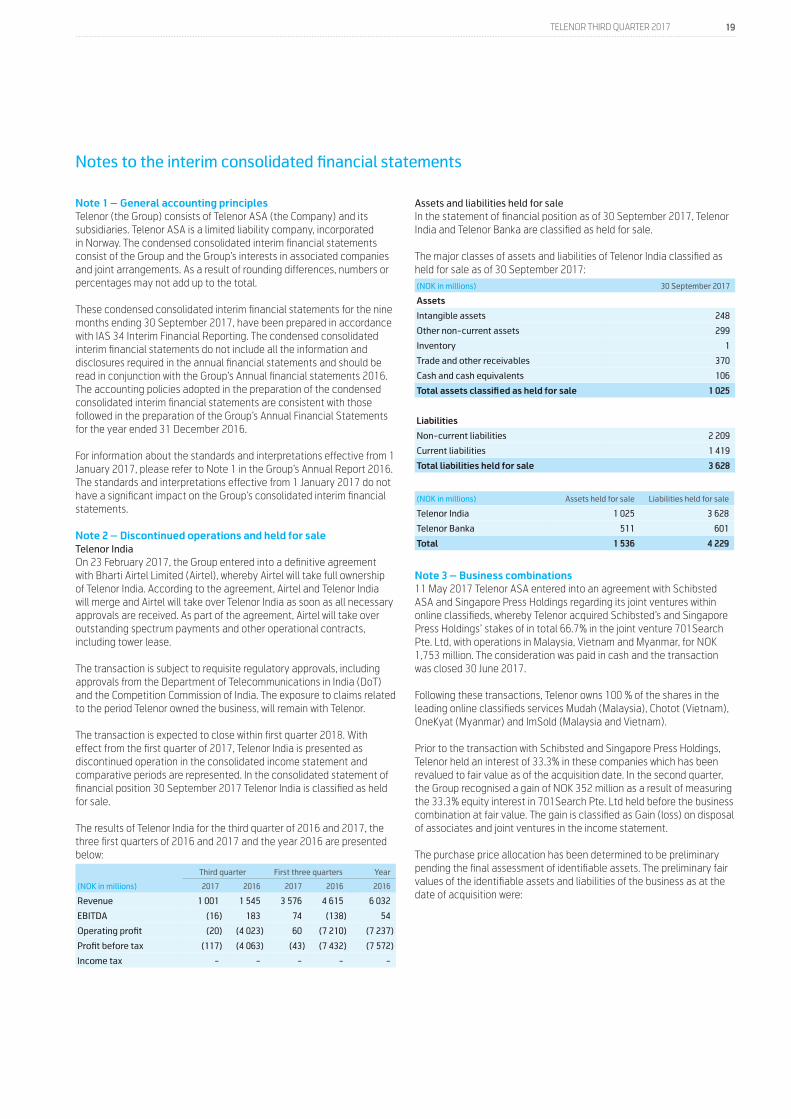
19 TELENOR THIRD QUARTER 2017
Note 1 – General accounting principlesTelenor (the Group) consists of Telenor ASA (the Company) and its subsidiaries. Telenor ASA is a limited liability company, incorporated in Norway. The condensed consolidated interim financial statements consist of the Group and the Group’s interests in associated companies and joint arrangements. As a result of rounding differences, numbers or percentages may not add up to the total.
These condensed consolidated interim financial statements for the nine months ending 30 September 2017, have been prepared in accordance with IAS 34 Interim Financial Reporting. The condensed consolidated interim financial statements do not include all the information and disclosures required in the annual financial statements and should be read in conjunction with the Group’s Annual financial statements 2016. The accounting policies adopted in the preparation of the condensed consolidated interim financial statements are consistent with those followed in the preparation of the Group’s Annual Financial Statements for the year ended 31 December 2016.
For information about the standards and interpretations effective from 1 January 2017, please refer to Note 1 in the Group’s Annual Report 2016. The standards and interpretations effective from 1 January 2017 do not have a significant impact on the Group’s consolidated interim financial statements.
Note 2 – Discontinued operations and held for sale Telenor IndiaOn 23 February 2017, the Group entered into a definitive agreement with Bharti Airtel Limited (Airtel), whereby Airtel will take full ownership of Telenor India. According to the agreement, Airtel and Telenor India will merge and Airtel will take over Telenor India as soon as all necessary approvals are received. As part of the agreement, Airtel will take over outstanding spectrum payments and other operational contracts, including tower lease.
The transaction is subject to requisite regulatory approvals, including approvals from the Department of Telecommunications in India (DoT) and the Competition Commission of India. The exposure to claims related to the period Telenor owned the business, will remain with Telenor.
The transaction is expected to close within first quarter 2018. With effect from the first quarter of 2017, Telenor India is presented as discontinued operation in the consolidated income statement and comparative periods are represented. In the consolidated statement of financial position 30 September 2017 Telenor India is classified as held for sale.
The results of Telenor India for the third quarter of 2016 and 2017, the three first quarters of 2016 and 2017 and the year 2016 are presented below:
Third quarter First three quarters Year
(NOK in millions) 2017 2016 2017 2016 2016
Revenue 1 001 1 545 3 576 4 615 6 032
EBITDA (16) 183 74 (138) 54
Operating profit (20) (4 023) 60 (7 210) (7 237)
Profit before tax (117) (4 063) (43) (7 432) (7 572)
Income tax - - - - -
Assets and liabilities held for saleIn the statement of financial position as of 30 September 2017, Telenor India and Telenor Banka are classified as held for sale.
The major classes of assets and liabilities of Telenor India classified as held for sale as of 30 September 2017:(NOK in millions) 30 September 2017
Assets
Intangible assets 248
Other non-current assets 299
Inventory 1
Trade and other receivables 370
Cash and cash equivalents 106
Total assets classified as held for sale 1 025
Liabilities
Non-current liabilities 2 209
Current liabilities 1 419
Total liabilities held for sale 3 628
(NOK in millions) Assets held for sale Liabilities held for sale
Telenor India 1 025 3 628
Telenor Banka 511 601
Total 1 536 4 229
Note 3 – Business combinations11 May 2017 Telenor ASA entered into an agreement with Schibsted ASA and Singapore Press Holdings regarding its joint ventures within online classifieds, whereby Telenor acquired Schibsted’s and Singapore Press Holdings’ stakes of in total 66.7% in the joint venture 701Search Pte. Ltd, with operations in Malaysia, Vietnam and Myanmar, for NOK 1,753 million. The consideration was paid in cash and the transaction was closed 30 June 2017. Following these transactions, Telenor owns 100 % of the shares in the leading online classifieds services Mudah (Malaysia), Chotot (Vietnam), OneKyat (Myanmar) and ImSold (Malaysia and Vietnam).
Prior to the transaction with Schibsted and Singapore Press Holdings, Telenor held an interest of 33.3% in these companies which has been revalued to fair value as of the acquisition date. In the second quarter, the Group recognised a gain of NOK 352 million as a result of measuring the 33.3% equity interest in 701Search Pte. Ltd held before the business combination at fair value. The gain is classified as Gain (loss) on disposal of associates and joint ventures in the income statement. The purchase price allocation has been determined to be preliminary pending the final assessment of identifiable assets. The preliminary fair values of the identifiable assets and liabilities of the business as at the date of acquisition were:
Notes to the interim consolidated financial statements
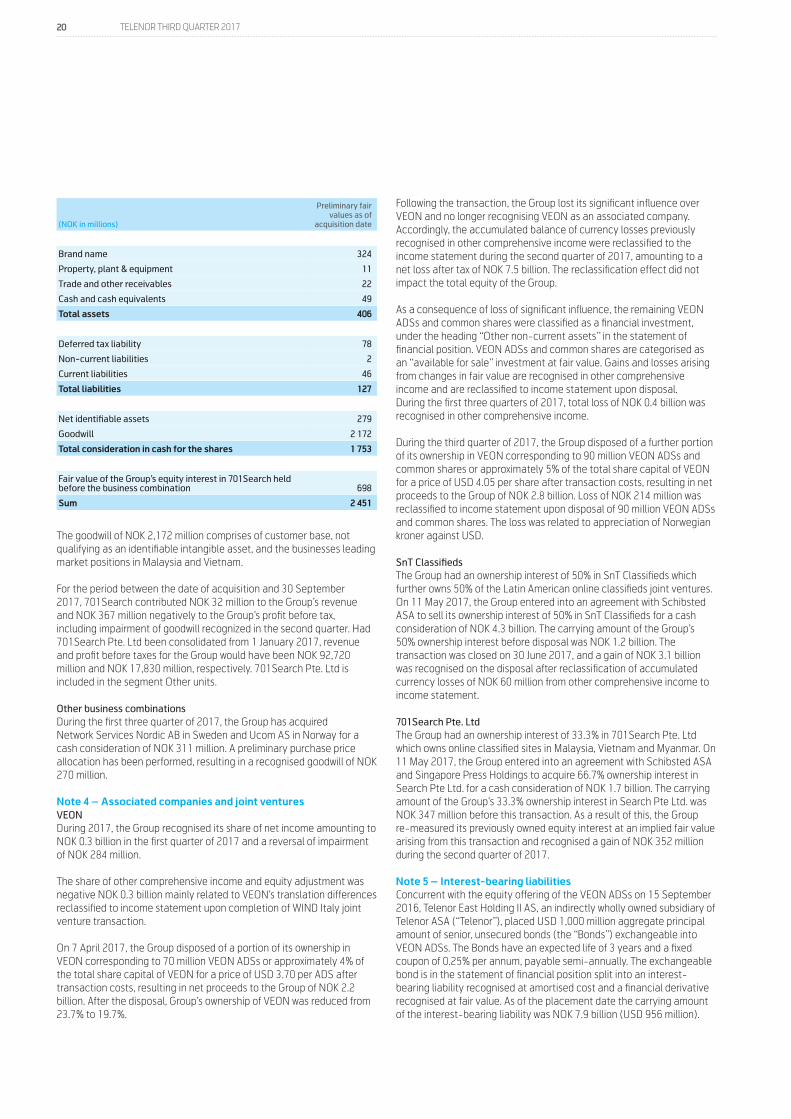
20 TELENOR THIRD QUARTER 2017
(NOK in millions)
Preliminary fair values as of
acquisition date
Brand name 324
Property, plant & equipment 11
Trade and other receivables 22
Cash and cash equivalents 49
Total assets 406
Deferred tax liability 78
Non-current liabilities 2
Current liabilities 46
Total liabilities 127
Net identifiable assets 279
Goodwill 2 172
Total consideration in cash for the shares 1 753
Fair value of the Group’s equity interest in 701Search held before the business combination 698
Sum 2 451
The goodwill of NOK 2,172 million comprises of customer base, not qualifying as an identifiable intangible asset, and the businesses leading market positions in Malaysia and Vietnam.
For the period between the date of acquisition and 30 September 2017, 701Search contributed NOK 32 million to the Group’s revenue and NOK 367 million negatively to the Group’s profit before tax, including impairment of goodwill recognized in the second quarter. Had 701Search Pte. Ltd been consolidated from 1 January 2017, revenue and profit before taxes for the Group would have been NOK 92,720 million and NOK 17,830 million, respectively. 701Search Pte. Ltd is included in the segment Other units.
Other business combinationsDuring the first three quarter of 2017, the Group has acquired Network Services Nordic AB in Sweden and Ucom AS in Norway for a cash consideration of NOK 311 million. A preliminary purchase price allocation has been performed, resulting in a recognised goodwill of NOK 270 million.
Note 4 – Associated companies and joint venturesVEONDuring 2017, the Group recognised its share of net income amounting to NOK 0.3 billion in the first quarter of 2017 and a reversal of impairment of NOK 284 million.
The share of other comprehensive income and equity adjustment was negative NOK 0.3 billion mainly related to VEON’s translation differences reclassified to income statement upon completion of WIND Italy joint venture transaction.
On 7 April 2017, the Group disposed of a portion of its ownership in VEON corresponding to 70 million VEON ADSs or approximately 4% of the total share capital of VEON for a price of USD 3.70 per ADS after transaction costs, resulting in net proceeds to the Group of NOK 2.2 billion. After the disposal, Group’s ownership of VEON was reduced from 23.7% to 19.7%.
Following the transaction, the Group lost its significant influence over VEON and no longer recognising VEON as an associated company. Accordingly, the accumulated balance of currency losses previously recognised in other comprehensive income were reclassified to the income statement during the second quarter of 2017, amounting to a net loss after tax of NOK 7.5 billion. The reclassification effect did not impact the total equity of the Group.
As a consequence of loss of significant influence, the remaining VEON ADSs and common shares were classified as a financial investment, under the heading “Other non-current assets” in the statement of financial position. VEON ADSs and common shares are categorised as an “available for sale” investment at fair value. Gains and losses arising from changes in fair value are recognised in other comprehensive income and are reclassified to income statement upon disposal. During the first three quarters of 2017, total loss of NOK 0.4 billion was recognised in other comprehensive income.
During the third quarter of 2017, the Group disposed of a further portion of its ownership in VEON corresponding to 90 million VEON ADSs and common shares or approximately 5% of the total share capital of VEON for a price of USD 4.05 per share after transaction costs, resulting in net proceeds to the Group of NOK 2.8 billion. Loss of NOK 214 million was reclassified to income statement upon disposal of 90 million VEON ADSs and common shares. The loss was related to appreciation of Norwegian kroner against USD.
SnT ClassifiedsThe Group had an ownership interest of 50% in SnT Classifieds which further owns 50% of the Latin American online classifieds joint ventures. On 11 May 2017, the Group entered into an agreement with Schibsted ASA to sell its ownership interest of 50% in SnT Classifieds for a cash consideration of NOK 4.3 billion. The carrying amount of the Group’s 50% ownership interest before disposal was NOK 1.2 billion. The transaction was closed on 30 June 2017, and a gain of NOK 3.1 billion was recognised on the disposal after reclassification of accumulated currency losses of NOK 60 million from other comprehensive income to income statement.
701Search Pte. LtdThe Group had an ownership interest of 33.3% in 701Search Pte. Ltd which owns online classified sites in Malaysia, Vietnam and Myanmar. On 11 May 2017, the Group entered into an agreement with Schibsted ASA and Singapore Press Holdings to acquire 66.7% ownership interest in Search Pte Ltd. for a cash consideration of NOK 1.7 billion. The carrying amount of the Group’s 33.3% ownership interest in Search Pte Ltd. was NOK 347 million before this transaction. As a result of this, the Group re-measured its previously owned equity interest at an implied fair value arising from this transaction and recognised a gain of NOK 352 million during the second quarter of 2017.
Note 5 – Interest-bearing liabilitiesConcurrent with the equity offering of the VEON ADSs on 15 September 2016, Telenor East Holding II AS, an indirectly wholly owned subsidiary of Telenor ASA (“Telenor”), placed USD 1,000 million aggregate principal amount of senior, unsecured bonds (the “Bonds”) exchangeable into VEON ADSs. The Bonds have an expected life of 3 years and a fixed coupon of 0.25% per annum, payable semi-annually. The exchangeable bond is in the statement of financial position split into an interest-bearing liability recognised at amortised cost and a financial derivative recognised at fair value. As of the placement date the carrying amount of the interest-bearing liability was NOK 7.9 billion (USD 956 million).
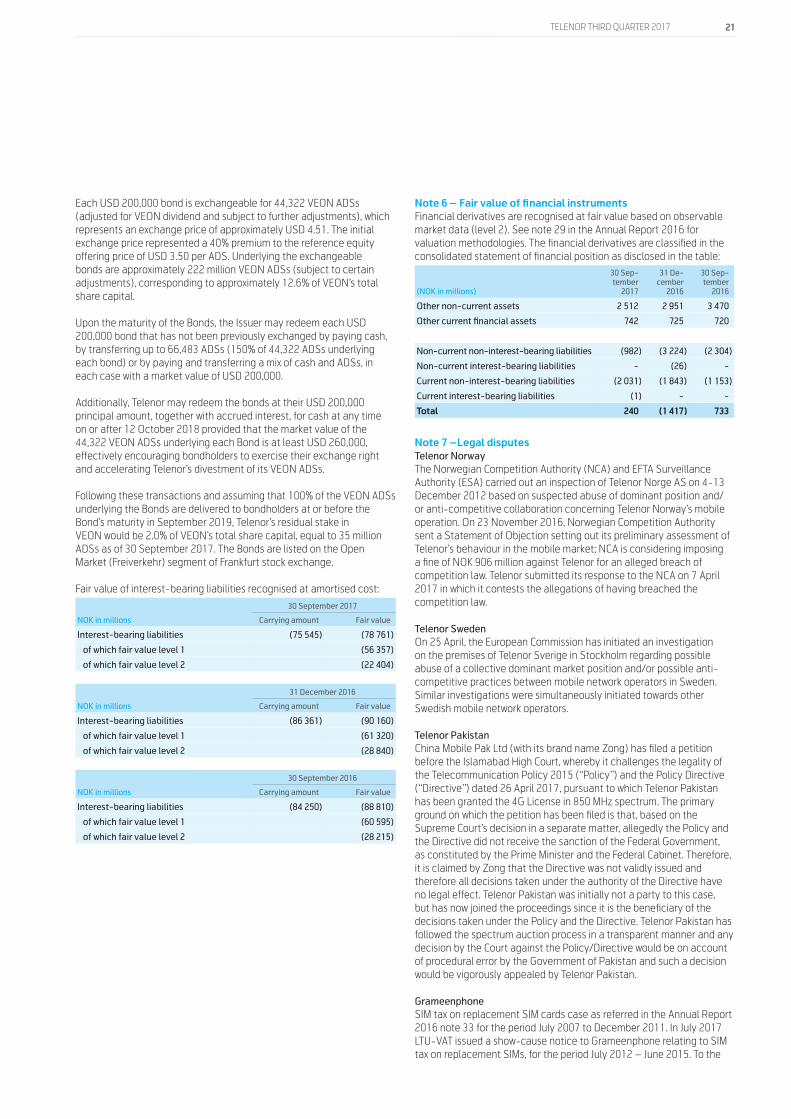
21 TELENOR THIRD QUARTER 2017
Each USD 200,000 bond is exchangeable for 44,322 VEON ADSs (adjusted for VEON dividend and subject to further adjustments), which represents an exchange price of approximately USD 4.51. The initial exchange price represented a 40% premium to the reference equity offering price of USD 3.50 per ADS. Underlying the exchangeable bonds are approximately 222 million VEON ADSs (subject to certain adjustments), corresponding to approximately 12.6% of VEON’s total share capital.
Upon the maturity of the Bonds, the Issuer may redeem each USD 200,000 bond that has not been previously exchanged by paying cash, by transferring up to 66,483 ADSs (150% of 44,322 ADSs underlying each bond) or by paying and transferring a mix of cash and ADSs, in each case with a market value of USD 200,000.
Additionally, Telenor may redeem the bonds at their USD 200,000 principal amount, together with accrued interest, for cash at any time on or after 12 October 2018 provided that the market value of the 44,322 VEON ADSs underlying each Bond is at least USD 260,000, effectively encouraging bondholders to exercise their exchange right and accelerating Telenor’s divestment of its VEON ADSs.
Following these transactions and assuming that 100% of the VEON ADSs underlying the Bonds are delivered to bondholders at or before the Bond’s maturity in September 2019, Telenor’s residual stake inVEON would be 2.0% of VEON’s total share capital, equal to 35 million ADSs as of 30 September 2017. The Bonds are listed on the Open Market (Freiverkehr) segment of Frankfurt stock exchange.
Fair value of interest-bearing liabilities recognised at amortised cost:
30 September 2017
NOK in millions Carrying amount Fair value
Interest-bearing liabilities (75 545) (78 761)
of which fair value level 1 (56 357)
of which fair value level 2 (22 404)
31 December 2016
NOK in millions Carrying amount Fair value
Interest-bearing liabilities (86 361) (90 160)
of which fair value level 1 (61 320)
of which fair value level 2 (28 840)
30 September 2016
NOK in millions Carrying amount Fair value
Interest-bearing liabilities (84 250) (88 810)
of which fair value level 1 (60 595)
of which fair value level 2 (28 215)
Note 6 – Fair value of financial instrumentsFinancial derivatives are recognised at fair value based on observable market data (level 2). See note 29 in the Annual Report 2016 for valuation methodologies. The financial derivatives are classified in the consolidated statement of financial position as disclosed in the table:
(NOK in millions)
30 Sep-tember
2017
31 De-cember
2016
30 Sep-tember
2016
Other non-current assets 2 512 2 951 3 470
Other current financial assets 742 725 720
Non-current non-interest-bearing liabilities (982) (3 224) (2 304)
Non-current interest-bearing liabilities - (26) -
Current non-interest-bearing liabilities (2 031) (1 843) (1 153)
Current interest-bearing liabilities (1) - -
Total 240 (1 417) 733
Note 7 –Legal disputesTelenor NorwayThe Norwegian Competition Authority (NCA) and EFTA Surveillance Authority (ESA) carried out an inspection of Telenor Norge AS on 4-13 December 2012 based on suspected abuse of dominant position and/or anti-competitive collaboration concerning Telenor Norway’s mobile operation. On 23 November 2016, Norwegian Competition Authority sent a Statement of Objection setting out its preliminary assessment of Telenor’s behaviour in the mobile market; NCA is considering imposing a fine of NOK 906 million against Telenor for an alleged breach of competition law. Telenor submitted its response to the NCA on 7 April 2017 in which it contests the allegations of having breached the competition law.
Telenor SwedenOn 25 April, the European Commission has initiated an investigation on the premises of Telenor Sverige in Stockholm regarding possible abuse of a collective dominant market position and/or possible anti-competitive practices between mobile network operators in Sweden. Similar investigations were simultaneously initiated towards other Swedish mobile network operators.
Telenor PakistanChina Mobile Pak Ltd (with its brand name Zong) has filed a petition before the Islamabad High Court, whereby it challenges the legality of the Telecommunication Policy 2015 (“Policy”) and the Policy Directive (“Directive”) dated 26 April 2017, pursuant to which Telenor Pakistan has been granted the 4G License in 850 MHz spectrum. The primary ground on which the petition has been filed is that, based on the Supreme Court’s decision in a separate matter, allegedly the Policy and the Directive did not receive the sanction of the Federal Government, as constituted by the Prime Minister and the Federal Cabinet. Therefore, it is claimed by Zong that the Directive was not validly issued and therefore all decisions taken under the authority of the Directive have no legal effect. Telenor Pakistan was initially not a party to this case, but has now joined the proceedings since it is the beneficiary of the decisions taken under the Policy and the Directive. Telenor Pakistan has followed the spectrum auction process in a transparent manner and any decision by the Court against the Policy/Directive would be on account of procedural error by the Government of Pakistan and such a decision would be vigorously appealed by Telenor Pakistan.
GrameenphoneSIM tax on replacement SIM cards case as referred in the Annual Report 2016 note 33 for the period July 2007 to December 2011. In July 2017 LTU-VAT issued a show-cause notice to Grameenphone relating to SIM tax on replacement SIMs, for the period July 2012 – June 2015. To the
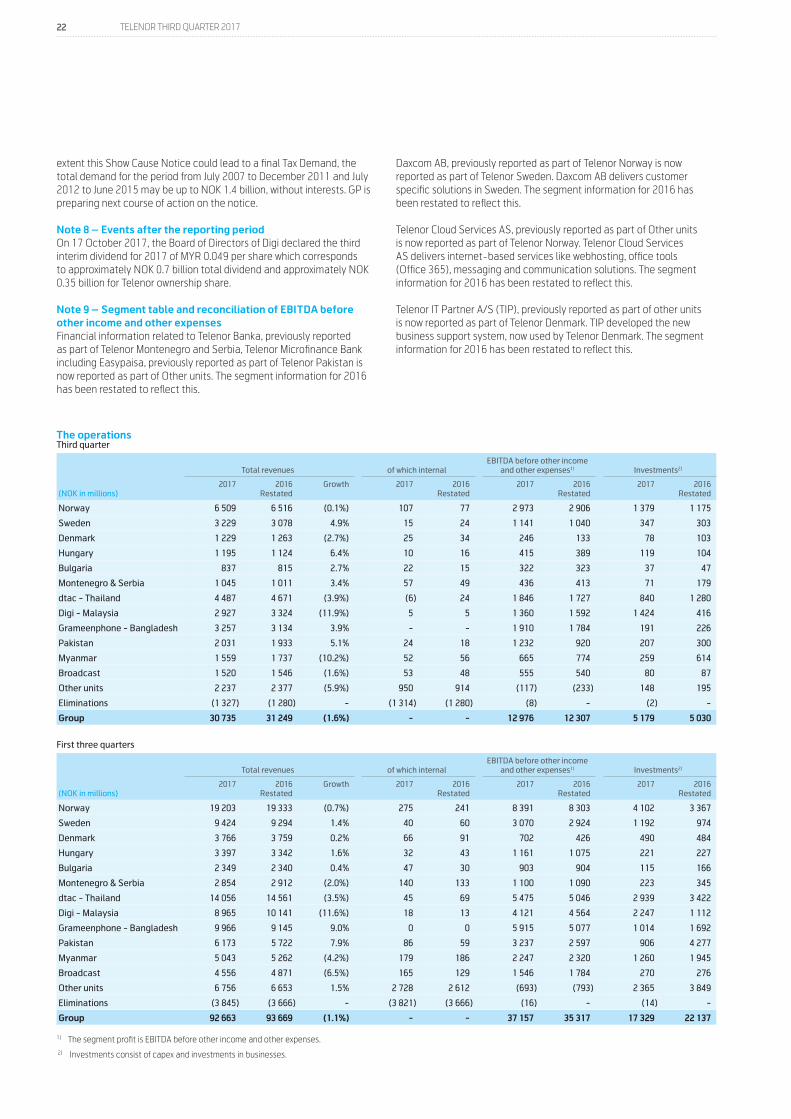
22 TELENOR THIRD QUARTER 2017
extent this Show Cause Notice could lead to a final Tax Demand, the total demand for the period from July 2007 to December 2011 and July 2012 to June 2015 may be up to NOK 1.4 billion, without interests. GP is preparing next course of action on the notice.
Note 8 – Events after the reporting periodOn 17 October 2017, the Board of Directors of Digi declared the third interim dividend for 2017 of MYR 0.049 per share which corresponds to approximately NOK 0.7 billion total dividend and approximately NOK 0.35 billion for Telenor ownership share.
Note 9 – Segment table and reconciliation of EBITDA before other income and other expensesFinancial information related to Telenor Banka, previously reported as part of Telenor Montenegro and Serbia, Telenor Microfinance Bank including Easypaisa, previously reported as part of Telenor Pakistan is now reported as part of Other units. The segment information for 2016 has been restated to reflect this.
The operationsThird quarter
Total revenues of which internalEBITDA before other income
and other expenses1) Investments2)
(NOK in millions)2017 2016
RestatedGrowth 2017 2016
Restated2017 2016
Restated2017 2016
Restated
Norway 6 509 6 516 (0.1%) 107 77 2 973 2 906 1 379 1 175
Sweden 3 229 3 078 4.9% 15 24 1 141 1 040 347 303
Denmark 1 229 1 263 (2.7%) 25 34 246 133 78 103
Hungary 1 195 1 124 6.4% 10 16 415 389 119 104
Bulgaria 837 815 2.7% 22 15 322 323 37 47
Montenegro & Serbia 1 045 1 011 3.4% 57 49 436 413 71 179
dtac - Thailand 4 487 4 671 (3.9%) (6) 24 1 846 1 727 840 1 280
Digi - Malaysia 2 927 3 324 (11.9%) 5 5 1 360 1 592 1 424 416
Grameenphone - Bangladesh 3 257 3 134 3.9% - - 1 910 1 784 191 226
Pakistan 2 031 1 933 5.1% 24 18 1 232 920 207 300
Myanmar 1 559 1 737 (10.2%) 52 56 665 774 259 614
Broadcast 1 520 1 546 (1.6%) 53 48 555 540 80 87
Other units 2 237 2 377 (5.9%) 950 914 (117) (233) 148 195
Eliminations (1 327) (1 280) - (1 314) (1 280) (8) - (2) -
Group 30 735 31 249 (1.6%) - - 12 976 12 307 5 179 5 030
First three quarters
Total revenues of which internalEBITDA before other income
and other expenses1) Investments2)
(NOK in millions)2017 2016
RestatedGrowth 2017 2016
Restated2017 2016
Restated2017 2016
Restated
Norway 19 203 19 333 (0.7%) 275 241 8 391 8 303 4 102 3 367
Sweden 9 424 9 294 1.4% 40 60 3 070 2 924 1 192 974
Denmark 3 766 3 759 0.2% 66 91 702 426 490 484
Hungary 3 397 3 342 1.6% 32 43 1 161 1 075 221 227
Bulgaria 2 349 2 340 0.4% 47 30 903 904 115 166
Montenegro & Serbia 2 854 2 912 (2.0%) 140 133 1 100 1 090 223 345
dtac - Thailand 14 056 14 561 (3.5%) 45 69 5 475 5 046 2 939 3 422
Digi - Malaysia 8 965 10 141 (11.6%) 18 13 4 121 4 564 2 247 1 112
Grameenphone - Bangladesh 9 966 9 145 9.0% 0 0 5 915 5 077 1 014 1 692
Pakistan 6 173 5 722 7.9% 86 59 3 237 2 597 906 4 277
Myanmar 5 043 5 262 (4.2%) 179 186 2 247 2 320 1 260 1 945
Broadcast 4 556 4 871 (6.5%) 165 129 1 546 1 784 270 276
Other units 6 756 6 653 1.5% 2 728 2 612 (693) (793) 2 365 3 849
Eliminations (3 845) (3 666) - (3 821) (3 666) (16) - (14) -
Group 92 663 93 669 (1.1%) - - 37 157 35 317 17 329 22 137
1) The segment profit is EBITDA before other income and other expenses. 2) Investments consist of capex and investments in businesses.
Daxcom AB, previously reported as part of Telenor Norway is now reported as part of Telenor Sweden. Daxcom AB delivers customer specific solutions in Sweden. The segment information for 2016 has been restated to reflect this.
Telenor Cloud Services AS, previously reported as part of Other units is now reported as part of Telenor Norway. Telenor Cloud Services AS delivers internet-based services like webhosting, office tools (Office 365), messaging and communication solutions. The segment information for 2016 has been restated to reflect this.
Telenor IT Partner A/S (TIP), previously reported as part of other units is now reported as part of Telenor Denmark. TIP developed the new business support system, now used by Telenor Denmark. The segment information for 2016 has been restated to reflect this.
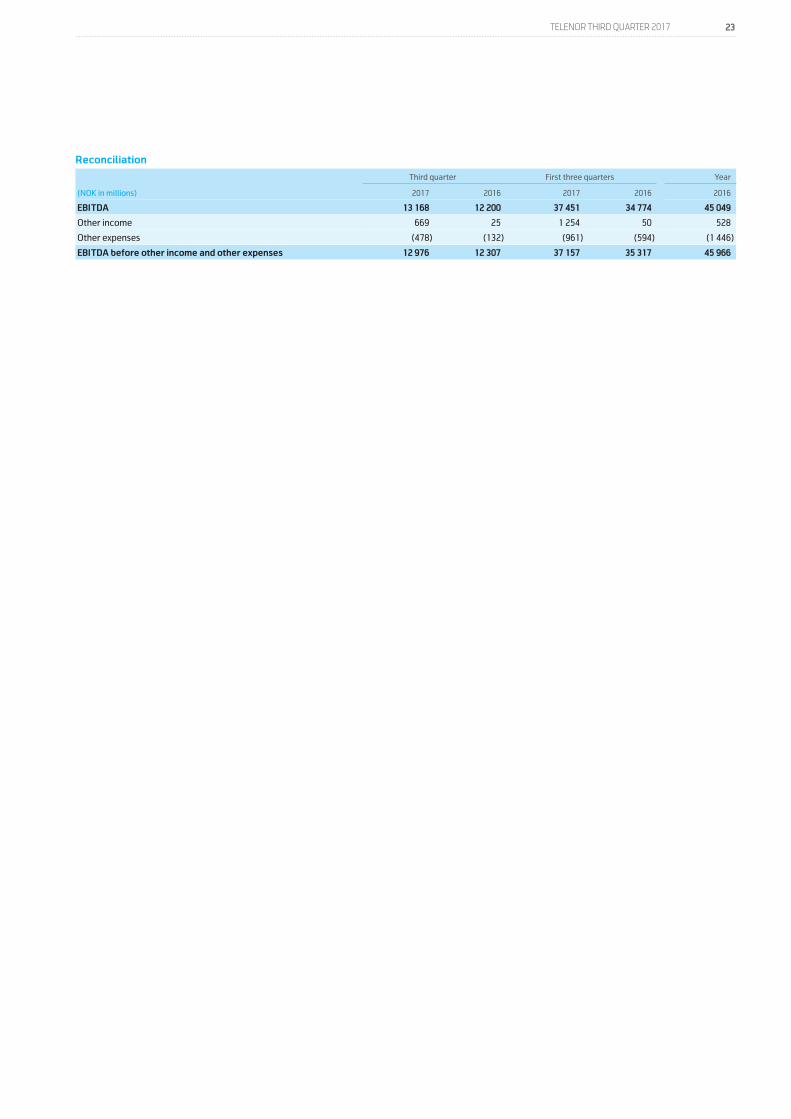
23 TELENOR THIRD QUARTER 2017
Reconciliation
Third quarter First three quarters Year
(NOK in millions) 2017 2016 2017 2016 2016
EBITDA 13 168 12 200 37 451 34 774 45 049
Other income 669 25 1 254 50 528
Other expenses (478) (132) (961) (594) (1 446)
EBITDA before other income and other expenses 12 976 12 307 37 157 35 317 45 966
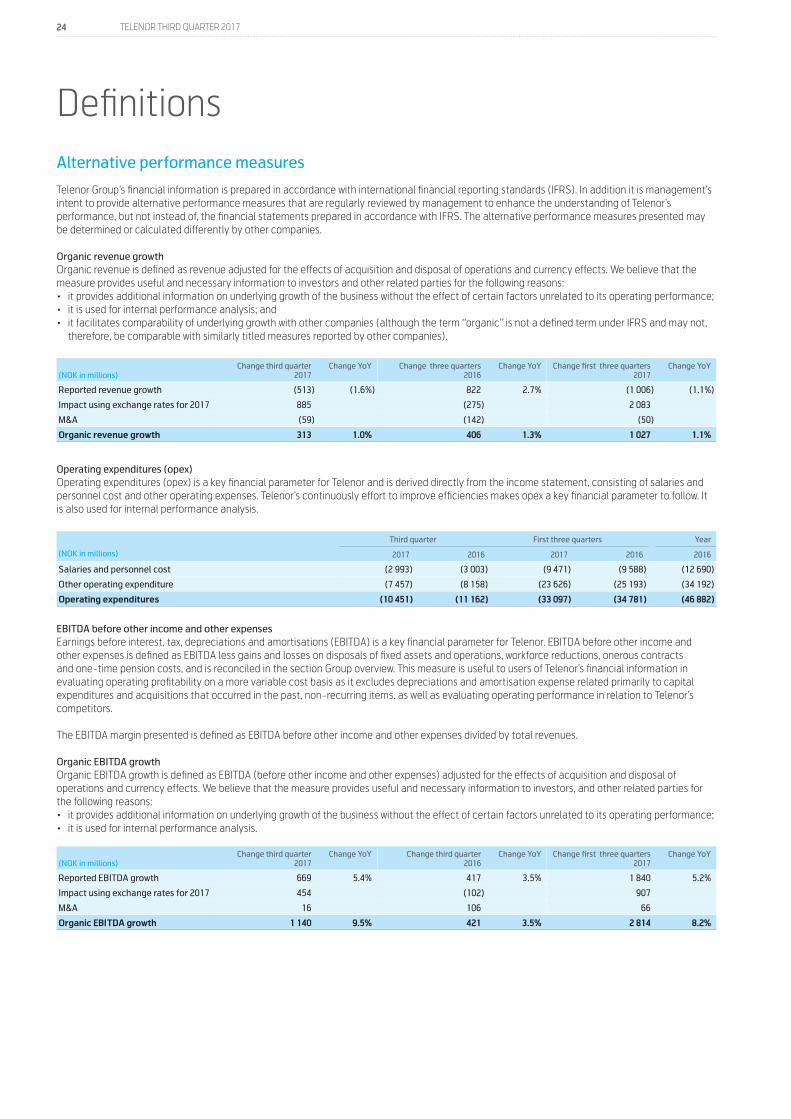
24 TELENOR THIRD QUARTER 2017
Alternative performance measures
Telenor Group’s financial information is prepared in accordance with international financial reporting standards (IFRS). In addition it is management’s intent to provide alternative performance measures that are regularly reviewed by management to enhance the understanding of Telenor’s performance, but not instead of, the financial statements prepared in accordance with IFRS. The alternative performance measures presented may be determined or calculated differently by other companies.
Organic revenue growthOrganic revenue is defined as revenue adjusted for the effects of acquisition and disposal of operations and currency effects. We believe that the measure provides useful and necessary information to investors and other related parties for the following reasons:• it provides additional information on underlying growth of the business without the effect of certain factors unrelated to its operating performance;• it is used for internal performance analysis; and• it facilitates comparability of underlying growth with other companies (although the term “organic” is not a defined term under IFRS and may not,
therefore, be comparable with similarly titled measures reported by other companies).
(NOK in millions)Change third quarter
2017Change YoY Change three quarters
2016Change YoY Change first three quarters
2017Change YoY
Reported revenue growth (513) (1.6%) 822 2.7% (1 006) (1.1%)
Impact using exchange rates for 2017 885 (275) 2 083
M&A (59) (142) (50)
Organic revenue growth 313 1.0% 406 1.3% 1 027 1.1%
Operating expenditures (opex)Operating expenditures (opex) is a key financial parameter for Telenor and is derived directly from the income statement, consisting of salaries and personnel cost and other operating expenses. Telenor’s continuously effort to improve efficiencies makes opex a key financial parameter to follow. It is also used for internal performance analysis.
Third quarter First three quarters Year
(NOK in millions) 2017 2016 2017 2016 2016
Salaries and personnel cost (2 993) (3 003) (9 471) (9 588) (12 690)
Other operating expenditure (7 457) (8 158) (23 626) (25 193) (34 192)
Operating expenditures (10 451) (11 162) (33 097) (34 781) (46 882)
EBITDA before other income and other expensesEarnings before interest, tax, depreciations and amortisations (EBITDA) is a key financial parameter for Telenor. EBITDA before other income and other expenses is defined as EBITDA less gains and losses on disposals of fixed assets and operations, workforce reductions, onerous contracts and one-time pension costs, and is reconciled in the section Group overview. This measure is useful to users of Telenor’s financial information in evaluating operating profitability on a more variable cost basis as it excludes depreciations and amortisation expense related primarily to capital expenditures and acquisitions that occurred in the past, non-recurring items, as well as evaluating operating performance in relation to Telenor’s competitors.
The EBITDA margin presented is defined as EBITDA before other income and other expenses divided by total revenues.
Organic EBITDA growthOrganic EBITDA growth is defined as EBITDA (before other income and other expenses) adjusted for the effects of acquisition and disposal of operations and currency effects. We believe that the measure provides useful and necessary information to investors, and other related parties for the following reasons:• it provides additional information on underlying growth of the business without the effect of certain factors unrelated to its operating performance;• it is used for internal performance analysis.
(NOK in millions)Change third quarter
2017Change YoY Change third quarter
2016Change YoY Change first three quarters
2017Change YoY
Reported EBITDA growth 669 5.4% 417 3.5% 1 840 5.2%
Impact using exchange rates for 2017 454 (102) 907
M&A 16 106 66
Organic EBITDA growth 1 140 9.5% 421 3.5% 2 814 8.2%
Definitions
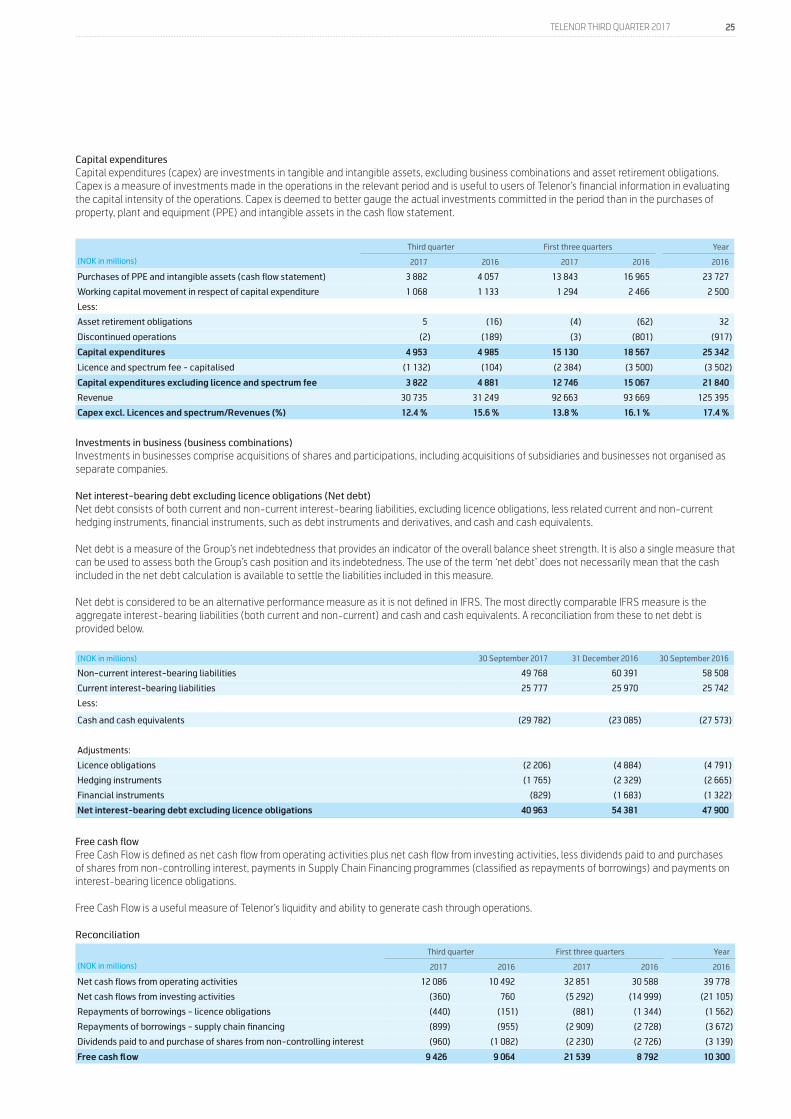
25 TELENOR THIRD QUARTER 2017
Capital expendituresCapital expenditures (capex) are investments in tangible and intangible assets, excluding business combinations and asset retirement obligations. Capex is a measure of investments made in the operations in the relevant period and is useful to users of Telenor’s financial information in evaluating the capital intensity of the operations. Capex is deemed to better gauge the actual investments committed in the period than in the purchases of property, plant and equipment (PPE) and intangible assets in the cash flow statement.
Third quarter First three quarters Year
(NOK in millions) 2017 2016 2017 2016 2016
Purchases of PPE and intangible assets (cash flow statement) 3 882 4 057 13 843 16 965 23 727
Working capital movement in respect of capital expenditure 1 068 1 133 1 294 2 466 2 500
Less:
Asset retirement obligations 5 (16) (4) (62) 32
Discontinued operations (2) (189) (3) (801) (917)
Capital expenditures 4 953 4 985 15 130 18 567 25 342
Licence and spectrum fee - capitalised (1 132) (104) (2 384) (3 500) (3 502)
Capital expenditures excluding licence and spectrum fee 3 822 4 881 12 746 15 067 21 840
Revenue 30 735 31 249 92 663 93 669 125 395
Capex excl. Licences and spectrum/Revenues (%) 12.4 % 15.6 % 13.8 % 16.1 % 17.4 %
Investments in business (business combinations) Investments in businesses comprise acquisitions of shares and participations, including acquisitions of subsidiaries and businesses not organised as separate companies.
Net interest-bearing debt excluding licence obligations (Net debt)Net debt consists of both current and non-current interest-bearing liabilities, excluding licence obligations, less related current and non-current hedging instruments, financial instruments, such as debt instruments and derivatives, and cash and cash equivalents.
Net debt is a measure of the Group’s net indebtedness that provides an indicator of the overall balance sheet strength. It is also a single measure that can be used to assess both the Group’s cash position and its indebtedness. The use of the term ‘net debt’ does not necessarily mean that the cash included in the net debt calculation is available to settle the liabilities included in this measure.
Net debt is considered to be an alternative performance measure as it is not defined in IFRS. The most directly comparable IFRS measure is the aggregate interest-bearing liabilities (both current and non-current) and cash and cash equivalents. A reconciliation from these to net debt is provided below.
(NOK in millions) 30 September 2017 31 December 2016 30 September 2016
Non-current interest-bearing liabilities 49 768 60 391 58 508
Current interest-bearing liabilities 25 777 25 970 25 742
Less:
Cash and cash equivalents (29 782) (23 085) (27 573)
Adjustments:
Licence obligations (2 206) (4 884) (4 791)
Hedging instruments (1 765) (2 329) (2 665)
Financial instruments (829) (1 683) (1 322)
Net interest-bearing debt excluding licence obligations 40 963 54 381 47 900
Free cash flowFree Cash Flow is defined as net cash flow from operating activities plus net cash flow from investing activities, less dividends paid to and purchases of shares from non-controlling interest, payments in Supply Chain Financing programmes (classified as repayments of borrowings) and payments on interest-bearing licence obligations.
Free Cash Flow is a useful measure of Telenor’s liquidity and ability to generate cash through operations.
Reconciliation
Third quarter First three quarters Year
(NOK in millions) 2017 2016 2017 2016 2016
Net cash flows from operating activities 12 086 10 492 32 851 30 588 39 778
Net cash flows from investing activities (360) 760 (5 292) (14 999) (21 105)
Repayments of borrowings - licence obligations (440) (151) (881) (1 344) (1 562)
Repayments of borrowings - supply chain financing (899) (955) (2 909) (2 728) (3 672)
Dividends paid to and purchase of shares from non-controlling interest (960) (1 082) (2 230) (2 726) (3 139)
Free cash flow 9 426 9 064 21 539 8 792 10 300
26 TELENOR THIRD QUARTER 2017
Mobile operations
RevenuesSubscription and trafficConsist of subscription and connection fees, revenues from voice (outgoing traffic) and non-voice traffic, outbound roaming and other mobile service revenues. Subscription and traffic includes only revenues from the company’s own subscriptions.
InterconnectConsist of revenues from incoming traffic related to the company’s own subscriptions. Revenues from incoming traffic related to service provider or MVNO subscriptions are not included.
Other mobileConsist of inbound roaming, national roaming, telemetric and revenues related to service providers and MVNOs (Mobile Virtual Network Operators). Telemetric is defined as machine-to-machine SIM cards (M2M), for example vending machines and meter readings.
Non-mobileConsist of revenues from customer equipment and businesses that are not directly related to mobile operations.
Mobile revenues from company’s own subscriptionsConsist of ‘Subscription and traffic’ and ‘Interconnect’ and do not include revenues from inbound roaming, national roaming, service providers, MVNOs, sale of customer equipment and incoming traffic related to service provider subscriptions.
Key FiguresSubscriptionsContract subscriptions are counted until the subscription is terminated or until there has been no revenues or outgoing/incoming traffic during the last three months. Prepaid subscriptions are counted as active if there has been outgoing or incoming traffic or if the SIM card has been reloaded during the last three months. Service provider and MVNO subscriptions are not included. Data only SIM cards are included, but SIM cards used for telemetric applications and twin/multi SIM cards are excluded. Total subscriptions are voice SIM cards plus data only SIM cards used for mobile broadband.
Active mobile internet usersActive mobile internet users are subscriptions with at least 150 KB of data during the last three months.
Average traffic minutes per subscription per month (AMPU)Traffic minutes per subscription per month are calculated based on total outgoing and incoming rated minutes from the company’s own subscriptions less data only subscriptions. This includes zero rated minutes and outgoing minutes from own subscriptions while roaming. Outgoing and incoming minutes related to inbound roaming, national roaming, service providers and MVNOs are not included.
Average revenue per subscription per month (ARPU)ARPU is calculated based on mobile revenues from the company’s own subscriptions, divided by the average number of subscriptions for the relevant period.
27 TELENOR THIRD QUARTER 2017
Fixed operations
RevenuesTelephonyConsist of subscription and connection fees, traffic (fixed to fixed, fixed to mobile, to other countries, value added services, other traffic) for PSTN/ISDN and Voice over Internet Protocol (VoIP).
Internet and TVConsist of subscription, traffic charges and connection fees for xDSL, cable and fibre, in addition to revenues from TV services. High speed fixed internet include fibre, cable and VDSL.
Data servicesConsist of Nordic Connect/IP-VPN and security.
OtherConsist of leased lines, managed services and other retail products.
WholesaleConsist of sale to service providers of telephony (PSTN/ISDN), Bitstream, LLUB, national and international interconnect, transit traffic, leased lines and other wholesale products.
Key FiguresSubscriptionsTelephony consists of PSTN, ISDN and VoIP subscriptions. Internet consists of broadband access over xDSL, fibre and cable. TV consists of TV services over fibre and cable. Subscriptions are counted until the subscription is terminated.
Average revenue per subscription per month (ARPU)ARPU is calculated based on revenues from the company’s own subscriptions, divided by the average number of subscriptions for the relevant period. Internet ARPU is calculated based on Internet revenues as defined above except TV service revenues. TV ARPU is calculated based on revenues from TV services.
BroadcastRevenuesCanal Digital DTHConsist of revenues from Nordic DTH subscribers and households in SMATV networks.
SatelliteConsist of revenues from satellite services from the satellite position 1-degree west.
NorkringConsist of revenues from terrestrial radio and TV transmission in Norway and Belgium.

Third quarter 2017Published by Telenor ASAN-1360 Fornebu, NorwayPhone: +47 67 89 00 00
Investor Relations:E-mail: [email protected]
www.telenor.com
2171
209
• Bo
lt Co
mm
unic
atio
n AS
• b
oltc
omm
unic
atio
n.no