Embed Size (px)
Citation preview


CONTENTS
1.0 PERFORMANCE OVERVIEW .............................................................................. 3
2.0 CHILD PROTECTION AND WELFARE SERVICES ............................................. 8
2.1 Referrals (Child Welfare And Child Abuse/Neglect) ........................................................................ 8
2.2 Social Work Activity Data (Child Protection & Welfare) ................................................................. 13
2.3 Child Protection Notification System .............................................................................................. 19
2.4 Emergency Out Of Hours Social Work Service / Crisis Intervention Service ................................ 22
3.0 ALTERNATIVE CARE SERVICES...................................................................... 24
3.1 Children in Care (Foster Care / Residential Care) ......................................................................... 24
3.2 Aftercare ......................................................................................................................................... 34
3.3 Adoption Services .......................................................................................................................... 34
3.4 Foster Carers ................................................................................................................................. 41
3.5 Hiqa Inspections ............................................................................................................................. 47
4.0 REGULATION AND SUPERVISION OF CHILDREN’S SERVICES ................... 48
4.1 Early Years Inspectorate ................................................................................................................ 48
4.2 Alternative Education Regulation ................................................................................................... 50
4.3 Non-Statutory Alternative Care Services ....................................................................................... 52
5.0 EDUCATIONAL WELFARE SERVICES ............................................................. 53
6.0 FAMILY SUPPORT SERVICES .......................................................................... 57
6.1 Family Support Services ................................................................................................................ 57
6.2 Meitheal .......................................................................................................................................... 63
7.0 HUMAN RESOURCES ........................................................................................ 69
8.0 FINANCE ............................................................................................................. 77
APPENDIX I .................................................................................................................. 79
APPENDIX I – Hiqa Inspections .................................................................................. 80
28 November 2017

3
1.0 PERFORMANCE OVERVIEW
This report provides an update on the performance and activity of Tusla services at the end of Q3
2017. It is structured around key performance and activity measures included in the Agency’s
2017 Business Plan. The data presented was provided by services and refers to the latest
performance and activity information available at this time. These data can change from
data previously published due to the ongoing validation of data.
The summary by service type set out below provides an overview of the Q3 2017 position
regarding activity and performance.
CHILD PROTECTION AND WELFARE SERVICES
Referrals
� 14,263 referrals for Q2 2017; 634 (5%) more than Q1 and the highest number for the
period Q1 2014 – Q2 2017.
� 65% (n=9,264) for child welfare concerns; 1,093 (13%) more than Q1
� 35% (n=4,999) for child abuse concerns; 459 (8%) fewer than Q1
� 34% (n=4,758) of referrals required an initial assessment; down six percentage points on
Q1 and the lowest percentage for the period Q1 2016 – Q2 2017
Social Work Activity Data
� 25,919 cases open to social work at the end of Q3 2017; 53 more than Q2 2017
� 80% (n=20,635) of open cases allocated to named social worker; up from 77% (19,973) at
the end of Q2 2017
� 5,284 cases awaiting allocation at the end of Q3 2017; 609 (10%) fewer than Q2 2017;
nearly one-third (n=1,507) “active” on a duty system i.e., actions being taken to progress
the case
� 18% (n=966) of cases awaiting allocation at the end of Q3 2017 were categorised as ‘high
priority’; down 25 (7%) from Q2 2017
� 63% (n=609) of ‘high priority’ cases awaiting allocation at the end of Q3 2017 were
waiting less than 3 months.
Child Protection Notification System
� 1,402 children listed as ‘active’ on the CPNS at the end of Q3 2017; 46 more than Q2 2017.
Highest number for the period Q4 2016 – Q3 2017.
� All but two children listed as “active” at the end of Q2 2017 had an allocated social worker.

4
ALTERNATIVE CARE SERVICES
Children in Care
� 6,230 children in care at the end of Q3 2017, down 67 from Q2 2017 and 78 from Q1 2017
� 600 children in private placements, down 16 from Q2 2017
� 95% (n=5,916) of children in care had an allocated social worker (against a target of 100%); no
change from Q2 2017
� 314 children awaiting allocation of a social worker; 21 more than Q2 2017
� 93% (n=5,802) of children in care had an up to date care plan (against a target of 90%); down
one percentage point from Q2 2017
� A total of 428 children without an up-to-date care plan, 46 more than Q2 2017
Aftercare
� 1,989 young adults (all ages) in receipt of aftercare services at the end of Q3 2017; 7 fewer
than Q2
� 86% (n=1,638/1,914) of young adults 18-22 in receipt of aftercare services had an allocated
aftercare worker; no change from Q2 2017
� 84% (n=1,608/1,914) of young adults 18-22 in receipt of aftercare services had an aftercare
plan; up two percentage points on Q2 2017
� 157 young adults were discharged from care by reason of reaching 18 years; 388 discharged
2017 YTD. 85% (n=134) had an allocated aftercare worker, up one percentage points on Q2
2017
Emergency Out of Hours Social Work Service / Crisis Intervention Service
� 234 referrals to the Crisis Intervention Service (CIS)1 during Q3 2017; 23 more than Q2
� 83 children were placed with the CIS during Q3 2017; 20 more than Q2
� 181 referrals to the Emergency Out of Hours Social Work Service (EOHS) (includes service
operating in Cork) during Q3 2017; 71 fewer than Q2 2017
� 67 children were placed during Q3 2017, 25 fewer than Q2

5
REGULATION & SUPERVISION OF CHILDREN’S SERVICES
Adoption
� 189 new applications to commence tracing for a searched person in Q3 2017; 755 received
2017 YTD
� 828 applicants awaiting an information and tracing service at the end of Q3 2017; up 74 on Q2
� All but one service meeting the target of eight weeks or less from time of application to
provision of non-identifying information
� 41 receipted completed applications for adoption (all types) received in Q3 2017; 138 received
2017 YTD
� 49 new children were referred for adoption in Q3 2017; 142 referred 2017 YTD
� 34 completed adoption assessments presented to Local Adoption Committees in Q3 2017 ; 109
presented 2017 YTD
Foster Carers
� 4,443 foster carers on the panel of approved foster carers at the end of Q3 2017; eight more
than Q2 but 80 fewer than Q3 2016
� 79% (n=1,171/1,473) of relative foster carers approved against a target of 80%
� 92% (n=2,571) of general foster carers had an allocated link (target 90%), up two percentage
points on Q2. A total of 235 awaiting, 59 fewer than Q2 2017
� 88% (n=1,034) of approved relative foster carers had an allocated link worker (target of
85%), up one percentage point on Q2. Total of 137 awaiting allocation, 22 fewer than Q2
2017
� 302 unapproved relative foster carers, nine fewer than Q2 2017
� 258 (85%) of the unapproved relative foster carers had a child placed with them for longer
than 12 weeks; 13 fewer than Q2 2017
� 80% (n=207) of unapproved relative foster carers with a child placed > 12 weeks had an
allocated link (social) worker; 51 awaiting allocation, 17 fewer than Q2 2017
Early Years Services
� 4,501 EYS on the register nationally at the end of Q32017; 33 more than Q2 2017
� 550 EYS inspections (all types) carried out during Q3 2017; 79 (17%) more than Q2 2017
� 54 complaints received in respect of EYS during Q3 2017; 44 fewer than Q2 2017

6
FAMILY SUPPORT SERVICES
Alternative Education Regulation
Home Education
� 1,400 children on the register for home education at the end of Q3 2017
� 167 applications for home education during Q2 2017 bringing the total for 2017 to 413
� 236 children awaiting assessment for registration at the end of Q3 2017; 76 more than Q2
� 745 registered children awaiting a review at the end of Q3 2017; 33 fewer than Q2
Independent Schools
� 4,825 children attending 43 assessed schools at the end of Q3 2017
� 24 children’s applications for education in independent schools received in Q3 2017
bringing the total for 2017 to 307
� 44 children registered during Q3 2017 bringing the total for 2017 to 1,078
� 936 children awaiting registration at the end of Q3 2017; 27 fewer than Q2
Non-Statutory Alternative Care Services
� 115 non-statutory residential centres at the end of Q3 2017
� 19 inspections (all types and onsite) conducted in Q3 2017 bringing the total for 2017 YTD to 70
� 6 non statutory foster care services at the end of Q3 2017
Family Support Services (data provisional)
� At least 21,575 children in receipt of family support services at the end of June 2017
� At least 17,580 children referred to family support services between January and June 2017
� 72% (12,708) of children referred to family support services (Jan – Jun 2017) received a service
Meitheal and Child & Family Support Networks
� 804 Meitheal processes requested January – June 2017
� 46% (369) requested through Direct Access and 45% (362) requested through Social Work
Diversion
� 53% (423) of Meitheal processes requested January – June 2017 proceeded to Stage 2 (Discussion
Stage)
� 380 Meitheal processes reached completion of Stage 2 between January – June 2017; 72% (272)
of these proceeded to Stage 3 (Delivery)
� 473 Meitheal processes were closed January to June 2017; 54% (253) were closed following
submission of a Meitheal request form; 18% (87) closed following completion of Stage 2; 9% (41)
closed following commencement of Stage 3 and 19% (92) closed post- delivery.
� 88 Child and Family Support Networks (CFSN) operating at the end of June 2017, with a further
53 planned.

7
EDUCATIONAL WELFARE SERVICES
HUMAN RESOURCES OVERVIEW
FINANCIAL OVERVIEW
Educational Welfare Services
� 3,522 new individual children worked with in the academic 2016/2017
� 960 screened referrals on a waiting list at the end of Sept 2017; 201 fewer than August 2017
� 721 school attendance notices (SANs) issued in respect of 485 children under Section 25 of the
Education (Welfare) Act 20001 , in the academic 2016/2017
� 156 summonses issued in respect of 109 children under Section 25 of the Act, in the academic
2016/2017
� 216 Section 24 meetings convened by EWOs, in the academic 2016/2017
Human Resources
� 3,644 (WTE) employed by the Agency at the end of Q3 2017; 7 more than Q2 2017 and 89 more
than Q3 2016
� 294 new staff came on to the Agency’s payroll (Jan - Sept 2017)
� 254 staff left (incl. retirements) the Agency (Jan - Sept 2017)
� 127 staff on maternity leave (incl. 39 unpaid) at the end of Sept 2017
� 451 agency staff employed by Tusla at the end of Sept 2017
� 5.21% absence rate (Aug 2017); 0.64 percentage points higher than Q2 2017
� 82 courses run by Workforce Learning and Development in Q3 2017; 930 attendees
Finance
� The financial outturn for the year to date (Sept 2017) is an over-spend of €8.085 million
� Pay costs are over-spent against budget by €1.117 million
� Non pay costs are over-spent against budget by €8.236 million
� Key area of over-spend is private residential and foster care costs at €8.183 million over
budget
� 41% (€9.791 million) of legal expenditure year to date on guardians ad litem (GALs),
including GAL’s solicitors and counsel.

8
2.0 CHILD PROTECTION AND WELFARE SERVICES
KEY AREAS OF FOCUS
2.1 Referrals (child welfare and child abuse)
2.2 Social Work Activity Data
2.3 Child Protection Notification System (CPNS)
2.4 Crisis Intervention Service / Out of Hours Service
2.1 REFERRALS (CHILD WELFARE AND CHILD ABUSE/NEGLECT)
Number of Referrals
• 14,263 referrals to Child Protection and Welfare Service during Q2 20171; 634 (5%) more
than Q1 2017 and the highest number for the period Q1 2014 – Q2 2017 (Fig. 1). This brings
to 27,892 the number of referrals for the first six months of 2017, some 4,322 (18%) more
than the first six months of 2016.
• 65% (n=9,264) of referrals for Q2 2017 were for child welfare concerns; 1,093 (13%) more
than Q1 2017. The remaining 35% (n=4,999) were for child abuse/neglect concerns; 459
(8%) fewer than Q1 2017.
Figure 1: Number of referrals (child welfare and abuse/neglect) by quarter
1 Data on referrals are reported quarterly in arrears.
10
,85
3
11
,45
0
10
,38
4
10
,94
3
10
,99
3
10
,89
9
10
,71
1
10
,99
3
11
,30
6 12
,26
4
11
,73
2
12
,09
7
13
,62
9
14
,26
3
9,000
12,000
15,000
Q1
2014
Q2
2014
Q3
2014
Q4
2014
Q1
2015
Q2
2015
Q3
2015
Q4
2015
Q1
2016
Q2
2016
Q3
2016
Q4
2016
Q1
2017
Q2
2017
Nu
mb
er
of
refe
rra
ls
Total Referrals
Total Referrals
2,000
4,000
6,000
8,000
10,000
Q1
2014
Q2
2014
Q3
2014
Q4
2014
Q1
2015
Q2
2015
Q3
2015
Q4
2015
Q1
2016
Q2
2016
Q3
2016
Q4
2016
Q1
2017
Q2
2017
Nu
mb
er
of
refe
rra
ls
Referrals by Type
Welfare Abuse
Key Facts
� 14,263 referrals for Q2 2017; 634 (5%) more than Q1 and the highest number for the
period Q1 2014 – Q2 2017.
� 65% (n=9,264) for child welfare concerns; 1,093 (13%) more than Q1
� 35% (n=4,999) for child abuse concerns; 459 (8%) fewer than Q1
� 34% (n=4,758) of referrals required an initial assessment; down six percentage points on
Q1 and the lowest percentage for the period Q1 2016 – Q2 2017

9
Referrals by Area • Six areas (Midlands, Dublin North, Cork, Waterford/Wexford, MidWest and
Galway/Roscommon) reported in excess of 1,000 referrals in Q2 2017 with a further five
areas reporting between 500 and 1,000 referrals (Figure 2).
• 10 areas reported an increase in referrals from Q1 2017, ranging from 204 (Donegal) to
eight (CW/KK/ST).
• 7 areas reported a decrease ranging from 128 (Dublin North) to seven (Dublin South
Central).
Figure 2: Referrals by area Q1 2016 – Q2 2017
Rate of Referrals Q2 2017
• 14,263 referrals equates to about 12 referrals per 1,000 population under 18 years. It
should be noted that more than one referral can be received in relation to a child (i.e., for
separate incidents) and as a result the number of children involved is likely to be fewer
than the number of referrals.
• Midlands area reported the highest rate of referrals at 25/1,000 children, more than double
the national rate, followed by WD/WX (18/1,000) (Table 1). The lowest rate was reported
by Dublin South Central and Dublin South East/Wicklow (7/1,000 children).
• Eight areas (Midlands, Dublin North City, Cork, CW/KK/ST, WD/WX, MidWest, GY/RN
and SLWC) reported a rate higher than the national rate of 12/1,ooo population under 18
years.
Table 1: Rate of referrals
Area Referrals Q2 2017 Population 0-17
years*
Rate / 1,000 population 0 – 17
years
DSC 484 65,564 7
DSE/WW 571 86,810 7
DSW/K/WW 873 108,186 8
DSCDSE/
WW
DSW/
K/WW
Midla
ndsDNC
Dublin
North
LH/M
H
CN/M
NCork Kerry
CW/K
K/ST
WD/
WX
Mid
WestGY/RN Mayo
Doneg
al
SO/L
M/WC
Q1 2016 495 548 743 1,217 686 927 737 234 1,431 300 567 987 1,039 759 212 252 172
Q2 2016 403 524 704 1,432 788 1,116 852 273 1,604 294 694 1,082 1,021 901 164 191 221
Q3 2016 377 519 802 1,385 656 1,063 800 290 1,434 259 799 930 1,012 787 207 231 181
Q4 2016 454 425 838 1,401 609 1,218 706 229 1,439 304 855 1,007 1,085 806 276 248 197
Q1 2017 491 589 764 1,906 692 1,197 867 329 1,572 325 900 1,131 1,069 1,010 231 261 295
Q2 2017 484 571 873 2,025 642 1,069 791 300 1,726 317 908 1,255 1,255 1,025 242 465 315
Diff Q2 v Q1 -7 -18 109 119 -50 -128 -76 -29 154 -8 8 124 186 15 11 204 20
0
500
1,000
1,500
2,000
2,500
Nu
mb
er
of
refe
rra
ls

10
Midlands 2,025 80,193 25
DNC 642 44,927 14
Dublin North 1,069 100,654 11
LH/MH 791 93,093 8
CN/MN 300 36,446 8
Cork 1,726 134,015 13
Kerry 317 34,527 9
CW/KK/ST 908 63,009 14
WD/WX 1,255 68,513 18
MidWest 1,255 96,266 13
GY/RN 1,025 79,912 13
Mayo 242 31,968 8
Donegal 465 42,865 11
SLWC 315 23,554 13
National 14,263 1,190,502 12
*CSO Census 2016
Referrals by Area and Type, Q2 2017
• An area breakdown of referrals by type (abuse / welfare) for Q2 2017 is presented in the
chart below (Figure 3).
• Nationally, there was 35:65 split between referrals of abuse/neglect and welfare. This
varied across the areas and ranged from a 64:36 split for Dublin North to a 13:87 split for
Cavan/Monaghan. Seven areas reported a percentage higher than the national average of
35% for abuse.
Figure 3: Breakdown of referrals by type and area
• 97% (n=13,866) of referrals for Q2 2017 had a preliminary enquiry2 carried out; down one
percentage point from Q1 2017 (Figure 4).
2 The preliminary enquiries step is concerned with substantiating the details provided by the reporter e.g. verify
reporters phone number, child’s address, concern, check if the child is already known to the service, other network
DSCDSE/
WW
DSW/
K/W
W
Midla
ndsDNC
Dubli
n
North
LH/M
H
CN/
MNCork Kerry
CW/K
K/ST
WD/
WX
Mid
West
GY/R
NMayo
Done
galSLWC
Abuse 275 162 170 412 159 683 461 40 686 173 297 532 438 212 94 125 80
Welfare 209 409 703 1613 483 386 330 260 1040 144 611 723 817 813 148 340 235
% abuse 57% 28% 19% 20% 25% 64% 58% 13% 40% 55% 33% 42% 35% 21% 39% 27% 25%
% Welfare 43% 72% 81% 80% 75% 36% 42% 87% 60% 45% 67% 58% 65% 79% 61% 73% 75%
0
200
400
600
800
1000
1200
1400
1600
1800
Nu
mb
er
of
refe
rra
ls

11
• 34% (n=4,758) of referrals that had a preliminary enquiry required an initial assessment3;
down six percentage points from Q1 2017 and the lowest percentage for the period Q1 2016
– Q2 2017.
Figure 4: Percentage of preliminary enquiries and initial assessments carried out
• A preliminary enquiry was carried out on all referrals (Q2 2017) in 11 areas (Figure 5). The
percentage reported for CN/MN (66%) is significantly lower than all other areas.
Figure 5: Percentage of referrals that had a preliminary enquiry, by area
checks etc. A preliminary enquiry is not an assessment. The aim of the preliminary enquiry process is to support and
help the user (the social worker) to make a decision on the action to take in response to the information reported, that
will result in the best outcome for the child who is the subject of the referral. Preliminary enquiries should normally
be completed within 24 hours. 3 Initial assessment is a time-limited process to allow the gathering of sufficient information on the needs and risks
within a case so that informed decisions and recommendations can be made and actions that will result in better
outcomes for children taken. Initial Assessments should normally be completed in 21 days or less.
99% 98% 97% 98% 98% 97%
46%43%
41% 43%40%
34%
0%
20%
40%
60%
80%
100%
Q1
2016
Q2
2016
Q3
2016
Q4
2016
Q1 2017 Q2 2017
Pe
rce
na
tge
of
refe
rra
ls
% of referrals with a PE carried out % that required an IA following PE
94%
66%
88%99%
88%
99%
0%
20%
40%
60%
80%
100%
Average 97%

12
• The percentage of referrals requiring an initial assessment following a preliminary enquiry
ranged from 63% in Dublin North to 6% in Donegal (Figure 6). Eight areas reported a
percentage below the national average of 34%.
Figure 6: Percentage of referrals requiring an IA following a preliminary enquiry
• The outcome of initial assessment was recorded for 1,599 referrals (Q2 2017) (Figure 7)
• ‘No further action’ was recorded in the majority (54%; n=870) of cases.
• Admission to care was recorded for 1.8% (n=28) of cases and ‘child protection4 ’ was
recorded for 11% (n=175) cases.
Figure 7: Breakdown of actions recorded following initial assessment
4 A child protection conference is requested for child(ren) who require a child protection response, as they have been
assessed as being at ongoing risk of significant harm. A child protection plan is developed at the conference to
safeguard the child(ren) identified as being at risk. Whereas children may suffer harm for a range of reasons, for the
purpose of the child protection conference and the CPNS, the threshold of ongoing risk of significant harm is confined
to abuse, including neglect, attributable to inappropriate or inadequate care from parent/s.
48%49%
52%
39%
46%
63%
10%
29%31%
37%
25%
9%
29%
39%
49%
6%
18%
34%
0%
20%
40%
60%
80%
Pe
rce
na
tge
of
refe
rra
ls
Average
870
54.4%
175
10.9%
168
10.5%
329
20.6%
29
1.8%
28
1.8%
No further Action
Child Protection
Child Welfare/Family
Support
Further Assessment
Family Welfare Conference
Admission to care

13
2.2 SOCIAL WORK ACTIVITY DATA (Child Protection & Welfare)
2.2.1 Open Cases
• 25,919 cases open5 to social work nationally at the end of Q3 2017; 53 more than Q2 2017
and the highest number open for the period Q3 2016 – Q3 2017 (Figure 8).
Figure 8: Number of open cases by quarter
• The number of open of cases ranged from 3,612 (14%) in Cork to 391 (less than 2%) in
Sligo/Leitrim/West Cavan (Figure 9) with an average of 1,525 per area. Eleven of the 17
areas had between 1,000 and 2,000 cases; four areas have fewer than 1,000 cases while
the remaining two areas (Cork and Dublin North) had in excess of 3,000 cases.
• Eight areas reported an increase in open cases from Q2 2017. The highest increase was
reported by CW/KK/ST (n=347), followed by Dublin North City (n=164) and WD/WX
(n=57).
5 Open cases include cases held on intake, allocated, unallocated child welfare and protection and children in care
cases.
25,362
25,034
25,384
25,866 25,919
24,000
25,000
26,000
27,000
Q3
2016
Q4
2016
Q1
2017
Q2
2017
Q3
2017
Nu
mb
er
of
op
en
ca
ses
Key Facts
� 25,919 cases open to social work at the end of Q3 2017; 53 more than Q2 2017
� 80% (n=20,635) of open cases allocated to named social worker; up from 77% (19,973) at
the end of Q2 2017
� 5,284 cases awaiting allocation at the end of Q3 2017; 609 (10%) fewer than Q2 2017;
nearly one-third (n=1,507) “active” on a duty system i.e., actions being taken to progress
the case
� 18% (n=966) of cases awaiting allocation at the end of Q3 2017 were categorised as ‘high
priority’; down 25 (7%) from Q2 2017
� 63% (n=609) of ‘high priority’ cases awaiting allocation at the end of Q3 2017 were waiting
less than 3 months.

14
• Dublin South Central reported the highest decrease (n=193) followed by GY/RN (n=124)
and MidWest (n= 112).
Figure 9: Number of open cases by area
2.2.2 Open Cases Allocated / Awaiting Allocation
• 80% (n=20,635/25,919) of open cases were allocated to a named social worker at the end
of Q3 2017; up three percentage points from Q2 2017 (Figure 10).
• 5,284 (20%) cases were awaiting allocation; 609 (10%) fewer than Q2 2017 (n=5,893).
Nearly one-third (29%; n=1,507) of cases awaiting were “active” on a duty system6.
6 A case awaiting allocation may be “active” on a “duty” system. This means that there are actions being undertaken by a dedicated
duty team or rotating social workers on a duty roster to progress the protection and welfare of the child. Examples of actions being
undertaken include telephone calls relating to the concern, visits to see children, completing initial assessments and child in care
reviews or care plans. The actions undertaken must have occurred within the monthly MTP reporting period. There must be
evidence of actions progressing the protection and welfare of the child and not simply a management review of a file. These cases
will form a separate category on the MTP returns template under cases awaiting allocation.
DSCDSE/
WW
DSW/
K/W
W
Midla
ndsDNC
Dub
North
LH/M
H
CN/M
NCork Kerry
CW/K
K/ST
WD/
WX
Mid
West
GY/R
NMayo
Doneg
alSLWC
Q3 2016 1,162 1,098 1,754 1,535 1,714 2,900 1,394 674 4,797 472 1,238 1,570 1,555 1,597 586 824 492
Q4 2016 1,243 1,148 2,116 1,521 1,633 3,106 1,486 594 3,878 489 1,265 1,527 1,656 1,552 546 799 475
Q1 2017 1,639 1,015 1,961 1,455 1,772 3,134 1,511 626 3,532 513 1,350 1,628 1,628 1,702 543 942 433
Q2 2017 1,473 1,106 2,006 1,494 1,828 3,167 1,573 687 3,629 559 1,098 1,728 1,593 1,657 546 1,292 430
Q3 2017 1,280 1,021 1,970 1,487 1,992 3,176 1,610 663 3,612 607 1,445 1,785 1,481 1,533 562 1,304 391
Diff Q3 v Q2 -193 -85 -36 -7 164 9 37 -24 -17 48 347 57 -112 -124 16 12 -39
0
1,000
2,000
3,000
4,000
5,000
6,000

15
Figure 10: Cases allocated/awaiting allocation
• DSW/K/WW (n=934) reported the highest number of cases awaiting allocation followed
by Donegal (n=638) and Cork (n=494) (Figure 11).
• Ten areas reported a decrease from Q2 2017 in the number of cases awaiting allocation
(Figure 11). Cork reported the highest decrease (n=247; 33%) followed by Dublin South
Central (n=188; 40%) and Dublin North (n=183; 32%).
• Five areas reported an increase from Q2 2017. The highest increase was reported by
MidWest (n=85) followed by Dublin North City (n=84); Kerry (n=41); GY/RN (n=22);
and CW/KK/ST (n=6).
• Mayo reported no case awaiting allocation for the fifth consecutive quarter.
Figure 11: Number of open cases awaiting allocation by area
83%78%
76% 77%80%
17%22%
24% 23%20%
0.0%
20.0%
40.0%
60.0%
80.0%
100.0%
Q3
2016
Q4
2016
Q1
2017
Q2
2017
Q3
2017
% o
f o
pe
n c
ase
s
% Allocated % Awaiting Allocation
21,00119,621 19,226
19,97320,635
4,3615,413
6,158 5,893 5,284
0
5,000
10,000
15,000
20,000
25,000
Q3
2016
Q4
2016
Q1
2017
Q2
2017
Q3
2017
Nu
mb
er
of
op
en
ca
ses
No allocated No Awaiting Allocation
DSCDSE/
WW
DSW
/K/
WW
Midl
andsDNC
Dubli
n
Nort
h
LH/
MH
CN/
MNCork Kerry
CW/
KK/S
T
WD/
WX
Mid
West
GY/R
N
May
o
Done
gal
SLW
C
Q3 2016 251 137 597 440 245 636 167 131 544 35 354 212 254 253 0 36 69
Q4 2016 295 229 860 338 224 1,021 299 113 595 0 270 303 363 367 0 36 100
Q1 2017 576 141 914 391 252 1008 268 177 694 46 357 425 199 357 0 280 73
Q2 2017 469 113 974 373 276 567 316 286 741 41 349 314 186 202 0 641 45
Q3 2017 281 113 934 282 360 384 272 245 494 82 355 306 271 224 0 638 43
Diff Q3 v Q2 -188 0 -40 -91 84 -183 -44 -41 -247 41 6 -8 85 22 0 -3 -2
0
200
400
600
800
1,000
1,200
Ca
ses
aw
ait
ing
all
oca
tio
n

2.2.3 Cases Awaiting Allocation by Priority Level7
• 18% (n=966) of cases awaiting allocation at the end of Q3 2017 were categorised as ‘high
priority’; down 25 from Q2 2017 (Figure 12).
• 63% of cases (n=3,309) awaiting allocation at the end of Q3 2017 were categorised as
‘medium priority’, down 411 (11%) on Q2 2017 while the remaining 19% (n=1,009) were
categorised as ‘low priority’; down 173 (17%) on Q2 2017.
Figure 12: Cases awaiting allocation by priority level
• Dublin South West/Kildare/West Wicklow reported the highest number (n=260) of ‘high
priority’ cases awaiting allocation, followed by DSC (n=190); WD/WX (n=99) and
MidWest (n=92) (Figure 13).
• Dublin North City reported no ‘high priority’ cases awaiting allocation while Mayo
reported no cases awaiting allocation.
• More than two-thirds of the cases awaiting allocation in Dublin South Central (68%;
190/281) are categorised as ‘high priority’ cases.
7 The priority level as per the guidance outlined in ‘Measuring the Pressure’ V2. Note: The priority levels in this
guidance are currently under national review to ensure that the priority levels identified equate with categorisation of
risk. A recent national review highlighted cases being categorised in accordance with actual risk rather than the priority
levels in the “Measuring the Pressure” V2.
576801
1,062 991 966
2,661
3,262
3,5823,720
3,309
1,1241,350
1,514
1,1821,009
0
500
1,000
1,500
2,000
2,500
3,000
3,500
4,000
Q3
2016
Q4
2016
Q1
2017
Q2
2017
Q3
2017
Ca
ses
aw
ait
ing
all
oca
tio
n
High Priority Medium Priority Low Priority

17
Figure 13: Area breakdown of cases awaiting allocation by priority level, Q3 2017
2.2.4 Cases Awaiting Allocation by Waiting Time
• 63% (n=609) of cases categorised as ‘high priority’ awaiting allocation at the end of Q3 2017
were waiting less than 3 months (Table 2). The number of ‘high priority’ cases waiting over
3 months (n=357) decreased by 69 between Q2 2017 and Q3 2017.
• 53% (n=1,742) of cases categorised as ‘medium priority’ were waiting less than 3 months at
the end of Q3 2017. The number of ‘medium priority’ cases waiting over 3 months (n=
1,567) for allocation decreased by 92 between Q2 2017 and Q3 2017 (Table 2).
• 43% (n=436) of cases categorised as ‘low priority’ were waiting less than 3 months at the
end of Q3 2017. The number of ‘low priority’ cases waiting over 3 months (n=573) for
allocation increased by 20 between Q2 2017 and Q3 2017 (Table 2).
• Majority (53%; n=2,787) of all cases awaiting allocation at the end of Q3 2017 were waiting
less than 3 months.
DSCDSE/
WW
DSW
/K/W
W
Midl
andsDNC
Dubli
n
Nort
h
LH/
MH
CN/
MNCork Kerry
CW/
KK/S
T
WD/
WX
Mid
West
GY/R
N
May
o
Done
gal
SLW
C
High Priority 190 4 260 56 0 3 5 10 80 11 23 99 92 40 0 86 7
Medium Priority 40 96 615 192 218 151 232 174 351 38 279 187 85 171 0 452 28
Low Priority 51 13 59 34 142 230 35 61 63 33 53 20 94 13 0 100 8
Total 281 113 934 282 360 384 272 245 494 82 355 306 271 224 0 638 43
0
100
200
300
400
500
600
700
800
900
1000
Nu
mb
er
of
case
s a
wa
iitn
g a
llo
cati
on

18
Table 2: Breakdown of cases awaiting allocation by priority level and time waiting
High Priority / Time Waiting
Q3 2016 Q4 2016 Q1 2017 Q2 2017 Q3 2017 Q3 2017
Cumulative %
∆ (+/-) Q3 2017
v Q2 2017
1 week 71 79 54 137 81 8% -56
1-2 weeks 41 79 96 20 104 11% 84
2-3 weeks 25 80 97 64 82 8% 18
3-4 weeks 43 69 124 93 100 10% 7
1-2 months 104 116 160 152 122 13% -30
2-3 months 78 94 95 99 120 12% 21
>3 months 214 284 436 426 357 37% -69
Total 576 801 1,062 991 966 100% -25
Medium Priority / Time Waiting
Q3 2016 Q4 2016 Q1 2017 Q2 2017 Q3 2017 Q3 2017
Cumulative %
∆ (+/-) Q3 2017
v Q2 2017
1 week 403 247 342 208 176 5% -32
1-2 weeks 226 350 290 249 272 8% 23
2-3 weeks 227 232 284 250 206 6% -44
3-4 weeks 113 275 283 218 277 8% 59
1-2 months 290 574 619 682 474 14% -208
2-3 months 192 434 285 454 337 10% -117
>3 months 1,210 1,150 1,479 1,659 1,567 47% -92
Total 2,661 3,262 3,582 3,720 3,309 100% -411
Low Priority / Time Waiting
Q3 2016 Q4 2016 Q1 2017 Q2 2017 Q3 2017 Q3 2017
Cumulative %
∆ (+/-) Q3 2017
v Q2 2017
1 week 161 65 49 75 45 4% -30
1-2 weeks 58 91 80 54 62 6% 8
2-3 weeks 82 48 146 44 57 6% 13
3-4 weeks 81 90 133 71 92 9% 21
1-2 months 126 249 227 204 98 10% -106
2-3 months 107 178 283 181 82 8% -99
>3 months 509 629 596 553 573 57% 20
Total 1,124 1,350 1,514 1,182 1,009 100% -173

19
2.3 CHILD PROTECTION NOTIFICATION SYSTEM
• 1,402 children listed as ‘active’ on the Child Protection Notification System (CPNS)8 at the
end of Q3 2017; 46 more than Q2 2017 and the highest number for the period Q4 2016 – Q3
2017 (Figure 14).
Figure 14: Number of children listed as 'Active' on the CPNS, by quarter
Note: data presented does not include children listed on the CPNS as visiting from another jurisdiction where there is a comparable system in place and where the child is listed on that system. At the end of Q4 2016 there was one such child; at the end of Q1 2017 there were two such children and at the end of Q3 2017 there were nine such children. Data for Q4 2016 and Q1 2017 amended since publication of the Q4 2016 and Q1 and Q2 2017 reports.
• The number listed as “active” equates to about 12 children per 10,000 population under 18
years and ranges from 5/10,000 population in DSW/K/WW to 21/10,000 in the Midwest
area (Table 3).
• Cork, DSW/K/WW and Dublin North with the highest proportions of the under 18
population reported some of the lowest rates and fall well below the national average (Table
3).
• SLWC, Kerry and Mayo with the smallest proportions of the under 18 population reported
rates above the national average with Mayo reporting the second highest rate at 20/10,000
population.
8 The CPNS, in accordance with the Children First: National Guidance for the Protection and Welfare of Children,
2011, is a national record of all children who are the subject of a child protection plan agreed at a child protection
conference. The CPNS is accessible to named professional groups subject to strict protocols.
1,271
1,316
1,356
1,402
1,000
1,100
1,200
1,300
1,400
1,500
Q4 2016 Q1 2017 Q2 2017 Q3 2017
Nu
mb
er
of
chil
dre
n
KEY FACTS
� 1,402 children listed as ‘active’ on the CPNS at the end of Q3 2017; 46 more than Q2 2017.
Highest number for the period Q4 2016 – Q3 2017.
� All but two children listed as “active” at the end of Q2 2017 had an allocated social worker.

20
Table 3: Children listed as 'active' on CPNS per 10,000 population 0-17 years
Area Q3 2017 Population 0-17
years
Rate / 10,000 population 0 –
17 years Q3 2017
DSC 69 65,564 11
DSE/WW 58 86,810 7
DSW/K/WW 59 108,186 5
Midlands 86 80,193 11
Dublin North City 74 44,927 16
Dublin North 70 100,654 7
LH/MH 138 93,093 15
CN/MN 28 36,446 8
Cork 108 134,015 8
Kerry 48 34,527 14
CW/KK/ST 101 63,009 16
WD/WX 104 68,513 15
Mid West 204 96,266 21
GY/RN 91 79,912 11
Mayo 64 31,968 20
Donegal 67 42,865 16
SLWC 33 23,554 14
National 1,402 1,190,502 12
Population: Census 2016
• Nine areas reported an increase from Q2 2017 (Figure 15). The highest increase was reported by
GY/RN (n=20) followed by CW/KK/ST (n=18). Cavan/Monaghan, Cork and Donegal have
reported three consecutive increases from Q4 2016: Cavan/Monaghan up 13 on Q4 2016; Cork
up 45 on Q4 2016 and Donegal up 17 on Q4 2017 (Figure 15).
• Six areas reported a decrease from Q2 2017. The highest decrease was reported by Dublin South
Central (n=20), followed by DSW/K/WW (n=10). Dublin South Central has reported three
consecutive decreases from Q4 2016: 40 fewer cases listed as “active” than in Q4 2016.
Figure 15: Number of children listed as "active" by area, by quarter
DSCDSE/
WW
DSW
/K/
WW
Midl
andsDNC
Dubl
in
Nort
h
LH/
MH
CN/
MNCork
Kerr
y
CW/
KK/S
T
WD/
WX
Mid
Wes
t
GY/R
N
May
o
Don
egal
SLW
C
Q4 2016 109 26 60 86 78 93 106 15 63 23 82 100 182 94 62 50 42
Q1 2017 105 49 73 89 72 93 102 19 78 18 90 98 194 90 53 51 42
Q2 2017 89 58 69 77 74 71 136 24 95 34 83 110 206 71 59 63 37
Q3 2017 69 58 59 86 74 70 138 28 108 48 101 104 204 91 64 67 33
Diff Q3 v Q2 2017 -20 0 -10 9 0 -1 2 4 13 14 18 -6 -2 20 5 4 -4
0
40
80
120
160
200
240
Nu
mb
er
"act
ive
"

21
• 48% (n=676) of children listed as “active” in Q3 2017 were listed for 0-6 months; 30%
(n=415) were listed for 7-12 months; 11% (n=148) were listed for 12-18 months; 6% (n=84)
were listed for 18-24 months while the remaining 6% (n=79) were listed for longer than 24
months (Table 4).
• Listed for > 24 months: Highest percentage (35%; n=24/69) reported by Dublin South
Central. Five areas reported a percentage higher than the national average of 6% (DSC
35%; Dublin North City 14%; GY/RN 14% and Mayo 13% and Dublin North 7%). Five areas
(DSE/WW; Midlands; CN/MN, CW/KK/ST and WD/WX) reported no child listed as active
for >24 months. WD/WX had no child listed as “active” for longer than 18 months.
• Listed for < 6 months: Highest percentage (71%; n=34/48) reported by Kerry followed
closely by Midlands (70%; n=60/86). Lowest percentage (19%; n=13/69) reported by
Dublin South Central. Nine areas reported a percentage higher than the national average of
48%.
Table 4: Children listed as 'active' in each area at the end of Q2 2017, by length of time ‘active’
0-6 %
0-6 7-12 %
7-12 12-18 %
12-18 18-24 %
18-24 >24 %
> 24 Total
DSC 13 19% 11 16% 11 16% 10 14% 24 35% 69
DSE/WW 24 41% 28 48% 5 9% 1 2% 0 0% 58
DSW/K/WW 21 36% 22 37% 14 24% 1 2% 1 2% 59
Midlands 60 70% 23 27% 0 0% 3 3% 0 0% 86
DNC 25 34% 24 32% 5 7% 10 14% 10 14% 74
Dublin North 39 56% 12 17% 8 11% 6 9% 5 7% 70
LH/MH 63 46% 37 27% 19 14% 11 8% 8 6% 138
CN/MN 14 50% 7 25% 5 18% 2 7% 0 0% 28
Cork 60 56% 32 30% 12 11% 1 1% 3 3% 108
Kerry 34 71% 11 23% 1 2% 0 0% 2 4% 48
CW/KK/ST 49 49% 40 40% 2 2% 10 10% 0 0% 101
WD/WX 56 54% 46 44% 2 2% 0 0% 0 0% 104
Mid West 104 51% 70 34% 14 7% 13 6% 3 1% 204
GY/RN 46 51% 14 15% 15 16% 3 3% 13 14% 91
Mayo 27 42% 9 14% 14 22% 6 9% 8 13% 64
Donegal 31 46% 10 15% 19 28% 6 9% 1 1% 67
SLWC 10 30% 19 58% 2 6% 1 3% 1 3% 33
National 676 48% 415 30% 148 11% 84 6% 79 6% 1,402
• All but two children listed as “active” at the end of Q3 2017 had an allocated social worker.
These two children were reported by Louth/Meath.
• 29 children were reactivated on the CPNS (i.e., their status changed from ‘inactive’ to
‘active’) during Q3 2017. CW/KK/ST reported the highest number (n=8) of children
reactivated during Q3 2017 followed by Dublin North (n=5) and MidWest (n=4).

22
2.4 EMERGENCY OUT OF HOURS SOCIAL WORK SERVICE / CRISIS INTERVENTION SERVICE
• 234 referrals to the Crisis Intervention Service (CIS)9 during Q3 2017; 23 more than Q2
2017. This brings to 683 the number of referrals for the first nine months of 2017
(Figure 16).
• 83 children were placed with the CIS during Q3 2017; 20 more than Q2 2017 and the
highest number for the period Q3 2016 – Q3 2017. This brings to 213 the number of
children placed for the first nine months of 2017. It should be noted that while the
quarterly figure refers to individual children the YTD figure can include children who
were placed in a previous quarter.
• 407 nights’ accommodation was supplied by the CIS during Q3 2017; 175 fewer than Q2
2017. This brings to 1,599 the number of nights’ accommodation supplied for the first
nine months of 2017.
Figure 16: Referrals to the Crisis Intervention Service, by quarter Q3 2016 – Q3 2017
9 The CIS provides an out-of-hours emergency social work service to young people aged under 18 years who are in
crisis. The service operates across the greater Dublin area (Counties Dublin, Kildare and Wicklow). Referrals are made
by service providers outside of normal working hours i.e. Gardaí, hospital and ambulance service personnel
51 59 67 6383
201
250 238211
234
474
394
610582
407
0
100
200
300
400
500
600
700
Q3 2016 Q4 2016 Q1 2017 Q2 2017 Q3 2017
No. of children placed No of referrals No of nights accommodation
KEY FACTS
� 234 referrals to the Crisis Intervention Service (CIS)1 during Q3 2017; 23 more than Q2
� 83 children were placed with the CIS during Q3 2017; 20 more than Q2
� 181 referrals to the Emergency Out of Hours Social Work Service (EOHS) (includes
service operating in Cork) during Q3 2017; 71 fewer than Q2 2017
� 67 children were placed during Q3 2017, 25 fewer than Q2

23
• 181 referrals to the Emergency out of Hours Social Work Service (EOHS)10 (includes
service operating in Cork) 11 during Q3 2017; 71 fewer than Q2 2017. This brings to 628
the number of referrals for the first nine months of 2017 (Figure 17).
• 67 children were placed during Q3 2017, 25 fewer than Q2 2017. This brings to 238 the
number of children placed for the first nine months of 2017.
• 89 nights’ accommodation were supplied during Q3 2017; 26 fewer than Q2 2017. This
brings to 315 the number of nights’ accommodation supplied for the first nine months of
2017.
Figure 17: Referrals to the Emergency Out of Hours Social Work Service, by quarter Q3 2016 – Q3 2017
10
Emergency Out-of-Hours Social Work Service (EOHS) operates outside of Dublin, Wicklow and Kildare. This service builds on
the placement only service (referred to as the Emergency place of Safety Service) that was previously in place. The service is
available Monday to Sunday between 6 pm and 7 am and each Saturday, Sunday and Bank Holiday from 9 am to 5 pm. The EOHS
was set up to co-operate with and support An Garda Síochána in the execution of their duties and responsibilities under section 12(3)
of the Child Care Act 199110 and referrals made under section 8(5) of the Refugee Act 1996.
11 The HSE established emergency out of hours social work pilot projects in Cork and Donegal in 2011. The Cork pilot service
continues to operate.
7060
7992
67
173
152
195
252
181
120
80
111 115
89
0
50
100
150
200
250
300
Q3 2016 Q4 2016 Q1 2017 Q2 2017 Q3 2017
No. of children placed No of referrals No of nights accommodation

3.0 ALTERNATIVE CARE SERVICES
KEY AREAS OF FOCUS
3.1 Children in Care (Foster Care / Residential Care)
3.2 Aftercare
3.3 Adoption
3.4 Foster Carers
3.5 Hiqa Inspections
3.1 CHILDREN IN CARE (FOSTER CARE / RESIDENTIAL CARE)
3.1.1 Number of Children in Care
• 6,230 children in care at the end of Q3 2017, down 67 from Q2 2017 and 78 on Q1 2017
This equates to about 5.2 children per 1,000 population 0-17 years.
Figure 18: Number of children in care by quarter, Q3 2016 – Q3 2017
6,329
6,2586,308 6,297
6,230
5,750
6,000
6,250
6,500
Q3 2016 Q4 2016 Q1 2017 Q2 2017 Q3 2017
Nu
mb
er
of
chil
dre
n i
n c
are
Figures for 2017 include all
children in care under the SW
KEY FACTS
� 6,230 children in care at the end of Q3 2017, down 67 from Q2 2017 and 78 from Q1 2017
� 600 children in private placements, down 16 from Q2 2017
� 95% (n=5,916) of children in care had an allocated social worker (against a target of 100%); no
change from Q2 2017
� 314 children awaiting allocation of a social worker; 21 more than Q2 2017
� 93% (n=5,802) of children in care had an up to date care plan (against a target of 90%); down
one percentage point from Q2 2017
� A total of 428 children without an up-to-date care plan, 46 more than Q2 2017

25
• Across the 17 areas, the number of children in care ranged from 824 in Cork to 101 in
Sligo/Leitrim/West Cavan (Table 5).
• Dublin North City reported the highest rate of children in care per 1,000 population
under 18 years at 2.5 times (13/1,000) the national rate. Dublin South East/Wicklow
and Dublin North reported the lowest rates at 3.2/1,000 population. Six areas
reported a rate higher than the national rate.
Table 5: Number of children in care and rate per 1,000 population 0-17 years, Q3 2017
Area
0-17 population
(Census 2016)
No CIC
Q3 2017
No of CIC/1,000
population 0-17
DSC 65,564 379 5.8
DSE/WW 86,810 279 3.2
DSW/K/WW 108,186 435 4.0
Midlands 80,193 395 4.9
DNC 44,927 586 13.0
Dublin North 100,654 322 3.2
LH/MH 93,093 397 4.3
CN/MN 36,446 156 4.3
Cork 134,015 824 6.1
Kerry 34,527 155 4.5
CW/KK/ST 63,009 362 5.7
WD/WX 68,513 408 6.0
Mid West 96,266 603 6.3
GY/RN 79,912 415 5.2
Mayo 31,968 134 4.2
Donegal 42,865 204 4.8
SLWC 23,554 101 4.3
SWTSCSA - 75 -
Total 1,190,502 6,230 5.2
• Five areas along with the SWTSCSA reported an increase in children in care from Q2
2017; the highest increase was reported by the SWTSCSA (n=8), followed by
DSW/K/WW and LH/MH both reporting an increase of six.
• Cork reported the highest decrease (n=28), followed by Dublin North City (n=16) and
Dublin North (n=10).
• Three areas (Midlands (n=8), Midwest (n=7) and Kerry (n=1)) had more children in
care at the end of Q3 2017 than Q3 2016. Thirteen of the remaining areas had fewer
children in care with Cork reporting the highest decrease (n=42) followed by WD/WX
(n=28); Dublin North City (n=23) and GY/RN (n=21). The remaining area (Mayo)
reported no change.

26
Figure 19: Breakdown of the number of children in care in each area, Q3 2016– Q3 2017
3.1.2 Number of Children in Care by Care Type
• 92% (n=5,729) of children in care were in foster care (general and relative) at the end of Q3
2017, down 72 on Q2 2017 and 5.6% (n=351) were in a residential (general) placement,
down six on Q2 2017 (Table 6).
Table 6: Breakdown of the number of children in care by care type and month, Q3 2016 – Q3 2017
FC
Gen
∆+/- FC Rel
∆+/- Res Care Gen
∆+/- Res Care Spec
∆+/- Other Care
12
∆+/- Total
∆+/-
prev Q prev Q prev Q prev Q prev Q prev Q
Q3 2016 4,133 -26 1,772 -22 312 -14 9 -2 103 1 6,329 -63
Q4 2016 4,102 -31 1,715 -57 304 -8 12 3 125 22 6,258 -71
Q1 2017 4,133 31 1,686 -29 352 48 10 -2 127 2 6,308 50
Q2 2017 4,106 -27 1,695 9 357 5 11 1 128 1 6,297 -11
Q3 2017 4,053 -53 1,676 -19 351 -6 10 -1 140 +12 6,230 -67
FC Gen = Foster Care General; FC Rel = Foster Care with Relatives; Res Care Gen = Residential Care General; Res Care Spec = Residential Care Special; CIC = Children in care
• 16 (0.26%) children were in out of State placements at the end of Q3 2017; down one on Q2
2017. These children are included in the figures for the various care types set out in Table
6.
• Five children in residential care were in a single care placement at the end of Q3 2017; down
two from Q2 2017.
• 156 children were in respite care (from home) at the end of Q3 2017, down 21 on Q2 2017.
DSCDSE/
WW
DSW/
K/W
W
Midla
ndsDNC
Dubli
n
North
LH/M
H
CN/
MNCork Kerry
CW/K
K/ST
WD/
WX
Mid
West
GY/R
NMayo
Done
galSLWC
SWTS
CSA
Q3 2016 394 294 446 387 609 327 398 161 866 154 376 436 596 436 134 209 106
Q4 2016 383 287 440 397 611 326 396 152 858 152 366 427 596 414 134 216 103
Q1 2017 394 286 436 399 613 335 396 156 851 155 362 415 593 403 142 214 100 58
Q2 2017 385 282 429 393 602 332 391 156 852 156 371 410 601 417 133 213 107 67
Q3 2017 379 279 435 395 586 322 397 156 824 155 362 408 603 415 134 204 101 75
Diff Q3 v Q2 -6 -3 6 2 -16 -10 6 0 -28 -1 -9 -2 2 -2 1 -9 -6 8
0
100
200
300
400
500
600
700
800
900
1000
Nu
mb
er
of
child
ren
in
ca
re

27
3.1.3 Children in Private Placements
• 600 (10%) children in care at the end of Q3 2017 were in private placements12 ; 16 fewer
than Q2 2017 (Figure 20). This figure includes 45 children in care under the SWTSCSA.
Figure 20: Number of children in private placements, Q3 2016 – Q3 2017
• 63% (n=375) of children in private placements were in private foster care; 35% (n=208)
were in private residential placements (Figure 21).
Figure 21: Number of children in private placements by care type, Q3 2016 – Q3 2017
• Dublin North City (n=97) followed by Dublin South Central (n=92) reported the highest
number of children in private placements in Q3 2017. Cavan/Monaghan (n=2), Mayo (n=4)
and GY/RN (n=5) reported the fewest number (Figure 22).
• Five areas reported an increase in private placements from Q2 2017. The highest increase
was reported by Waterford/Wexford (n=4). Ten of the remaining twelve areas reported a
decrease.
12
The number of children in private placements is included in the children in care figures presented in sections 3.1.1
and 3.1.2
517
539
613 616
600
400
450
500
550
600
650
Q3 2016 Q4 2016 Q1 2017 Q2 2017 Q3 2017
Nu
mb
er
of
chil
dre
n
Figures for 2017 include all
children in care under the SW
Team for Separated Children
Seeking Asylum
342361
384 384 375
170 168
210 215 208
5 10 19 17 17
0
50
100
150
200
250
300
350
400
450
Q3 2016 Q4 2016 Q1 2017 Q2 2017 Q3 2017
Nu
mb
er
of
chil
dre
n
Private Foster Care Private Residential Care Private Care Other

28
• Ten areas had more children in private placements at the end of Q3 2017 than Q3 2016.
The highest increases were reported by Midlands, Dublin North City and
Waterford/Wexford, all reporting 10 additional children in private placements.
Figure 22: Number of children in private placements by area, Q3 2016 – Q3 2017
• Tusla’s Social Work Team for Separated Children Seeking Asylum (n=29) followed by Cork
(n=26) and Waterford/Wexford (n=25) reported the highest numbers of children in private
residential placements (Figure 23).
• Dublin North City reported the highest number of children in private foster care placements
(n=82), followed by Dublin South Central (n=77) and Midlands (n=67). Almost two-thirds
(60%; n=226/375) of children in private foster care placements are reported by these three
areas.
• Three areas (Cavan/Monaghan, Galway/Roscommon and MidWest) reported no children in
private foster care placements while Mayo reported no child in a private residential
placement.
Figure 23: Number of children in private placements by care type Q3 2017
DSCDSE/
WW
DSW
/K/
WW
Midl
andsDNC
Dubl
in
Nort
h
LH/
MH
CN/
MNCork
Kerr
y
CW/
KK/S
T
WD/
WX
Mid
Wes
t
GY/R
N
May
o
Don
egal
SLW
C
SWT
SCSA
Q3 2016 98 40 60 67 87 36 22 2 47 2 7 23 8 3 1 7 7
Q4 2016 99 39 56 77 94 36 22 2 43 3 10 25 9 8 1 8 7
Q1 2017 102 39 53 83 94 41 22 2 46 5 12 25 18 9 1 8 5 48
Q2 2017 96 41 55 80 101 45 16 2 47 6 14 29 12 7 4 8 8 45
Q3 2017 92 39 54 77 97 41 18 2 44 7 12 33 14 5 4 9 7 45
Diff Q3 v Q2 -4 -2 -1 -3 -4 -4 2 0 -3 1 -2 4 2 -2 0 1 -1 0
0
20
40
60
80
100
120
Nu
mb
er
in p
riv
ate
pla
cem
en
ts
DSCDSE/
WW
DSW
/K/W
W
Midla
ndsDNC
Dubli
n
Nort
h
LH/M
H
CN/
MNCork Kerry
CW/
KK/S
T
WD/
WX
Mid
West
GY/R
NMayo
Done
galSLWC
SWTS
CSA
Other 2 2 0 1 1 0 0 0 0 0 0 0 2 0 0 0 0 9
Residential 13 13 14 9 14 12 9 2 26 4 11 25 12 5 0 5 5 29
Foster Care 77 24 40 67 82 29 9 0 18 3 1 8 0 0 4 4 2 7
Total 92 39 54 77 97 41 18 2 44 7 12 33 14 5 4 9 7 45
0
20
40
60
80
100
120

29
3.1.4 Children in Care with an Allocated Social Worker
• 95% (n=5,916/6,230) of children in care nationally had an allocated social worker (against a
target of 100%) at the end of Q3 2017; no change from Q2 2017 (Table 7).
• A total of 314 children were awaiting allocation of a social worker; 21 more than Q2 2017
(n=293).
Table 7: Children in care (CIC) with an allocated social worker (SW) by care type
Care Type CIC No with SW % with SW CIC No with SW % with SW
Q2 2017 Q2 2017 Q2 2017 Q3 2017 Q3 2017 Q3 2017
Foster Care (General) 4,106 3,940 96% 4,053 3,866 95%
Foster Care (Relatives) 1,695 1,574 93% 1,676 1,555 93%
Residential Care (General)
357 353 99% 351 347 99%
Residential Special Care 11 11 100% 10 10 100%
Other Placements 128 126 98% 140 138 99%
Total 6,297 6,004 95% 6,230 5,916 95%
• Five areas along with Tusla’s Social Work Team for Separated Children Seeking Asylum met
the target of 100% of children in care with an allocated social worker. A further six areas
reported a percentage of 95% or higher. Three areas reported a percentage less than 90%
with the poorest performing area (CN/MN) reporting 84% (Table 8).
• Seven areas reported an increase in percentage performance from Q2 2017; the most
notable being DSW/K/WW, up 8 percentage points to almost 92%.
• The area with the highest number of children awaiting an allocated social worker is Midwest
(n=67) followed by Midlands (n=53).
Table 8: Number of children in care with an allocated social worker
Area
No in Care Q2 2017
No with an allocated
SW Q2 2017
% with an allocated
SW Q2 2017
No in Care Q3 2017
No with an allocated
SW Q3 2017
% with an allocated
SW Q3 2017
+/- Q3 v Q2 2017
Donegal 213 213 100.0% 204 204 100.0% 0%
Kerry 156 156 100.0% 155 155 100.0% 0%
Mayo 133 133 100.0% 134 134 100.0% 0%
SWTSCSA 67 67 100.0% 75 75 100.0% 0%
SLWC 107 107 100.0% 101 101 100.0% 0%
WD/WX 410 407 99.3% 408 408 100.0% 1%
DSC 385 382 99.2% 379 378 99.7% 1%
DSE/WW 282 277 98.2% 279 278 99.6% 1%
GY/RN 417 416 99.8% 415 411 99.0% -1%
Dublin North
332 305 91.9% 322 312 96.9% 5%
DNC 602 589 97.8% 586 567 96.8% -1%
Cork 852 828 97.2% 824 788 95.6% -2%
LH/MH 391 369 94.4% 397 371 93.5% -1%

30
DSW/K/WW 429 360 83.9% 435 398 91.5% 8%
CW/KK/ST 371 329 88.7% 362 327 90.3% 1.6%
MidWest 601 577 96.0% 603 536 88.9% -7.1%
Midlands 393 359 91.3% 395 342 86.6% -5%
CN/MN 156 130 83.3% 156 131 84.0% 1%
National 6,297 6,004 95.3% 6,230 5,916 95% 0%
3.1.5 Children in Care with a Care Plan
• 93% (n=5,802/6,230) of children in care had an up-to-date care plan; down one percentage
points from Q2 2017 (Table 9).
• A total of 428 children did not have an up-to-date care plan, 46 more than Q2 2017
(n=382).
However, it should be noted that variances have been identified in how data on this
metric are being reported by areas. In some areas care plans that have fallen due for
review and not updated are included. Also, it should be noted that where a care plan
is not up–to-date, the care plan in place (albeit that it is awaiting review) is used to
support the care of the child.
Table 9: Number of children in care (CIC) with an up-to-date care plan by care type
Care Type CIC No with CP % with CP CIC No with CP % with CP
Q2 2017 Q2 2017 Q2 2017 Q3 2017 Q3 2017 Q3 2017
Foster Care General 4,106 3,860 94% 4,053 3,785 93%
Foster Care (Relatives) 1,695 1,575 93% 1,676 1,534 92%
Residential Care General 357 351 98% 351 340 97%
Residential Special Care 11 11 100% 10 10 100%
Other Placements 128 118 92% 140 133 95%
National 6,297 5,915 94% 6,230 5,802 93%
• 11 areas along with Tusla’s Social Work Team for Separated Children Seeking Asylum met
the target of 90% of children in care with an up-to-date care plan (Table 10).
• Five areas reported an increased percentage from Q2 2017, the most notable being that for
CW/KK/ST up four percentage points from 94.9% to 98.9%. The most notable decreases
were reported by SLWC, down 12 percentage points to 78% and Midlands down eight
percentage points to 87%.
• DSW/K/WW and Dublin North are the two poorest performing areas with 108 and 75
children respectively with no up to date care plan.

31
Table 10: Breakdown of the number of children in care with an up to date care plan
Area
No in Care
Q2 2017
No with a care plan
Q2 2017
% with a care plan
Q2 2017
No in Care
Q3 2017
No with a care plan
Q3 2017
% with a care plan
Q3 2017
+/-
Q3 v Q2 2017
Mayo 133 133 100.0% 134 134 100.0% 0.0%
MidWest 601 601 100.0% 603 603 100.0% 0.0%
SWTSCSA 67 67 100.0% 75 75 100.0% 0.0%
GY/RN 417 416 99.8% 415 415 100.0% 0.2%
WD/WX 410 408 99.5% 408 408 100.0% 0.5%
CW/KK/ST 371 352 94.9% 362 358 98.9% 4.0%
Donegal 213 212 99.5% 204 201 98.5% -1.0%
DNC 602 584 97.0% 586 566 96.6% -0.4%
LH/MH 391 370 94.6% 397 383 96.5% 1.8%
DSE/WW 282 271 96.1% 279 267 95.7% -0.4%
Cork 852 797 93.5% 824 782 94.9% 1.4%
Kerry 156 151 96.8% 155 146 94.2% -2.6%
DSC 385 344 89.4% 379 335 88.4% -1.0%
Midlands 393 373 94.9% 395 342 86.6% -8.3%
CN/MN 156 139 89.1% 156 134 85.9% -3.2%
SLWC 107 97 90.7% 101 79 78.2% -12.4%
Dublin North 332 263 79.2% 322 247 76.7% -2.5%
DSW/K/WW 429 337 78.6% 435 327 75.2% -3.4%
National 6,297 5,915 93.9% 6,230 5,802 93% -1%
3.1.6 Children in Care in Education
• 98% (n=3,833/3,899) of children in care aged 6 to 15 years (inclusive) were in full time
education at the end of Q3 2017, up 0.3 percentage points from Q2 (Table 11). Note: figures
do not include children in care under the care of Tusla’s Social Work Team for Separated
Children Seeking Asylum.
• Four areas reported 100% with only one area (DSW/K/WW) reporting less than 95% of
children in care aged 6 to 15 years (inclusive) in full time education.
• 92.4 % (n=960/1,039) of children in care aged 16 and 17 years were in full time education at
the end of Q3 2017; up four percentage points on Q2 2017 (Table 12). Note: figures do not
include children in care under the care of Tusla’s Social Work Team for Separated
Children Seeking Asylum.
• Twelve areas reported 90% or higher. The lowest rate was reported by Dublin South
Central (80%) followed by Midwest (86%) and Donegal (86%).

32
Table 11: Children in care, 6 -15 years, in full time education, Q2 2017 – Q3 2017
Area
No of CIC 6-15 years
Q2 2017
No of CIC 6-15 years in
FT education Q2 2017
% of CIC 6-15 years in
FT education
Q2 2017
No of CIC 6-15 years
Q3 2017
No of CIC 6-15 years in
FT education Q3 2017
% of CIC 6-15 years in
FT education
Q3 2017
+/- Q3 v Q2 2017
DSC 245 237 96.7% 246 238 96.7% 0.0%
DSE/WW 184 180 97.8% 179 179 100.0% 2.2%
DSW/K/WW 257 245 95.3% 272 254 93.4% -1.9%
Midlands 222 216 97.3% 238 237 99.6% 2.3%
DNC 378 370 97.9% 369 356 96.5% -1.4%
Dublin North 200 189 94.5% 198 195 98.5% 4.0%
LH/MH 241 240 99.6% 240 239 99.6% 0.0%
CN/MN 96 95 99.0% 102 101 99.0% 0.0%
Cork 540 528 97.8% 533 526 98.7% 0.9%
Kerry 112 111 99.1% 107 105 98.1% -1.0%
CW/KK/ST 175 175 100.0% 216 216 100.0% 0.0%
WD/WX 286 282 98.6% 273 269 98.5% -0.1%
Mid West 373 365 97.9% 380 374 98.4% 0.5%
GY/RN 258 258 100.0% 255 254 99.6% -0.4%
Mayo 81 80 98.8% 80 80 100.0% 1.2%
Donegal 145 145 100.0% 144 144 100.0% 0.0%
SLWC 67 66 98.5% 67 66 98.5% 0.0%
National 3,860 3,782 98.0% 3,899 3,833 98.3% 0.3%
Table 12: Children in care, 16 and 17 years, in full time education, Q2 2017 – Q3 2017
No of CIC
16-17 yrs
Q2 2017
No of CIC
16-17
years in
FT
education
Q2 2017
% of CIC
16-17
years in FT
education
Q2 2017
No of CIC
16-17 yrs
Q 2017
No of CIC
16-17 years
in FT
education
Q3 2017
% of CIC
16-17
years in FT
education
Q3 2017
+/-
Q3 v Q2
2017
Area
DSC 63 50 79.4% 60 48 80.0% 0.6%
DSE/WW 47 46 97.9% 47 44 93.6% -4.3%
DSW/K/WW 90 78 86.7% 86 75 87.2% 0.5%
Midlands 59 50 84.8% 58 55 94.8% 10.0%
DNC 123 116 94.3% 124 116 93.5% -0.8%
Dublin North 57 53 93.0% 58 53 91.4% -1.6%
LH/MH 70 67 95.7% 79 71 89.9% -5.8%
CN/MN 22 20 90.9% 22 22 100.0% 9.1%
Cork 151 144 95.4% 141 133 94.3% -1.1%
Kerry 25 24 96.0% 25 24 96.0% 0.0%
CW/KK/ST 63 48 76.2% 61 61 100.0% 23.8%
WD/WX 61 57 93.4% 56 53 94.6% 1.2%
Mid West 95 63 66.3% 92 79 85.9% 19.6%
GY/RN 61 57 93.4% 67 67 100.0% 6.6%
Mayo 18 17 94.4% 25 25 100.0% 5.6%
Donegal 26 22 84.6% 22 19 86.4% 1.8%

33
SLWC 17 14 82.4% 16 15 93.8% 11.4%
National 1048 926 88.4% 1,039 960 92.4% 4.0%

34
3.2 AFTERCARE
3.2.1 Young adults in receipt of aftercare services
• 1,989 young adults (all ages i.e., 18 years and upwards and inclusive of those 25 or older) in
receipt of aftercare services at the end of Q3 2017; seven fewer than Q2 2017 (Table 13)
• 1,914 (96%) young adults in receipt of aftercare services were aged 18-22 years (inclusive)
• 1,145 (60%) of this cohort (18-22 years) were in full-time education (Table 13)
• 1,409 (n=74%) of the 18-22 years cohort were 18-20 years
• 869 (62%) of those 18-20 years were in full-time education
Table 13: Young adults in receipt of aftercare services and in fulltime education Q3 2016 – Q3 2017
Total no. of young adults in receipt of aftercare services
(all ages)
No of 18-22 years inclusive
in receipt of aftercare service
% 18-22 years inclusive in receipt of aftercare in full time education
No. of 18-20 years inclusive
in receipt of aftercare service
% 18-20 years inclusive in receipt of aftercare in full time education
Q3 2017 1,989 1,914 1,145 (60%) 1,409 869 (62%)
Q2 2017 1,996 1,902 1,116 (59%) 1,481 887 (60%)
Q1 2017 1,940 1,853 1,107 (60%) 1,475 875 (59%)
Q4 2016 1,880 1,806 1,040 (58%) 1,389 803 (58%)
Q3 2016 1,920 1,841 1,001 (54%) 1,429 810 (57%)
• In terms of living arrangements, 46% (n=878) of the 18-22 year olds remained with their
carers, 11% (n=203) returned home, 27% (n=522) were in independent living arrangements
and 5% (n=95) were in a residential placement (Figure 24).
KEY FACTS
� 1,989 young adults (all ages) in receipt of aftercare services at the end of Q3 2017; 7 fewer
than Q2
� 86% (n=1,638/1,914) of young adults 18-22 in receipt of aftercare services had an
allocated aftercare worker; no change from Q2 2017
� 84% (n=1,608/1,914) of young adults 18-22 in receipt of aftercare services had an
aftercare plan; up two percentage points on Q2 2017
� 157 young adults were discharged from care by reason of reaching 18 years; 388
discharged 2017 YTD. 85% (n=134) had an allocated aftercare worker, up one percentage
points on Q2 2017
� 97% (n=110/113) of those eligible for an aftercare service were availing of a service.

35
Figure 24: Living arrangements of young adults (18-22 years) in receipt of aftercare services, Q3 2017
• 86% (n=1,638) of the 18-22 years in receipt of aftercare had an allocated aftercare worker at
the end of Q3 2017; no change from Q2
• Seven areas reported 100% with a further five areas reporting 90% or higher. The lowest
percentage was reported by Dublin South Central (41%; n=45/109) followed by
DSW/K/WW (55%; 89/162) (Table 14).
• Three areas reported an increased percentage from Q2 2017; highest increase reported by
Cork, up from 87% to 95% followed by WD/WX up from 92% to 99%.
Table 14: Young adults 18-22 years in receipt of an aftercare service with an allocated aftercare worker
Area
No 18-22
years in
aftercare
Q2 2017
No with
an
allocated
worker
Q2 2017
% with an
allocated
worker
Q2 2017
No 18-22
years in
aftercare
Q3 2017
No with
an
allocated
worker
Q3 2017
% with an
allocated
worker
Q3 2017
Δ (=/-)
Q3 2017 v
Q2 2017
DSC 165 80 48% 109 45 41% -7%
DSE/WW 109 103 94% 109 104 95% 1%
DSW/K/WW 153 97 63% 162 89 55% -8%
Midlands 114 114 100% 117 117 100% 0%
DNC 143 118 83% 159 127 80% -3%
Dublin North 75 75 100% 86 86 100% 0%
LH/MH 116 106 91% 155 120 77% -14%
CN/MN 62 62 100% 70 70 100% 0%
Cork 253 221 87% 239 226 95% 8%
Kerry 37 37 100% 38 38 100% 0%
CW/KK/ST 114 71 62% 124 75 60% -2%
WD/WX 143 131 92% 137 135 99% 7%
Mid West 154 154 100% 162 162 100% 0%
GY/RN 148 147 99% 136 135 99% 0%
Mayo 43 41 95% 31 29 94% -1%
Donegal 45 45 100% 48 48 100% 0%
SLWC 28 28 100% 32 32 100% 0%
Total 1,902 1,630 86% 1,914 1,638 86% 0%
878
45.9%
522
27.3%
203
10.6%
171
8.9%
95
5.0%
45
2.4% Remained with
carers
Independent Living
Returned
home/family
Other
Residential
placement
Supported lodgings

36
• 84% (n= 1,608) of the same cohort had an aftercare plan at the end of Q3 2017; up two
percentage points on Q2 2017
• Five areas reported 100% with a further seven areas reporting 90% or higher. The lowest
percentage was reported by DSW/K/WW (38%; n=62/162) followed by Dublin South
Central (49%; n=53/109) and CW/KK/ST (58%; 72/124) (Table 15).
• Eight areas reported an increased percentage from Q2 2017; highest increase reported by
GY/RN, up from 81% to 82%. The highest decrease was reported by LH/MH, down from
91% to 77% (n=120/155)
Table 15: Young adults 18-22 years in receipt of an aftercare service with an aftercare plan
Area
No 18-22
years in
aftercare
Q2 2017
No with
an
aftercare
plan
Q2 2017
% with an
aftercare
plan
Q2 2017
No 18-22
years in
aftercare
Q3 2017
No with
an
aftercare
plan
Q3 2017
% with an
aftercare
plan
Q3 2017
Δ (=/-)
Q3 2017 v
Q2 2017
DSC 165 73 44% 109 53 49% 5%
DSE/WW 109 97 89% 109 100 92% 3%
DSW/K/WW 153 77 50% 162 62 38% -12%
Midlands 114 109 96% 117 117 100% 4%
DNC 143 129 90% 159 148 93% 3%
Dublin North 75 75 100% 86 80 93% -7%
LH/MH 116 106 91% 155 120 77% -14%
CN/MN 62 61 98% 70 70 100% 2%
Cork 253 251 99% 239 236 99% 0%
Kerry 37 37 100% 38 38 100% 0%
CW/KK/ST 114 65 57% 124 72 58% 1%
WD/WX 143 143 100% 137 135 99% -1%
Mid West 154 150 97% 162 158 98% 1%
GY/RN 148 75 51% 136 111 82% 31%
Mayo 43 41 95% 31 28 90% -5%
Donegal 45 45 100% 48 48 100% 0%
SLWC 28 28 100% 32 32 100% 0%
Total 1,902 1,562 82% 1,914 1,608 84% 2%
3.2.2 Young adults discharged from care by reason of reaching 18 years
• 157 young adults were discharged from care by reason of reaching 18 years during Q3 2017;
39 more than Q2 2017 (Table 16). This brings to 388 the number discharged for 2017 YTD
• 100% (n=157/157) were eligible for an aftercare service and of these 90% (n=142/157) were
availing of the service.

37
• 85% (n=134) of those discharged had an allocated aftercare worker; up one percentage
point on Q2 2017. Eleven areas reported 100%. The lowest percentage was reported by
DSC (25%).
Table 16: Number discharged, eligible for aftercare service and allocated aftercare worker, Q2 2017 – Q3 2017
Area
No
discharg
ed
Q2 2017
No
discharg
ed
eligible
for
aftercar
e
Q2 2017
No
availing
of an
aftercar
e
service
Q2 2017
No with
allocate
d
aftercar
e
worker
Q2 2017
% with
allocate
d
aftercar
e
worker
Q2 2017
No
discharg
ed
Q3 2017
No
discharg
ed
eligible
for
aftercar
e
Q3 2017
No
availing
of an
aftercar
e
service
Q3 2017
No with
allocate
d
aftercar
e
worker
Q3 2017
% with
allocate
d
aftercar
e
worker
Q3 2017
DSC 9 9 9 4 44% 12 12 9 3 25%
DSE/WW 9 9 9 8 89% 6 6 6 6 100%
DSW/K/WW 11 11 9 7 64% 14 14 8 10 71%
Midlands 10 7 7 7 70% 4 4 4 4 100%
DNC 11 11 10 8 73% 13 13 8 8 62%
Dublin North 6 6 6 6 100% 6 6 6 6 100%
LH/MH 6 5 5 5 83% 6 6 6 6 100%
CN/MN 2 2 2 2 100% 5 5 5 5 100%
Cork 15 15 15 15 100% 23 23 23 20 87%
Kerry 4 4 4 4 100% 2 2 2 2 100%
CW/KK/ST 6 5 5 5 83% 8 8 8 7 88%
WD/WX 10 10 10 9 90% 11 11 11 11 100%
Mid West 6 6 6 6 100% 12 12 11 11 92%
GY/RN 1 1 1 1 100% 27 27 27 27 100%
Mayo 2 2 2 2 100% 1 1 1 1 100%
Donegal 7 7 7 7 100% 3 3 3 3 100%
SLWC 3 3 3 3 100% 4 4 4 4 100%
Total 118 113 110 99 84% 157 157 142 134 85%

38
3.3 ADOPTION SERVICES
3.3.1 Information and Tracing Service
The Agency’s Adoption Information and Tracing Service oversees a broad spectrum of enquiries
from a wide range of people, including adopted people, birth parents, adoptive parents, siblings
of adopted people and other birth relatives and people raised in long-term foster care. The
service operates on a non-statutory basis within the wider legal framework of the Adoption Acts
and assists each of these categories of person with their information and tracing enquiries.
• 311 new enquiries regarding information and tracing received in Q3 2017 bringing the total
number of enquiries for the first nine months of 2017 to 1,267.
• 189 new applications to commence tracing of a searched person received in Q3 2017 bringing
the total number of new applications for the first nine months of 2017 to 755.
• 828 applicants awaiting an information and tracing service at the end of Q3 2017; 74 (10%)
more than Q2 2017 and the highest number for the period Q3 2016 – Q3 2017 (Table 17).
• Highest number of applicants (n=350; 42%) were awaiting a service in the Cork/Kerry area.
This is due to the majority of files being held in this area.
• Five services reported an increase in applicants awaiting from Q2 2017. The highest increase
was reported by DML/DNE (n=31).
KEY FACTS
� 189 new applications to commence tracing for a searched person in Q3 2017; 755 received
2017 YTD
� 828 applicants awaiting an information and tracing service at the end of Q3 2017; up 74 on Q2
� All but one service meeting the target of eight weeks or less from time of application to
provision of non-identifying information
� 41 receipted completed applications for adoption (all types) received in Q3 2017; 138 received
2017 YTD
� 49 new children were referred for adoption in Q3 2017; 142 referred 2017 YTD
� 34 completed adoption assessments presented to Local Adoption Committees in Q3 2017 ; 109
presented 2017 YTD

39
Table 17: Number of applicants awaiting an information and tracing service
Service Area No waiting
Q3 2016
No waiting
Q4 2016
No waiting
Q1 2017
No waiting
Q2 2017
No waiting
Q3 2017
∆ (+/-)
Q3 v Q2
Dublin Mid Leinster
Dublin North East
These two services are
combined for
applications waiting
148 221 277 216 247 +31
Cork/Kerry 304 304 335 351 350 -1
CW/KK/ST/WD/WX 79 62 63 60 70 +10
Midwest 38 14 23 26 40 +14
Galway/Roscommon 23 33 44 37 53 +16
Mayo 7 7 0 4 3 -1
Donegal/SLWC 21 49 63 60 65 +5
National 620 690 805 754 828 +74
• At the end of Q3 2017, all services except Donegal/SLWC were meeting the target of eight
weeks or less for the length of time from application (production of ID) to the provision of
non-identifying (Table 18). This area (Donegal/SLWC) reported an increase of 14 weeks
between Q2 and Q3. The service is working with HR to address staffing deficits in this area.
Table 18: Length of time (weeks) from application to the provision of non-identifying information
Area
Length of Time (weeks)
Q3 2016
Length of Time (weeks)
Q4 2016
Length of Time (weeks)
Q1 2017
Length of Time (weeks)
Q2 2017
Length of Time (weeks)
Q3 2017
Dublin Mid Leinster 4 10 7 7 7
Dublin North East 4 4 4 4 8
Cork/Kerry 6 4 6 6 8
CW/KK/ST/WD/WX 8 6 6 6 6
Midwest 8 8 8 8 8
Galway/Roscommon 8 8 6 6 6
Mayo 1 1 1 1 1
Donegal/SLWC 8 8 8 6 20
• At the end of Q3 2017:
- the length of time from application (production of ID) to allocation of a social worker for
priority 1 applications ranged from 1 month to 12 months against a target of 3 months or
less (Table 19). Four of the eight services are meeting the target.
- the length of time from application (production of ID) to allocation of a social worker for
priority 2 applications ranged from 6 weeks to 16 months against a target of 6 months or
less. All services but one (Dublin North East) are meeting this target (Table 19).
- the length of time from application (production of ID) to allocation of a social worker for
all other applications ranged from 3 months to 39 months against a target of 12 months or
less. Five of the eight services are meeting this target (Table 19).
Table 19: Length of time (months) from application to allocation of a social worker, by priority type
Area
Priority 1
Applications Waiting time (mths)
Priority 2 Applications Waiting time (mths)
All other Applications
(mths)
Dublin Mid Leinster 2 2 3
Dublin North East 5 16 39
Cork/Kerry 12 6 weeks 30
CW/KK/ST/WD/WX 6 6 14

40
Midwest 1 3 9
Galway/Roscommon 2 2 12
Mayo 1 1 4
Donegal/Sligo/Leitrim/West Cavan 4 4 4
3.3.2 Adoption Assessments
• 41 receipted completed applications for adoption (all types) received during Q3 2017
bringing the total for 2017 YTD to 138 (Table 20). The highest number were for inter-
country adoption (n= 65; 47%) followed by step-parent adoption (n=31; 22%).
Table 20: Number of receipted completed adoption application packs received in the quarter
Area
No receipted completed applications for adoption received Q1 2017
No receipted completed applications for adoption received Q2 2017
No receipted completed applications for adoption received Q3 2017
Total (YTD)
Fostering to Adoption 5 4 9 18
Inter-Country Adoption 22 25 18 65
Domestic Adoption 10 9 5 24
Step-parent adoption 10 12 9 31
Total 47 50 41 138
• 49 new children were referred for adoption in Q3 2017 bringing the total for 2017 YTD to
142 (Table 21). The highest number (n=66; 46%) were for step-adoption.
Table 21: Number of new children referred for adoption in the quarter
Area New children referred
going forward for adoption Q1 2017
New children referred going forward for adoption Q2 2017
New children referred going
forward for adoption Q3 2017
Total (YTD)
Fostering to Adoption 14 8 34 56
Domestic Adoption 12 5 3 20
Step-parent adoption 23 31 12 66
Total 49 44 49 142
• 34 completed assessments (all types) were presented to Local Adoption Committees during
Q3 2017 bringing the total for 2017 YTD to 109 (Table 22). Highest number were for inter-
country adoption (n=52; 48%) followed by step-parent adoption (n=31; 28%).
Table 22: Completed assessments presented to Local Adoption Committees, by type
Area
No of completed assessments
presented to LAC
Q1 2017
No of completed assessments
presented to LAC
Q2 2017
No of completed assessments
presented to LAC
Q3 2017
Total (YTD)
Fostering to Adoption 3 8 2 13
Inter-Country Adoption 13 22 17 52
Domestic Adoption 7 3 3 13
Step-parent adoption 9 10 12 31
Total 32 43 34 109

3.4 FOSTER CARERS
3.4.1 Number of foster carers
� 4,443 foster carers (all types minus Brussels II Regulation) on the panel of approved foster
carers at the end of Q3 2017; eight more than Q2 2017 but 80 fewer than Q3 2016 (Figure 25).
There were 302 unapproved relative foster carers. Seventy-nine percent (n=1,171/1,473) of
relative foster carers are approved against a target of 80%.
Figure 25: Number of approved foster carers (all types minus Brussels II Regulation) Q3 2016 – Q3 2017
• 63% (n=2,806) of all approved foster carers are general foster carers. Relative foster carers
(approved) account for a further 26% (n=1,171) while private foster carers account for the
remaining 10% (n=466) (Table 23).
4,5234,537
4,488
4,435
4,443
4,000
4,100
4,200
4,300
4,400
4,500
4,600
Q3 2016 Q4 2016 Q1 2017 Q2 2017 Q3 2017
Nu
mb
er
of
ap
pro
ve
d f
ost
er
care
rs
KEY FACTS
� 4,443 foster carers on the panel of approved foster carers at the end of Q3 2017; eight more
than Q2 but 80 fewer than Q3 2016
� 79% (n=1,171/1,473) of relative foster carers approved against a target of 80%
� 92% (n=2,571) of general foster carers had an allocated link (target 90%), up two percentage
points on Q2. A total of 235 awaiting, 59 fewer than Q2 2017
� 88% (n=1,034) of approved relative foster carers had an allocated link worker (target of 85%),
up one percentage point on Q2. Total of 137 awaiting allocation, 22 fewer than Q2 2017
� 302 unapproved relative foster carers; nine fewer than Q2 2017
� 258 (85%) of the unapproved relative foster carers had a child placed with them for longer
than 12 weeks; 13 fewer than Q2 2017
� 80% (n=207) of unapproved relative foster carers with a child placed > 12 weeks had an
allocated link (social) worker; 51 awaiting allocation, 17 fewer than Q2 2017

42
• The number of approved general and relative foster carers dropped by one and eight
respectively between Q2 and Q3 2017, while the number of private foster carers increased
by 17.
Table 23: Breakdown of foster carers by type Q3 2016 – Q3 2017
Δ (+/-)
Foster Carers Q3 2016 Q4 2016 Q1 2017 Q2 2017 Q3 2017 Q3 v Q2 2017
General (Approved) 2,956 2,913 2,879 2,807 2,806 -1
Relative (Approved) 1,204 1,221 1,196 1,179 1,171 -8
Private (Approved) 363 403 413 449 466 +17
Total Approved 4,523 4,537 4,488 4,435 4,443 +8
Relative (Unapproved) 348 356 328 311 302 -9
3.4.2 Foster carers approved and on the Panel of Approved Foster Carers
• The number of foster carers approved (all types) and on the panel ranged from 527 in Cork
to 84 in Sligo/Leitrim/West Cavan at the end of Q3 2017 (Figure 26).
Figure 26: Foster carers approved by type and area on the panel of approved foster carers, Q3 2017
*Figure for private carers provided by DSE/WW includes private carers for Dublin South Central
• Eight areas reported an increase from Q2 2017 in the number of foster carers approved and
on the panel. The highest increase was reported by LH/MH (n=13) followed by Dublin
South Central (n=11) (Table 24).
• Five reported a decrease from Q2 2017. The highest decrease was reported by CW/KK/ST
(n=19) followed by Dublin North City (n=10), Kerry (n=6), Donegal (n=6) and CN/MN
(n=2). The remaining four areas reported no change from Q2 2017.
DSCDSE/
WW
DS
W/K
/W
W
Midl
andDNC
Dubl
in
Nort
h
LH/
MH
CN.
MNCork
Kerr
y
CW/
KK/S
T
WD/
WX
Mid
Wes
t
GY/
RN
May
o
Don
egal
SLW
C
Private 0 29 138 35 20 36 47 15 33 2 32 28 21 8 5 11 6
Relative 57 60 95 65 149 70 51 18 137 33 113 85 120 62 24 19 13
General 156 142 164 152 163 120 188 97 357 70 207 231 293 218 70 113 65
Total 213 231 397 252 332 226 286 130 527 105 352 344 434 288 99 143 84
0
100
200
300
400
500
600
Nu
mb
er
of
ap
pro
ve
d f
ost
er
care
rs

43
Table 24: Area breakdown of approved foster carers (all types), Q3 2016 – Q3 2017
Area Q3 2016 Q4 2016 Q1 2017 Q2 2017 Q3 2017 ∆ (+/-) Q3 v
Q2 2017
DSC 226 224 214 202 213 11
DSE/WW 224 232 227 226 231 5
DSW/K/WW 391 396 401 397 397 0
Midland 240 243 245 249 252 3
DNC 347 347 341 342 332 -10
Dublin North 238 240 225 226 226 0
LH/MH 256 256 252 273 286 13
CN/MN 147 139 132 132 130 -2
Cork 540 544 546 518 527 9
Kerry 116 114 114 111 105 -6
CW/KK/ST 376 371 372 371 352 -19
WD/WX 358 370 348 342 344 2
MidWest 401 419 420 427 434 7
GY/RN 329 317 321 287 288 1
Mayo 103 95 97 99 99 0
Donegal 150 149 150 149 143 -6
SLWC 81 81 83 84 84 0
National 4,523 4,537 4,488 4,435 4,443 8
*Figures revised since publication of the Q2 2016 Integrated performance and Activity Report
• 92% (n=2,571) of general foster carers approved and on the Panel had an allocated link
(social) worker against a target of 90% at the end of Q3 2017, up two percentage points on
Q2 2017. A total of 235 carers were awaiting an allocated worker; 59 fewer than Q2 2017.
Eleven areas reported a percentage of 90% or higher with six of these areas reporting 100%
(Table 25).
• DSW/K/WW reported the highest number (n=44, up 5 on Q2 2017) of foster carers
awaiting a link working followed by Dublin South Central (n=42, up 19 on Q2); CW/KK/ST
(n=31, down 19 on Q2); MidWest (n=28, down 13 on Q2) and Mayo (n=26, up 12 on Q2).
• Six areas reported a decrease in carers awaiting an allocated link worker from Q2; the
highest decrease was reported by WD/WX (n=37) followed by Midland (n=30) and
CW/KK/ST (n=19).
• Seven areas reported an increase from Q2 2017; the highest increase was reported by
Dublin South Central (n=19) followed by Mayo (n=12) and Dublin North City (n=10).
Table 25: General foster carers (approved) with/awaiting link social worker, Q2 2017 – Q3 2017
With
Link
Worker
Q2 2017
Awaiting
Link Worker
Q2 2017
% With Link
Worker
Q2 2017
With
Link
Worker
Q3 2017
Awaiting
Link Worker
Q3 2017
% With Link
Worker
Q3 2017
∆ +/- No.
Awaiting Link
Worker
Q3 v Q2 2017
Area
DSC 124 23 84% 114 42 73% 19
DSE/WW 128 16 89% 124 18 87% 2
DSW/K/WW 128 39 77% 120 44 73% 5

44
Midland 121 31 80% 151 1 99% -30
DNC 156 9 95% 144 19 88% 10
Dublin
North 117 3 98% 120 0 100% -3
LH/MH 171 11 94% 176 12 94% 1
CN/MN 95 0 100% 97 0 100% 0
Cork 348 3 99% 353 4 99% 1
Kerry 72 0 100% 70 0 100% 0
CW/KK/ST 171 50 77% 176 31 85% -19
WD/WX 193 37 84% 231 0 100% -37
MidWest 247 41 86% 265 28 90% -13
GY/RN 219 0 100% 218 0 100% 0
Mayo 55 14 80% 44 26 63% 12
Donegal 103 17 86% 103 10 91% -7
SO/LM/WC 65 0 100% 65 0 100% 0
National 2,513 294 90% 2,571 235 92% -59
Figure 27: General foster carers approved and on the panel with/awaiting a link (social worker), Q3 2017
• 88% (n=1,034) of relative foster carers approved and on the panel had an allocated link
(social) worker at the end of Q3 2017 against a target of 85%, up one percentage point on
Q2
• A total of 137 carers were awaiting an allocated link worker, 22 fewer than Q2 2017.
• Thirteen areas reported a percentage of 85% (target) or higher with seven of these areas
reporting 100% (Table 26).
• DSW/K/WW reported the highest number (n=33 down 4 on Q2 2017) awaiting a link
worker followed by CW/KK/ST (n=29 down 13 on Q2 2017).
• Seven areas reported a decrease in the number awaiting from Q2 2017; highest decrease
reported by Midlands area (n=14) followed by CW/KK/ST (n=13).
DSCDSE/
WW
DSW
/K/
WW
Midl
andDNC
Dubl
in
Nort
h
LH/
MH
CN/
MNCork
Kerr
y
CW/
KK/S
T
WD/
WX
Mid
Wes
t
GY/
RN
May
o
Don
egal
SO/L
M/
WC
No Link Worker 42 18 44 1 19 0 12 0 4 0 31 0 28 0 26 10 0
Link Worker 114 124 120 151 144 120 176 97 353 70 176 231 265 218 44 103 65
Total 156 142 164 152 163 120 188 97 357 70 207 231 293 218 70 113 65
% with Link Worker 73% 87% 73% 99% 88% 100% 94% 100% 99% 100% 85% 100% 90% 100% 63% 91% 100%
0
50
100
150
200
250
300
350
400
Nu
mb
er
of
ge
ne
ral
fost
er
care
rs

45
Table 26: Relative foster carers (approved) with/awaiting link social worker, Q2 2017 – Q3 2017
Figure 28: Relative foster carers approved and on the panel with/awaiting allocated link Q3 2017
DSC
DSE
/W
W
DS
W/
K/
W
W
Mid
lan
d
DN
CDN
LH/
MH
CN/
MN
Cor
k
Kerr
y
CW
/KK
/ST
WD
/W
X
Mid
We
st
GY/
RN
Ma
yo
Don
egal
SO/
LM/
WC
No Link Worker 10 7 33 2 19 0 4 0 7 0 29 0 14 0 12 0 0
Link Worker 47 53 62 63 130 70 47 18 130 33 84 85 106 62 12 19 13
Total 57 60 95 65 149 70 51 18 137 33 113 85 120 62 24 19 13
0
20
40
60
80
100
120
140
160
Nu
mb
er
of
rela
tiv
e f
ost
er
care
rs (
ap
pro
ve
d)
Area
With Link
Worker Q2 2017
Awaiting Link Worker
Q2 2017
% With Link Worker
Q2 2017
With Link
Worker Q3 2017
Awaiting Link Worker
Q3 2017
% With Link
Worker Q3 2017
∆ +/- Number Awaiting Link
Worker Q3 v Q2 2017
DSC 45 10 82% 47 10 82% 0
DSE/WW 47 9 84% 53 7 88% -2
DSW/K/WW 58 37 61% 62 33 65% -4
Midland 47 16 75% 63 2 97% -14
DNC 148 10 94% 130 19 87% 9
Dublin North
61 9 87% 70 0 100% -9
LH/MH 44 5 90% 47 4 92% -1
CN/MN 22 0 100% 18 0 100% 0
Cork 132 2 99% 130 7 95% 5
Kerry 36 0 100% 33 0 100% 0
CW/KK/ST 78 42 65% 84 29 74% -13
WD/WX 83 2 98% 85 0 100% -2
MidWest 107 12 90% 106 14 88% 2
GY/RN 60 0 100% 62 0 100% 0
Mayo 20 5 80% 12 12 50% 7
Donegal 19 0 100% 19 0 100% 0
SO/LM/WC 13 0 100% 13 0 100% 0
National 1,020 159 87% 1,034 137 88% -22

46
3.4.3 Foster carers (relative) unapproved
• 302 relative foster carers unapproved at the end of Q3 2017, down nine on Q2 (Table 27)
• Of these 258 (85%) had a child placed with them for longer than 12 weeks, down 13 on Q2
• Of the 258 foster carers who had a child placed with them for >12 weeks, 80% (n=207) had
an allocated link (social) worker at the end of Q3 2017, up five percentage points on Q2. A
total of 51 carers were awaiting allocation of a link worker, 17 fewer than Q2 2017
Table 27: Breakdown of foster carers not approved, Q3 2016 – Q3 2017
Unapproved Relative Foster Carers Q3 2016 Q4 2016 Q1 2017 Q2 2017 Q3 2017 ∆ (+/-) Q3 v Q2 2017
No. unapproved 348 356 328 311 302 -9
No (%) with a child > 12 weeks 300 308 276 271
258
-13
87% 87% 84% 87% (85%)
Child > 12 weeks and have a Link Worker 209 211 193 203* 207
+4 70% 69% 70% 75% 80%
Child > 12 weeks AWAITING Link Worker 91 97 83 68* 51 -17
*Figure amended from previous report (Q2 2017) published
• Cork had the highest number (n=81, up 6 from Q2) of unapproved relative foster carers
with a child placed for longer than 12 weeks, at the end of Q3 2017 (Figure 29).
• In 13 areas all unapproved relative foster carers with a child for >12 weeks had a link worker
(Figure 29). With the exception of Cork five or fewer carers were awaiting an allocated link
worker in the remaining four areas.
• Cork accounted for 82% (n=42) of unapproved relative foster carers awaiting a link worker
for longer than 12 weeks at the end of Q3 2017.
Figure 29: Relative foster carers UNAPPROVED with a child > 12 weeks, with/awaiting a link worker, Q3 2017
DSC
DSE
/W
W
DS
W/K
/W
W
Midl
andDNC
Dubl
in
Nort
h
LH/
MH
CN/
MNCork
Kerr
y
CW/
KK/S
T
WD/
WX
Mid
Wes
t
GY/
RN
May
o
Don
egal
SO/
LM/
WC
No link worker 0 0 5 0 0 0 3 1 42 0 0 0 0 0 0 0 0
With link worker 25 18 29 16 14 7 3 1 39 13 1 8 22 1 4 2 4
FC Rel Unapp with Child> 12 wks 25 18 34 16 14 7 6 2 81 13 1 8 22 1 4 2 4
0
10
20
30
40
50
60
70
80
90
Nu
mb
er
rela
tiv
e (
un
ap
pro
ve
d)
fost
er
care
rs

3.5 HIQA INSPECTIONS
FOSTER CARE
The Health Information and Quality Authority (Hiqa) published seven inspection reports in
Q3 2017. The summary of judgments is set out in Table 28 and a summary of findings can
be found in Appendix I.
Table 28: Foster Care Inspections - Summary Judgments
Centre Inspected
Summary of Judgments
No of Standards
Assessed Compliant
Substantially
Compliant
Non
Compliant -
Major
Non
Compliant -
Moderate
Cork 8 (Themed) 0 2 5 1
North Dublin 8 (Themed) 0 4 3 1
Sligo/Leitrim/West
Cavan 8 (Themed) 0 2 3 3
Galway/Roscommon 8 (Themed) 1 3 0 4
Kerry 8 (Themed) 3 1 3 1
MidWest 8 (Themed) 0 3 3 2
Mayo 8 (Themed) 2 5 0 1
CHILDREN’S RESIDENTIAL SERVICES
Hiqa published five inspection reports in Q3 2017. The summary of judgments is set out in
Table 29 and a summary of findings for each centre inspected can be found in Appendix I.
Table 29: Residential Centres Inspection - Summary Judgments
Centre
Inspected
Summary of Judgments
No of Standards
Assessed Compliant
Substantially
Compliant
Non Compliant
- Major
Non Compliant
- Moderate
OSV 0004161 10
(Unannounced/Full) 1 2 1 6
OSV 0004176 10
(Unannounced/Full) 2 2 0 6
OSV 0004178 10
(Unannounced/Full) 2 4 0 4
OSV 0004177 10
(Unannounced/Full) 3 2 1 4
OSV 0004650 8 (Announced/Full) 1 1 1 7

4.0 REGULATION AND SUPERVISION OF CHILDREN’S SERVICES
KEY AREAS OF FOCUS
4.1 Early Years Inspectorate
4.2 Alternative Education Regulation
4.3 Statutory / Non-Statutory Alternative Care Services
4.1 EARLY YEARS INSPECTORATE
4.1.1 Activity Data
• 4,501 early years services (EYS) on the register nationally at the end of Q3 2017; 33 more
than Q2 2017.
Figure 30: Number of Early Years Services on the Early Years Inspectorate Register
• 33 new applications to become a registered provider received by the Inspectorate in Q3
2017, two more than Q2 2017. This brings to 80 the total number received for the first nine
months of 2017.
• 63 new applications approved by the Inspectorate in Q3 2017; 58 more than Q2 2017. This
brings to 74 the total number approved for the first nine months of 2017.
4,562
4,5074,484
4,468 4,501
4,200
4,300
4,400
4,500
4,600
4,700
No
of
EY
S
KEY FACTS
� 4,501 EYS on the register nationally at the end of Q32017; 33 more than Q2 2017
� 550 EYS inspections (all types) carried out during Q3 2017; 79 (17%) more than Q2 2017
� 54 complaints received in respect of EYS during Q3 2017; 44 fewer than Q2 2017

49
• 694 “change in circumstances” notifications received by the Inspectorate in Q3 2017; 274
more than Q2 2017. This brings to 1,470 the total number received for the first nine months
of 2017.
• 25 services were found to have closed in Q3 2017, bringing the total number for the first six
months of 2017 to 77.
• 550 inspections (all types13) carried out in Q3 2017; 79 (17%) more than Q2 2017. This
brings to 1,401 the total number of inspections carried out for the first nine months of 2017.
• 54 complaints relating to EYS received by the Inspectorate during Q3 2017; 44 fewer than
Q2 2017. This brings to 240 the number of complaints for the first nine months of 2017.
Figure 31: Number of complaints relating to EYS received
• 28 incidents notified to the Inspectorate in Q3 2017, six fewer than Q2 2017. This brings to
140 the number of incidents notified for the first nine months of 2017.
• No service de-registered by Tusla during the first nine months of 2017.
• No prosecutions of EYS taken by Tusla during the first nine months of 2017.
13
Includes initial, follow up, complaints, focused inspections or fit for purpose inspections
61
52
88
98
54
0
10
20
30
40
50
60
70
80
90
100
Q3 2017 Q4 2016 Q1 2017 Q2 2017 Q3 2017
Nu
mb
er
of
com
pla
ints

4.2 ALTERNATIVE EDUCATION REGULATION
Under Section 14 of the Education (Welfare)14 Act 2000
Home Education
• 1,400 children on the register for home education at the end of Q3 2017; 17 more than Q2
2017
• 16% (n=222) of children on the register have special educational needs
• 167 applications received for home education during Q3 2017 bringing the total for the first
9 months of 2017 to 413. Almost one in four (23%; 38/167) applications were for children
with special educational needs
• 114 assessments (all types) for home education carried out in Q3 2017 bringing the total for
the first 9 months of 2017 to 412
• 71 children registered for home education15 in Q3 2017 bringing the total for the first 9
months of 2017 to 246
14
Section 14 Education (Welfare) Act 2000 14.—(1) The Board shall, on the commencement of this section, cause to
be established and maintained a register of all children in receipt of education in a place other than a recognised school
(hereafter in this section referred to as ‘‘the register’’). (2) Subject to subsection (3), where a parent chooses to educate,
or have educated, his or her child in a place other than a recognised school he or she shall, in accordance with this
section, apply to the Board to have the child concerned registered in the register.
(5) As soon as practicable after an application under this section is received by the Board, the Board shall, for the
purpose of determining whether the child is receiving a certain minimum education, cause an authorised person to carry
out, in consultation with the parent who made the application, an assessment of—…
15 Number registered in a quarter does not reflect the number of assessments carried out in the previous quarter – reports
are written, reviewed and approved internally before registration
Key Facts
Home Education
� 1,400 children on the register for home education at the end of Q3 2017
� 167 applications for home education during Q2 2017 bringing the total for 2017 to 413
� 236 children awaiting assessment for registration at the end of Q3 2017; 76 more than Q2
� 745 registered children awaiting a review at the end of Q3 2017; 33 fewer than Q2
Independent Schools
� 4,825 children attending 43 assessed schools at the end of Q3 2017
� 24 children’s applications for education in independent schools received in Q3 2017 bringing
the total for 2017 to 307
� 44 children registered during Q3 2017 bringing the total for 2017 to 1,078
� 936 children awaiting registration at the end of Q3 2017; 27 fewer than Q2

51
• 236 children awaiting assessment for registration at the end of Q3 2017; 76 more than Q2
2017. Of these 224 are awaiting a preliminary 16 assessment and 12 are awaiting a
comprehensive assessment.
• 745 registered children awaiting a review at the end of Q3 2017; 42 fewer than Q2 2017
• Five children were refused registration for home education in Q3 2017 bringing the total
number refused for the first 9 months of 2017 to 14. In the first nine months of 2017 there
were two appeals made against decisions not to register
• 54 children removed from the register in Q3 2017 bringing the total number for the first 9
months of 2017 to 168. Breakdown of the 168 is as follows: 79 (47%) turned 18 years; 59
(35%) returned to school; 17 (10%) left Ireland; 11 were referred to Educational Welfare
Services17 ; 1 was Deregistered and 1 Other reason.
Independent Schools
• 4,825 children attending 43 assessed schools at the end of Q3 2017; 10 more than Q2 2017
• 24 new children’s applications for education in independent schools received in Q3 2017
bringing the total for the first 9 months of 2017 to 307.
• 44 children registered18 during Q3 2017 bringing the total for the first 9 months of 2017 to
1,078
• No children refused registration in the first nine months of 2017
• 936 children awaiting registration at the end of Q3 2017, 27 fewer than Q2 2017 – due to
issues relating to internal capacity or where information is awaited from the parents e.g.,
birth certs, signed application form
• 195 children removed from the register during Q3 2017 bringing the total number for the
first 9 months of 2017 to 827 – children are automatically removed from the register when
they reach 18 years. No capacity to follow-up children who move to a new school.
• 42 schools awaiting a review at the end of Q3 2017.
16
This figure includes children currently going through the assessment process where the assessment is complete but
the report has not been signed off 17
Children who cannot be located are referred to Educational Welfare Services 18
Number of children registered includes the processing of applications forms received in previous months. Once a
school has been assesed children are registered automatically once parents have supplied all required documentation

52
4.3 NON STATUTORY ALTERNATIVE CARE SERVICES
Non Statutory Children’s Residential Centres
• 115 non-statutory residential centres at the end of Q3 2017
• 19 inspections (all types and onsite) conducted in Q3 2017 bringing the total for 2017 YTD
to 70.
Table 30: Inspections of Non Statutory Residential Services
Inspections by Type Q1 2017 Q2 2017 Q3 2017 Total
Thematic Inspection
(announced) 14 19 9 42
Thematic Inspection
(unannounced) 8 3 5 16
Lead Inspector Agency
Visit 0 3 2 5
New Registration
Inspection Visit 0 4 3 7
Total 22 29 19 70
Non Statutory Foster Care Services
• 6 non-statutory foster care services at the end of Q3 2017
Key Facts
� 115 non-statutory residential centres at the end of Q3 2017
� 19 inspections (all types and onsite) conducted in Q3 2017 bringing the total for 2017
YTD to 70
� 6 non statutory foster care services at the end of Q3 2017

53
5.0 EDUCATIONAL WELFARE SERVICES
Referrals19
Academic Year 2016 / 2017
• 5,939 referrals screened by senior educational welfare officers, Sept 2016 – Aug 2017 (Table
31).
• 3,377 referrals allocated to educational welfare officers (EWOs), Sept 2016 – Aug 2017
• 1,108 referrals screened out / required no further action, Sept 2016 – Aug 2017
• 1,161 screened referrals on a waiting list at the end of Aug 2017
Table 31: Referrals activity data by month
Referrals Screened
Referrals Allocated
Referrals Screened
Out
Screened Referrals on Waiting List (month
end)
Sep-16 368 234 100 208
Oct-16 304 207 37 260
Nov-16 392 289 67 259
Dec-16 443 296 74 282
Jan-17 512 393 78 231
Feb-17 641 477 100 317
Mar-17 766 506 103 423
Apr-17 594 303 75 588
May-17 741 269 158 880
Jun-17 679 215 67 1,273
July-17 311 84 86 1,288
Aug-17 188 104 163 1,161
Total 5,939 3,377 1,108 -
19 A referral is a written notification of concern to EWS from a school, a parent, agency or concerned citizen in relation to the
educational welfare of a named child. Referrals are then screened against a set of criteria by the Senior Educational Welfare Officer
and a decision is made as to whether to proceed and open a case in relation this named child, or placed on a waiting list if there is an
EWS capacity issue.
KEY FACTS
� 3,522 new individual children worked with in the academic 2016/2017
� 960 screened referrals on a waiting list at the end of Sept 2017; 201 fewer than August 2017
� 721 school attendance notices (SANs) issued in respect of 485 children under Section 25 of the
Education (Welfare) Act 20001 , in the academic 2016/2017
� 156 summonses issued in respect of 109 children under Section 25 of the Act, in the academic
2016/2017
� 216 Section 24 meetings convened by EWOs, in the academic 2016/2017

54
Academic Year 2017 / 2018 (Sept 2017)
• 218 referrals screened by senior educational welfare officers in Sept 2017
• 177 referrals allocated to educational welfare officers (EWOs) in Sept 2017
• 16 referrals screened out / required no further action in Sept 2017
• 960 screened referrals on a waiting list at the end of Sept 2017; 201 fewer than August 2017
Open Cases / Cases Worked
Academic Year 2016 / 2017
• 3,522 new individual children worked with, Sept 2016 – Aug 2017
• 4,422 new cases assigned to EWOs between Sept 2016 – Aug 2017
• 3,902 cases closed between Sept 2016 and Aug 2017
Table 32: Cases open, assigned and closed by month
Open Cases on
hand/brought forward
New Cases
Assigned
Cases Closed
Sep-16 2,593 374 364
Oct-16 2,603 334 353
Nov-16 2,584 450 425
Dec-16 2,609 347 285
Jan-17 2,671 389 300
Feb-17 2,760 567 404
Mar-17 2,923 598 295
Apr-17 3,226 352 194
May-17 3,384 405 383
Jun-17 3,406 265 537
Jul-17 3,134 129 239
Aug-17 3,024 212 123
Total - 4,422 3,902
Academic Year 2017 / 2018 (Sept 2017)
• 167 new individual children worked with, Sept 2017
• 297 new cases assigned to EWOs between in Sept 2017
• 300 cases closed between in Sept 2017

55
School Attendance Notices and Summonses under Section 25
Academic Year 2016 / 2017
• 721 school attendance notices (SANs) issued by EWS under Section 25 of the Education
(Welfare) Act 200020, Sept 2016 – Aug 2017. The notices issued were in respect of 485
individual children i.e., more than one notice was issued in respect of some children.
• 156 summonses issued by EWS under Section 25 of the Education (Welfare Act) 2000, Sept
2016 – Aug 2017. The summonses issued were in respect of 109 individual children i.e.,
more than one summons was issued in respect some children.
• EWOs attended 408 court cases pertaining to their own cases between Sept 2016 – Aug
2017 and an additional 23 court cases in a supporting capacity (e.g., at the request of social
work services).
• 235 child protection conferences (CPC) attended by EWOs between Sept 2016 – Aug 2017.
• 216 Section 2421 meetings convened by EWOs, Sept 2016 – Aug 2017
• 196 official child protection and welfare referrals made by EWOs Sept 2016 – Aug 2017.
Academic Year 2017 / 2018 (Sept 2017)
• 63 school attendance notices (SANs) issued by EWS under Section 25 of the Education
(Welfare) Act 2000, Sept 2017. The notices issued were in respect of 41 individual children
i.e., more than one notice was issued in respect of some children.
• 23 summonses issued by EWS under Section 25 of the Education (Welfare Act) 2000, Sept
2017. The summonses issued were in respect of 13 individual children i.e., more than one
summons was issued in respect some children.
• EWOs attended 52 court cases pertaining to their own cases in Sept 2017 and an additional
five court cases in a supporting capacity (e.g., at the request of social work services).
• 27 child protection conferences (CPC) attended by EWOs in Sept 2017.
• 20 Section 24 meetings convened by EWOs, Sept 2017
20 Section 25 Education (Welfare) Act 2000—(1) Subject to section 17(2), the Board shall, if of opinion that a parent is failing or
neglecting to cause his or her child to attend a recognised school in accordance with this Act, serve a notice (hereafter in this section
referred to as a ‘‘school attendance notice’’) on such parent—(a) requiring him or her on the expiration of such period as is specified
in the notice, to cause his or her child named in the notice to attend such recognised school as is specified in the notice, and there to
attend on each school day that the notice is in force, and (b) informing him or her that if he or she fails to comply with a requirement
under paragraph (a) he or she shall be guilty of an offence.
21 Section 24 Education Welfare Act 2000: Where the board of management of a recognised school or a person acting on its behalf is
of the opinion that a student should be expelled from that school it shall, before so expelling the student, notify the educational
welfare officer to whom functions under this Act have been assigned, in writing, of its opinion and the reasons therefor. The
educational welfare officer concerned shall, as soon as may be after receiving a notification under subsection (1), make all reasonable
efforts to ensure that provision is made for the continued education of the student to whom the notification relates.
(2) For the purposes of subsection (2), the educational welfare officer concerned shall, as soon as may be after receiving the
said notification—
(a) make all reasonable efforts to consult with the principal of the school concerned or a person nominated by him or her,
the student concerned and his or her parents, and such other persons as the educational welfare officer considers
appropriate, and
(b) convene a meeting attended by him or her of such of those persons as agree to attend such meeting.

56
• 16 official child protection and welfare referrals made by EWOs in Sept 2017.

57
6.0 FAMILY SUPPORT SERVICES
KEY AREAS OF FOCUS
5.1 Family Support Services
5.2 Meitheal and Child & Family Support Networks
6.1 FAMILY SUPPORT SERVICES22
6.1.1 Family Support Providers
Data provisional – data for CW/KK/ST outstanding at the time of writing and partial data
available from LH/M and Dublin North City.
• At least 254 family support providers commissioned for 2017; the majority (85%; n=215) of
which are external to Tusla (Table 33).
• 67% (n=169) of services provided data for Q1 – Q2 2017. Six areas reported 100%. The
lowest percentage was reported by GY/RN (36%; n=10/28) followed by MidWest (44%;
n=15/34). The data presented below needs to be interpreted in the context of missing data
for areas concerned.
Table 33: Family Support Services Commissioned by Area, 2017
Area
Number of
Family Support
Providers
Commissioned
for 2017
Number that are
External to Tusla
providers
Number that are
Internal Tusla
providers
Of the total
number
commissioned,
the number that
provided data
for Jan- Jun
2017
% that provided
data for Jan- Jun
2017
DSC 21 19 2 16 76%
DSE/WW 17 11 6 17 100%
DSW/K/WW 15 13 2 12 80%
Midlands 14 12 2 13 93%
DNC 24 20
Dublin North 19 18 1 15 79%
LH/MH
CN/MN 4 3 1 4 100%
Cork 7 7 0 7 100%
Kerry 5 4 1 5 100%
22
Family Support Services includes those services funded through a Service Arrangement with the Child and Family
Agency and those internally funded and delivered through the Child and Family Agency
KEY FACTS
Data based on incomplete returns and should be considered provisional
� At least 21,575 children in receipt of family support services at the end of June 2017
� At least 17,580 children referred to family support services between January and June 2017
� 72% (12,708) of children referred to family support services (Jan – Jun 2017) received a service

58
CW/KK/ST
WD/WX 27 24 3 17 63%
MidWest 34 31 3 15 44%
GY/RN 28 18 10 10 36%
Mayo 10 6 4 10 100%
Donegal 17 17 0 17 100%
SLWC 12 12 0 11 92%
Total 254 215 35 169 67%
6.1.2 Children in Receipt of Family Support Services
• At least 21,575 children in receipt of family support services at the end of June 2017.
Highest number reported by MidWest (n=6,493; accounts for 30% of children in receipt of
services) albeit that fewer than half of the services in this area provided data, followed by
Donegal (n=2,735); Dublin North City and Sligo/Leitrim/West Cavan both reporting 1,740
children. Fewest number reported by Cork (n=286) followed by Kerry (n=301) and
Cavan/Monaghan (n=352) (Table 34).
Table 34: Children in receipt of Family Support Services, end of June 2017
Area
Total number of
children in receipt of a
FSS at the end of Dec
2016
Total number of
children in receipt of a
FSS at the end of June
2017
DSC 1,216 826
DSE/WW 651 615
DSW/K/WW 799 1,309
Midlands 775 525
DNC 1,487 1,740
Dublin North 1,544 1,355
LH/MH 1,374 673
CN/MN 236 352
Cork 310 286
Kerry 269 301
CW/KK/ST 905
WD/WX 1,145 956
MidWest 6,373 6,493
GY/RN 1,187 1,232
Mayo 971 437
Donegal 2,394 2,735
SLWC 2,581 1,740
Total 24,217 21,575
6.1.3 Children Referred to Family Support Services
• 17,580 children referred to family support services between January and June 2017 (Table
35 and Figure 32). Highest number referred in the MidWest (n=4,314; 25% of all children
referred) followed by Donegal (n=2,132) and Dublin North City (n=1,649). Fewest number

59
reported by Kerry (n=297) followed by CN/MN (n=361); Cork (n=450) and Midlands
(n=494)
Table 35: Children referred to Family Support Services by area
Area
Total number of
children referred to
FSS, Jul-Dec 2016
Total number of
children referred to
FSS, Jan – Jun 2017
DSC 984 594
DSE/WW 679 675
DSW/K/WW 640 924
Midlands 477 494
DNC 1,716 1,649
Dublin North 1,815 954
LH/MH 940 1,114
CN/MN 334 361
Cork 304 450
Kerry 235 297
CW/KK/ST 404
WD/WX 733 1,105
MidWest 3,233 4,314
GY/RN 1,234 1,119
Mayo 513 556
Donegal 984 2,132
SLWC 1,134 842
Total 16,359 17,580
Figure 32: Children referred to Family Support Services by area
• The most common source of referral was Parent/Guardian accounting for almost one in
four referrals (n=4,179; 24%) followed by Tusla Social Work (n=3,842; 22%) and Schools
(n=2,595; 15%). An Garda Síochána made 100 referrals, the highest number (n=35) of
which were reported by Louth/Meath. Over half of the referrals from Schools (52%;
n=1,350) were reported by the MidWest (Figure 33 and Table 36).
594 675924
494
1649
9541114
361 450297
1105
4314
1119
556
2132
842
0
1000
2000
3000
4000
5000
DS
C
DS
E/W
W
DS
W/K
/WW
Mid
lan
ds
DN
C
Du
bli
n N
ort
h
LH/M
H
CN
/MN
Co
rk
Ke
rry
CW
/KK
/ST
WD
/WX
Mid
We
st
GY
/RN
Ma
yo
Do
ne
ga
l
SLW
C
Nu
mb
er
of
chil
dre
n r
efe
rre
d

60
Figure 33: Children referred to Family Support Services by source of referral, Jan - Jun 2017
4,179
24%
3,842
22%
2,595
15%
2,210
12%
1,397
8%
1,235
7%
859
5%
495
3%490
3%
150
1%
100
0%28
0% Parent/Guardian (4,179)
Social Work (3,842)
Schools (2,595)
HSE Officer's (2,210)
Other (1,397)
Self Referral (1,235)
Voluntary Agency (859)
Other Tusla Officers (495)
GP (490)
Other Family Member (150)
An Garda Síochána (100)
Anonymous (28)

Table 36: Breakdown of source of referrals by area, Jan - Jun 2017
Social
Work
Other
Tusla
Officers
HSE
Officers
An
Garda
Síochána
Self -
Referral
Parent/G
uardian
Other
Family
member GP
Voluntar
y Agency
Anonym
ous Schools Other Total
DSC 137 14 193 0 48 194 3 5 0 0 0 0 594
DSE/WW 193 7 99 2 6 209 7 26 49 0 61 16 675
DSW/K/WW 248 44 160 0 35 223 17 15 51 0 112 19 924
Midlands 165 36 66 0 49 52 5 2 23 0 80 16 494
DNC 534 30 203 5 32 526 2 22 48 0 215 32 1,649
Dublin North 357 28 134 0 44 144 2 21 86 0 54 84 954
LH/MH 243 31 152 35 5 387 32 20 77 1 60 71 1,114
CN/MN 185 3 46 3 3 9 2 11 25 0 41 33 361
Cork 185 19 29 0 113 60 10 0 6 0 18 10 450
Kerry 37 3 21 7 5 110 1 23 20 0 34 36 297
CW/KK/ST
WD/WX* 479 0 6 0 0 15 0 0 4 0 3 598 1,105
MidWest 458 81 323 11 425 1,145 22 38 256 1 1,350 204 4,314
GY/RN 276 53 216 17 40 270 2 23 55 0 100 67 1,119
Mayo 34 51 40 2 16 212 2 4 46 0 89 60 556
Donegal 135 83 398 16 325 336 42 273 92 17 274 141 2,132
SLWC 176 12 124 2 89 287 1 7 21 9 104 10 842
Total 3,842 495 2,210 100 1,235 4,179 150 490 859 28 2,595 1,397 17,580
*A breakdown of all external sources (non Tusla) is only available from Waterford; Wexford has included all external sources under “Other”

• 72% (12,708) of children referred to family support services during the first six months of
2017 received a service (Table 37). The percentage who received a service ranged from 95%
(n=2,021/2,132) in Donegal to 37% in Dublin South East/Wicklow (n=247/675). In ten of
the 15 areas that provided data more than seven out of ten children referred received a
service.
• Of the total number of children referred to family support services (Jan – Jun 2017) who
received a service 4% (n=467) were subject of a Child in Care Plan; 5% (n=606) were
subject of a Tusla Social Work Child Protection Plan; 6% (n=797) were subject of a Tusla
Social Work Family Support Plan; 2% (n=264) were subject of a Meitheal Support Plan
while one in four (n=3,231) was subject of a Single Agency Family Support Plan.
Table 37: Number of children referred to Family Support Services (Jan – Jun 2017) who received a service
Of the total number of children referred to FSS (Jan – Jun 2017) and received a service the number who were subject of a:
Area Number referred
Of number
referred, number
who received a
service
% who rec'd a service
Child in Care Plan
Tusla Social Work Child
Protection Plan
Tusla Social
Work led Family
Support Plan
Meitheal Support
Plan
Single Agency Family
Support Plan
DSC 594 483 81% 18 22 31 9 147
DSE/WW 675 247 37% 11 27 42 22 98
DSW/K/WW 924 571 62% 8 31 40 39 96
Midlands 494 296 60% 23 37 41 8 113
DNC 1,649 1,197 73% 44 27 65 22 23
Dublin North 954 726 76% 16 28 19 12 432
LH/MH 1,114 463 42% 25 58 38 19 112
CN/MN 361 332 92% 23 39 44 17 60
Cork 450 269 60% 19 35 83 0 58
Kerry 297 243 82% 1 1 70 2 109
CW/KK/ST
WD/WX 1,105
MidWest 4,314 3,914 91% 144 108 112 41 838
GY/RN 1,119 801 72% 16 79 67 16 388
Mayo 556 403 72% 50 3 19 21 99
Donegal 2,132 2,021 95% 40 51 55 16 460
SLWC 842 742 88% 29 60 71 20 198
Total 17,580 12,708 72% 467 (4%) 606 (5%) 797 (6%) 264 (2%) 3,231 (25%)

63
6.2 MEITHEAL
A key component of Tusla’s Prevention, Partnership and Family Support (PPFS)
programme of work is the roll-out of Meitheal - a national practice model (common
approach to practice) for all agencies working with children, young people and their
families. This model is designed to ensure that the needs and strengths of children and
their families are effectively identified and understood and responded to in a timely way so
that children and families get the help and support needed to improve children’s outcomes
and realise their rights. It is an early intervention response tailored to the needs of an
individual child or young person and is used where more than one agency involvement is
needed. There are three stages of the Meitheal process; preparation, discussion and
delivery.
6.2.1 Meitheal Activity Data
Metrics reported below are new for 2017.
• 804 Meitheal processes requested in the first six months of 2017. Highest number reported
by CW/KK/ST (n=290; 36%) followed by Waterford/Wexford (n=100; 12%) and
Galway/Roscommon (n=63; 8%). None reported by Cork. All other areas reported fewer
than 50 requests with Donegal and Kerry reporting fewer than 10 (Table 38).
• Over 90% of requests were either through Direct Access or Social Work Diversion, with
little or no difference in the actual number of each; 369 (46%) and 362 (45%) respectively.
Fewer than one in 10 (9%; n=73) was from Social Work Step-Down.
KEY FACTS
� 804 Meitheal processes requested January – June 2017
� 46% (369) requested through Direct Access and 45% (362) requested through Social
Work Diversion
� 53% (423) of Meitheal processes requested January – June 2017 proceeded to Stage 2
(Discussion Stage)
� 380 Meitheal processes reached completion of Stage 2 between January – June 2017;
72% (272) of these proceeded to Stage 3 (Delivery)
� 473 Meitheal processes were closed January to June 2017; 54% (253) were closed
following submission of a Meitheal request form; 18% (87) closed following completion
of Stage 2; 9% (41) closed following commencement of Stage 3 and 19% (92) closed post-
delivery.
� 88 Child and Family Support Networks (CFSN) operating at the end of June 2017, with a
further 53 planned.

64
• The percentage of requests from Direct Access ranged from 100% (n=5/5) in Kerry to 19%
(n=54/290) for CW/KK/ST, the area with the highest number of requests overall. In twelve
areas more than half of the requests were received through Direct Access (Figure 34).
• The percentage of requests from Social Work Diversion ranged from 79% (n=230/290) in
CW/KK/ST to 0% in Kerry (n=0/5) and Donegal (n=0/9). Thirteen areas reported a
percentage below the national average of 45% (Figure 34).
• The percentage of requests from Social Work Step-Down23 ranged from 43% (n=10/23) in
the MidWest (partial data) to 0% in Kerry (n=0/5) and GY/RN (n=0/63). With the
exception of MidWest, Dublin North (35%; 17/48), Donegal (33%; n=3/9) and DSW/K/WW
(29%; n=10/35) all areas reported a percentage of 20% or lower (Figure 34).
Table 38: Meitheal processes requested, January – June 2017
Area
Total
Meitheal
processes
Requested
Q1 – Q2
2017
Of the total number of Meitheal requests for Q1 – Q2 2017 the number (%)
where the access pathway was:
Direct
Access
% Direct
Access
Social Work
Diversion
% SW
Diversion
Social
Work Step
-Down
% Step-
Down
DSC 17 11 65% 3 18% 3 18%
DSE/WW 40 31 78% 7 18% 2 5%
DSW/K/WW 35 23 66% 2 6% 10 29%
Midlands 15 12 80% 2 13% 1 7%
DNC 48 23 48% 22 46% 3 6%
Dublin North 48 20 42% 11 23% 17 35%
LH/MH 19 14 74% 4 21% 1 6%
CN/MN 15 10 67% 4 27% 1 7%
Cork 0
Kerry 5 5 100% 0 0% 0 0%
CW/KK/ST 290 54 19% 230 79% 6 2%
WD/WX 100 43 43% 47 47% 10 10%
MidWest 29 15 52% 3 13% 11 38%
GY/RN 63 50 79% 13 21% 0 0%
Mayo 34 21 62% 9 26% 4 12%
Donegal 9 6 67% 0 0% 3 33%
SLWC 37 31 84% 5 14% 1 3%
National 804 369 46% 362 45% 73 9%
23
Social Work Stepdown: where a Meitheal process is initiated when a referral is accepted to the Child and Family Agency Social
Work Department, assessed by the Social Work Department and is deemed suitable for closure either after assessment or after a
period of intervention but has outstanding unmet need, that requires child and family support services, and is stepped down, with the
consent of the parent, via the Child and Family Support Network Coordinator for a Local Area Pathways Response and this results in
a Meitheal process being initiated.

65
Figure 34: Meitheal requests by access pathway
• 53% (n=423) of the Meitheal requests received between January – June 2017 proceeded to
Stage Two (Discussion Stage) (Table 39).
• The percentage of requests that proceeded to Stage Two ranged from 16% (n=45/290) in
CW/KK/ST to 100% in Dublin South Central (n=17/17), Kerry (n=5/5) and
Cavan/Monaghan (n=15/15)
• Ten areas reported a percentage above 70%. With the exception of Kerry and
Sligo/Leitrim/West Cavan all of the areas were in Dublin Mid Leinster and Dublin North
East.
Table 39: Number of Meitheal requests received (Jan-Jun 2017) proceeding to Stage Two (Discussion Stage)
Area
Total Meitheal
processes
requested Q1 –
Q2 2017
Of the total number of
requests received the number that
Proceeded to Discussion Stage
(Stage Two)
% that Proceeded to Discussion Stage (Stage
Two)
DSC 17 17 100%
DSE/WW 40 37 93%
DSW/K/WW 35 33 94%
Midlands 15 11 73%
DNC 48 44 92%
Dublin North 48 38 79%
LH/MH 19 16 84%
CN/MN 15 15 100%
Cork 0
Kerry 5 5 100%
CW/KK/ST 290 45 16%
WD/WX 100 49 49%
MidWest 29 13 45%
GY/RN 63 40 63%
Mayo 34 23 68%
Donegal 9 6 67%
0%
10%
20%
30%
40%
50%
60%
70%
80%
90%
100%
DS
C
DS
E/W
W
DS
W/K
/WW
Mid
lan
ds
DN
C
Du
bli
n N
ort
h
LH/M
H
CN
/MN
Co
rk
Ke
rry
CW
/KK
/ST
WD
/WX
Mid
We
st
GY
/RN
Ma
yo
Do
ne
ga
l
SLW
C
% o
f R
eq
ue
sts
by
Pa
thw
ay
Ty
pe
Direct Access SW Diversion Social Work Step -Down

66
SLWC 37 31 84%
National 804 423 53%
• 380 Meitheal processes reached completion of Stage Two between January – June 2017.
Highest number reported by GY/RN (n=58) followed by DSW/K/WW (n=50). The fewest
number was reported by Kerry (n=5) followed by Donegal (n=6) and MidWest (n=8). (Table
40).
• Of these, 72% (n=272) proceeded to delivery (Stage 3) (Meitheal Support Meeting). Eleven
areas reported a percentage above 70%. The lowest percentage was reported by WD/WX
(30%; 9/30) followed by GY/RN (55%; n=32/58).
• 12% (n=46/380) of processes were closed at the end of Stage 2. The highest percentage was
reported by GY/RN (36%; n=21/58). No processes were closed in six areas.
• 10% (n=37/380) of processes where referred for a single agency response. The highest
percentage was reported by WD/WX (63%; n=19/30) followed by Dublin North (19%;
7/36). No processes were referred for a single agency response in nine areas.
• 5% (n=18/380) of processes were referred to social work (stepped-up). The highest number
was reported by DSW/K/WW (n=5) followed by GY/RN (n=4). The majority of areas
reported none.
Table 40: Meitheal processes reaching completion of Stage Two, Jan - Jun 2017
Area
Number
of
Meitheal
Processes
Reaching
Completio
n of Stage
Two, Jan-
Jun 2017
Of the total number of Meitheal processes reaching completion of Stage Two (Discussion Stage)
the number and percentage that
Proceeded
to
Delivery
(Meitheal
Support
(Meeting) %
Referr
ed to
Social
Work
(Stepp
ed Up) %
Referred
to a
Single
Agency
Respons
e % Closed %
Categori
sed as
Other %
DSC 17 16 94% 0 0% 0 0% 0 0% 1 6%
DSE/WW 31 27 87% 0 0% 0 0% 4 13% 0 0%
DSW/K/WW 50 38 76% 5 10% 0 0% 7 14% 0
Midlands 11 9 82% 1 9% 1 9% 0 0% 0 0%
DNC 37 32 86% 3 8% 0 0% 1 3% 1 3%
Dublin North 36 23 64% 0 0% 7 19% 5 14% 1 3%
LH/MH 11 8 73% 0 0% 3 27% 0 0% 0 0%
CN/MN 12 10 83% 0 0% 0 0% 2 17% 0 0%
Cork 0
Kerry 5 3 60% 2 40% 0 0% 0 0% 0 0%
CW/KK/ST 26 18 69% 2 8% 4 15% 2 8% 0 0%
WD/WX 30 9 30% 1 3% 19 63% 1 3% 0 0%
MidWest 8 8 100% 0 0% 0 0% 0 0% 0 0%
GY/RN 58 32 55% 4 7% 1 2% 21 36% 0 0%
Mayo 23 17 74% 0 0% 2 9% 2 9% 2 9%
Donegal 6 5 83% 0 0% 0 0% 1 17% 0 0%
SLWC 19 17 89% 0 0% 0 0% 0 0% 2 11%
National 380 272 72% 18 5% 37 10% 46 12% 7 2%

67
• 473 Meitheals closed during the first six months of 2017. 37% (n=174) of those closed were
reported by CW/KK/ST. Fourteen areas reported fewer than 25 Meitheal closed (Table 41).
• Almost half (54%; n=253) were closed following submission of a Meitheal request form
(Stage 1). The percentage closed following submission of a Meitheal request form ranged
from 0% in CN/MN (n=0/20); Kerry (n=0/7) and MidWest (n=0/4) to 88% (n=153/174) in
CW/KK/ST followed by 69% (n=49/71) in WD/WX.
• Almost one in five (18%; n=87) was closed following completion of the Strengths and Needs
Form (Stage 2) and ranged from 0% in DSW/K/WW (n=0/21), Kerry (n=0/7) and MidWest
(n=0/4) to 54% (n=22/41) in GY/RN.
• Fewer than one in 10 (9%; n=41) was closed following commencement of Meitheal Support
Meetings (Stage 3). The percentage reported ranged from 100% in MidWest (n=4/4) to 0%
in four areas (DSE/WW; Midlands; WD/WX and Mayo). Eleven areas reported a
percentage below 20%.
• Almost one in five (19%; n=92) was closed post-delivery and ranged from 0% in MidWest
(n=0/4) and WD/WX (n=0/71) to 80% (n=16/20) in CN/MN.
Table 41: Number of Meitheals closed, January - June 2017
Area
Total
number of
Meitheals
closed
Of the total number of Meitheals closed the number and % that were closed following:
Submission of
a Meitheal
Request Form %
Completion
of the
Strengths
and Needs
Form
(Discussion
Stage) %
Commence
ment of
Meitheal
Support
meetings
(Delivery
Stage) % Post delivery %
DSC 4 1 25% 1 25% 1 25% 1 25%
DSE/WW 9 3 33% 4 44% 0 0% 2 22%
DSW/K/WW 21 4 19% 0 0% 4 19% 13 62%
Midlands 21 3 14% 5 24% 0 0% 13 62%
DNC 14 4 29% 2 14% 2 14% 6 43%
Dublin North 24 6 25% 9 38% 3 13% 6 25%
LH/MH 20 7 37% 1 5% 1 5% 11 53%
CN/MN 20 0 0% 2 10% 2 10% 16 80%
Cork 0
Kerry 7 0 0% 0 0% 2 29% 5 71%
CW/KK/ST 174 153 88% 12 7% 1 1% 8 5%
WD/WX 71 49 69% 22 31% 0 0% 0 0%
MidWest 4 0 0% 0 0% 4 100% 0 0%
GY/RN 41 5 12% 22 54% 12 29% 2 5%
Mayo 6 1 17% 3 50% 0 0% 2 33%
Donegal 14 4 29% 1 7% 5 36% 4 29%
SLWC 23 13 57% 3 13% 4 17% 3 13%
National 473 253 53% 87 18% 41 9% 92 19%

68
Between January and June 2017, 1,224 people attended Meitheal training as follows:
• 479 Tusla staff
• 75 HSE staff
• 185 Other Agency staff
• 453 NGO staff
• 32 Volunteers and Students
6.2.2 Child and Family Support Networks
• 88 Child and Family Support Networks24 (CFSN) operating at the end of June 2017 with a
further 53 CFSNs planned (Table 42).
• Galway/Roscommon reported the highest number of networks operating (n=12) followed
by Waterford/Wexford (n=8) and Kerry (n=8). One area (LH/MH) reported none
operating but is planning five.
Table 42: Child and Family Support Networks operating and planned June 2016
Area
CFSNs Operating
June 2017
CFSNs Planned
June 2017
DSC 5 2
DSE/Wicklow 7 2
DSW/K/WW 5 9
Midlands 7 0
Dublin North City 5 1
Dublin North 4 0
Louth/Meath 0 5
Cavan/Monaghan 7 7
Cork 6 7
Kerry 8 8
CW/KK/ST 7 0
WD/WX 8 0
MidWest 2 5
GY/RN 12 0
Mayo 2 2
Donegal 2 3
SLWC 1 2
National 88 53
24 Child and Family Support Networks: Collaborative networks of community, voluntary and statutory providers intended to improve
access to support services for children and their families

7.0 HUMAN RESOURCES
KEY AREAS OF FOCUS
7.1 Workforce Position
7.2 Absence Rate
7.3 Social Work Staff
7.4 Residential Services
7.5 Workforce Learning and Development
7.1 Workforce Position
• 3,644 whole time equivalent (WTE) staff (excluding agency staff) employed by Tusla at the
end of Q3 2017; seven more than Q2 2017 and 89 more than Q3 2016 (Figure 35).
Figure 35: Total Staff Employed (WTE), by month June 2016– June 2017
3,555
3,597
3,664
3,637 3,644
3,400
3,500
3,600
3,700
3,800
Sep-16 Dec-16 Mar-17 Jun-17 Sep-17
Nu
mb
er
of
WT
E
KEY FACTS
� 3,644 (WTE) employed by the Agency at the end of Q3 2017; 7 more than Q2 2017 and 89 more
than Q3 2016
� 294 new staff came on to the Agency’s payroll (Jan - Sept 2017)
� 254 staff left (incl. retirements) the Agency (Jan - Sept 2017)
� 127 staff on maternity leave (incl. 39 unpaid) at the end of Sept 2017
� 451 agency staff employed by Tusla at the end of Sept 2017
� 5.21% absence rate (Aug 2017); 0.64 percentage points higher than Q2 2017
� 82 courses run by Workforce Learning and Development in Q3 2017; 930 attendees

70
• Social workers are the largest category of staff employed by the Agency accounting for 40%
(n=1,461) of total staff (WTE) employed at the end of Q3 2017, followed by social care staff
accounting for a further 30% (n=1,108). Management (Grade VIII+) account for 4%
(124.93) of the workforce (Figure 36).
Figure 36: Breakdown of staff category (WTE), Q3 2017
• Management and administration staff experienced an increase in WTEs between Q2 2017
and Q3 2017 of 8 and 11 more WTEs respectively (Table 43). All other categories (with the
exception of Psychology and Counselling) experienced either no change or a decrease in
WTEs.
• The highest decrease was observed across the Social Care category (n=5.52) followed by
Nursing (n=3.42).
Table 43: Breakdown of staff (WTE) by category and year and quarter
Staffing by Category Sep-16 Jun-17 Sep-17 ∆+/- Q3 2017 v Q2 2017
Social Work 1,472.44 1,462 1,460.53 -1.47
Social Care 1,096.89 1,114 1,108.48 -5.52
Admin Grade III-VII 490.94 556 567.27 11.27
Family Support 164.81 161 159.23 -1.77
Management VIII+ 106.81 117 124.93 7.93
Education and Welfare Officer 79.22 90 88.08 -1.92
Other Support Staff inc catering 64 60 59.41 -0.59
Nursing 47.4 49 45.58 -3.42
Psychology and Counselling 22.48 18 19.92 1.92
Other Health Professionals 9.92 10 10.36 0.36
Total Staffing 3555 3637 3644 6.79
• 294 new staff joined Tusla (came onto Tusla’s payroll) between Jan - Sept 2017
• 187 staff left Tusla (i.e., resigned, career breaks, retirement) between Jan – Sept 2017
1,461
40%
1,108
30%
567
16%
159
4%
125
4%
88
2%
59
2%
46
1%
20
1%
10
0% Social Work
Social Care
Admin Grade III-VII
Family Support
Management VIII+
Education and Welfare Officer
Other Support Staff inc catering
Nursing
Psychology and Counselling
Other Health Professionals

71
• 67 staff retired between Jan – Sept 2017
• 127 staff were on maternity leave at the end of Sept 2017 of which 72% (n=91) were on paid
maternity leave
• 451 agency staff employed by Tusla at the end of Sept2017.
7.2 Absence Rate
• At the end of August 201725 the overall absence rate for the Agency was 5.21% against a
target of 3.5% (target for public sector); third consecutive monthly increase and 0.64
percentage points higher than June 2017 but 0.25 percentage points lower than Aug 2016
(Figure 37).
Figure 37: Overall staff absence rate by month
• The highest absence rate was reported for social care staff (7.81%) (Table 44). The rate for
Residential Services was 9.51% (data not shown), 4.3 percentage points higher than the
overall rate of 5.21%.
Table 44: Absence rate by staff grade
Staff Grade
Absence Rate
May 2017
Social Work 4.88%
Social Care 7.81%
All other grades 3.39%
25
Absence rates are reported monthly in arrears
5.4
6%
5.0
7%
5.2
9%
4.9
0%
5.5
0%
4.9
2%
4.6
9%
4.6
9%
4.4
2%
4.2
8% 4.5
7%
4.8
2% 5
.21
%
3.5%
2.00%
3.00%
4.00%
5.00%
6.00%
Ab
sen
ce r
ate
Absence Rate Target 3.5% (Public Sector Target)

72
7.3 Social Work Staff (WTE)
• 1,461 whole time equivalent (WTE) social work staff (all grades and excluding agency staff)
employed by Tusla at the end of Q3 2017; 1.47 fewer than Q2 2017 and 11 fewer than Q3
2016 (Figure 38).
Figure 38: Number of social workers (WTE) by month
• 137 social workers joined Tusla (came onto Tusla’s payroll) between Jan and Sept 2017
• 116 social workers left (i.e., resigned, career breaks) Tusla between Jan and Sept 2017
• 17 social workers retired between Jan and Sept 2017
• 76 social workers (incl. 23 unpaid) were on maternity leave at the end of Sept 2017
• 173 agency social workers were employed at the end of Sept 2017
• At the end of August 201726 the absence rate for social workers was running at 4.88%, 0.33
percentage points lower than the overall rate (5.21%).
• A breakdown of the number of social workers (all grades) employed at the end of each
quarter Q3 2016 – Q3 2017 by area is presented in Table 45.
26
Absence data is reported a month in arrears
1,4
72
1,4
58 1,4
86
1,4
62
1,4
61
1,300
1,400
1,500
1,600
Sep-16 Dec-16 Mar-17 Jun-17 Sep-17
Nu
mb
er
of
So
cia
l W
ork
WT
E
Axis Title
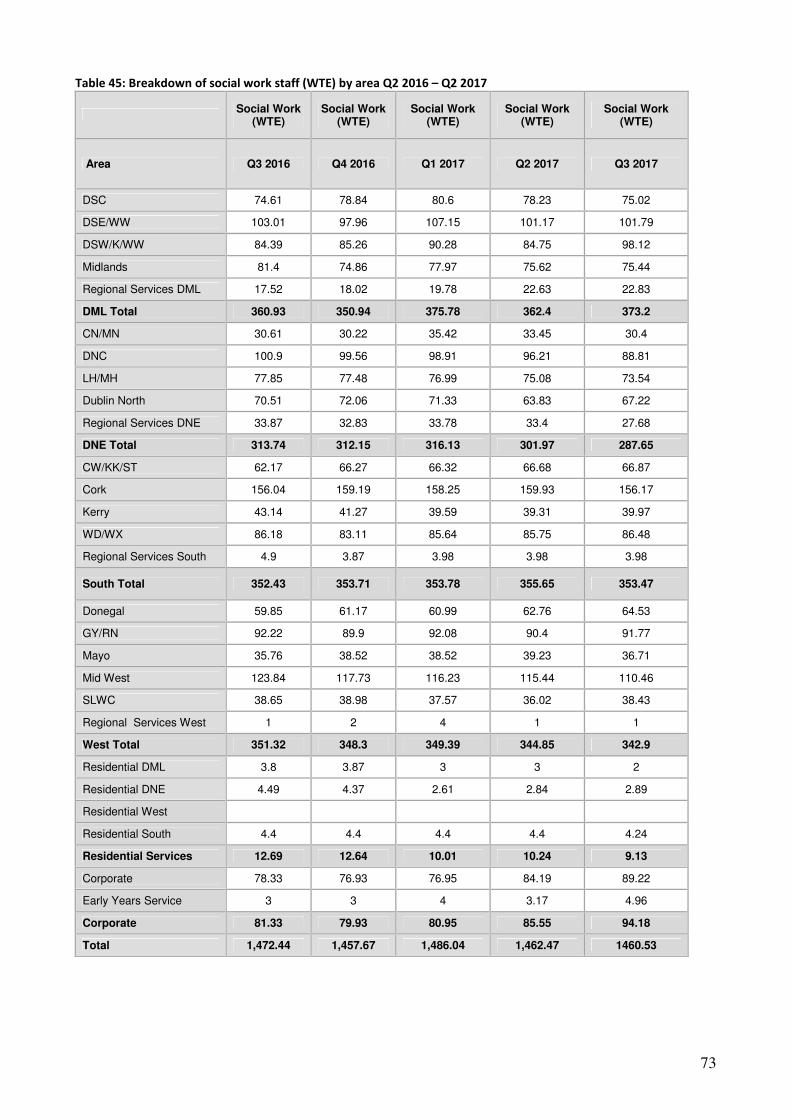
73
Table 45: Breakdown of social work staff (WTE) by area Q2 2016 – Q2 2017
Social Work
(WTE) Social Work
(WTE) Social Work
(WTE) Social Work
(WTE) Social Work
(WTE)
Area Q3 2016 Q4 2016 Q1 2017 Q2 2017 Q3 2017
DSC 74.61 78.84 80.6 78.23 75.02
DSE/WW 103.01 97.96 107.15 101.17 101.79
DSW/K/WW 84.39 85.26 90.28 84.75 98.12
Midlands 81.4 74.86 77.97 75.62 75.44
Regional Services DML 17.52 18.02 19.78 22.63 22.83
DML Total 360.93 350.94 375.78 362.4 373.2
CN/MN 30.61 30.22 35.42 33.45 30.4
DNC 100.9 99.56 98.91 96.21 88.81
LH/MH 77.85 77.48 76.99 75.08 73.54
Dublin North 70.51 72.06 71.33 63.83 67.22
Regional Services DNE 33.87 32.83 33.78 33.4 27.68
DNE Total 313.74 312.15 316.13 301.97 287.65
CW/KK/ST 62.17 66.27 66.32 66.68 66.87
Cork 156.04 159.19 158.25 159.93 156.17
Kerry 43.14 41.27 39.59 39.31 39.97
WD/WX 86.18 83.11 85.64 85.75 86.48
Regional Services South 4.9 3.87 3.98 3.98 3.98
South Total 352.43 353.71 353.78 355.65 353.47
Donegal 59.85 61.17 60.99 62.76 64.53
GY/RN 92.22 89.9 92.08 90.4 91.77
Mayo 35.76 38.52 38.52 39.23 36.71
Mid West 123.84 117.73 116.23 115.44 110.46
SLWC 38.65 38.98 37.57 36.02 38.43
Regional Services West 1 2 4 1 1
West Total 351.32 348.3 349.39 344.85 342.9
Residential DML 3.8 3.87 3 3 2
Residential DNE 4.49 4.37 2.61 2.84 2.89
Residential West
Residential South 4.4 4.4 4.4 4.4 4.24
Residential Services 12.69 12.64 10.01 10.24 9.13
Corporate 78.33 76.93 76.95 84.19 89.22
Early Years Service 3 3 4 3.17 4.96
Corporate 81.33 79.93 80.95 85.55 94.18
Total 1,472.44 1,457.67 1,486.04 1,462.47 1460.53

74
7.4 Workforce Learning and Development
• Workforce Learning and Development (WLD) ran a total of 82 courses during Q3, 2017 at
which a total of 930 persons attended. A breakdown of the courses run and attendees by
type is presented in the table below.
• During Q3, 2017 the most frequently run course was Child and Youth Participation Training
with 11 courses run. This was followed by Therapeutic Crisis Intervention, six monthly
refresher, and Meitheal Briefing both with seven courses.
• A total of 608 Tusla staff attended training during Q3, 2017 and of these 45% (n = 271/608)
were social workers.
• A total of 296 external staff (non Tusla/HSE) attended training in Q3, 2017; the majority
(55%: n = 163/296) of whom received Partnership, Prevention and Family Support training
(e.g. Meitheal Standardised Training, Meitheal Train the Trainer courses, Meitheal
Standardised Briefings, Participation of Young People Standard Briefings and Parenting
Strategy Briefings).
• There were 25 courses that were categorised as ‘Other’ courses. These courses which
constitute 30% of all the courses, refer to a range of locally delivered courses that are
developed in response to particular needs and requests in areas such as Neglect, Child
Development; addressing HIQA Recommendations etc.
Other Developments in Q3 2017
• The design and development of an e-learning programme to support the Children First Act
2015 was completed in September. This universal programme will support the learning
needs and responsibilities of all who work with or have contact with children in the State.
• September was identified as the month when Tusla staff would be encouraged to register on
iLearn@Tusla, as a step towards use of this platform for L&D activity management across
the agency, and specifically the delivery of online training. Almost 2,000 staff had
registered by end of Q3 2017.
• All staffing resources to support the Child Protection and Welfare Strategy were put in place
and working on the roll-out of training and support for the national approach to practice
with Resolutions Consulting.
• An initiative to deliver ICT (MS Office Suite) training to 320 administrative staff was
commenced.
• A pilot programme was agreed and commenced to explore the provision of coach support to
learners in their application of learning from training into practice.

75
WLD National Training Activity - July to Sept
2017*
No.
COURSES
RUN
NO.
TUSLA
SOCIAL
WORKERS
NO.TUSLA
OTHER
STAFF
NO.HSE
STAFF
NO.OTHER
EXT STAFF
TOTAL NO.
ATTENDEES
Assessment & Analysis 0 0 0 0 0 0
Attachment Theory into Practice 4 34 26 0 0 60
Case Load Management 0 0 0 0 0 0
Children First Training 2011 for Tusla Staff 2 0 40 0 0 40
Core Court Room Skills 1 13 2 0 0 15
Corporate Induction 0 0 0 0 0 0
Corporate Induction (Regional) 0 0 0 0 0 0
CPD Strategy Briefings 0 0 0 0 0 0
Direct Work with Children 1 4 6 0 0 10
Diversity in Modern Ireland 1 0 17 0 3 20
Domestic Sexual and Gender Based Violence 2 16 21 0 7 44
Evidence Informed Practitioned Programme 0 0 0 0 0 0
First Time Managers 0 0 0 0 0 0
Grade III & IV Admin Development Programme 0 0 0 0 0 0
Introduction to Court Skills 3 23 24 0 1 48
Leadership Development Programme 0 0 0 0 0 0
Legal Briefing Seminar 2 61 17 0 0 78
Making the Most of Supervision for Supervisees 0 0 0 0 0 0
Marte Meo Communication Skills Training - 0 0 0 0 0 0
NCCIS User Training 3 6 11 0 0 17
Practice Development for New Social Workers 2 33 0 0 0 33
Procurement Workshop - Tusla Finance 0 0 0 0 0 0
Reflective Recording & Report Writing 0 0 0 0 0 0
Response Ability Pathways 0 0 0 0 0 0
SAOR 0 0 0 0 0 0
Signs of Safety - Practice Leader 0 0 0 0 0 0
Signs of Safety (2 Day) 0 0 0 0 0 0
Staff Supervision Skills for Supervisors 1 1 3 2 0 6
Suicide Prevention - SafeTALK 0 0 0 0 0 0
TCI (de-esculation) - for Family Care Providers 0 0 0 0 0 0
Therapeutic Crisis Intervention - Core 0 0 0 0 0 0
Therapeutic Crisis Intervention - Six Monthly Refresher 7 0 37 0 37 74
Therapeutic Use of Daily Life Events 0 0 0 0 0 0
TUSLA PMLF 0 0 0 0 0 0
Understanding Juveniles - exhibit SHB 0 0 0 0 0 0
Other 25 30 53 0 85 168
Child and Youth Participation Training 11 28 55 0 12 95
Commissioning Standardised Briefing 0 0 0 0 0 0
Meitheal Briefing 7 10 4 19 43 76
Meitheal Facilitators Chairs Meeting 4 1 11 0 37 49
Meitheal Record Keeper Training 0 0 0 0 0 0
Meitheal Standardised Refresher Course 0 0 0 0 0 0
Meitheal Standardised Train the Trainer 0 0 0 0 0 0
Meitheal Standardised Training Course 5 3 5 5 71 84

76
Parenting Support Champion Training - Attachment 0 0 0 0 0 0
Parenting Support Champion Training - Diversity 0 0 0 0 0 0
PPFS /Meitheal Other 1 8 5 0 0 13
TOTAL 82 271 337 26 296 930

77
8.0 FINANCE
Financial Performance
• The outturn for the year to date (September 2017) is an overspend of €8.085 million.
• The net expenditure for the period is €502.732 million against a budget allocation of
€494.646 million.
• Pay costs are over-spent against budget by €1.117 million for the YTD (Table 46).
Table 46: Pay Costs
• Non-pay costs are over-spent against budget by €8.236 million for the YTD (Table 47).
Table 47: Non Pay Costs
• A key area of over-spend is private residential and foster care costs at €8.183 million
over-spend YTD (Table 48). This over-spend is due to an increased number of children
in private placements. Placement of children in private residential and foster care
services is strictly controlled through a national placement process.
Child and Family Agency
Sept 2017 Year To date % Variance
Act vs Budget Actual Budget Variance
€’000 €’000 €’000 €’000
Pay costs 190,374 184,257 1,117 1%
Child and Family Agency
Sept 2017 Year To date % Variance
Act vs Budget Actual Budget Variance
€’000 €’000 €’000 €’000
Non pay costs 328,256 320,020 8,236 3%
KEY FACTS
� The financial outturn for the year to date (Sept 2017) is an over-spend of €8.085 million
� Pay costs are over-spent against budget by €1.117 million
� Non pay costs are over-spent against budget by €8.236 million
� Key area of over-spend is private residential and foster care costs at €8.183 million over
budget
� 41% (€9.791 million) of legal expenditure year to date on guardians ad litem (GALs),
including GAL’s solicitors and counsel.

78
Table 48: Private Residential and Foster Care Costs
• Legal costs incurred by the Agency account for a significant portion of the overall budget
of the Agency. The financial position at the end of Sept 2017 shows a year to date spend
of €23.695 million against a budget of €21.227 million (i.e., €2.468 million over-spend).
• A breakdown of legal expenditure by type is presented in Table 49.
• 41% (n=€9.791 million) of the legal spend year to date has been on guardians ad litem
(GALs) including GALs solicitors and counsel.
• In terms of forecasting these data should be interpreted with caution as they are based
on the individual billing pattern of persons concerned.
Table 49: Legal Expenditure
Type
June YTD
€’000s
3rd Party Counsel Fees 575
3rd Party Solicitors Fees 1,524
Contracted Legal Services 9,051
Counsel fees - Tusla 1,056
Guardian ad Litem Costs 5,452
Guardian ad Litem Counsel fees 670
Guardian ad Litem Solicitors fees 3,669
General Legal Fees 774
Court Settlements 97
Other 827
Net Expenditure 23,695
Child and Family Agency
Sept 2017 Year To date % Variance Act vs Budget
Actual Budget Variance
€’000 €’000 €’000 €’000
Private Residential & Foster Care
76,897 68,714 8,183 12%

APPENDIX I
ABBREVIATIONS
The following abbreviations have been used for Tusla Service Areas in charts and tables presented
in this report.
Service Area Abbreviation
Dublin South Central DSC
Dublin South East / Wicklow DSE/WW
Dublin South West / Kildare / West Wicklow DSW/K/WW
Midlands Midlands
Dublin North City DNC
Dublin North DN
Louth / Meath LH/MH
Cavan / Monaghan CN/MN
Cork Cork
Kerry Kerry
Carlow Kilkenny / South Tipperary CW/KK/ST
Waterford / Wexford WD/WX
Mid West Mid West
Galway / Roscommon GY/RN
Mayo Mayo
Donegal Donegal
Sligo / Leitrim / West Cavan SO/LM/WC

APPENDIX I – Hiqa Inspections
SUMMARY OF FINDINGS - FOSTERING REPORTS PUBLISHED Q3 2017
Cork- inspection took place in February 2017
While there were immediate actions taken as required to ensure children were safe, not all child protection
and welfare concerns or allegations about foster carers were managed and fully investigated in line with
Children First (2011). In addition, child protection and welfare concerns and allegations about foster carers
were not consistently responded to in the appropriate manner. There was not always evidence that strategy
meetings were held to plan the next steps. Decisions as to whether the concerns or allegations met the
threshold of abuse and the procedures to be followed as a result were not always clear on files reviewed.
There were no formal systems in place to ensure the Foster Care Committee was notified of child protection
and welfare concerns or allegations. Appropriate safeguarding arrangements, such as Garda Síochána
(police) vetting and adequate home visits by link workers, were not in place for all foster carers. Assessments
of general foster carer applicants were comprehensive, though not always timely, and the reports were of
good quality. The process of recommending the approval of foster carers was clear and was in line with
national policy, procedures and guidance. There were significant delays in the commencement and
completion of relative assessments with many children placed for several years with unassessed relative
carers and a lack of evidence of adequate safeguarding measures in place. A small number of children,
0.47% of the total number of children in care, were living with relative carers who had not been approved by
the foster care committee. While 40 foster carers, or 8% of the total number, were unallocated the majority of
approved fosters carers had an allocated link worker. Nevertheless, there was evidence that the level of
support and supervision provided to foster carers varied and the frequency of home visits was not always
sufficient. There were some supports in the community and specific services funded by the area. Monthly
support groups facilitated by social workers were available. While there was no national out -of- hours
service for foster carers, the fostering unit did provide out-of-hours telephone support to foster carers during
bank holidays, and Christmas and Easter holidays. General foster carers received foundational training
before their approval as foster carers and training programmes to assist carers in maintaining the necessary
skills and knowledge required to provide high quality care were provided. A new training event, piloted by
the fostering unit, which aimed to improve foster carers capacity to provide trauma healing was being rolled
out in 2017. However, there was no system in place to either ensure relative carers attended foundation
training or that foster carers following approval attended ongoing training. Training records for foster carers
were not well maintained and with so many foster carers who had not had a review this meant that the
opportunity to address training needs was missed. Comprehensive reviews of foster carers were not carried
out in line with regulations and Standards. Although there had been an improvement in the number of
reviews completed in the previous 12 months, 43% of carers had not had a review for more than three years
and as a result their Garda Síochána (police) vetting was not updated. Reviews following concerns or
allegations were of good quality but the quality of standard reviews varied. Garda Síochána (police) vetting,
medicals or health and safety updates were pending although the review still went ahead. The foster care
committee comprised a range of members who were experienced in childcare and their work was effective.
However, it was not fully compliant with the Standards and national policy, procedure and best practice
guidance. In addition, there was no training programme for foster care committee members, and no annual
report since 2014 as a means of contributing to the development of the service. There was no system in place
for the committee to track the progress of investigations of allegations. There was an insufficient number and
range of foster carers in place to meet the demand for services and more foster carers were leaving the

81
service than were being recruited. Furthermore, there were insufficient staff resources in place to progress
assessments and increase the pool of potential foster carers. There was no evidence that the foster carer panel
was reviewed periodically to ensure there was an appropriate range of foster carers to meet the needs of
children in the area. Due to the number of significant issues arising from this inspection, inspectors were
concerned that managerial oversight and monitoring was not sufficient. There was no designated authorised
person to undertake formal monitoring of the foster care service. The long delays in commencement and
completion of relative assessments and subsequent lack of sufficient safeguarding measures was an area of
risk in the last HIQA inspection in 2013. While this was on the area risk register, these relative carers had not
been allocated a link worker to mitigate the risks. Systematic audits were not carried out and there was little
evidence of case management and improvements were required regarding record keeping. Interim
management arrangements while the principal social worker for fostering was on leave were not clear. 35 of
80 cases reviewed by inspectors were escalated to the alternative care services manager, and he was asked to
address the risks and concerns arising. These concerns were as follows: the adequacy of investigations
following a child protection or welfare concern or allegation about foster carers and unclear outcomes to
strategy meetings, and the lack of a system to ensure that a child would not be placed with foster carers for
whom there was an open concern or allegation; unassessed and unapproved relative carers without Garda
Síochána (police) vetting; significant delays in the commencement and completion of relative assessments
with many children placed for several years; a lack of evidence of adequate safeguarding measures in place
for these relatives and for foster carers without link workers; adults living in foster carer households without
Garda Síochána (police) vetting; relative carers who had not been approved by the foster care committee;
inadequate support and supervision of foster carers; foster carers where the number of unrelated children in
placement exceeded the standards; record keeping, information governance, and due diligence when foster
carers transfer from one area to another. A response was received from the alternative care services manager
in relation to all of the cases escalated, and this response included the assignment of a link social worker to
all unassessed and unapproved relative carers, and assurances that a process had commenced to ensure Garda
Síochána vetting was completed and updated for all foster carers. Due to the level of non compliance with
standards, five of which were of major non compliance, the Chief Operating Officer of Tusla was written to
regarding these concerns. A meeting was held with the Service Director following the inspection. At that
meeting, the service director confirmed what immediate action had been taken and the further actions that
were in progress. The actions outlined by the Service Director consisted of new posts being created,
including senior practitioners and a team leader, and a review of the management structures which he
indicated would be completed by the end of quarter two.
Dublin North - inspection took place in April 2017
The area took appropriate action to protect children in the care of foster carers where child protection
concerns or allegations had been made against foster carers. Inspectors found good quality safeguarding
arrangements while investigations were ongoing. The area did not consistently classify initial reports that
alleged harm to a child in the care of a foster carer in line with the local area policy to ensure those that
required a child protection response were managed in line with Children First (2011). 14% of all foster carers
had not had their An Garda Síochána (police) vetting updated in more than three years and inspectors were
not assured that all foster carers were trained in line with Children First: National Guidance for the
Protection and Welfare of Children (2011) and in safe care practices. In response, the area had a plan to
ensure all foster carers received this training before the end of 2017. The area appropriately screened relative
foster carers before emergency placements were made. Assessments of both relative and general carers were
of good quality. There had been significant drift in six relative foster care assessments that had been
completed but had not yet been recommended for approval by the committee and there was no system in

82
place to track the progress of these assessments and escalate them so that timely action could be taken.
Inspectors escalated the lack of timely action in relation to the approval of these relative foster care
assessments to the fostering management team and a satisfactory response was subsequently received from
the area. With the exception of one foster care file reviewed by inspectors, foster carers had formal Garda
vetting completed and recorded on their files. Inspectors escalated one foster care household where Garda
vetting had not been completed for three adult members of the house. The area subsequently provided
assurances that Garda vetting would be applied for these adults. The process in place for foster carers who
transferred into the service was not followed through comprehensively and was not in line with the transfer
protocol in foster care committee policy and procedures. This meant that the committee did not have
appropriate oversight of the transfers and the area could not adequately review their full history of fostering
and assure themselves that carers could safely and appropriately care for children in their care. The majority
of fosters carers had an allocated link worker and were, in general, well supported. Foster carers that met
with inspectors indicated that they were satisfied with the service that was provided. The arrangements for
the supervision of foster carers who were allocated were good. Foster carers were visited regularly and
received regular phone calls. However, there was no dedicated out-of-hours service to support foster carers
outside of office hours. Where foster carers were unallocated the area was unable to verify when the last visit
had been to these carers by the fostering department. Therefore the oversight of and safeguarding
arrangements in place for unallocated foster carers in the area was insufficient. Three foster carers had not
been visited by a link worker in a significant amount of time. These cases were escalated to the principal
social worker for urgent action. The area manager had begun to implement a system to provide oversight of
this and had commenced an audit of all foster carers and corresponding children in care to provide assurance
on visits that were required. Foster carers received foundational training before their approval as foster
carers. The area did not always ensure relative foster carers attended the introduction to fostering training.
The area held regular training and ensured foster carers were informed of training dates. There was no
overall training strategy for foster carers. A comprehensive training needs analysis had not been carried out
and there was no comprehensive structured programme of training in place that responded to the training
needs of foster carers. Where reviews were completed, they were of good quality. These reviews were
comprehensive and included the voice of the child placed with carers. Reviews of foster carers were not up
to date for 155 foster carers, who had not had a review for more than three years. Inspectors escalated the
significant delay in completing foster care reviews. The area manager provided written assurances to HIQA
that all reviews would be up-to-date by June 2018 which allowed for the backlog to be addressed along with
on-going reviews. The area was not routinely completing reviews where a report of a serious complaint or
allegation had been made against foster carers. As part of the plan to address the deficits in reviews, these
foster carers were to be prioritised by the area. The Foster Care Committee was in compliance with the
national policy, procedure and best practice guidance on foster care committees. The work of the committee
was effective and they made clear decisions. The committee operated an induction program for new
members. Committee members had Garda vetting and attended training. The committee maintained a log of
serious concerns and allegations, however, they did not track the progress of investigations or follow up to
ensure they were completed. The area did not have sufficient resources in place to assess carers. However,
they funded a private foster care agency to complete assessments when required. The area was resourced to
recruit foster carers. The recruitment of foster carers was becoming more challenging and the area did not
have sufficient placements to meet the needs of the service. In response, the area had plans to pilot a number
of new and creative initiatives in the area to address the shortfall in recruitment of foster carers. However,
there was no overall recruitment strategy in place in the area.

83
Sligo/Leitrim - inspection took place in April 2017
Immediate actions were taken as required to ensure children who made allegations were safe. Child
protection and welfare concerns and allegations about foster carers reviewed by inspectors were all managed
and investigated. However, it was not always clear if this was carried out in line with Children First:
National Guidance on the Protection and Welfare of Children (2011) due to the poor quality of some records.
Initial assessments were carried out in relation to all allegations which were reviewed by inspectors.
However, decisions about whether concerns or allegations met the threshold of abuse and the procedures to
be followed as a result were not always clearly recorded on files. Due to gaps in foster carer files, critical
information and the rationale for decision-making in relation to allegations was at times difficult to establish.
Two of the four cases reviewed required escalation to the area manager as link workers and the team leader
were not able to provide assurances in relation to allegations that, for example, there had been a
comprehensive investigation, clear outcomes or adequate follow up. Subsequent to this, inspectors sought
assurances that all child protection concerns in relation to children in foster care over the last 24 months,
including allegations against foster carers, were all managed in line with Children First (2011), and that
necessary safeguarding arrangements were put in place. The area manager provided an appropriate action
plan in relation to this. There were some appropriate safeguarding measures in place. At the time of this
inspection, all children in care had allocated social workers and all approved foster carers had allocated link
workers. However, over the previous 12 months there had been a high level of staff turnover and periods of
staff shortages. The frequency and quality of home visits to foster carers varied as a result. While relatives
were waiting on their assessment to be carried out, records did not show that these carers were provided with
supervision and support from the fostering service, despite children being in placement with them. Data
provided by the service area showed that while all foster carers had Garda Síochána (police) vetting, this
needed to be updated for 34% of foster carers. Inspectors found on inspection that two foster carers did not
have evidence of appropriate Garda vetting on file. The area manager provided assurances that Garda vetting
for these carers would be immediately obtained. While training in line with Children First: National
Guidance on the Protection and Welfare of Children (2011) was provided by the service area on a yearly
basis, records did not show that all foster carers had attended. Complaints made against foster carers and by
foster carers were not appropriately categorised, recorded or notified to the Foster Care Committee. Because
of this, there was no system for management to track and have oversight of all complaints about the service
or to conduct a collective analysis in relation to complaints for learning purposes. There had been a high
turnover of staff on the fostering team over the previous 12 months and there were periods where the
fostering team was understaffed. The level of support and supervision provided to foster carers and the
frequency of home visits over the course of the year had varied and was not always in line with local policy.
There was a foster care support group operating in the area but this was facilitated and run by foster carers
themselves, with limited involvement from the social work department. The support group coordinators were
provided with the opportunity to meet with the principal social worker and team leader on annual basis to
discuss issues that arose over the course of the year. Foster carers received appropriate foundational training
before their approval as foster carers. However, the provision, attendance and recording of ongoing training
for approved foster carers varied. While relevant training sessions were organised and offered to approved
foster carers, there was no system in place to ensure that foster carers attended ongoing training to ensure
that they equipped themselves to meet the needs of the children in their care. Reviews of foster carers were
not carried out in line with regulations and standards. Over 50% (45) of foster carers had not had a review for
more than three years. As a result of this, a high number of foster carers had not had their Garda Síochána
(police) vetting updated. There was a foster care review schedule in place for 2017 in order to attempt to
increase the number of foster carer reviews being carried out. Inspectors sought and received an assurance
from the area manager that the area’s action plan on foster carer reviews had commenced and that quarterly

84
progress reports would be submitted to HIQA in relation to the achievement of the targets set out in the plan.
Due to such a small number of foster carer reviews taking place, the opportunity provided for the updating of
Garda vetting, consideration of foster carers’ performance and current circumstances and assessment of their
training and support needs was missed. Some performance issues were addressed through mechanisms such
as disruption meetings and Garda Vetting and training were addressed by the long-term assessment matching
process. However, the gaps identified in relation to the updating of Garda vetting and training needs were not
effectively addressed by the current systems in place. Due to the small number of foster carer reviews that
took place, there was little learning from reviews that would assist in the identification of gaps in the foster
care service as a whole. The Foster Care Committee was guided by Standards and national policy, procedure
and best practice guidance. The chairperson had relevant expertise and was clear about her responsibilities as
chair and those of the committee members. Committee members had an appropriate mix of experience and
expertise. Members were well prepared for meetings and issues were thoroughly discussed. There were some
specific deficits identified. While allegations were notified to the committee, there was no system for the
committee to track the progress of investigations of allegations. There was little evidence that the committee
made recommendations in relation to specific further training for approved foster carers. There were foster
carer reviews carried out which did not include any reference to updated Garda vetting, medicals or health
and safety checks. The committee subsequently recommended approval following reviews without ensuring
that these updates were completed. However, overall the committee was effective in the business it
conducted and made clear decisions. While staff had mixed views in relation to the sufficiency of the number
of foster carers on the panel, there was a consensus that the range of foster carers in place to meet the
demand of the service was inadequate. While there were a number of foster carers on the panel listed as
being available to accept a placement, these were limited in terms of their availability and the type of care
they could provide. While formal reviews of the foster care panel did not take place periodically, it had been
identified at a foster care recruitment planning meeting that more carers were needed from different ethnic
and minority backgrounds as well as those who could care for sibling groups and children in the 15-17 year
age bracket. A foster care recruitment action plan was drawn up in 2016 and this included a plan for poster
and leaflet circulation in the local community, recruitment stands at supermarkets and local events and
advertisements in newspapers. Despite these efforts, only three general foster care assessments had been
carried out and approved in the previous 12 months. Data provided by the area showed that four general
foster carers were undergoing the assessment process and three general foster care applicants were on the
waiting list for assessment. There had been insufficient staff resources in place to carry out ongoing
recruitment strategies and conduct assessments in order to increase the pool of potential foster carers. During
the course of the inspection, there were concerns about the recording systems and different individual
practices of link workers in relation to recording, IT and filing systems. Due to inconsistencies in these
practices, it was often difficult to access and establish critical information on files. While some audits of files
took place to ensure necessary documents were in place, inspectors found that the quality of record keeping
and case notes was inconsistent and at times, poor. Thorough and systematic audits were not carried out and
there was little evidence of case management and oversight. Due to this, inspectors were concerned that
managerial oversight and monitoring was not sufficient. The issue of inconsistencies in record-keeping and
IT systems was escalated for review and an action plan was provided by the area manager to address these
concerns.
Galway/Roscommon - inspection took place in May 2017
This inspection identified that the two counties that make up this service area were integrated in relation to
how they arranged training and recruitment. In all other areas of practice they functioned independently from
each other. Complaints and allegations were appropriately responded to and actions were taken to keep

85
children safe. There was a system in place to ensure that complaints, concerns and allegations were recorded,
managed and tracked until a final outcome was reached. This system ensured management oversight of
complaints, concerns and allegations. However, there were some differences in practice throughout the area
and the systems in place required further embedding into practice to ensure that complaints, concerns and
allegations were consistently managed in both areas, and that all allegations were notified to the Foster Care
Committee. During the inspection, one allegation was brought to the attention of the principal social worker
for further action to be taken as the issues involved had not been sufficiently addressed. In addition, one
complaint was referred to the fostering team leader as further action was required to ensure the foster carers
had oversight of the situation. Systems in place for obtaining and updating An Garda Síochána (police)
vetting were not reliable. Two foster carers had been approved despite there being no vetting evident on their
files and, in addition, not all adults living in foster homes had evidence on file of being Garda vetted. These
potential risks were escalated to the area manager following the inspection and the area manager informed
HIQA that a comprehensive audit had been conducted of all fostering files. Systems to ensure that updated
Garda vetting for all foster carers would be sought in time were being put in place. One file was also referred
to the principal social worker for An Garda Síochána (police) vetting for an adult family member that was
not on the file. The implementation of the improved Garda vetting system put in place following the
inspection should address this deficit. Assessments of prospective foster carers were comprehensive and of
good quality and followed the national framework. However, there were some delays in completing
assessments. There were very small waiting lists for assessments and there were plans in place to allocate
these cases. The majority of foster care households where children were placed had an allocated link worker.
Six foster carers did not have an allocated link worker at the time of the inspection but these were due to be
allocated later in the month. Some formal supervision of foster carers took place. The recording of the formal
supervision process by link workers with foster carers was not consistent and managers were aware of this
and were working towards achieving consistency. Foster carers were well supported. Foster carers described
good formal and informal support by their link workers. There were support groups available which were
provided by a national voluntary organisation and there were some informal support groups for foster carers
provided by link workers. There was a variety of good additional support services available to foster carers
as a support to placements where children had complex needs. These supports included the work of the
social care workers and leaders, the services of an occupational therapist and access to respite care.
Management oversight of link workers was mixed. There was one team leader vacancy in the area and this
had an impact on the ability of the existing team leaders to manage all of the link workers in the area. The
quality of recording in files was of mixed quality; some files were comprehensive and detailed while others
were poor. Files were not well organised and basic information was not easily accessed. Some case notes
were brief and lacking in detail. The provision of training was good and was well organised. Foster carers
received foundation training in foster care during the assessment process and prior to being approved. The
area had an initiative in place whereby some training events were mandatory for all new foster carers
including Children First: National Guidance for the Protection and Welfare of Children (2011) and farm
safety training. Some foster carers undertook relevant training following their approval. Foster carers were
informed of training events being provided by the area on a range of subjects. The area maintained training
records on the training that was undertaken by foster carers but this was not always clearly recorded in their
files. Therefore, it was difficult for managers and staff to know whether or not all foster carers participated in
regular training and to ensure that they equipped themselves to meet the needs of the children in their care.
Reviews of foster carers were not carried out in line with the regularity required by the standards but the area
was working towards compliance and was making progress. Seventy-one or 25 % of foster carers had not
had a review in more than three years. Prior to the inspection the principal social workers had scheduled the
majority of outstanding reviews and planned to have them all up-to-date by August 2017. Reviews were of
good quality and were useful and positive experiences for the foster carers. There was evidence of good

86
practice in the review process such as discussions about significant incidents and identification of learning
from these incidents. However, there was room for improvement in the process as allegations were not
always followed by a review of the foster carers. In addition, key information such as considering the views
of foster carers own children, updated Garda vetting and written updated health and safety checks of the
foster carers home were not included. The two Foster Care Committees were guided by but not fully
compliant with the standards and the national policy, procedure and best practice guidance for foster care
committees. The committees comprised a range of appropriate members who were Garda vetted. The
committees fulfilled many of their responsibilities under the standards. The committees were effective and
they made clear decisions. The committees had access to specialist advice which guided their work in
relation to medical issues relating to applicants for fostering. However, they did not approve long-term
placements or contribute to the planning of foster care services and they did not verify the supporting
documentation provided for fostering assessments. In one county the foster care committee did not have
oversight of all allegations made against foster carers. Recruitment and retention strategies were good and
the area maintained a panel of foster carers, with new foster carers coming on stream continually to replace
those that left. Despite this there were insufficient foster carers to meet the needs of the service. There was a
matching panel that met regularly to discuss requests for placements and the availability of foster carers and
to identify a match between a particular child’s needs and the foster carers capacity to meet those needs.
However, the panel of foster carers was not formally reviewed as required by the standards.
Kerry - inspection took place in May 2017
Complaints and allegations were responded to appropriately and action was taken to safeguard children when
allegations were made. Children’s safety was prioritized in the area. Allegations were investigated
appropriately, children were interviewed on their own and there was good managerial oversight of
investigations. However, allegations were not notified to the foster care committee in a timely way. Not all
foster carers were trained in line with Children First: National Guidance on the Protection and Welfare of
Children (Children First) (2011). There was no system to ensure that Garda vetting was renewed for foster
carers every three years, and was sought for all young people in foster care households when they became
adults, which posed a risk for the service. Inspectors sought an assurance in relation to this and a satisfactory
response was received. Assessments of prospective foster carers were comprehensive and the reports were of
good quality. However, there were long delays in completing the assessments of relative foster carers and a
substantial number of relative foster carers had not yet been assessed. There were gaps in the oversight of
relative placements as the preliminary reports were not signed off by both principal social workers and the
foster care committee was not notified of these placements. Preliminary checks on relative foster carers were
not always carried out in full and Garda vetting was not in place for one relative foster carer. Inspectors
sought assurances from the area manager in relation to these issues and a satisfactory response was received.
There was good practice in relation to the support provided to foster carers as all foster care households
where children were placed had allocated link social workers. Link social workers visited foster carers
regularly and provided supervision of foster carers although this was not recorded on supervision templates.
Additional supports were provided at monthly training events. There was no dedicated out-of-hours service.
There was also good practice in relation to the provision of training. All foster carers received foundational
training before their approval as foster carers and a programme of regular training events was in place. Foster
carers were kept informed about training events. Training records were well-maintained. Approximately
40% of foster carers had not had a review in over three years. The review reports were of mixed quality and
the voices of the children were not well reflected. The recommendations from reviews did not always contain
timelines for completion and there was no formal system in place for following up on the recommendations
arising from reviews in a timely manner. The foster care committee comprised a range of experienced

87
members who made clear decisions and carried out its work effectively. However, it was not fully compliant
with the Standards and national policy, procedure and best practice guidance. Garda vetting was not in place
for all committee members and the committee did not produce an annual report. There was no system in
place for the committee to track the progress of investigations of allegations. The area demonstrated a
commitment to the recruitment and retention of foster carers and there were sufficient numbers of foster
carers. Managers and staff identified that they did not have a sufficient range of foster carers to meet the
demands of the service. Foster carers tended to leave the service because the children aged out of care or
because of changes to their own family circumstances.
MidWest - inspection took place in March 2017
Allegations were not managed in line with Children First (2011). While allegations were investigated, there
were gaps in how the social work team managed them in that not all allegations were comprehensively
assessed and some were not assessed in a timely manner. There was a system for formally notifying the
foster care committee of an allegation of abuse, but not all allegations were reported to the committee and
those which were notified, were not notified in a timely way. While there was a system in order for the foster
care committee to track the progress of an investigation, this system was not in operation at the time of the
inspection. Therefore there was a lack of oversight of how these allegations were managed to ensure they
were not unduly delayed. There was a system in place but this was not in operation to ensure that all foster
care household members had been An Garda Síochána (police) vetted, which posed as a risk to children
placed in foster care. Inspectors escalated this matter to the Area Manager. In response, the Area Manager
confirmed that there were 30 foster carers who did not have evidence of Garda vetting on files and 116
members of the household aged 16 and over who did not have Garda vetting. The Area Manager provided
assurances that Garda Vetting was being processed as a matter of priority. Foster carers were trained in
Children First: National Guidance on the Protection and Welfare of Children (Children First) (2011).
Assessments of prospective foster carers were comprehensive and reports were of good quality. However,
due to shortages in staffing, assessments were not carried out within required timelines in line with
regulations and Standards. In addition, there were long delays in the completion of assessments of relative
foster carers. There were a number of relative foster carers awaiting an assessment. Due to the backlog of
relative foster carers awaiting assessments, the area had sourced private agencies to complete these
assessments. There were 17 relative foster carers waiting assessment and 11 relative foster carers undergoing
assessments at the time of the inspection. Relative carers who had not yet been assessed were allocated a link
worker in the interim, which was an example of good practice in the area. Supervision and support was not
provided to foster carers in line with Standards. 30 general foster carers and six relative foster carers did not
have an allocated social worker. There were seven foster care households without a link worker who also had
children placed without an allocated social worker, which posed a significant risk. The frequency of home
visits to these foster carers was insufficient. Inspectors requested and received written assurances that these
foster carers who were dual unallocated have now received appropriate safeguarding visits. Where foster
carers were allocated a social worker, there was not a sufficient level of home visits to ensure supervision
and support to foster carers. Records of discussions between foster carers and social workers following home
visits were of mixed quality. There were limited support groups available to foster carers in the previous 12
months to the inspection. There was no out-of-hours service available to meet the needs of foster carers.
Foster carers received foundational training before their approval as foster carers and some foster carers
undertook relevant training following their approval. There were a number of training events held throughout
the 12 months prior to the inspection. However, these training events had limited spaces and not all foster
carers attended this training. Relative carers did not always attend training following their approval. The area
maintained a central register of training attended by foster carers. However, there was limited evidence of

88
training attended maintained on foster carers’ files. The majority of reviews were not carried out in line with
standards. Furthermore, there were 32% of foster carers who had not had a review in over three years. In
some cases, foster carers had not been reviewed in a considerable number of years. As a result, foster carers’
continuing capacity to care for children placed in their care was not being assessed. For example, Garda
vetting had not been updated, training needs and health and safety assessments had not been updated.
Inspectors sought and received assurances from the Area Manager regarding a plan to address the backlog of
outstanding reviews. Reviews which had been completed had not been carried out in line with Standards and
regulations. Inspectors found that the quality of reviews was poor and were not comprehensive. For example,
An Garda Síochána (police) vetting, health and safety checks and medicals were not included and updated
for all reviews. In addition, the majority of reviews did not contain evidence that the views of the child were
sought and feedback from key professionals, such as child in care social workers, was brief. The foster care
committee was guided by but was not fully compliant with the Standards and National Policy, Procedure and
Best Practice Guidance. There was a range of members on the committee who were experienced and
knowledgeable in child care. There were three committees in the area, which were all chaired by one
chairperson to ensure standardised procedures and practices were implemented. There was evidence of the
committee making efficient and clear decisions. However, there was no formal training programme in place
for members of the committee. There was no annual review in the year prior to the inspection due to staffing
shortages and there were no quarterly reports submitted to the service in order to ensure learning and
effective oversight of the service. Furthermore, there was no system in place in order to track the progress of
investigation of allegations in order to ensure these outcomes were not unduly delayed. Some members of
the foster care committee had no updated An Garda Síochána (police) vetting and there was no effective
system in place to ensure that updated Garda vetting was sought when required. There was a lack of effective
recruitment and retention strategies. As a result, there were insufficient foster carers in the area to meet the
needs of the service and more foster carers were leaving the service than were being recruited. The foster
care panel was reviewed periodically.
Mayo- inspection took place in June 2017
Allegations and complaints were responded to appropriately and action was taken to safeguard children
when allegations were made. Children’s safety was prioritised in the area and there was a system in place
where allegations, complaints and serious concerns were recorded, managed and tracked until a final
outcome was reached. The foster care committee was informed of all allegations and complaints and there
was good management oversight. However, not all allegations were correctly classified and there was no
clear decision making process in place to decide whether an allegation reached the threshold for a statutory
response. Systems in place for obtaining An Garda Síochána (police) vetting were robust. However,
inspectors found that 11 foster carers did not have updated Garda vetting as required. The principal social
worker told inspectors that five forms were with the Garda vetting office and that the other six were with the
foster carers for completion at the time of inspection. Foster carers received training in Children First:
National Guidance for the Protection and Welfare of Children (2011) prior to their approval. While there was
Children First (2011) training provided in 2016, there was no training provided in 2014 and 2015. This was
due to the absence of a trainer of this module in the area. However, there was no oversight of foster carers
attendance at Children’s First (2011) training, therefore the area was unable to confirm whether all foster
carers had been trained in Children First. Assessments of prospective foster carers were comprehensive,
detailed and of good quality. The assessments were a comprehensive analysis of the carers’ ability to be a
foster carer and included verification of information provided. There were some delays in the completion of
a small number of assessments. There was evidence of formal supervision of foster carers as set out in the
national policy on the role of the link worker. Most foster carers received good support from their link

89
worker. Some files contained good and detailed case notes and inspectors found that all foster care files were
excellently maintained and structured, therefore information was easily accessible and well kept. Foster
carers with children with complex needs received extra support and the area had a psychologist and an
alternative care project leader who provided additional support to foster carers and the children in their care.
Not all foster carers had an allocated link social worker. Due to a member of staff leaving the team, 21 carers
did not have a link social worker, and these cases had been divided between the remainder of the team in a
caretaking capacity. However, there was no system in place to ensure that safeguarding visits took place for
these carers, and 10 of these foster carers had not received a visit by a link social worker in over six months.
In addition, not all allocated foster carers had received safeguarding visits from their link social workers in
the previous six months. A further eight allocated carers had not received a link social work visit in the last
six months, in line with national policy. This was brought to the attention of the principal social worker
during the inspection. Prior to the completion of the inspection the principal social worker provided
inspectors with a plan to ensure that all foster care visits would be completed within one month of the
inspection. Training of foster carers was a priority in the area and inspectors reviewed a comprehensive
three-year training needs analysis that the area developed in conjunction with the Child and Family Agency
(Tusla) workforce development regional training team. An ongoing programme of training was provided to
foster carers and foster carers were consulted in what training they may require. However, there was no
evidence of management oversight of the overall training attendance by foster carers in the area. Data
provided by the area showed that out of 97 foster carers in the area 33 had been reviewed in the 12 months
prior to the inspection. The reviews were comprehensive, detailed and of excellent quality. Four additional
reviews were carried out following the investigations of serious complaints and allegations. These were also
of excellent quality and the outcome was notified and tracked by the foster care committee. The foster care
committee comprised a wide range of experienced members who made clear decisions and carried out their
work effectively. However, it was not fully compliant with the standards and national policy, procedures and
best practice. The foster care panel did not have all the information required by national policy. Some foster
care committee members did not have updated Garda vetting. The chair of the foster care committee told
inspectors that the forms were with the Garda vetting office at the time of the inspection. The area had a
formal recruitment strategy in place and a demonstrated commitment to the retention of foster carers.
However, the area did not have a formal retention strategy. While there was a sufficient number of foster
carers, managers and staff identified that they did not have a sufficient range of foster carers to meet the
needs of children coming into care. Exit interviews were conducted and foster carers tended to leave because
the children aged out of care or returned to their families.
SUMMARY OF FINDINGS - RESIDENTIAL SERVICES
REPORTS PUBLISHED Q3 2017
OSV-0004161 (DML) - inspection took place in April 2017
Young people were well-cared for by staff. All young people had up-to-date care plans and placement plans.
Care plans addressed the identified needs of young people and placement plans set out how these needs
would be met by staff on a day to day basis. However, a small number of actions from care plans were not
reflected in placement plans. Leaving care and after care planning required improvement. There were delays
in appointing all young people an aftercare worker and this meant that leaving care plans were not fully
developed at the time of the inspection. Some of the young people expressed concerns about leaving care and
said that they did not know what supports would be in place for them when the time came. Young people
were supported to have regular contact with family and friends, in line with their wishes and care plans.

90
Child protection concerns were well managed in the centre. Staff were trained in Children First (2011) and
although not all had refresher training at the time of the inspection, this was scheduled. Staff were
emotionally supportive of young people and were proactive in their management of behaviour that
challenged. Practices related to the management of absences from the centre were not fully in line with
national policy. There were improved governance and management systems in the centre since the last
inspection. However, further improvements were required in relation to ensuring the centre operated within
its stated purpose and function, and managing risk. The staff team was qualified and experienced. The centre
had assessed the training needs of the staff team, and although there was a training programme in place, the
staff team was not trained in national policy related to managing risk or the administration of medication.
Young people told inspectors that they got on well with staff and most young people liked living in the
centre. Those that met with inspectors said that they felt listened to, could talk to staff if they had any
concerns and that they were aware of their rights. However, some young people told inspectors that they
were unhappy with their clothing allowance.
OSV-0004176 (DNE) - inspection took place in May 2017
This centre was last inspected in August 2016 (monitoring event 17964) when a follow-up inspection took
place subsequent to a full inspection in January 2016 (monitoring event 16942). At the time of the last
inspection improvements were required in relation to complaints management, medication management and
risk management systems. While this inspection found that improvements had been made in relation to
medication management and risk management practices improvements were still required in relation to the
availability of a national medication management policy and the management of complaints. Children told
inspectors they were happy that the house had been redecorated. While not all of the children were happy to
be living in the centre they identified staff members that they would speak to if they had a concern. Children
also told inspectors that they did not always feel listened to. The house had recently undergone some
significant refurbishment and painting and presented as clean and homely. Overall the staff team provided
good quality care to the three children living in the centre. In general, children were safe and their rights
were respected and promoted. The children had opportunities to engage in interests similar to their peers. All
of the children had an allocated social worker and an up-to-date care plan in place. Two of the young people
were being supported to complete their leaving certificate with additional supports including grinds but one
of the children was not attending an educational placement. While one of the young people had an aftercare
plan in place the other young person did not. The service was managed by an experienced centre manager
who was well supported by an experienced team of social care leaders and social care workers. Some
management systems required improvement including the development of a national suite of policies and
procedures to guide staff, monitoring and oversight arrangements and responses to escalated risks. There was
good quality supervision taking place. However, not all of the staff had received the required mandatory
training including refresher children first training, medication management and behavior management.
OSV-0004178 (DNE) - inspection took place in June 2017
Children presented as comfortable in their surroundings and at ease with the staff team. Children told
inspectors that living in the centre was fine. They interacted with members of staff as they want about their
daily activities throughout the course of the inspection. Children were supported and encouraged in all
aspects of their lives by the staff team. There was a relaxed and calm atmosphere in the centre which
reflected the caring and nurturing approach of the staff team. Children's rights were respected and promoted
and complaints were well managed. Children attended school or training programmes and this was
encouraged and facilitated by the staff team. The staff team were respectful in their interactions with the
children and encouraged them in all their endeavours. However, not all of the young people were utilising

91
their placement or engaging with the programmes and supports available to them. Staff worked with children
to support them to be safe and to take responsibility for their own safety outside of the centre. However,
children did leave the centre without permission and some of the children's behavior placed them at risk.
Plans to support children around this behaviour had not resulted in a reduction of incidents. There was a
good management structure in place and managers provided good leadership to the staff team. However
some management systems required improvement, for example policies were out of date, not all risks were
effectively managed and some monitoring and oversight arrangements were not always effective. The staff
team were experienced and there was good teamwork between them. Areas for improvement included the
statement of purpose, admissions and discharges not always being in line with children's care plans and
discharges were not always reflective of child-centred practice. Improvements were also required to ensure
that training was available to continually up-skill staff in meeting the needs of children currently placed.
OSV-0004177 (DNE) - inspection took place in May 2017
Children had a good quality of life. At the time of the inspection, there were four children placed in the
centre. Staff acted as positive role models to children and inspectors observed warm and respectful
interactions between children and staff. Children told inspectors that they liked living in the centre and that
their lives had improved since their admission. Parents and social workers also told inspectors that the staff
team were very committed and supportive of the children. Children's rights were respected and promoted and
complaints were well managed. All children had an allocated social worker. However, not all children had an
up-to-date care plan in the centre. This was highlighted to the Centre Manager and an up-to-date care plan
was subsequently provided to the centre by the allocated social worker. The quality of emotional and
physical care provided to children was good. Children were referred to and attending specialist services. The
staff team provided emotional support to children and staff were trained in specialised areas in order to
support children with complex needs. All children were attending educational programmes and the staff team
encouraged and supported children to attend their educational placements. Parents also told inspectors that
the staff team supported children to reach positive educational outcomes. Young people's access to an
aftercare service had been delayed. Three of the young people were eligible for aftercare services. However,
there was a delay in all of these young people receiving an aftercare service. One young person was due to
leave the centre in the coming months, however there was no clear plan in place for this young person. A
young person told inspectors that there were concerned about the lack of certainty about their onward
placements. Following the inspection, inspectors requested assurances from the Area Manager that an
appropriate onward placement would be identified as a matter of priority and that an appropriate transition
plan would be put in place for this young person. Safeguarding practices were effective in keeping children
safe. All children had an allocated social worker. The staff team responded appropriately to ensure that
children were safeguarded. The staff team worked closely with all relevant professionals when required and
safety plans were in place to reduce any risks to young people. There was a good management structure in
place and managers provided good leadership to the staff team. However, monitoring and oversight
mechanisms required improvement in order to assess the quality of the service provided. The staff team were
experienced and qualified. There were some gaps in mandatory training.
OSV-0004650 (South) - inspection took place in May 2017
HIQA last carried out an unannounced, full inspection of the campus in August 2016 (Monitoring event
number 0017923). At that time significant failings were found in relation to the care of young people,
safeguarding, premises and safety and management and staffing. These issues were escalated to senior
managers within Tusla who committed to implementing a number of actions to address these deficits. HIQA

92
carried out an unannounced follow-up inspection in December 2016 (Monitoring event number 0018200). At
this time, inspectors found that insufficient progress had been made to improve the care practices within the
campus. These concerns and other issues relating to behaviour management, institutional care practices and
the lack of timely progress were escalated to the senior managers within Tusla's national office following the
inspection. In response, an oversight group, consisting of national, regional and local managers from Tusla,
was established to coordinate the response to the management of the campus and ensure timely
implementation of the action plans over a six-month period. At the time of this announced, full inspection, a
strategic review of the service was underway and a number of proposals as to the future of the service were
being discussed with the chief operations officer. In the interim, the campus remained closed to admissions.
Children who spoke with inspectors gave mixed feedback on what it was like to live in the campus. Some
liked living there while others did not want to. Some said they had good relationships with staff and could go
to them if feeling down. Children said they wanted to eat their meals in each of the units and not in the
canteen. Children's basic care and healthcare needs were being met. Each child had an allocated social
worker and had up-to-date child-in-care reviews. However, not all children's care plans reflected their current
needs or circumstances so were not up to date. Inspectors found there had been improvements in some areas
such as the notification of child protection concerns, some safeguarding arrangements and in some responses
to children engaging in risk behaviour. However, in other areas, progress continued to be slow and some of
the children continued to engage in risk-taking behaviours. A full review of care practices in the campus to
ensure they were safe had not been completed. Staff in the campus were not able to ensure safe use of mobile
phones for all young people. An external independent consultant had been engaged to reflect on principles
and practices underpinning modern service provision with management and staff. However, progress in
relation to changing how campus staff responded to children's behaviour that challenges was not timely and
inspectors found staff were not clear on the approach to take to promote positive behaviour and discourage
negative behaviour. This impacted on some children who did not have healthy routines to their days. In
addition, there had been little change to the practice of eating meals in the canteen which was institutional. In
relation to the governance and management of the centre, there had been changes to the management
structure and personnel within the campus since the last inspection. While the revised structure provided
clear lines of authority, accountability arrangements were not sufficient as managers were not always held to
account. The oversight group was to meet monthly and provide an update report to the Chief Operations
Officer and to HIQA. In addition, the Tusla monitoring service had committed to a plan to monitor the
campus and service-delivery improvements. This was to be completed through monthly 'verification visits' to
the campus by two monitoring officers for a six month period beginning in November 2016. The oversight
group had not been effective at monitoring the progress of changes on the campus, verifying that the changes
had been completed and ensuring identified actions to address previously identified deficits were
implemented in a timely manner. Of the 20 actions that had been identified following the last inspection, 19
should have been implemented at the time of the inspection. Inspectors found that 13 had been completed,
four were delayed and two had not commenced. A number of management systems, including risk
management and monitoring and oversight remained poor.