Embed Size (px)
Citation preview
Webcast Presentation – October 26, 2017
Q3 2017 Earnings
2 Q3 Earnings Webcast 10/26/17
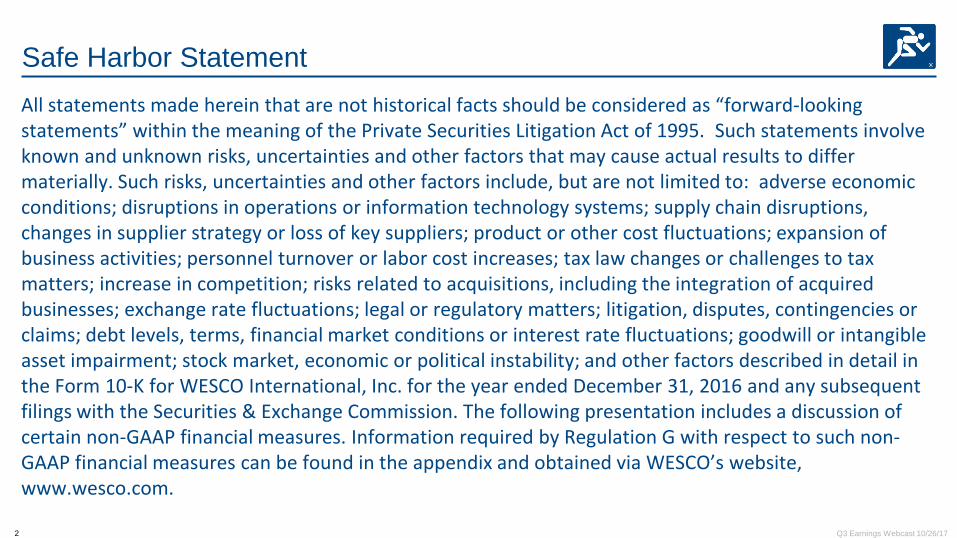
Safe Harbor Statement All statements made herein that are not historical facts should be considered as “forward-looking statements” within the meaning of the Private Securities Litigation Act of 1995. Such statements involve known and unknown risks, uncertainties and other factors that may cause actual results to differ materially. Such risks, uncertainties and other factors include, but are not limited to: adverse economic conditions; disruptions in operations or information technology systems; supply chain disruptions, changes in supplier strategy or loss of key suppliers; product or other cost fluctuations; expansion of business activities; personnel turnover or labor cost increases; tax law changes or challenges to tax matters; increase in competition; risks related to acquisitions, including the integration of acquired businesses; exchange rate fluctuations; legal or regulatory matters; litigation, disputes, contingencies or claims; debt levels, terms, financial market conditions or interest rate fluctuations; goodwill or intangible asset impairment; stock market, economic or political instability; and other factors described in detail in the Form 10-K for WESCO International, Inc. for the year ended December 31, 2016 and any subsequent filings with the Securities & Exchange Commission. The following presentation includes a discussion of certain non-GAAP financial measures. Information required by Regulation G with respect to such non-GAAP financial measures can be found in the appendix and obtained via WESCO’s website, www.wesco.com.
3 Q3 Earnings Webcast 10/26/17
Q3 2017 Highlights
…performance exceeded outlook
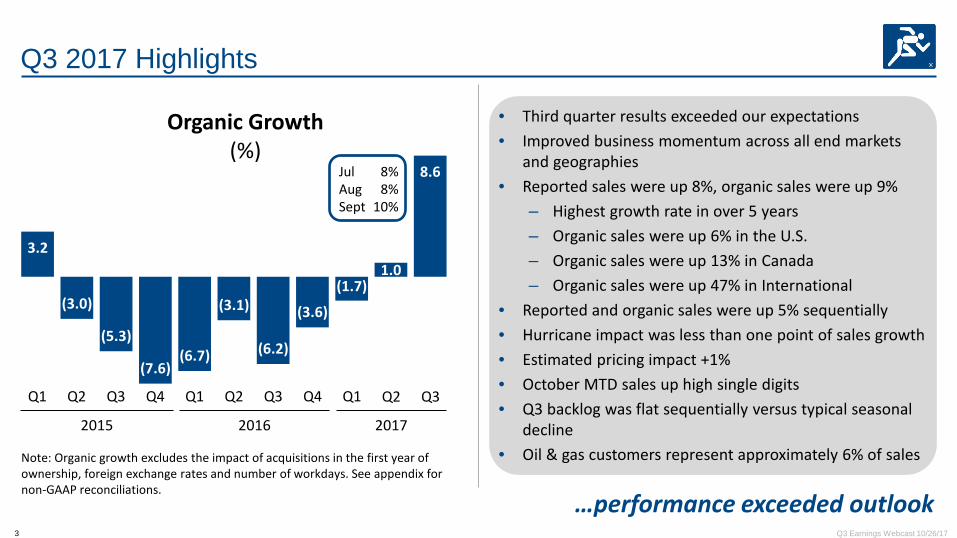
• Third quarter results exceeded our expectations • Improved business momentum across all end markets
and geographies • Reported sales were up 8%, organic sales were up 9%
‒ Highest growth rate in over 5 years ‒ Organic sales were up 6% in the U.S. ‒ Organic sales were up 13% in Canada ‒ Organic sales were up 47% in International
• Reported and organic sales were up 5% sequentially • Hurricane impact was less than one point of sales growth • Estimated pricing impact +1% • October MTD sales up high single digits • Q3 backlog was flat sequentially versus typical seasonal
decline • Oil & gas customers represent approximately 6% of sales
3.2
(3.0)
(5.3)
(7.6) (6.7)
(3.1)
(6.2)
(3.6)
(1.7) 1.0
8.6
Organic Growth (%)
Jul 8% Aug 8% Sept 10%
Note: Organic growth excludes the impact of acquisitions in the first year of ownership, foreign exchange rates and number of workdays. See appendix for non-GAAP reconciliations.
Q1 Q2 Q3 Q4
2015
Q1
2016
Q2 Q3 Q4 Q1
2017
Q2 Q3
4 Q3 Earnings Webcast 10/26/17
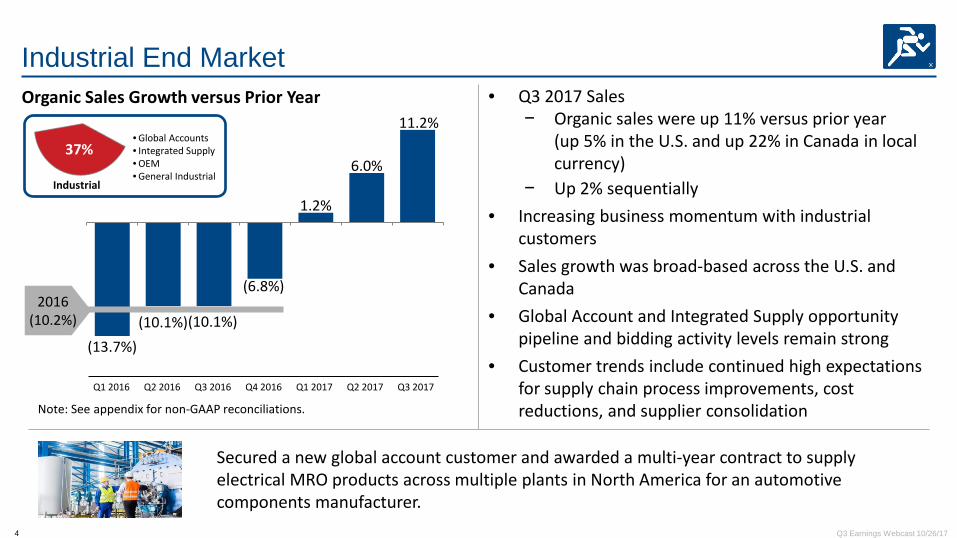
Industrial End Market • Q3 2017 Sales
− Organic sales were up 11% versus prior year (up 5% in the U.S. and up 22% in Canada in local currency)
− Up 2% sequentially • Increasing business momentum with industrial
customers • Sales growth was broad-based across the U.S. and
Canada • Global Account and Integrated Supply opportunity
pipeline and bidding activity levels remain strong • Customer trends include continued high expectations
for supply chain process improvements, cost reductions, and supplier consolidation
Organic Sales Growth versus Prior Year
37%
Industrial
• Global Accounts • Integrated Supply • OEM • General Industrial
Secured a new global account customer and awarded a multi-year contract to supply electrical MRO products across multiple plants in North America for an automotive components manufacturer.
Note: See appendix for non-GAAP reconciliations.
(13.7%) (10.1%) (10.1%)
(6.8%)
1.2%
6.0%
11.2%
Q3 2016 Q2 2016 Q1 2016
2016 (10.2%)
Q4 2016 Q1 2017
Q2 2017 Q3 2017
5 Q3 Earnings Webcast 10/26/17
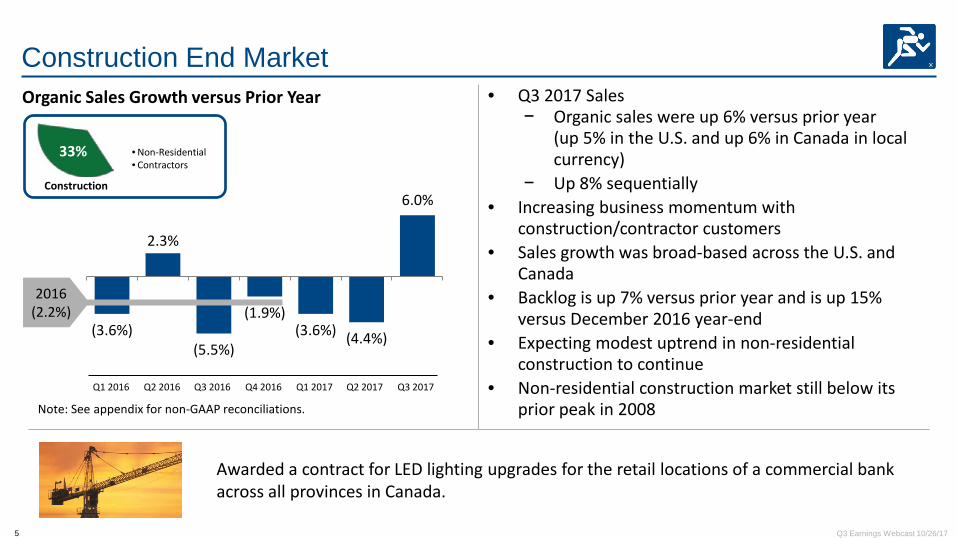
(3.6%)
2.3%
(5.5%)
(1.9%) (3.6%) (4.4%)
6.0%
• Q3 2017 Sales − Organic sales were up 6% versus prior year
(up 5% in the U.S. and up 6% in Canada in local currency)
− Up 8% sequentially • Increasing business momentum with
construction/contractor customers • Sales growth was broad-based across the U.S. and
Canada • Backlog is up 7% versus prior year and is up 15%
versus December 2016 year-end • Expecting modest uptrend in non-residential
construction to continue • Non-residential construction market still below its
prior peak in 2008
• Non-Residential • Contractors
Construction
33%
Organic Sales Growth versus Prior Year
Construction End Market
Awarded a contract for LED lighting upgrades for the retail locations of a commercial bank across all provinces in Canada.
Note: See appendix for non-GAAP reconciliations.
Q2 2016 Q1 2016 Q3 2016 Q4 2016
2016 (2.2%)
Q1 2017 Q2 2017 Q3 2017
6 Q3 Earnings Webcast 10/26/17
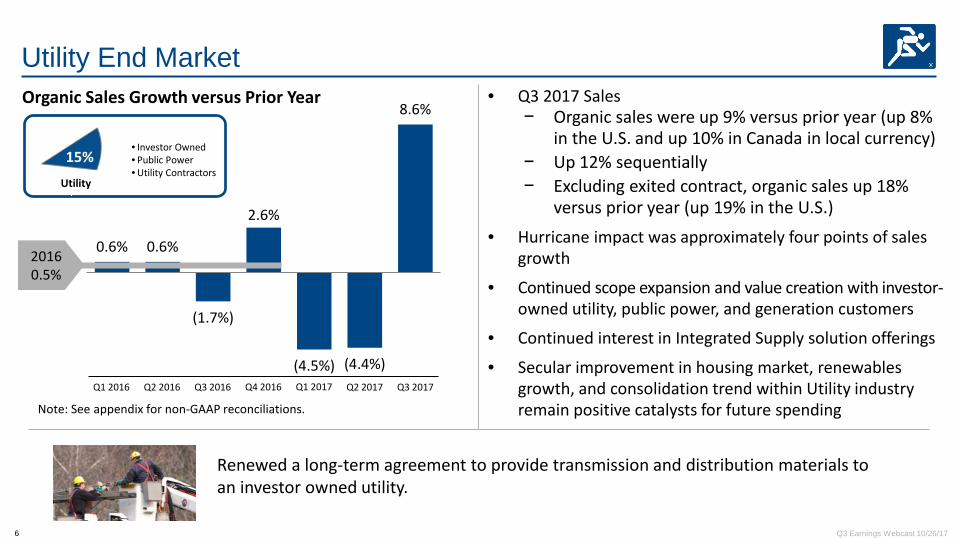
Utility End Market Organic Sales Growth versus Prior Year
15% Utility
• Investor Owned • Public Power • Utility Contractors
• Q3 2017 Sales − Organic sales were up 9% versus prior year (up 8%
in the U.S. and up 10% in Canada in local currency) − Up 12% sequentially − Excluding exited contract, organic sales up 18%
versus prior year (up 19% in the U.S.) • Hurricane impact was approximately four points of sales
growth
• Continued scope expansion and value creation with investor-owned utility, public power, and generation customers
• Continued interest in Integrated Supply solution offerings
• Secular improvement in housing market, renewables growth, and consolidation trend within Utility industry remain positive catalysts for future spending
Renewed a long-term agreement to provide transmission and distribution materials to an investor owned utility.
0.6% 0.6%
(1.7%)
2.6%
(4.5%) (4.4%)
8.6%
2016 0.5%
Q3 2016 Q2 2016 Q1 2016 Q4 2016 Q1 2017 Q2 2017 Q3 2017
Note: See appendix for non-GAAP reconciliations.
7 Q3 Earnings Webcast 10/26/17
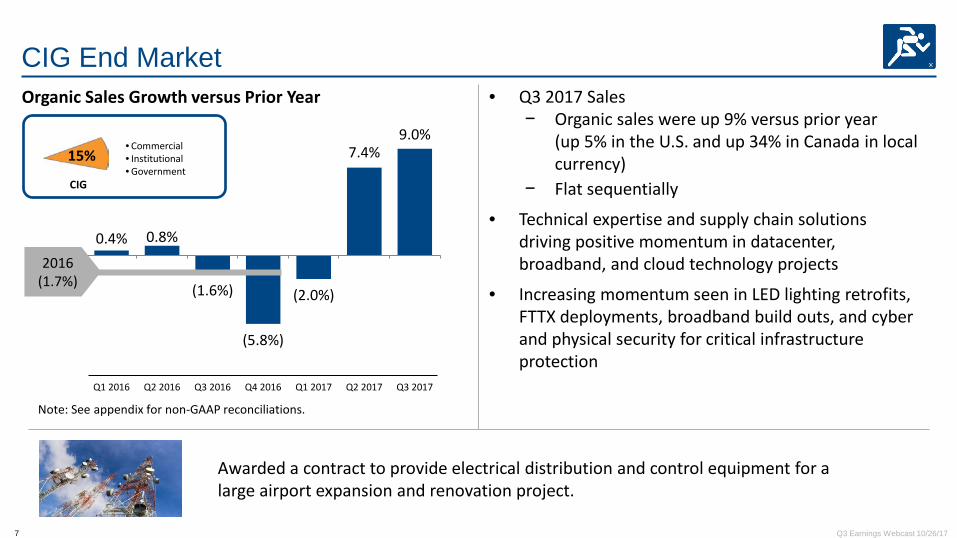
CIG End Market • Q3 2017 Sales
− Organic sales were up 9% versus prior year (up 5% in the U.S. and up 34% in Canada in local currency)
− Flat sequentially
• Technical expertise and supply chain solutions driving positive momentum in datacenter, broadband, and cloud technology projects
• Increasing momentum seen in LED lighting retrofits, FTTX deployments, broadband build outs, and cyber and physical security for critical infrastructure protection
Organic Sales Growth versus Prior Year
CIG
• Commercial • Institutional • Government
15%
Awarded a contract to provide electrical distribution and control equipment for a large airport expansion and renovation project.
Note: See appendix for non-GAAP reconciliations.
0.4% 0.8%
(1.6%)
(5.8%)
(2.0%)
7.4% 9.0%
Q1 2016 Q2 2016 Q3 2016 Q4 2016 Q1 2017 Q2 2017 Q3 2017
2016 (1.7%)
8 Q3 Earnings Webcast 10/26/17
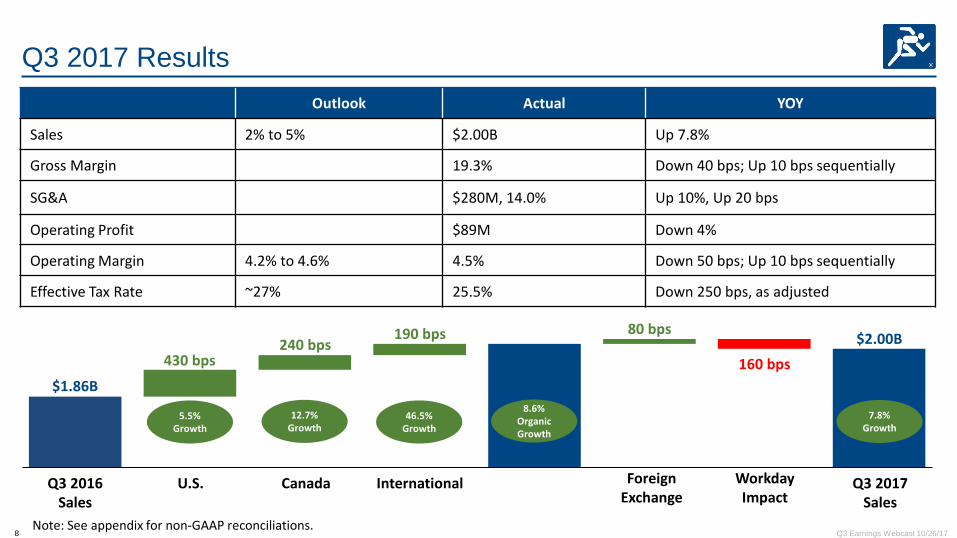
Q3 2017 Results
Outlook Actual YOY
Sales 2% to 5% $2.00B Up 7.8%
Gross Margin 19.3% Down 40 bps; Up 10 bps sequentially
SG&A $280M, 14.0% Up 10%, Up 20 bps
Operating Profit $89M Down 4%
Operating Margin 4.2% to 4.6% 4.5% Down 50 bps; Up 10 bps sequentially
Effective Tax Rate ~27% 25.5% Down 250 bps, as adjusted
5.5% Growth
240 bps 430 bps
$2.00B
$1.86B
Q3 2017 Sales
International Canada U.S. Q3 2016 Sales
160 bps
12.7% Growth
46.5% Growth
8.6% Organic Growth
7.8% Growth
Note: See appendix for non-GAAP reconciliations.
Foreign Exchange
80 bps
Workday Impact
190 bps
9 Q3 Earnings Webcast 10/26/17
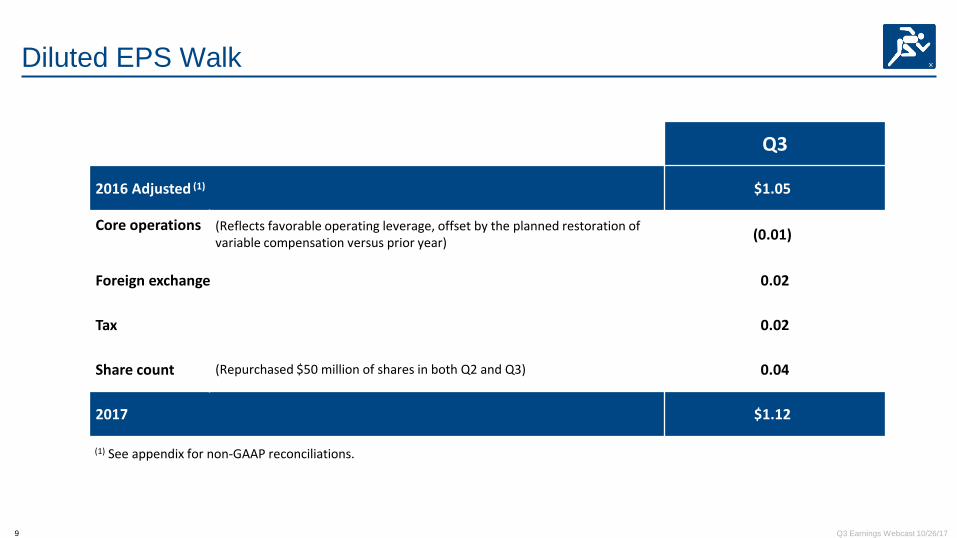
Diluted EPS Walk
Q3
2016 Adjusted (1) $1.05)
Core operations
(Reflects favorable operating leverage, offset by the planned restoration of variable compensation versus prior year) (0.01))
Foreign exchange 0.02
Tax 0.02
Share count (Repurchased $50 million of shares in both Q2 and Q3) 0.04
2017 $1.12)
(1) See appendix for non-GAAP reconciliations.
10 Q3 Earnings Webcast 10/26/17
1.5
2
2.5
3
3.5
4
Q1 Q2 Q3 Q4 Q1 Q2 Q3 Q4 Q1 Q2 Q3
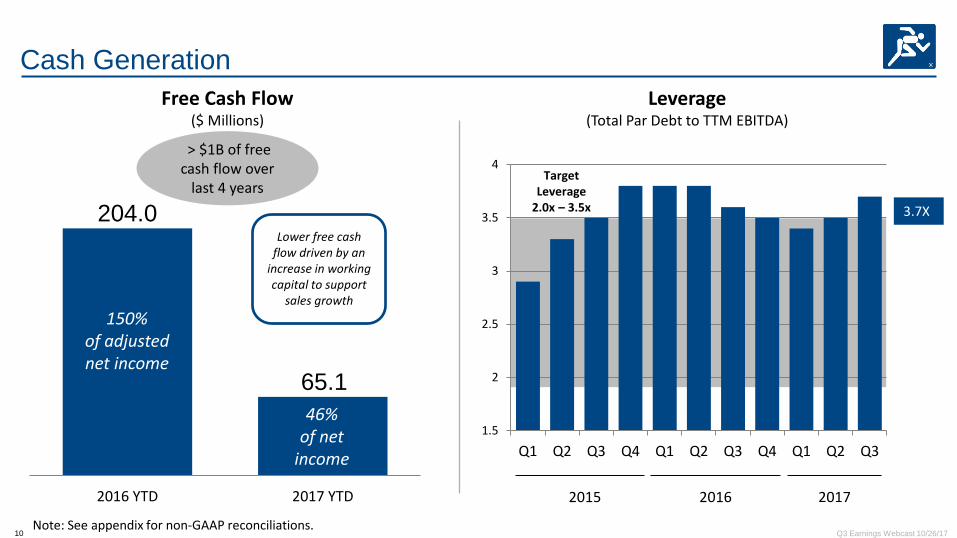
Cash Generation
204.0
65.1
2016 YTD 2017 YTD
Free Cash Flow
($ Millions)
Note: See appendix for non-GAAP reconciliations.
46% of net
income
150%
of adjusted net income
> $1B of free cash flow over
last 4 years Target
Leverage 2.0x – 3.5x 3.7X
Leverage (Total Par Debt to TTM EBITDA)
2015 2016 2017
Lower free cash flow driven by an
increase in working capital to support
sales growth
11 Q3 Earnings Webcast 10/26/17
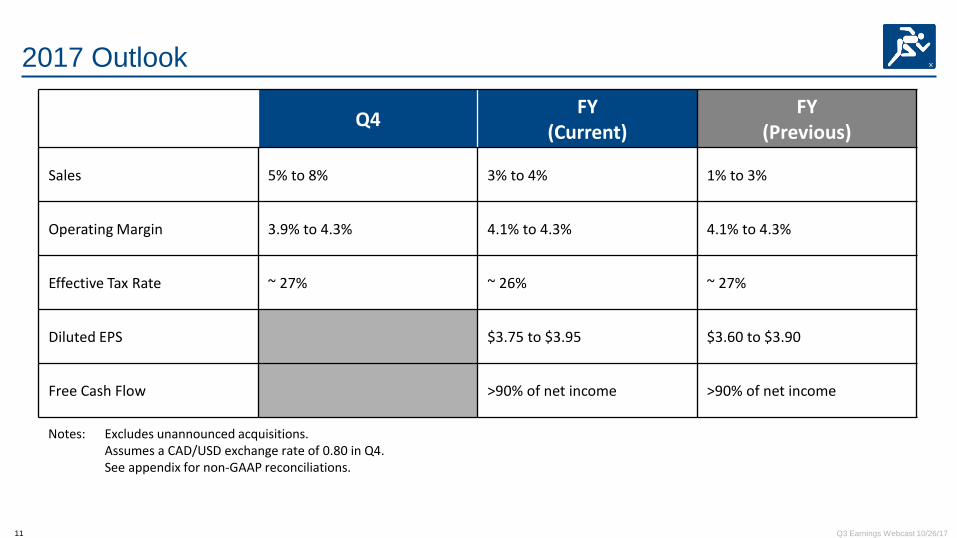
2017 Outlook
Q4 FY (Current)
FY (Previous)
Sales 5% to 8% 3% to 4% 1% to 3%
Operating Margin 3.9% to 4.3% 4.1% to 4.3% 4.1% to 4.3%
Effective Tax Rate ~ 27% ~ 26% ~ 27%
Diluted EPS $3.75 to $3.95 $3.60 to $3.90
Free Cash Flow >90% of net income >90% of net income
Notes: Excludes unannounced acquisitions. Assumes a CAD/USD exchange rate of 0.80 in Q4. See appendix for non-GAAP reconciliations.
12 Q3 Earnings Webcast 10/26/17
Appendix
NON-GAAP FINANCIAL MEASURES This presentation includes certain non-GAAP financial measures. These financial measures include organic sales growth, gross profit, financial leverage, free cash flow, adjusted net income and adjusted earnings per diluted share. The Company believes that these non-GAAP measures are useful to investors as they provide a better understanding of sales performance, the use of debt and liquidity on a comparable basis. Additionally, certain of the aforementioned non-GAAP measures either focus on or exclude transactions impacting comparability of results, allowing investors to more easily compare the Company’s financial performance from period to period. Management does not use these non-GAAP financial measures for any purpose other than the reasons stated above.
13 Q3 Earnings Webcast 10/26/17
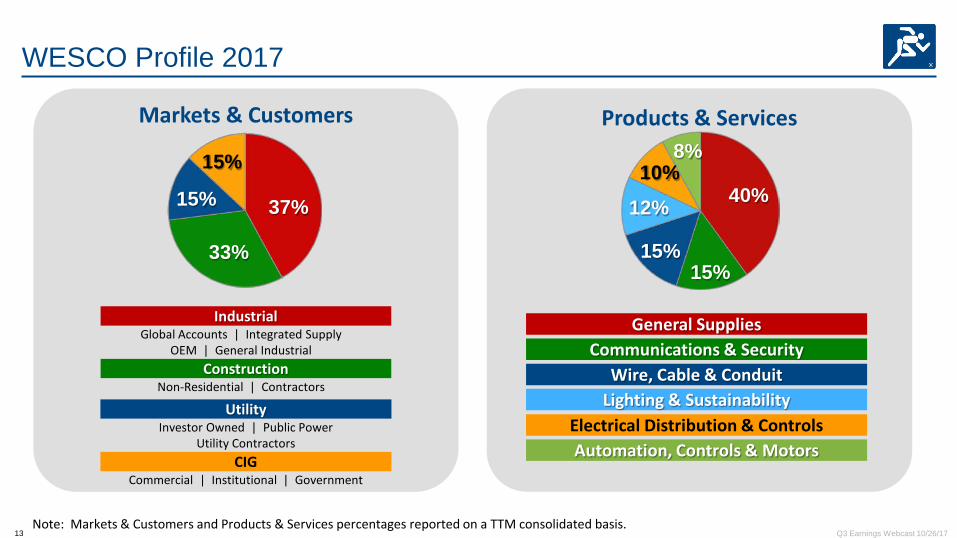
WESCO Profile 2017
37%
33%
15%
15% 40%
15% 15%
12%
10% 8%
Note: Markets & Customers and Products & Services percentages reported on a TTM consolidated basis.
Products & Services Markets & Customers
Utility
CIG
Industrial
Construction
Investor Owned | Public Power Utility Contractors
Commercial | Institutional | Government
Global Accounts | Integrated Supply OEM | General Industrial
Non-Residential | Contractors
Automation, Controls & Motors
Lighting & Sustainability
General Supplies Communications & Security
Wire, Cable & Conduit
Electrical Distribution & Controls
14 Q3 Earnings Webcast 10/26/17
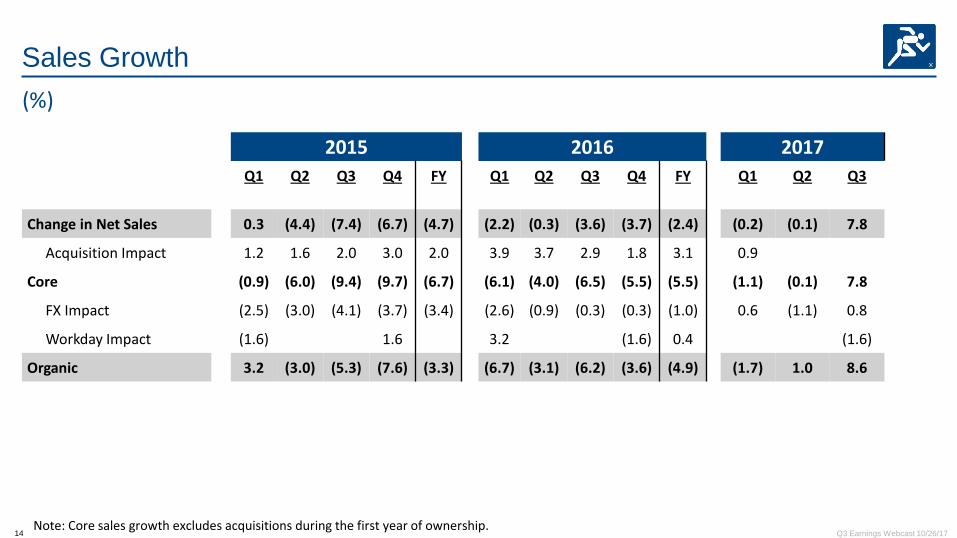
Sales Growth
2015 2016 2017 Q1 Q2 Q3 Q4 FY Q1 Q2 Q3 Q4 FY Q1 Q2 Q3
Change in Net Sales 0.3 (4.4) (7.4) (6.7) (4.7) (2.2) (0.3) (3.6) (3.7) (2.4) (0.2) (0.1) 7.8
Acquisition Impact 1.2 1.6 2.0 3.0 2.0 3.9 3.7 2.9 1.8 3.1 0.9
Core (0.9) (6.0) (9.4) (9.7) (6.7) (6.1) (4.0) (6.5) (5.5) (5.5) (1.1) (0.1) 7.8
FX Impact (2.5) (3.0) (4.1) (3.7) (3.4) (2.6) (0.9) (0.3) (0.3) (1.0) 0.6 (1.1) 0.8
Workday Impact (1.6) 1.6 3.2 (1.6) 0.4 (1.6)
Organic 3.2 (3.0) (5.3) (7.6) (3.3) (6.7) (3.1) (6.2) (3.6) (4.9) (1.7) 1.0 8.6
(%)
Note: Core sales growth excludes acquisitions during the first year of ownership.
15 Q3 Earnings Webcast 10/26/17
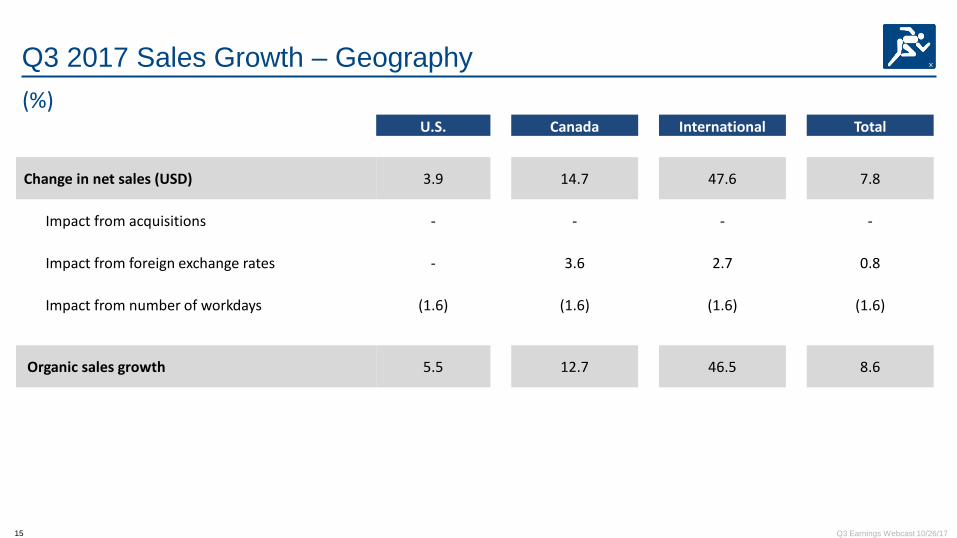
Q3 2017 Sales Growth – Geography
U.S. Canada International Total
Change in net sales (USD) 3.9 14.7 47.6 7.8
Impact from acquisitions - - - -
Impact from foreign exchange rates - 3.6 2.7 0.8
Impact from number of workdays (1.6) (1.6) (1.6) (1.6)
Organic sales growth 5.5 12.7 46.5 8.6
(%)
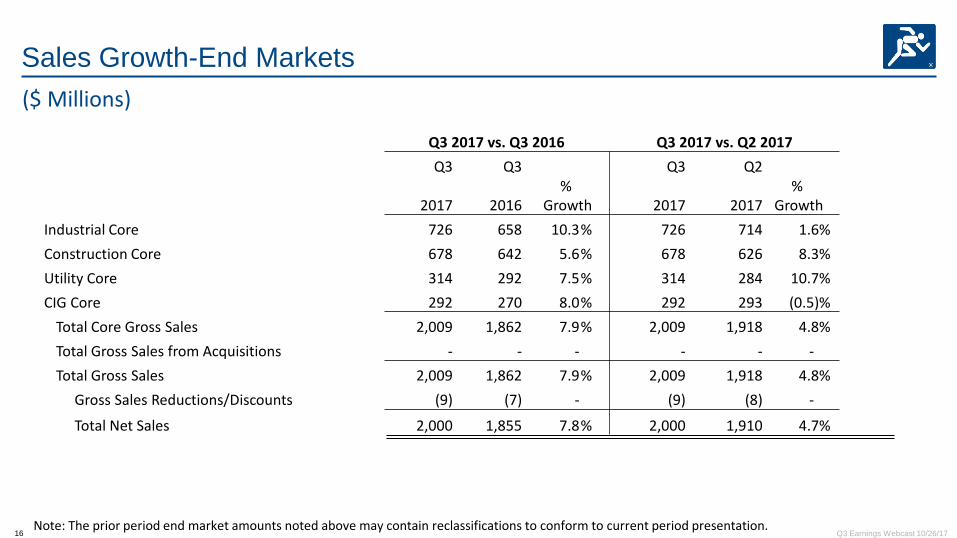
16 Q3 Earnings Webcast 10/26/17 Note: The prior period end market amounts noted above may contain reclassifications to conform to current period presentation.
($ Millions)
Sales Growth-End Markets
Q3 2017 vs. Q3 2016 Q3 2017 vs. Q2 2017 Q3 Q3 Q3 Q2
2017 2016 %
Growth 2017 2017 %
Growth Industrial Core 726 658 10.3 % 726 714 1.6% Construction Core 678 642 5.6 % 678 626 8.3% Utility Core 314 292 7.5 % 314 284 10.7% CIG Core 292 270 8.0 % 292 293 (0.5)%
Total Core Gross Sales 2,009 1,862 7.9 % 2,009 1,918 4.8% Total Gross Sales from Acquisitions - - - - - -00 Total Gross Sales 2,009 1,862 7.9 % 2,009 1,918 4.8%
Gross Sales Reductions/Discounts (9) (7) - (9) (8) -00
Total Net Sales 2,000 1,855 7.8 % 2,000 1,910 4.7%
17 Q3 Earnings Webcast 10/26/17
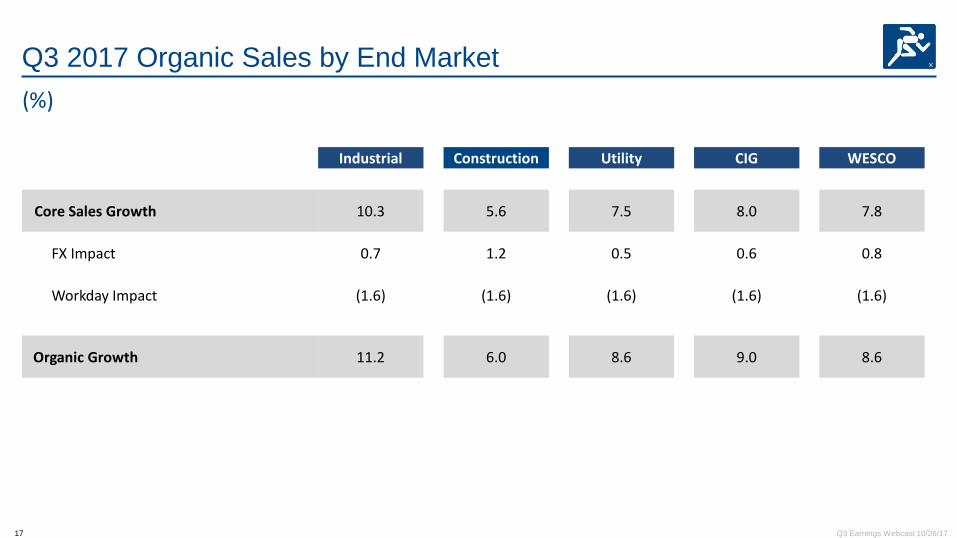
Q3 2017 Organic Sales by End Market
Industrial Construction Utility CIG WESCO
Core Sales Growth 10.3 5.6 7.5 8.0 7.8
FX Impact 0.7 1.2 0.5 0.6 0.8
Workday Impact (1.6) (1.6) (1.6) (1.6) (1.6)
Organic Growth 11.2 6.0 8.6 9.0 8.6
(%)
18 Q3 Earnings Webcast 10/26/17
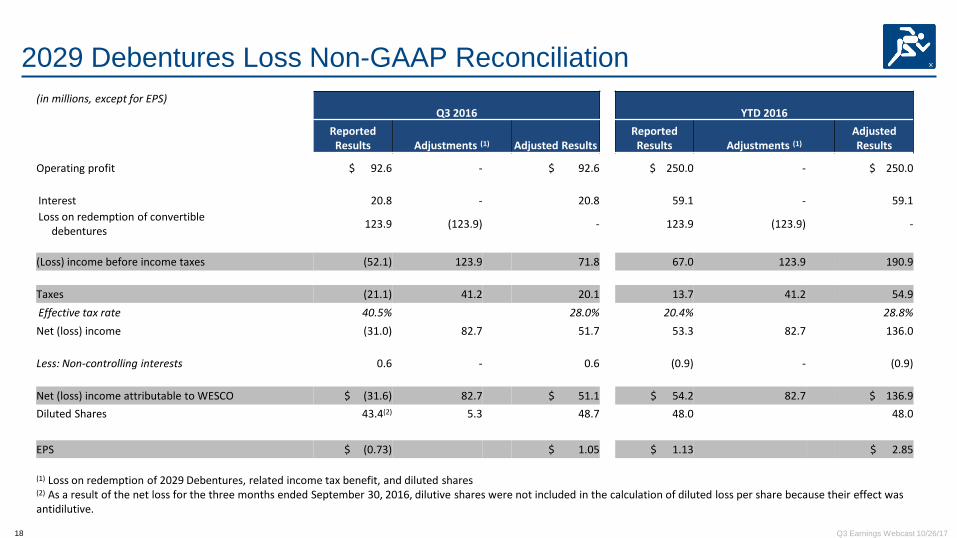
2029 Debentures Loss Non-GAAP Reconciliation (in millions, except for EPS) Q3 2016 YTD 2016
Reported Results Adjustments (1) Adjusted Results
Reported Results Adjustments (1)
Adjusted Results
Operating profit $ 92.6 - $ 92.6 $ 250.0 - $ 250.0
Interest 20.8 - 20.8 59.1 - 59.1 Loss on redemption of convertible debentures 123.9 (123.9) - 123.9 (123.9) -
(Loss) income before income taxes (52.1) 123.9 71.8 67.0 123.9 190.9
Taxes (21.1) 41.2 20.1 13.7 41.2 54.9 Effective tax rate 40.5% 28.0% 20.4% 28.8% Net (loss) income (31.0) 82.7 51.7 53.3 82.7 136.0
Less: Non-controlling interests 0.6 - 0.6 (0.9) - (0.9)
Net (loss) income attributable to WESCO $ (31.6) 82.7 $ 51.1 $ 54.2 82.7 $ 136.9 Diluted Shares 43.4(2) 5.3 48.7 48.0 48.0
EPS $ (0.73) $ 1.05 $ 1.13 $ 2.85
(1) Loss on redemption of 2029 Debentures, related income tax benefit, and diluted shares (2) As a result of the net loss for the three months ended September 30, 2016, dilutive shares were not included in the calculation of diluted loss per share because their effect was antidilutive.
19 Q3 Earnings Webcast 10/26/17
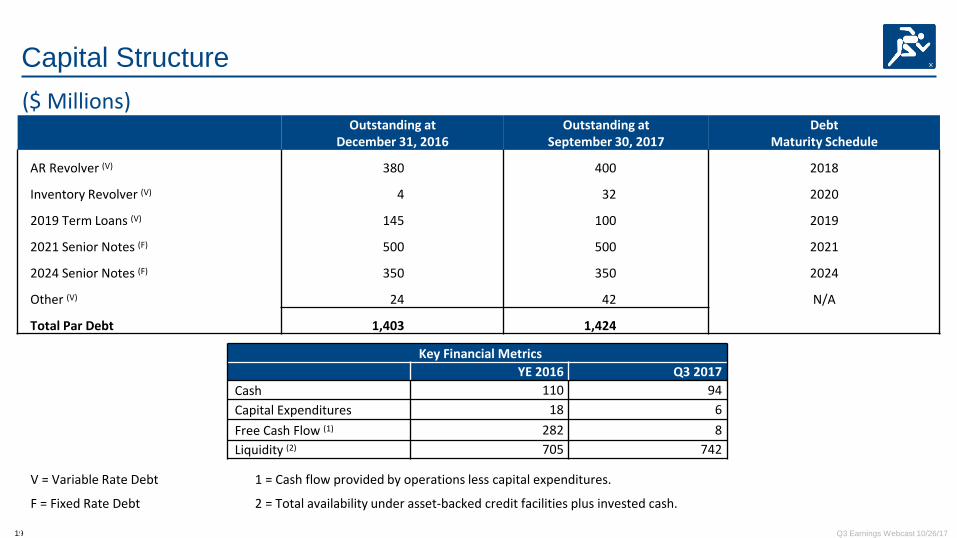
Outstanding at
December 31, 2016 Outstanding at
September 30, 2017 Debt
Maturity Schedule
AR Revolver (V) 380 400 2018
Inventory Revolver (V) 4 32 2020
2019 Term Loans (V) 145 100 2019
2021 Senior Notes (F) 500 500 2021
2024 Senior Notes (F) 350 350 2024
Other (V) 24 42 N/A
Total Par Debt 1,403 1,424
Capital Structure
Key Financial Metrics
YE 2016 Q3 2017 Cash 110 94 Capital Expenditures 18 6 Free Cash Flow (1) 282 8 Liquidity (2) 705 742
($ Millions)
V = Variable Rate Debt 1 = Cash flow provided by operations less capital expenditures.
F = Fixed Rate Debt 2 = Total availability under asset-backed credit facilities plus invested cash.
20 Q3 Earnings Webcast 10/26/17
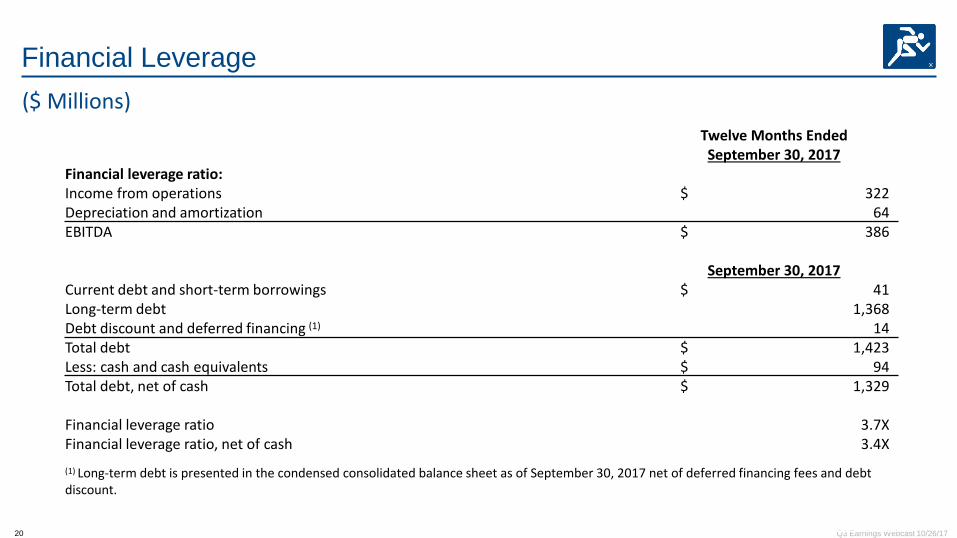
Financial Leverage
Twelve Months Ended September 30, 2017
Financial leverage ratio: Income from operations $ 322 Depreciation and amortization 64 EBITDA $ 386
September 30, 2017 Current debt and short-term borrowings $ 41 Long-term debt 1,368 Debt discount and deferred financing (1) 14 Total debt $ 1,423 Less: cash and cash equivalents $ 94 Total debt, net of cash $ 1,329
Financial leverage ratio 3.7X Financial leverage ratio, net of cash 3.4X
(1) Long-term debt is presented in the condensed consolidated balance sheet as of September 30, 2017 net of deferred financing fees and debt discount.
($ Millions)
21 Q3 Earnings Webcast 10/26/17
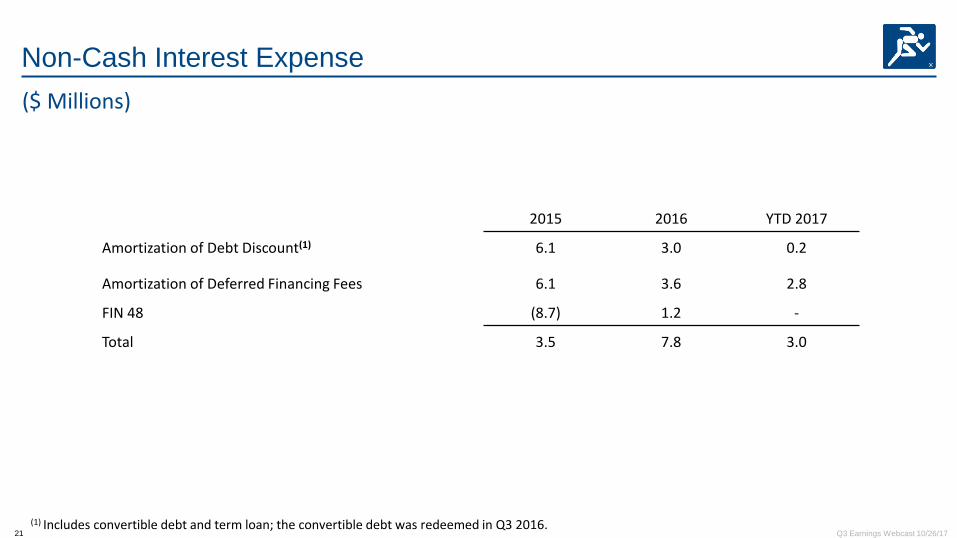
2015 2016 YTD 2017
Amortization of Debt Discount(1) 6.1 3.0 0.2
Amortization of Deferred Financing Fees 6.1 3.6 2.8
FIN 48 (8.7) 1.2 -
Total 3.5 7.8 3.0
Non-Cash Interest Expense
(1) Includes convertible debt and term loan; the convertible debt was redeemed in Q3 2016.
($ Millions)
22 Q3 Earnings Webcast 10/26/17
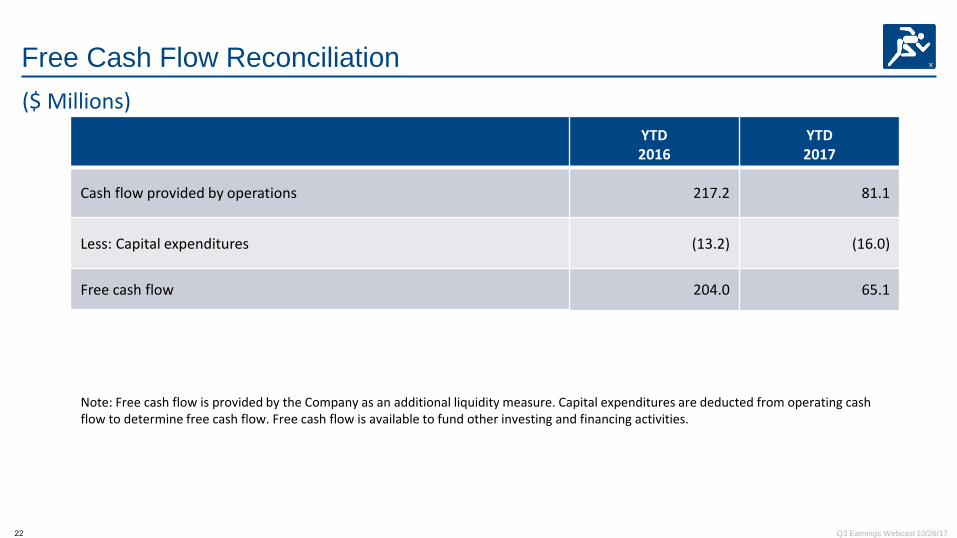
Free Cash Flow Reconciliation
YTD 2016
YTD 2017
Cash flow provided by operations 217.2 81.1
Less: Capital expenditures (13.2) (16.0)
Free cash flow 204.0 65.1
Note: Free cash flow is provided by the Company as an additional liquidity measure. Capital expenditures are deducted from operating cash flow to determine free cash flow. Free cash flow is available to fund other investing and financing activities.
($ Millions)
23 Q3 Earnings Webcast 10/26/17
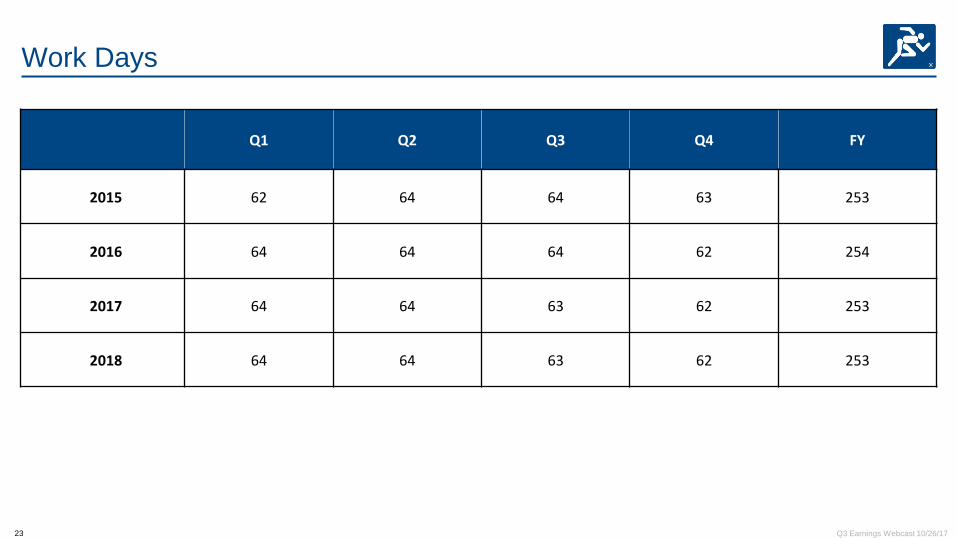
Work Days
Q1
Q2 Q3 Q4 FY
2015 62 64 64 63 253
2016 64 64 64 62 254
2017 64 64 63 62 253
2018 64 64 63 62 253