Embed Size (px)
Citation preview
Q3 2017 Business Result
Q3 2017 business result is prepared for investors’ consideration only before
completion of independent auditors’ review. Therefore, parts of contents on this
material could be changeable during independent auditors’ review.
1

Contents
I. YTD Q3 2017 Review
II. Market analysis
III. Performance analysis
IV. Financials
- Income Statement
V. Way Forward
2

• Steady SUV market growth in domestic
and overseas market
- Domestic market
· Total market : + 1.5%
· SUV market : +2.9% due to SUV-B & E
segment growth
- Overseas market
· Growth in Europe & China
• Strengthening competition in domestic
and overseas market
- Domestic market
· Two new models’ launch of competitors in
SUV-B market
- Overseas market
· Intensified competition to emerging markets
YTD Q3 2017 Review
SYMC
vehicle sales
• Total vehicle sales decrease : 4.5%
- Dom. : +8.0% with steady sales increase
- Exp. : -29.0% with continued sluggish sales
· However, gradual vehicle sales increase
due to G4 Rexton export in Aug.
· Q3 2017 : +41.9% vs. Q2 2017
• G4 Rexton vehicle sales
- Vehicle sales increase after launch in May
- Total : 6,235 units in Q3 2017
(+100.5% vs. Rexton in Q3 2016)
- Dom. : 4,572 units in Q3 2017
(+313.4% vs. Rexton in Q3 2016)
• Tivoli vehicle sales
- Dom. (YTD Q3 2017) : +3.9% (yoy)
· Modest vehicle sales growth in spite of
new competitors
Market
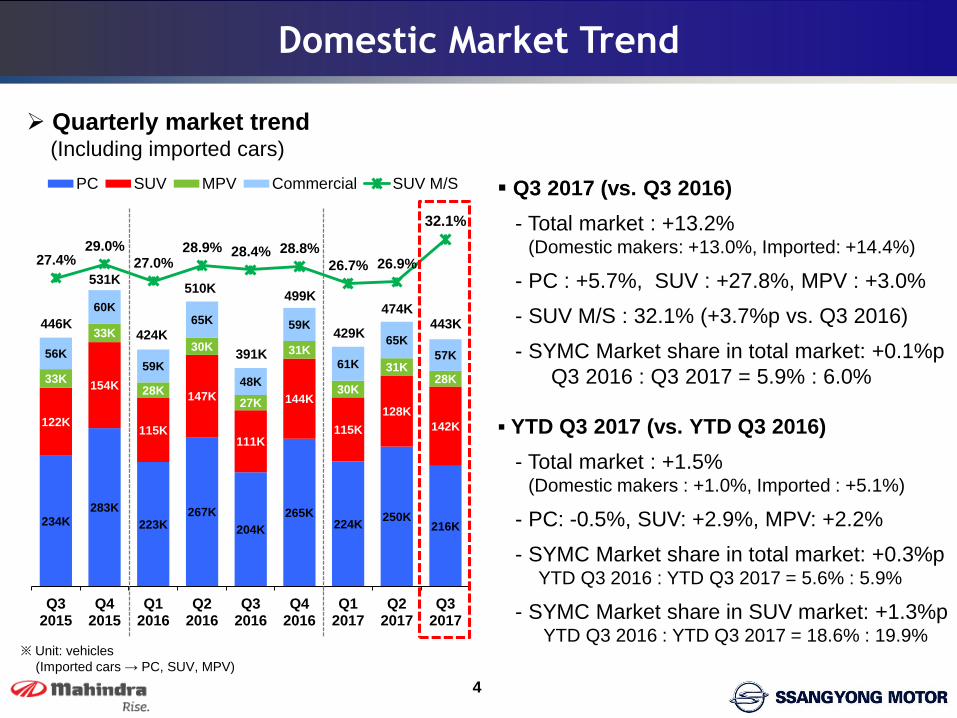
Quarterly market trend(Including imported cars)
Domestic Market Trend
4
234K283K
223K267K
204K
265K224K
250K216K
122K
154K
115K
147K
111K
144K
115K
128K
142K
33K
33K
28K
30K
27K
31K
30K
31K28K
56K
60K
59K
65K
48K
59K
61K
65K
57K
27.4%29.0%
27.0%28.9% 28.4% 28.8%
26.7% 26.9%
32.1%
Q32015
Q42015
Q12016
Q22016
Q32016
Q42016
Q12017
Q22017
Q32017
PC SUV MPV Commercial SUV M/S Q3 2017 (vs. Q3 2016)
- Total market : +13.2%(Domestic makers: +13.0%, Imported: +14.4%)
- PC : +5.7%, SUV : +27.8%, MPV : +3.0%
- SUV M/S : 32.1% (+3.7%p vs. Q3 2016)
- SYMC Market share in total market: +0.1%p
Q3 2016 : Q3 2017 = 5.9% : 6.0%
※ Unit: vehicles
(Imported cars → PC, SUV, MPV)
446K
531K
424K
510K
391K
499K
429K
474K
YTD Q3 2017 (vs. YTD Q3 2016)
- Total market : +1.5%(Domestic makers : +1.0%, Imported : +5.1%)
- PC: -0.5%, SUV: +2.9%, MPV: +2.2%
- SYMC Market share in total market: +0.3%pYTD Q3 2016 : YTD Q3 2017 = 5.6% : 5.9%
- SYMC Market share in SUV market: +1.3%pYTD Q3 2016 : YTD Q3 2017 = 18.6% : 19.9%
443K
0
50
100
150
200
250
300
350
YTD Q3 2016 YTD Q3 2017
22K 29K
125K 118K
87K 71K
71K 98K
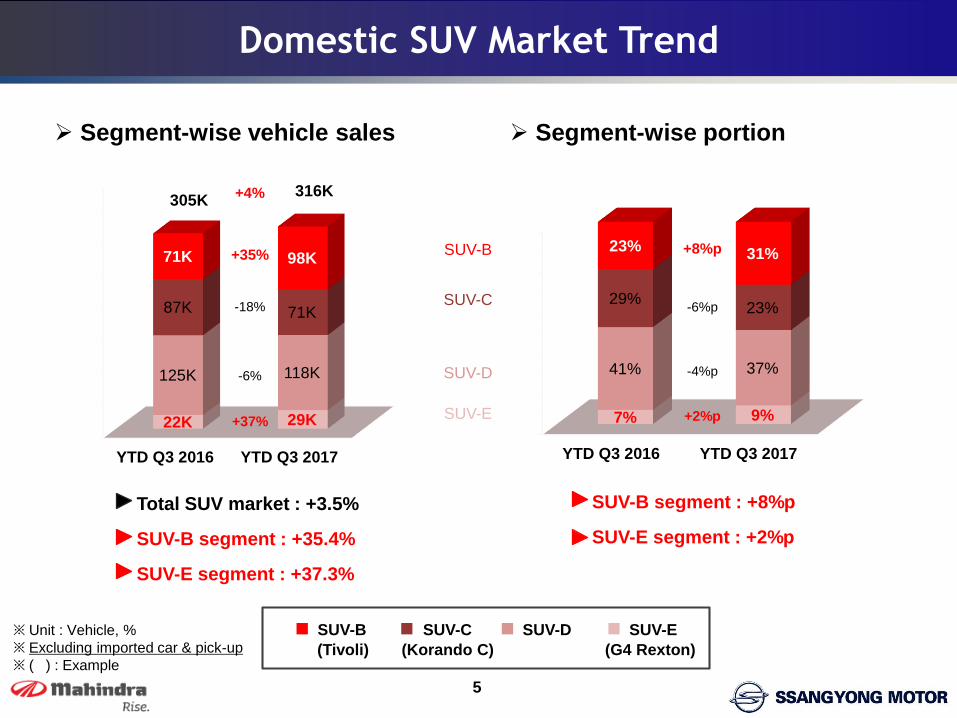
Domestic SUV Market Trend
5
※ Unit : Vehicle, %
※ Excluding imported car & pick-up
※ ( ) : Example
Segment-wise vehicle sales
SUV-B SUV-C SUV-D SUV-E
Total SUV market : +3.5%
SUV-B segment : +35.4%
SUV-E segment : +37.3%
305K316K
(Tivoli) (Korando C) (G4 Rexton)
-6%
+37%
-18%
+4%
0%
10%
20%
30%
40%
50%
60%
70%
80%
90%
100%
YTD Q3 2016 YTD Q3 2017
7% 9%
41% 37%
29%23%
23%31%
Segment-wise portion
SUV-B segment : +8%p
SUV-E segment : +2%p
-4%p
+2%p
-6%p
+8%p+35% SUV-B
SUV-C
SUV-D
SUV-E

Overseas Market Trend
6
Others
※ Unit : Vehicle
※ Source : Automotive News, Makrlines
※ Excluding commercial vehicles
※ ( ) : SUV portion out of total market
Europe (28 Countries)
6,399K
6,388K
2,847K
2,463K
914K
945K
Jan.~Aug.2017
Jan.~Aug.2016
China
Russia
10,063K
10,470K
- Total market : +4.0%
- SUV market : +15.6%
7,101K
7,273K
5,990K
5,067K
1,323K
1,562K
Jan.~Aug.2017
Jan.~Aug.2016
- Total market : +2.6%
- SUV market : +18.2%
482K
471K
400K
329K
26K
25K
Jan.~Aug.2017
Jan.~Aug.2016
- Total market : +9.6%
- SUV market : +21.3%
PC SUV MPVOthers
(US Pick-up)
895K
981K
14,596K
14,978K
(24.5%)
(27.2%)
(36.8%)
(40.7%)
(34.7%)
(40.0%)
4,119K
4,687K
4,671K
4,439K
1,805K
1,742K
Jan.~Aug.2017
Jan.~Aug.2016
USA
11,359K
11,034K
(42.3%)
(39.1%)
- Total market : -2.9%
- SUV market : +5.2%

SYMC Sales Volume in Q3 2017
7
23,233 26,378
13,873 9,928
Q3 2016 Q3 2017
37,106 36,306
-28%
+14%
-2%
(37%)
(63%)
(27%)
(73%)
Sales volume decrease
- Total Sales : -800 units (-2%)
· Domestic : +3,145 units (+14%)
· Export : -3,945 units (-28%)
Domestic portion increase : +10%p
- Q3 2016 : Q3 2017 = 63% : 73%
G4 Rexton
- A leading SUV model in domestic SUV-E segment
(Market share of 47% in Q3 2017)
- Q3 2017 Total 6,235 units : +100% (vs. Q3 2016)Domestic Export
※ Unit: vehicle (including CKD)
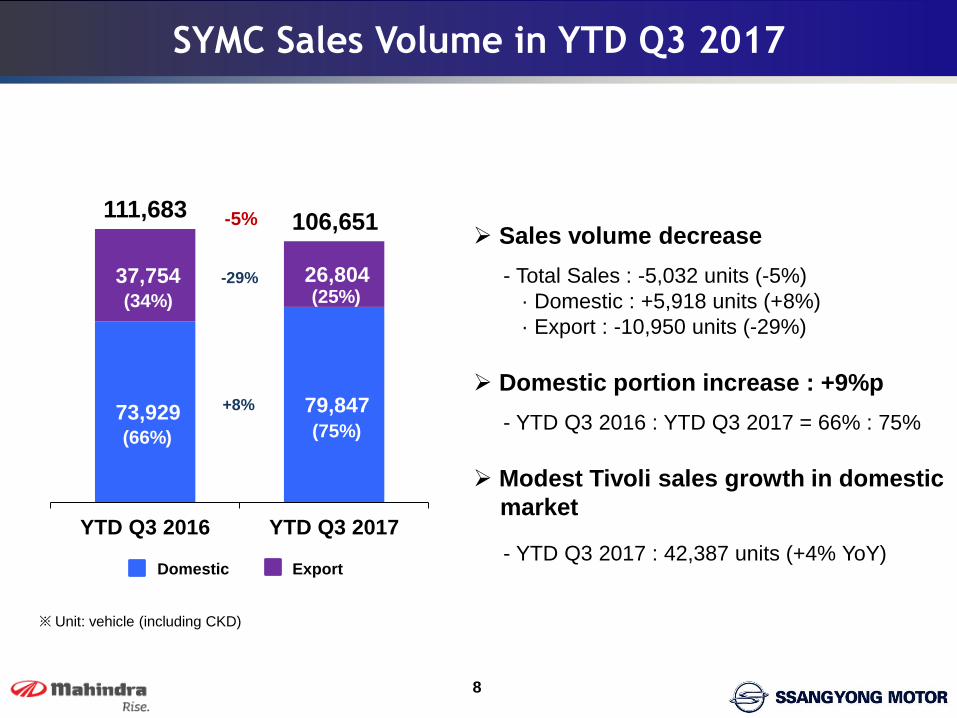
SYMC Sales Volume in YTD Q3 2017
8
73,929 79,847
37,754 26,804
YTD Q3 2016 YTD Q3 2017
111,683106,651
-29%
+8%
-5%
※ Unit: vehicle (including CKD)
(34%)
(66%)
(25%)
(75%)
Sales volume decrease
- Total Sales : -5,032 units (-5%)
· Domestic : +5,918 units (+8%)
· Export : -10,950 units (-29%)
Domestic portion increase : +9%p
- YTD Q3 2016 : YTD Q3 2017 = 66% : 75%
Modest Tivoli sales growth in domestic
market
- YTD Q3 2017 : 42,387 units (+4% YoY)Domestic Export

Region-wise Export Portion in YTD Q3 2017
W. Europe
Asia Pacific
※ % out of export sales volume
(Including CKD)
Others
South America
44%
49%
9%5%
21%26%
20%
26%
YTD Q3
2016
YTD Q3
2017
YTD Q3
2016
YTD Q3
2017
YTD Q3
2016YTD Q3
2017
YTD Q3
2016
YTD Q3
2017
※ Including: China
9
※ Others: ME, AF, E. Europe
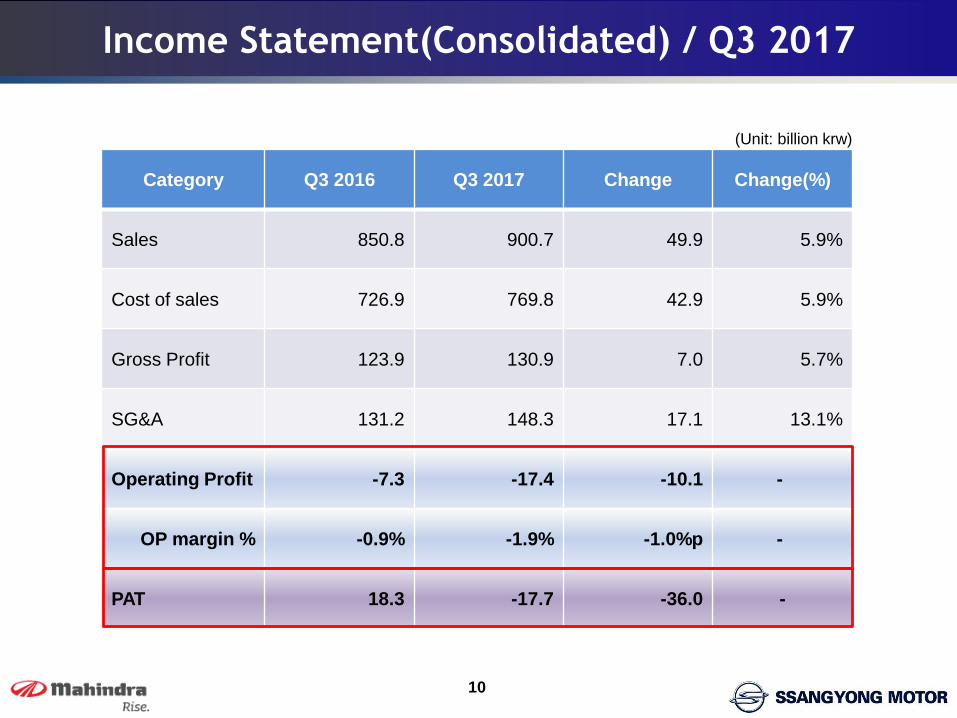
Income Statement(Consolidated) / Q3 2017
Category Q3 2016 Q3 2017 Change Change(%)
Sales 850.8 900.7 49.9 5.9%
Cost of sales 726.9 769.8 42.9 5.9%
Gross Profit 123.9 130.9 7.0 5.7%
SG&A 131.2 148.3 17.1 13.1%
Operating Profit -7.3 -17.4 -10.1 -
OP margin % -0.9% -1.9% -1.0%p -
PAT 18.3 -17.7 -36.0 -
(Unit: billion krw)
10

Operating Costs / Q3 2017
Q3 2016 Q3 2017
+0.1%p
Cost of sales (%) SG&A expense (%)
15.4%
16.5%
※ (Cost of Sales/Sales)*100 ※ (SG&A expenses/Sales)*100
Q3 2016 Q3 2017
11
85.4% 85.5%
+1.1%p

Income Statement(Consolidated) / YTD Q3 2017
Category YTD Q3 2016 YTD Q3 2017 Change Change(%)
Sales 2,627.9 2,592.5 -35.4 -1.3%
Cost of sales 2,196.4 2,198.1 1.7 0.1%
Gross Profit 431.5 394.4 -37.1 -8.6%
SG&A 411.5 434.0 22.5 5.5%
Operating Profit 20.0 -39.5 -59.5 -
OP margin % 0.8% -1.5% -2.3%p -
PAT 38.7 -35.6 -74.3 -
(Unit: billion krw)
12
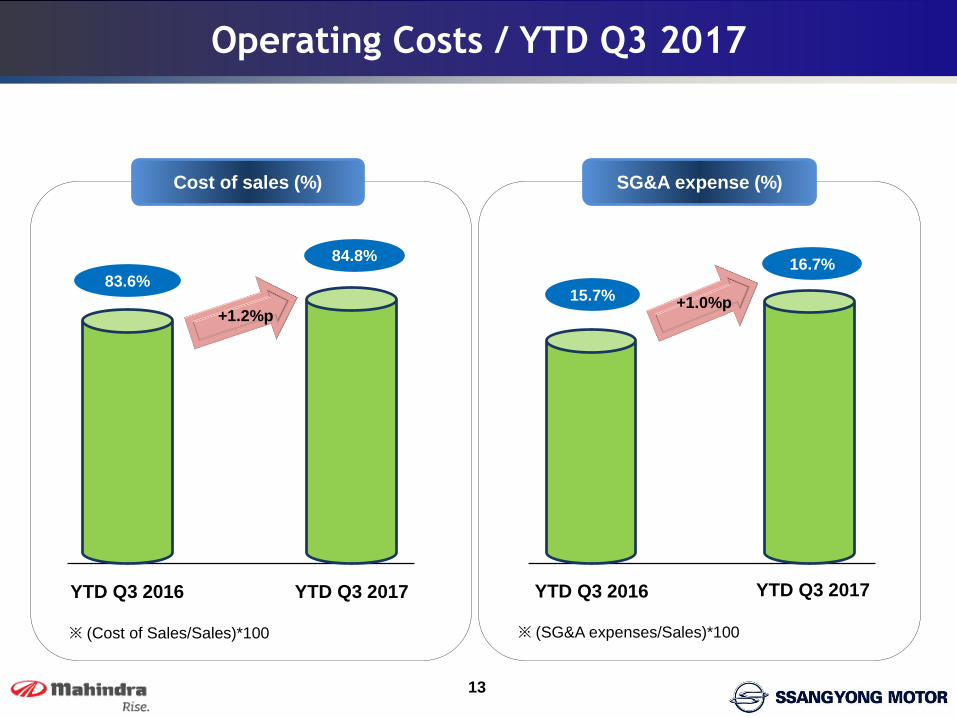
Operating Costs / YTD Q3 2017
YTD Q3 2016 YTD Q3 2017
Cost of sales (%) SG&A expense (%)
15.7%
16.7%
※ (Cost of Sales/Sales)*100 ※ (SG&A expenses/Sales)*100
YTD Q3 2016 YTD Q3 2017
13
83.6%
84.8%
+1.2%p+1.0%p
14
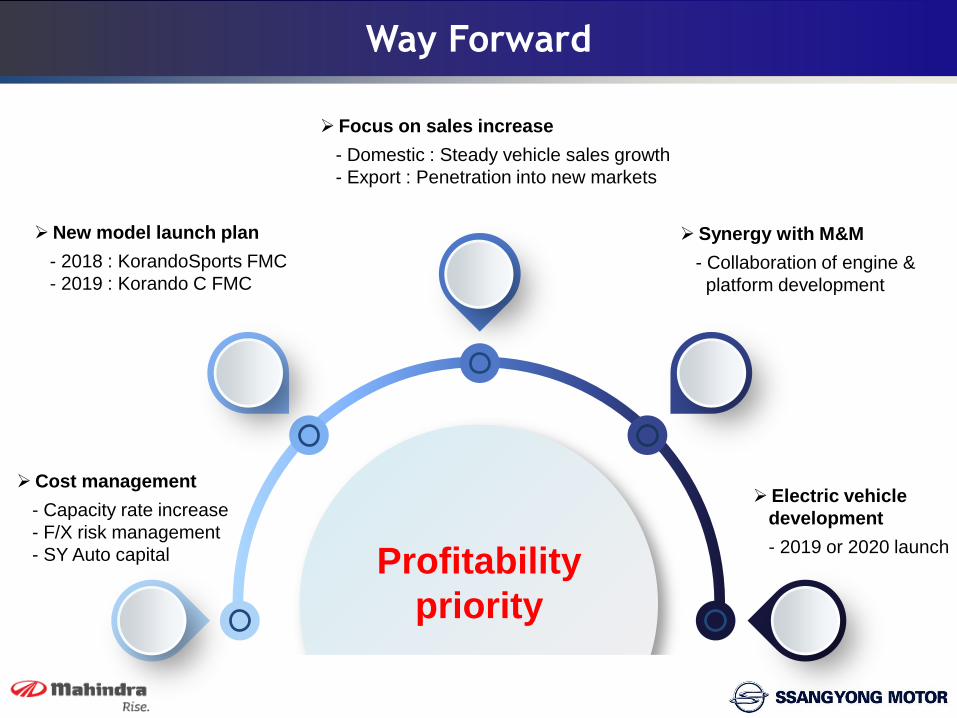
Way Forward
Profitability
priority
Cost management
- Capacity rate increase
- F/X risk management
- SY Auto capital
New model launch plan
- 2018 : KorandoSports FMC
- 2019 : Korando C FMC
Focus on sales increase
- Domestic : Steady vehicle sales growth
- Export : Penetration into new markets
Synergy with M&M
- Collaboration of engine &
platform development
Electric vehicle
development
- 2019 or 2020 launch


![Announces Standalone Q3 results & Limited Review Report for the Quarter ended December 31, 2015 [Result]](https://img.pdfslide.us/doc/110x75/577ca5d61a28abea748bab92/announces-standalone-q3-results-limited-review-report-for-the-quarter-ended.jpg)


![Announces Q3 Results (Standalone) for the Quarter ended December 31, 2015 [Result]](https://img.pdfslide.us/doc/110x75/577c87b61a28abe054c4d771/announces-q3-results-standalone-for-the-quarter-ended-december-31-2015-result.jpg)

![Information Update on the Unaudited Financial Results Q3 2015-16 [Result]](https://img.pdfslide.us/doc/110x75/577ca59a1a28abea748b99ce/information-update-on-the-unaudited-financial-results-q3-2015-16-result.jpg)
![Announces Q3 results [Result]](https://img.pdfslide.us/doc/110x75/577ca58e1a28abea748b9591/announces-q3-results-result.jpg)


![Announces Q3 results & Limited Review Report for the quarter ended December 31, 2015 [Result]](https://img.pdfslide.us/doc/110x75/577ca61e1a28abea748bc3ff/announces-q3-results-limited-review-report-for-the-quarter-ended-december.jpg)