Embed Size (px)
Citation preview
Key Takeaways …………………….....….…...……………………….....…….. 2
Results Overview & Outlook ………..…………………………......…...... 3
Operating Areas:
STACK .................….………….………………………………………….…… 7
Delaware Basin ...............…………………………….…………………… 12
Eagle Ford ……....….…………………………………………………………… 16
Heavy Oil …..……….………………………….……………………………….. 18
Barnett Shale ………...………………………………………………………… 20
Rockies Oil ………….…...…………………….……………………………….. 22
Email: [email protected]
Scott CoodyVice President, Investor Relations405-552-4735
Chris CarrSupervisor, Investor Relations405-228-2496
Q3 2016 OPERATIONS REPORTNovember 1, 2016
NYSE: DVNdevonenergy.com
IR Contacts Table of Contents

KEY TAKEAWAYS
Q3 2016 OPERATIONS REPORT 2
Heavy Oil
Rockies Oil
STACK
Delaware Basin
Eagle Ford
BarnettShale
HIGHLIGHTS
OPERATING HIGHLIGHTS
Achieved record-setting well results in U.S. resource plays
Increased STACK production 38% year over year
Improved lease operating expenses by 37% from peak rates
Completed $3.2 billion asset divestiture program
Repurchased $1.2 billion of debt
Record-setting well results in the STACK – Pg. 8
Raising Meramec and Woodford type curves – Pg. 8 - 10
Accelerating Delaware Basin rig activity – Pg. 13
Wolfcamp drilling to ramp up in 2017 – Pg. 13
Eagle Ford resumes completion activity – Pg. 17
Jackfish complex production exceeds nameplate capacity – Pg. 18

RESULTS OVERVIEW & OUTLOOK
Q3 2016 OPERATIONS REPORT 3
RETAINED ASSETS Q3 STATSQ3 2016 Q3 2015
Production:
Oil & Bitumen (MBOD) 245 261
NGL (MBLD) 96 108
Gas (MMCFD) 1,249 1,335
Retained Assets (MBOED) 550 591
E&P Capital (in millions): $231
Operated Rigs (at 9/30/16): 6 (5 in U.S.)
Record-Setting Well Results in U.S. Resource Plays
Production from retained assets averaged 550,000 Boe per day during the third quarter. With the shift to higher-margin production, oil is now the largest component of Devon’s product mix at 45% of total production (chart below).
Within the company’s U.S. resource plays, production averaged 410,000 Boe per day. This performance was highlighted by strong results from the STACK play, where production increased 38% year over year.
Lease Operating Expenses Decline 37%
Devon’s successful cost-reduction initiatives resulted in LOE of $355 million in Q3, which was 7% below the low end of guidance. This strong cost result represents a decline of 37% from peak costs in 2015 (chart below).
In aggregate, Devon commenced production on 20 development wells across its U.S. resource plays during the quarter. Initial 30-day rates from these wells averaged an all-time quarterly high of 2,000 Boe per day.
The successful deployment of leading-edge completion designs, improvements in lateral placement and better understanding of the subsurface drove the per-well productivity gains.
In Canada, oil production averaged 137,000 barrels per day, a 13% increase year over year, driven by production at Devon’s Jackfish complex.
To enhance profitability, the company rejected 6,000 barrels per day of ethane in Q3. NGL production averaged 96,000 barrels per day in the quarter.
$562
$510$480
$444$416
$355
Q2 2015 Q3 2015 Q4 2015 Q1 2016 Q2 2016 Q3 2016
LOE($ Millions)
37%IMPROVEMENT
The decrease in LOE was driven primarily by improved power and water-handling infrastructure, declining labor expense and lower supply chain costs across the company’s portfolio.
With the strong cost performance year to date, Devon is lowering the midpoint of its 2016 LOE outlook by $55 million to $1.6 billion.
45%
17%
38%
Q3 Production MixRetained Assets
(550 MBOED)
Oil NGL Gas
QUARTERLY RECORD
Q3(20-Well Average)
DEVELOPMENT WELLS
BOED2,000

RESULTS OVERVIEW & OUTLOOK
Q3 2016 OPERATIONS REPORT 4
G&A Costs Continue to Decline
The company also realized significant G&A cost savings. Including capitalized costs, total G&A declined to $195 million in Q3, a 44% improvement compared to peak 2015 rates (chart below).
The decrease in G&A expense was driven by reduced personnel costs. However, Devon has maintained the organizational capacity to efficiently accelerate activity levels as commodity prices improve.
$3.2 Billion Divestiture Program Complete
Overall, Devon’s divestiture program is now complete with total proceeds reaching $3.2 billion with minimal taxes expected.
Devon closed on the sale of non-core assets in the Midland Basin, East Texas and Granite Wash for $1.8 billion in the third quarter. With the closing of these assets, the company’s upstream divestiture proceeds have reached $2.1 billion.
On October 6th, the company closed on the sale of its 50% interest in the Access Pipeline for USD $1.1 billion. Additionally, Devon has the right to receive an incremental USD $120 million payment with the development of Pike and the potential to reduce future tolls by up to 30%.
The EnLink Midstream Advantage
Devon’s EnLink midstream business generated $228 million of operating profit in Q3. This steady source of profitability has expanded by 7% compared to the same period in 2015.
EnLink Midstream’s growing profitability is derived from an asset base that is positioned in some of the most attractive markets in North America, including the STACK, Midland Basin, Delaware Basin and an NGL business that services end-user demand along the Gulf Coast.
Devon has a 64% ownership in EnLink’s general partner (ENLC) and a 24% interest in the limited partner (ENLK) (table below). In aggregate, the company’s ownership in EnLink is valued at $3.5 billion and will generate cash distributions of $270 million in 2016.
Investment-Grade Position Strengthens
With investment-grade credit ratings and pro forma liquidity of $6.5 billion at the end of the third quarter (chart next page), Devon’s financial position remains exceptionally strong.
Q1 2015 Q2 2015 Q3 2015 Q4 2015 Q1 2016 Q2 2016 Q3 2016
G&A($ Millions)
44%IMPROVEMENT
Net G&A Capitalized G&A
$195
$345
Market Value
($B)
ENLC (115 MM Units) $1.9
ENLK (95 MM Units) $1.6
DVN’s Ownership $3.5
Devon’s Ownership
As of October 2016
BILLION
OWNERSHIPDVN’S ENLINK

RESULTS OVERVIEW & OUTLOOK
Q3 2016 OPERATIONS REPORT 5
Investment-Grade Position Strengthens (continued)
In August, the company successfully tendered for $1.2 billion of debt, which is expected to reduce interest expense by $54 million annually. With the tender focused on near-term maturities, Devon has no significant long-term debt maturities until mid-2021.
At the end of September, Devon’s consolidated debt totaled $11.4 billion. Adjusting for non-recourse EnLink obligations and Access Pipeline proceeds, adjusted net debt has declined 45% from peak levels to $4.7 billion.
Liquidity
Pro Forma Liquidity($ Millions)
$6,500
Cash
CreditFacility
DECLINE
9/30(VS. DEC. 2015 ADJ. DEBT)
ADJUSTED NET DEBT
Note: Adjusted net debt is a non-GAAP measure. See earnings release for a reconciliation.
Devon Increases Hedging Position
The recent rise in commodity prices has provided Devon the opportunity to increase its hedging position in 2017 (see SEC filings for details).
Q4 Outlook: Oil Production to Stabilize
Devon exited the third quarter with 5 operated rigs running across its U.S. resource plays and expects to have as many as 10 operated rigs running by year end (table below). The company also expects to run as many as 5 operated completion crews during the fourth quarter.
This upstream activity is expected to result in $400 to $425 million of E&P capital expenditures in Q4. Capitalized G&A and other corporate capital requirements will add another ≈$80 million to the total.
In Q4, oil production is expected to be relatively stable compared to Q3, ranging between 238,000 and 248,000 barrels per day. Key drivers of the stabilized oil production are high activity levels in the STACK and accelerated completion activity in the Eagle Ford.
Top-line production from retained assets is projected to range between 524,000 and 546,000 Boe per day in Q4.
2017 HEDGING
Period Product Volume/d% of Q3 2016 Production
FY 2017 Oil (Bbl) 83,000 34%
FY 2017 Gas (MMBtu) 390,000 31%
Devon will continue to add to its hedging position and is targeting to have approximately 50% of its expected revenues protected in 2017.
This risk-management program will be a combination of systematic hedges added on a quarterly basis and discretionary hedges that take advantage of favorable market conditions.
OPERATED U.S. RIG ACTIVITY (1)
Q3 2016 At 12/31/16e
STACK 4 6
Delaware Basin 1 3
Rockies Oil 0 1
Totals 5 10
(1) Excludes partner operated rig activity in the Eagle Ford.
RESULTS OVERVIEW & OUTLOOK
Q3 2016 OPERATIONS REPORT 6
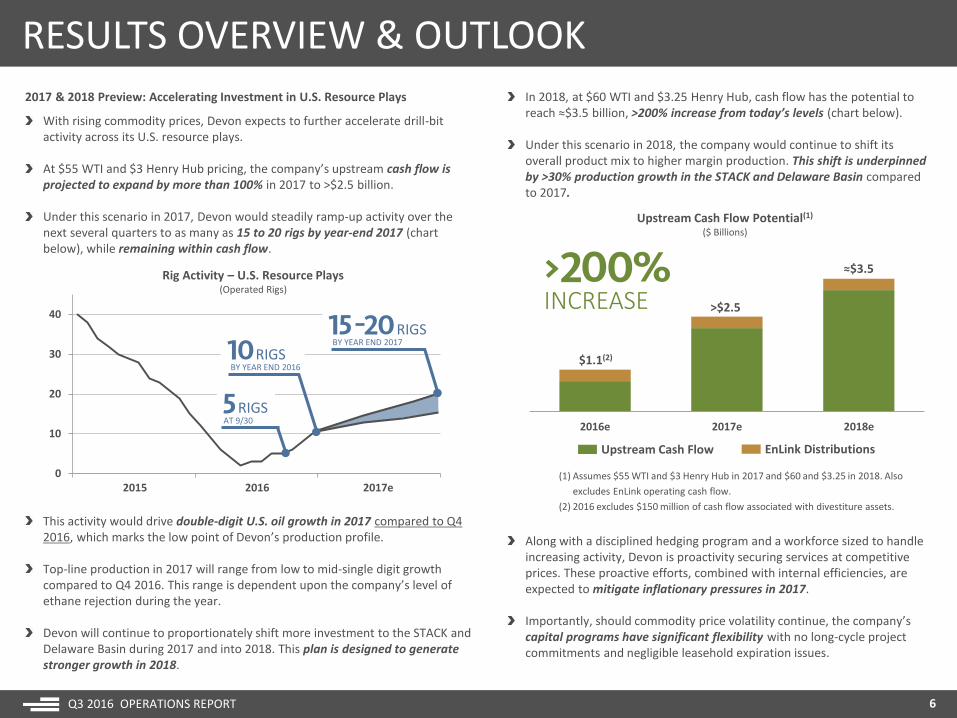
2017 & 2018 Preview: Accelerating Investment in U.S. Resource Plays
With rising commodity prices, Devon expects to further accelerate drill-bit activity across its U.S. resource plays.
At $55 WTI and $3 Henry Hub pricing, the company’s upstream cash flow is projected to expand by more than 100% in 2017 to >$2.5 billion.
Under this scenario in 2017, Devon would steadily ramp-up activity over the next several quarters to as many as 15 to 20 rigs by year-end 2017 (chart below), while remaining within cash flow.
0
10
20
30
40
2015 2016 2017
Rig Activity – U.S. Resource Plays(Operated Rigs)
2015 2016 2017e
In 2018, at $60 WTI and $3.25 Henry Hub, cash flow has the potential to reach ≈$3.5 billion, >200% increase from today’s levels (chart below).
Under this scenario in 2018, the company would continue to shift its overall product mix to higher margin production. This shift is underpinned by >30% production growth in the STACK and Delaware Basin compared to 2017.
2016e 2017e 2018e
Upstream Cash Flow Potential(1)
($ Billions)
(1) Assumes $55 WTI and $3 Henry Hub in 2017 and $60 and $3.25 in 2018. Also
excludes EnLink operating cash flow.
(2) 2016 excludes $150 million of cash flow associated with divestiture assets.
$1.1(2)
>$2.5
≈$3.5
Upstream Cash Flow EnLink Distributions
AT 9/30RIGS
BY YEAR END 2016RIGS
BY YEAR END 2017RIGS
Along with a disciplined hedging program and a workforce sized to handle increasing activity, Devon is proactivity securing services at competitive prices. These proactive efforts, combined with internal efficiencies, are expected to mitigate inflationary pressures in 2017.
Importantly, should commodity price volatility continue, the company’s capital programs have significant flexibility with no long-cycle project commitments and negligible leasehold expiration issues.
INCREASE
This activity would drive double-digit U.S. oil growth in 2017 compared to Q4 2016, which marks the low point of Devon’s production profile.
Top-line production in 2017 will range from low to mid-single digit growth compared to Q4 2016. This range is dependent upon the company’s level of ethane rejection during the year.
Devon will continue to proportionately shift more investment to the STACK and Delaware Basin during 2017 and into 2018. This plan is designed to generate stronger growth in 2018.
STACK
Q3 2016 OPERATIONS REPORT 7
STACK Q3 STATSQ3 2016 Q3 2015
Production:
Oil (MBOD) 21 7
NGL (MBLD) 23 22
Gas (MMCFD) 292 229
MBOED 92 67
E&P Capital (in millions): $101
Operated Rigs (at 9/30/16): 4
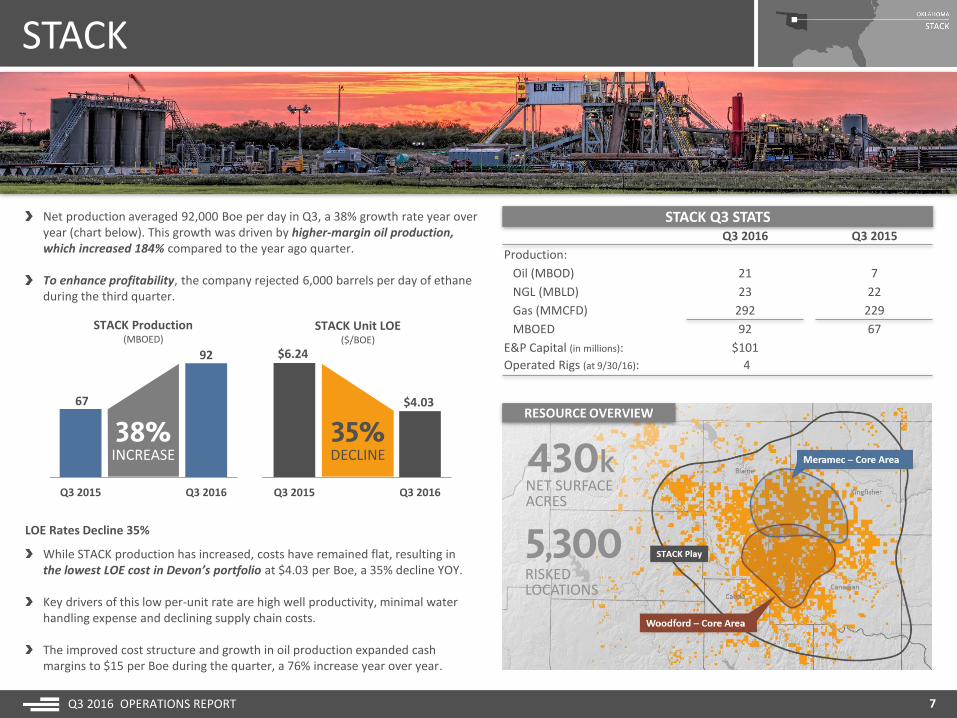
Net production averaged 92,000 Boe per day in Q3, a 38% growth rate year over year (chart below). This growth was driven by higher-margin oil production, which increased 184% compared to the year ago quarter.
To enhance profitability, the company rejected 6,000 barrels per day of ethane during the third quarter.
STACK Unit LOE($/BOE)
RESOURCE OVERVIEW
NET SURFACEACRES
$6.24
$4.03
Q3 2015 Q3 2016
35%DECLINE
LOE Rates Decline 35%
While STACK production has increased, costs have remained flat, resulting in the lowest LOE cost in Devon’s portfolio at $4.03 per Boe, a 35% decline YOY.
Key drivers of this low per-unit rate are high well productivity, minimal water handling expense and declining supply chain costs.
The improved cost structure and growth in oil production expanded cash margins to $15 per Boe during the quarter, a 76% increase year over year.
67
92
Q3 2015 Q3 2016
38%INCREASE
STACK Production(MBOED)
RISKEDLOCATIONS
430k
5,300
STACK
Q3 2016 OPERATIONS REPORT 8
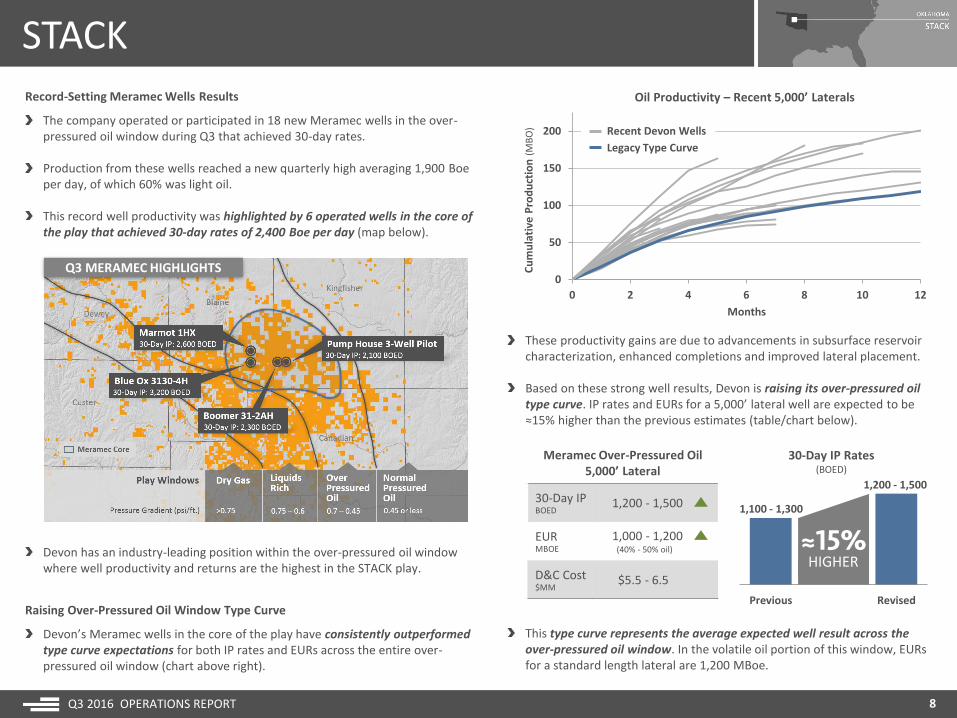
Record-Setting Meramec Wells Results
The company operated or participated in 18 new Meramec wells in the over-pressured oil window during Q3 that achieved 30-day rates.
Production from these wells reached a new quarterly high averaging 1,900 Boeper day, of which 60% was light oil.
This record well productivity was highlighted by 6 operated wells in the core of the play that achieved 30-day rates of 2,400 Boe per day (map below).
Q3 MERAMEC HIGHLIGHTS
Raising Over-Pressured Oil Window Type Curve
Devon’s Meramec wells in the core of the play have consistently outperformed type curve expectations for both IP rates and EURs across the entire over-pressured oil window (chart above right).
Oil Productivity – Recent 5,000’ Laterals
0
50
100
150
200
0 2 4 6 8 10 12
Cu
mu
lati
ve P
rod
uct
ion
(M
BO
)
Months
These productivity gains are due to advancements in subsurface reservoir characterization, enhanced completions and improved lateral placement.
Based on these strong well results, Devon is raising its over-pressured oil type curve. IP rates and EURs for a 5,000’ lateral well are expected to be ≈15% higher than the previous estimates (table/chart below).
This type curve represents the average expected well result across the over-pressured oil window. In the volatile oil portion of this window, EURs for a standard length lateral are 1,200 MBoe.
Meramec Over-Pressured Oil 5,000’ Lateral
30-Day IPBOED
1,200 - 1,500
EURMBOE
1,000 - 1,200(40% - 50% oil)
D&C Cost$MM
$5.5 - 6.5
Previous Revised
≈15%HIGHER
30-Day IP Rates(BOED)
1,100 - 1,300
1,200 - 1,500
Devon has an industry-leading position within the over-pressured oil window where well productivity and returns are the highest in the STACK play.
Recent Devon Wells
Legacy Type Curve

STACK
Q3 2016 OPERATIONS REPORT 9
10,000’ Laterals to Further Boost Meramec Economics
With the recent success of extended-reach laterals in the play, the company expects ≈60% of its operated Meramec activity in 2017 to utilize 10,000’ laterals (table below).
In the volatile oil portion of the over-pressured oil window, EURs for an extended-reach lateral can exceed 2,000 MBoe.
Meramec Over-Pressured Oil10,000’ Lateral
30-Day IPBOED
1,900 - 2,300
EURMBOE
1,600 - 2,000(40% - 50% oil)
D&C Cost$MM
$7.5 - 9.0
10,000’ LATERALS
OF 2017eACTIVITY
Volatile Oil Window Drives Devon’s Best-In-Class Results
A key operated well brought online in Q3 was the Blue Ox 3130-4AH in the volatile oil window (map previous page). The Blue Ox, drilled with a 10,000’ lateral, achieved a peak 24-hour rate of 4,000 Boe per day (70% oil) and averaged a 30-day rate of 3,200 Boe per day.
Offsetting the Blue Ox well on an adjacent lease was the Marmot 19-1HX that averaged a 30-day rate of nearly 2,600 Boe per day (70% oil).
The Blue Ox and Marmot wells were landed in different intervals within the Upper Meramec, further supporting the concept of multi-zone development across the field .
Oil productivity from the Blue Ox and Marmot wells are among the highest of any Meramec wells drilled-to-date. This is another example of Devon’s best-in-class well productivity in the STACK play.
Since 2015, Devon’s well productivity in Blaine, Kingfisher and Canadian counties has been ≈50% higher than the industry average (chart below).
0
25
50
75
100
125
STACK Average 30-Day IP’s Per 1,000’ Lateral(BOED, 20:1)
+50% vs.Peer Average
Peers
Source: IHS/Devon. Results represent wells online since 2015.
Third Successful STACK Spacing Test
In August, Devon brought online its Pump House spacing pilot in the over-pressured oil window that tested a 7-well pattern across a single interval in the upper Meramec (map next page).
The Pump House wells were drilled with 4,700’ laterals and achieved 30-day rates that averaged 2,100 Boe per day at a cost of $6 million per well.
These wells utilized a completion design that deployed 2,200 pounds of proppant per lateral foot across 35 frac stages, with perf clusters spaced 25 feet apart.
Devon now has completed 3 spacing pilots in the Meramec. Production from the staggered 2-well Born Free pilot in the upper Meramec indicate minimal communication and continue to perform exceptionally well, averaging a 120-day rate of 1,400 Boe per day.
The Alma spacing pilot tested 5-wells per section across a single interval in the upper Meramec and has achieved a 60-day rate of 1,300 Boe per day.
STACK
Q3 2016 OPERATIONS REPORT 10
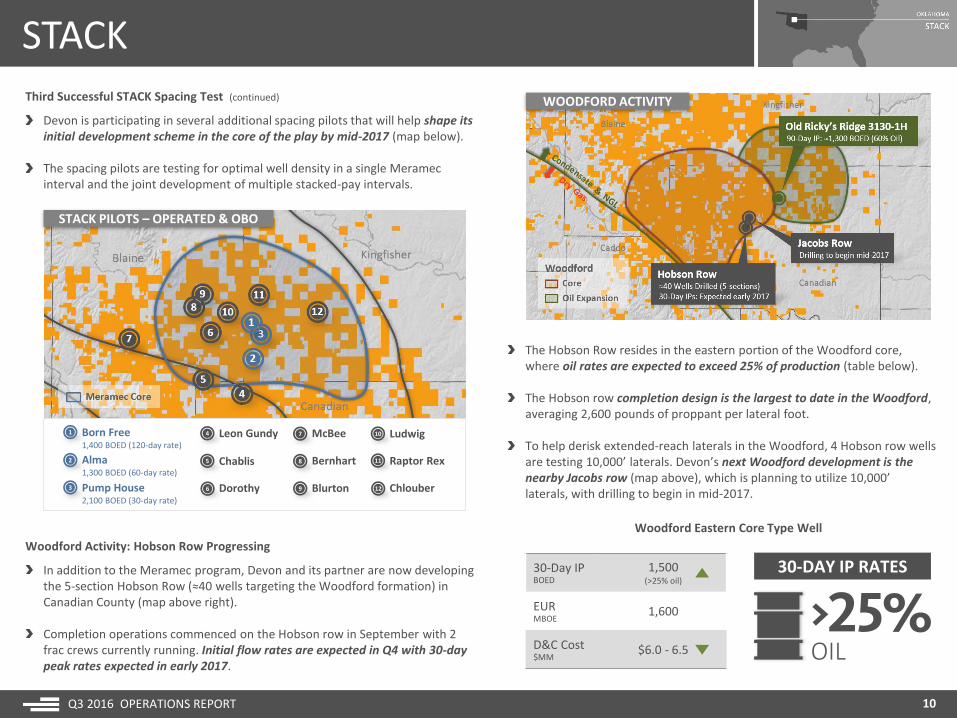
Third Successful STACK Spacing Test (continued)
Devon is participating in several additional spacing pilots that will help shape its initial development scheme in the core of the play by mid-2017 (map below).
The spacing pilots are testing for optimal well density in a single Meramec interval and the joint development of multiple stacked-pay intervals.
1 Born Free1,400 BOED (120-day rate)
2
3
4
5
Leon Gundy
Chablis
6 Dorothy
7 McBee
8
9
Bernhart
Blurton
10
11
Ludwig
Raptor Rex
12 Chlouber
Alma1,300 BOED (60-day rate)
Pump House2,100 BOED (30-day rate)
STACK PILOTS – OPERATED & OBO
Woodford Activity: Hobson Row Progressing
In addition to the Meramec program, Devon and its partner are now developing the 5-section Hobson Row (≈40 wells targeting the Woodford formation) in Canadian County (map above right).
Completion operations commenced on the Hobson row in September with 2 frac crews currently running. Initial flow rates are expected in Q4 with 30-day peak rates expected in early 2017.
The Hobson Row resides in the eastern portion of the Woodford core, where oil rates are expected to exceed 25% of production (table below).
The Hobson row completion design is the largest to date in the Woodford, averaging 2,600 pounds of proppant per lateral foot.
To help derisk extended-reach laterals in the Woodford, 4 Hobson row wells are testing 10,000’ laterals. Devon’s next Woodford development is the nearby Jacobs row (map above), which is planning to utilize 10,000’ laterals, with drilling to begin in mid-2017.
30-Day IPBOED
1,500(>25% oil)
EURMBOE
1,600
D&C Cost$MM
$6.0 - 6.5 OIL
30-DAY IP RATES
Woodford Eastern Core Type Well
WOODFORD ACTIVITY
STACK
Q3 2016 OPERATIONS REPORT 11
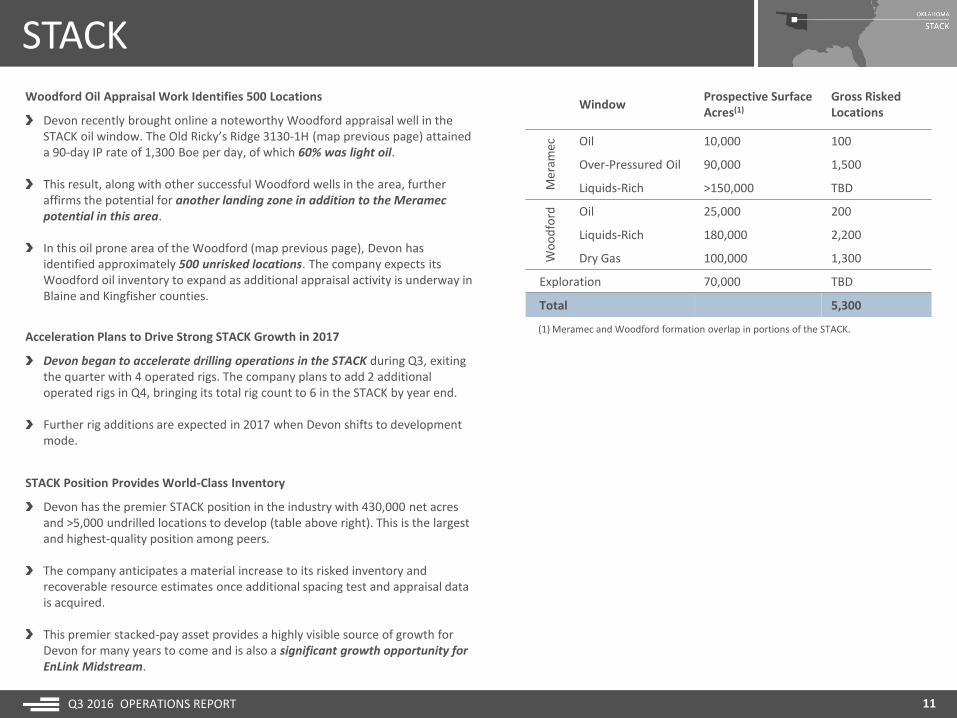
Woodford Oil Appraisal Work Identifies 500 Locations
Devon recently brought online a noteworthy Woodford appraisal well in the STACK oil window. The Old Ricky’s Ridge 3130-1H (map previous page) attained a 90-day IP rate of 1,300 Boe per day, of which 60% was light oil.
This result, along with other successful Woodford wells in the area, further affirms the potential for another landing zone in addition to the Meramec potential in this area.
In this oil prone area of the Woodford (map previous page), Devon has identified approximately 500 unrisked locations. The company expects its Woodford oil inventory to expand as additional appraisal activity is underway in Blaine and Kingfisher counties.
Acceleration Plans to Drive Strong STACK Growth in 2017
Devon began to accelerate drilling operations in the STACK during Q3, exiting the quarter with 4 operated rigs. The company plans to add 2 additional operated rigs in Q4, bringing its total rig count to 6 in the STACK by year end.
Further rig additions are expected in 2017 when Devon shifts to development mode.
STACK Position Provides World-Class Inventory
Devon has the premier STACK position in the industry with 430,000 net acres and >5,000 undrilled locations to develop (table above right). This is the largest and highest-quality position among peers.
The company anticipates a material increase to its risked inventory and recoverable resource estimates once additional spacing test and appraisal data is acquired.
This premier stacked-pay asset provides a highly visible source of growth for Devon for many years to come and is also a significant growth opportunity for EnLink Midstream.
(1) Meramec and Woodford formation overlap in portions of the STACK.
WindowProspective SurfaceAcres(1)
Gross RiskedLocations
Mer
amec Oil 10,000 100
Over-Pressured Oil 90,000 1,500
Liquids-Rich >150,000 TBD
Wo
od
ford Oil 25,000 200
Liquids-Rich 180,000 2,200
Dry Gas 100,000 1,300
Exploration 70,000 TBD
Total 5,300
DELAWARE BASIN
Q3 2016 OPERATIONS REPORT
DELAWARE BASIN Q3 STATSQ3 2016 Q3 2015
Production:
Oil (MBOD) 31 41
NGL (MBLD) 12 8
Gas (MMCFD) 92 70
MBOED 59 61
E&P Capital (in millions): $28
Operated Rigs (at 9/30/16): 1
12
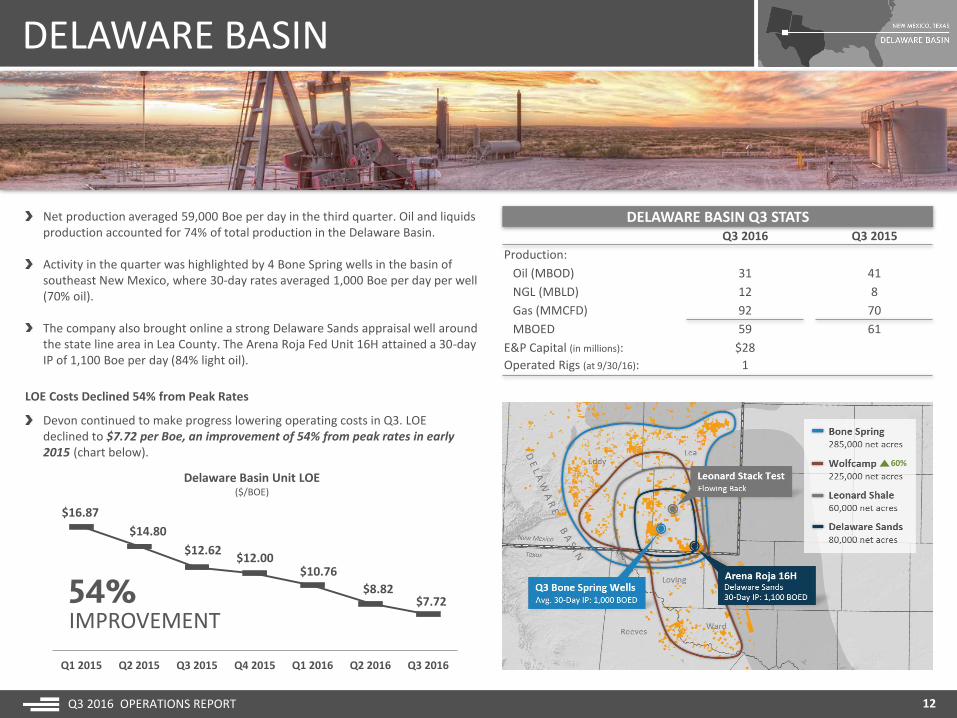
Net production averaged 59,000 Boe per day in the third quarter. Oil and liquids production accounted for 74% of total production in the Delaware Basin.
Activity in the quarter was highlighted by 4 Bone Spring wells in the basin of southeast New Mexico, where 30-day rates averaged 1,000 Boe per day per well (70% oil).
The company also brought online a strong Delaware Sands appraisal well around the state line area in Lea County. The Arena Roja Fed Unit 16H attained a 30-day IP of 1,100 Boe per day (84% light oil).
LOE Costs Declined 54% from Peak Rates
Devon continued to make progress lowering operating costs in Q3. LOE declined to $7.72 per Boe, an improvement of 54% from peak rates in early 2015 (chart below).
$16.87
$14.80
$12.62$12.00
$10.76
$8.82$7.72
Q1 2015 Q2 2015 Q3 2015 Q4 2015 Q1 2016 Q2 2016 Q3 2016
54%IMPROVEMENT
Delaware Basin Unit LOE($/BOE)
60%

DELAWARE BASIN
Q3 2016 OPERATIONS REPORT 13
Record-Low LOE Costs Achieved (continued)
The majority of these LOE savings are sustainable due to investment in infrastructure. The company now has nearly all of its wells connected to electrical power, eliminating >300 higher-cost generators in the field.
Additionally, Devon has significantly reduced water-disposal costs by investing in infrastructure that now services >75% of its produced water in the basin.
Delaware Basin Acceleration Plan on Track
Devon resumed drilling operations in the Delaware Basin during Q3 and remains on track to operate 3 rigs by year end. This 3 rig program and 1 dedicated completion crew are projected to stabilize production by early 2017.
With improving cash flow, the company expects to further ramp-up activity throughout the upcoming year, with activity reaching as many as 10 rigs by the end of 2017 (chart below). This increase in drilling activity will focus on the Bone Spring, Leonard Shale and Wolfcamp targets.
Leonard Spacing Tests to Drive Inventory Upside
A key objective of the increased drilling activity in the Delaware Basin is the further delineation and development of the Leonard Shale play.
Devon has 60,000 net surface acres in the Leonard, prospective for 3 landing intervals. Adding up the leasehold by interval, the company has exposure to 160,000 net effective acres.
0
5
10
15
2015 2016 2017
Delaware Basin Rig Activity(Operated rigs)
LEO
NA
RD
A
B
C
Leonard Shale Inventory Potential
RiskedUnrisked Upside
Up to 8 wells per interval
PER SURFACE SECTIONWELLS
Wolfcamp Drilling to Ramp Up in 2017
Another emerging opportunity that will compete for capital in 2017 is the Wolfcamp oil play, where returns have significantly improved due to recent infrastructure improvements and successful appraisal work.
BY YEAR END 2016RIGS
2015 2016 2017e
BY YEAR END 2017RIGS
Recent Leonard results have been outstanding, with wells attaining average 30-day rates of 1,900 Boe per day and D&C costs trending as low as $5 million.
To optimize future development plans, Devon is evaluating spacing of up to 8 wells in a single Leonard interval and is currently flowing back its first stacked pilot testing 400’ vertical spacing between the “B” and “C” intervals.
With successful infill tests, Devon’s Leonard inventory could substantially expand (currently risked at 5 wells per surface section).
Importantly, this preliminary capital plan is designed to create operational momentum in the Delaware Basin and deliver strong production growth in 2018.

DELAWARE BASIN
Q3 2016 OPERATIONS REPORT 14
Wolfcamp Drilling to Ramp Up in 2017 (continued)
Initial Wolfcamp activity will be focused on Devon’s Rattlesnake and Mi Vida acreage (map below), where several high-rate Wolfcamp wells targeting multiple landing zones have been brought online.
Across the Rattlesnake and Mi Vida areas, Devon has identified 500 high-quality, risked locations in the Wolfcamp “A.” Returns associated with the “A” interval are expected to be very competitive in Devon’s portfolio.
As a result of ongoing characterization work, Devon is raising its exposure to the Wolfcamp by 60% to 225,000 net prospective surface acres.
This position provides exposure to >9,000 unrisked locations across multiple landing zones.
TRAC offers distinct advantages over the traditional pad drilling such as:
1. More efficient permitting process on federal lands.
2. Minimizes surface disturbance on infrastructure, surface locations and facilities.
3. Optimizes infrastructure and facility design, increasing the capacity to support a larger number of wells.
4. Provides flexibility to add or defer development zones depending upon project returns.
5. Allows for simultaneous operations to reduce cycle times and improve efficiencies driving returns higher.
Total Reservoir Access Concept (TRAC)
RISKED LOCATIONS
RATTLESNAKE & MI VIDA
,UNRISKED LOCATIONS
WOLFCAMP POTENTIAL
TRAC Development Plan to Drive Efficiencies and Returns Higher
Converting the massive and growing opportunity in the Delaware Basin into production and free cash flow is a top priority for the company.
To maximize efficiencies and returns, Devon’s future development plan in the Delaware Basin is its “Total Reservoir Access Concept” (TRAC).
Delaware Basin – A Multi-Decade Growth Platform
Devon has one of the best Delaware Basin positions in the industry. Its stacked-pay potential in the Delaware Sands, Leonard Shale, Bone Spring and Wolfcamp formations is well positioned on the industry cost curve.

DELAWARE BASIN
Q3 2016 OPERATIONS REPORT 15
Delaware Basin – A Multi-Decade Growth Platform (continued)
Adding up leasehold by formation, the company has exposure to 670,000 risked net acres, with 5,700 risked undrilled locations in this world-class basin (table below).
With the company’s ongoing Wolfcamp reservoir characterization work, Devon is now raising its total unrisked inventory across the Delaware Basin to >20,000 locations, an increase of nearly 25% from previous estimates (table below).
FormationRiskedNetAcres
RiskedGrossLocations
UnriskedGrossLocations
Delaware Sands 80,000 700 1,500
Leonard Shale 60,000 800 3,100
Bone Spring 285,000 3,500 5,700
Wolfcamp 225,000 500 >9,000
Other (Yeso & Strawn) 20,000 200 200
Total 670,000 5,700 >20,000

EAGLE FORD
Q3 2016 OPERATIONS REPORT 16
EAGLE FORD Q3 STATSQ3 2016 Q3 2015
Production:
Oil (MBOD) 33 62
NGL (MBLD) 13 26
Gas (MMCFD) 85 155
MBOED 61 113
E&P Capital (in millions): $51
Operated Rigs (at 9/30/16): 0
Net production averaged 61,000 Boe per day in the third quarter, with liquids accounting for 77% of Eagle Ford volumes.
As previously disclosed, production in Q3 was impacted by the timing of completions related to mechanical issues on ≈35 uncompleted wells. These issues were resolved during the quarter at minimal cost.
Completion activity resumed in Q3 and 7 new wells were tied-in, with 30-day rates averaging a quarterly record of 2,700 Boe per day per well.
Lease Operating Costs Declined >50% from Peak Rates
Devon’s Eagle Ford operations continued to achieve significant cost savings during the quarter. LOE totaled $27 million in Q3, an improvement of >50% compared to peak costs in 2015 (chart below).
Contributing factors to this strong cost performance were lower labor and supply chain expenses.
$55
$46$43 $42
$30$27
Q2 2015 Q3 2015 Q4 2015 Q1 2016 Q2 2016 Q3 2016
>50%IMPROVEMENT
Eagle Ford LOE($ Millions)
Well Name 30-Day IP (BOED)
Arndt A 9H 3,800 (60% oil)
Arndt A 10H 3,200 (60% oil)
Krause C 10H 2,700 (60% oil)
Krause A 13H 2,450 (53% oil)
Q3 TOP WELLS
EAGLE FORD
Q3 2016 OPERATIONS REPORT 17
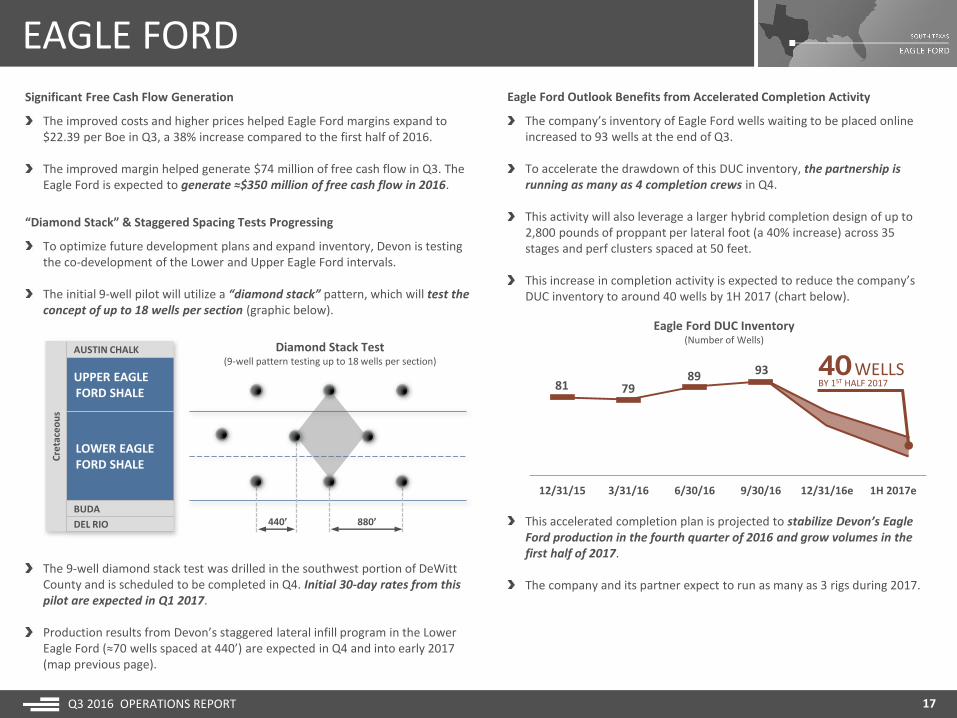
“Diamond Stack” & Staggered Spacing Tests Progressing
To optimize future development plans and expand inventory, Devon is testing the co-development of the Lower and Upper Eagle Ford intervals.
The initial 9-well pilot will utilize a “diamond stack” pattern, which will test the concept of up to 18 wells per section (graphic below).
This accelerated completion plan is projected to stabilize Devon’s Eagle Ford production in the fourth quarter of 2016 and grow volumes in the first half of 2017.
The company and its partner expect to run as many as 3 rigs during 2017.
Significant Free Cash Flow Generation
The improved costs and higher prices helped Eagle Ford margins expand to $22.39 per Boe in Q3, a 38% increase compared to the first half of 2016.
The improved margin helped generate $74 million of free cash flow in Q3. The Eagle Ford is expected to generate ≈$350 million of free cash flow in 2016.
Eagle Ford Outlook Benefits from Accelerated Completion Activity
The company’s inventory of Eagle Ford wells waiting to be placed online increased to 93 wells at the end of Q3.
To accelerate the drawdown of this DUC inventory, the partnership is running as many as 4 completion crews in Q4.
This activity will also leverage a larger hybrid completion design of up to 2,800 pounds of proppant per lateral foot (a 40% increase) across 35 stages and perf clusters spaced at 50 feet.
This increase in completion activity is expected to reduce the company’s DUC inventory to around 40 wells by 1H 2017 (chart below).
Cre
tace
ou
s
AUSTIN CHALK
UPPER EAGLEFORD SHALE
LOWER EAGLEFORD SHALE
BUDA
DEL RIO
Diamond Stack Test(9-well pattern testing up to 18 wells per section)
880’440’
The 9-well diamond stack test was drilled in the southwest portion of DeWitt County and is scheduled to be completed in Q4. Initial 30-day rates from this pilot are expected in Q1 2017.
Production results from Devon’s staggered lateral infill program in the Lower Eagle Ford (≈70 wells spaced at 440’) are expected in Q4 and into early 2017 (map previous page).
81 7989 93
12/31/15 3/31/16 6/30/16 9/30/16 12/31/16e 1H 2017e
Eagle Ford DUC Inventory(Number of Wells)
BY 1ST HALF 2017WELLS

HEAVY OIL
Q3 2016 OPERATIONS REPORT 18
HEAVY OIL Q3 STATSQ3 2016 Q3 2015
Production:
Oil & Bitumen (MBOD) 137 121
Gas (MMCFD) 18 16
MBOED 140 124
E&P Capital (in millions): $26
Operated Rigs (at 9/30/16): 1
Net oil production averaged 137,000 barrels per day in the third quarter, a 13% increase year over year.
Production at Jackfish Complex Exceeds Nameplate Capacity
Production growth during the quarter was driven by Devon’s Jackfish complex where gross production averaged 117,000 barrels per day. This exceeded nameplate capacity for the complex by 11% or 12,000 barrels per day.
Importantly, the capital investment required to sustain production at Jackfish is minimal at only $5 per barrel, or ≈$200 million per year.
Record Low Costs Achieved at Jackfish
At the Jackfish complex, LOE has now declined ≈70% since 2014. Key drivers of this strong result were higher volumes at Jackfish 2 and 3, declining fuel costs, lower labor expense and exchange rates (chart right).
$22.44
$18.15
$14.04
$17.43
$10.10$9.63
$7.87
$10.08
$7.32
Q3 Q4 Q1 Q2 Q3 Q4 Q1 Q2 Q3
Jackfish Complex Unit LOE($/BOE)
≈70%IMPROVEMENT
Jackfish 1Turnaround
Jackfish 2Turnaround
2014 2015 2016
95
117
Q3 2015 Q4 2015 Q1 2016 Q2 2016 Q3 2016
Jackfish Complex Gross Production(MBOD)
23%GROWTH
This strong performance helped cash margins expand to $15 per barrelduring the quarter.

HEAVY OIL
Q3 2016 OPERATIONS REPORT 19
Heavy Oil Business Generating Significant Free Cash Flow
Devon’s heavy oil business is also generating cash flow. In Q3, these assets produced $159 million of free cash flow.
Jackfish 3 Achieving Industry Leading Results
Production at Jackfish 3 exceeded nameplate capacity by 20% in Q3, averaging 42,000 gross barrels per day, or 41,300 barrels per day after royalties.
This performance was driven by strong well productivity and facility uptime of nearly 100%. These factors make Jackfish 3 one of the most efficient thermal oil projects in the industry (chart below).
Jackfish 2 Accelerates to >43,000 Barrels Per Day
Production at Jackfish 2 reached a new facility record in Q3, averaging 43,600 gross barrels per day (net production 42,900 BOD).
The record production at Jackfish 2 was driven by the successful ramp-up of two new well pads, boosting production by 58% since late last year(chart below).
Q4 Outlook: Jackfish Production Growth Continues
In the upcoming fourth quarter, Devon expects net oil production from its heavy oil operations to range between 135,000 and 140,000 barrels per day.
This forecast represents ≈15% growth rate from the fourth quarter of 2015.
27.6
43.6
Q3 2015 Q4 2015 Q1 2016 Q2 2016 Q3 2016
Jackfish 2 Gross Production Ramp-Up(MBOD)
58%GROWTH
(At $45 WTI)Q3 2016($ Millions)
Revenue 299
LOE & Taxes (114)
Cash Margin 185
CapEx (26)
Free Cash Flow 159
Q3 FREE CASH FLOW
MILLIONJackfish 2
Turnaround
New Pad At Jackfish 1 to Drive Growth in Q4
At Jackfish 1, gross production averaged 31,200 barrels per day in the third quarter (net production 31,000 BOD). A new well pad is ramping up and is expected to push production near nameplate capacity by year end.
0
1
2
3
4
5
Steam-to-Oil Ratio Comparison
Source: Industry Regulatory Reporting, July 2016.
Other Industry Projects
Weighted Average: 2.73
Jackfish 3
+26%VS. INDUSTRY AVG.

Barnett Field-Level Operating Costs($ Millions)
BARNETT SHALE
Q3 2016 OPERATIONS REPORT 20
BARNETT SHALE Q3 STATSQ3 2016 Q3 2015
Production:
Oil (MBOD) 1 1
NGL (MBLD) 44 47
Gas (MMCFD) 730 807
MBOED 166 183
E&P Capital (in millions): $5
Operated Rigs (at 9/30/16): 0
Net production averaged 166,000 Boe per day or 1.0 Bcfe per day in the third quarter. Liquids accounted for 27% of the production mix.
The strong base production performance was aided by line pressure reduction projects and improvements in controllable downtime which was limited to a record low of 0.31% during September (chart below).
Future Development Activity to Unlock Significant Value
When conditions incentivize higher activity levels, Devon is prepared to resume its development programs in the Barnett, where the company has identified thousands of low-risk opportunities.
With low operating costs and improved gas prices, Devon’s Barnett properties generated $74 million of free cash flow during the third quarter.
Improving Cost Structure Drives Cash Flow Higher
Devon delivered another strong cost performance by limiting operating expenses in the Barnett to $107 million in Q3. This represents a 17% improvement year over year (chart right).
These LOE savings were achieved through renegotiated compression rates, water disposal savings and declining chemical expenses.
0.72%
0.45%0.42%
0.48%
0.38%
0.50%
0.37%0.32% 0.31%
Jan Feb Mar Apr May Jun Jul Aug Sep
2016 Barnett Controllable Downtime
$129
$107
Q3 2015 Q4 2015 Q1 2016 Q2 2016 Q3 2016
17%IMPROVEMENT

Initial Development Opportunities
Hz. Refrac Undrilled Location
30-Day IP (MMCFED) 1.0 - 1.4 3.0 - 3.5
EUR (BCFE) ≈2.0 ≈3.5
D&C Cost ($MM) $0.9 - 1.0 $2.1
BARNETT SHALE
Q3 2016 OPERATIONS REPORT 21
Future Development Activity to Unlock Significant Value (continued)
Through successful appraisal work over the past few years, Devon has identified an inventory of ≈1,000 high-quality horizontal refracs in the Barnett that can generate attractive returns (table below).
The company has also improved rig-line economics for its 1,500 undrilled locations in the Barnett. Devon now expects D&C costs to be $2.1 million per well with recoveries of 3.5 Bcfe (table above).
Future activity will focus in Denton, Tarrant and Wise counties where Devon has achieved consistent results and attractive returns (map below).
Significant Leverage to Higher Commodity Prices
In addition to the meaningful upside to higher recoveries, the Barnett Shale also has significant leverage to an improving commodity price environment.
Free cash flow in the Barnett can approach $600 million annually at a realized price of $3 per Mcfe (chart below).
$200
$300
$400
$500
$600
$2.00 $2.25 $2.50 $2.75 $3.00
Fre
e C
ash
Flo
w (
$ M
M)
Realized Price ($/Mcfe)
Annualized Cash Flow Sensitivities
FUTURE DEVELOPMENT
ROCKIES OIL
Q3 2016 OPERATIONS REPORT 22
ROCKIES OIL Q3 STATSQ3 2016 Q3 2015
Production:
Oil (MBOD) 11 16
NGL (MBLD) 1 2
Gas (MMCFD) 19 41
MBOED 16 25
E&P Capital (in millions): $8
Operated Rigs (at 9/30/16): 0
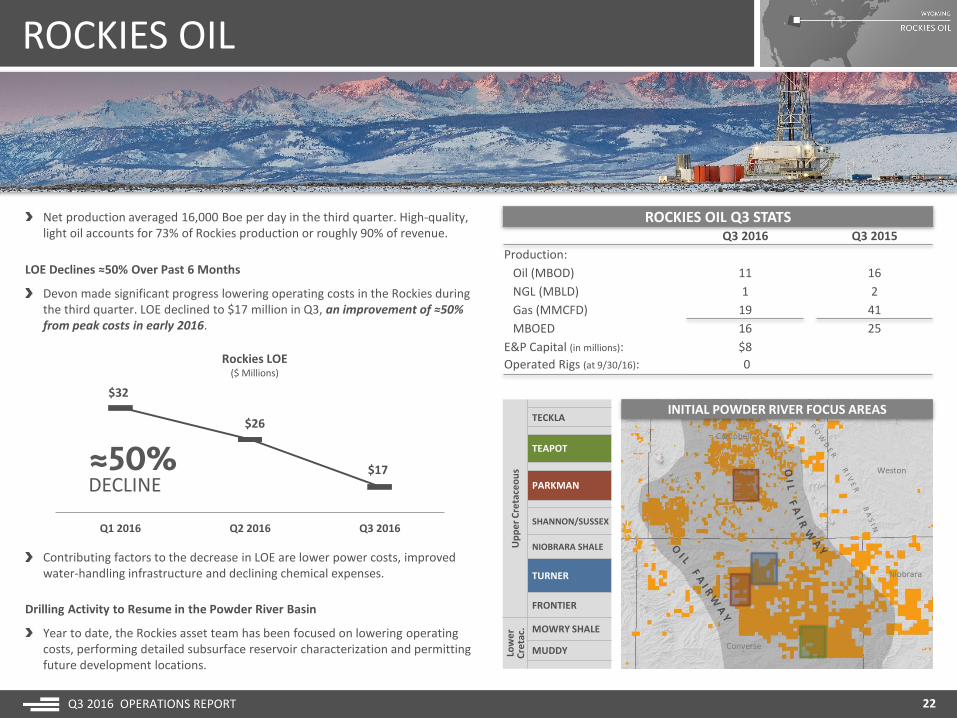
Net production averaged 16,000 Boe per day in the third quarter. High-quality, light oil accounts for 73% of Rockies production or roughly 90% of revenue.
LOE Declines ≈50% Over Past 6 Months
Devon made significant progress lowering operating costs in the Rockies during the third quarter. LOE declined to $17 million in Q3, an improvement of ≈50% from peak costs in early 2016.
$32
$26
$17
Q1 2016 Q2 2016 Q3 2016
Rockies LOE($ Millions)
≈50%DECLINE
Contributing factors to the decrease in LOE are lower power costs, improved water-handling infrastructure and declining chemical expenses.
Drilling Activity to Resume in the Powder River Basin
Year to date, the Rockies asset team has been focused on lowering operating costs, performing detailed subsurface reservoir characterization and permitting future development locations.
Up
pe
r C
reta
ceo
us
TECKLA
TEAPOT
PARKMAN
SHANNON/SUSSEX
NIOBRARA SHALE
TURNER
FRONTIER
Low
er
Cre
tac. MOWRY SHALE
MUDDY
INITIAL POWDER RIVER FOCUS AREAS

ROCKIES OIL
Q3 2016 OPERATIONS REPORT 23
Rockies Development Activity to Deliver Attractive Returns
Incremental rig-line economics in the Powder River oil fairway are attractive at today’s prices and are very competitive with the company’s other U.S. resource plays. Given the high oil content, project economics have tremendous upside with the improvement in oil prices (chart below).
Drilling Activity to Resume in the Powder River Basin (continued)
This work has prepared Devon to resume drilling operations in the Powder River during Q4 with an operated rig. This drilling activity will target the Parkman, Teapot and Turner formations (map previous page).
Depending upon target formation and lateral length, D&C costs are expected to range from $6 million to $7.5 million per well, with average EURs trending 500 to 900 MBOE per well.
Powder River Basin – A Significant Resource Opportunity
The Powder River oil fairway is a significant resource opportunity in Devon’s portfolio with several billion barrels of resource in place across the basin. Adding up the prospective leasehold by the Teapot, Parkman and Turner formations, the company has exposure to ≈400,000 net effective acres.
While appraisal activity is required to delineate the full extent of the oil fairway, Devon has identified 200 development locations that are capable of delivering competitive returns in Devon’s portfolio at a $50 oil price.
Formation>20% IRR Locationsat $50 Oil
Teapot 35
Parkman 55
Turner 110
200
Note: assumes $50/Bbl oil price. Returns burdened for taxes and overhead.
HIGH RETURN INVENTORY
RATE OFRETURN
UNDRILLEDLOCATIONS
This top-tier inventory in the Powder River Basin is expected to increase over time as the company deploys additional activity to de-risk the oil fairway.
Devon will also leverage its proprietary seismic data, which covers more than 4,000 square miles, to further advance the understanding of the conventional stacked-pay potential in this region.
0%
25%
50%
Turner Parkman Teapot
IRR
(A
TAX
w/o
verh
ead
)
Incremental Development Returns(At $50 Oil)
INVESTOR NOTICES & RISK FACTORS
Q3 2016 OPERATIONS REPORT 24
Forward-Looking StatementsThis presentation includes "forward-looking statements" as defined by the Securities and Exchange Commission (the “SEC”). Such statements include those concerningstrategic plans, expectations and objectives for future operations, and are often identified by use of the words “expects,” “believes,” “will,” “would,” “could,”“forecasts,” “projections,” “estimates,” “plans,” “expectations,” “targets,” “opportunities,” “potential,” “anticipates,” “outlook” and other similar terminology. Allstatements, other than statements of historical facts, included in this presentation that address activities, events or developments that the Company expects, believesor anticipates will or may occur in the future are forward-looking statements. Such statements are subject to a number of assumptions, risks and uncertainties, manyof which are beyond the control of the Company. Statements regarding our business and operations are subject to all of the risks and uncertainties normally incidentto the exploration for and development and production of oil and gas. These risks include, but are not limited to: the volatility of oil, gas and NGL prices, including thecurrently depressed commodity price environment; uncertainties inherent in estimating oil, gas and NGL reserves; the extent to which we are successful in acquiringand discovering additional reserves; the uncertainties, costs and risks involved in exploration and development activities; risks related to our hedging activities;counterparty credit risks; regulatory restrictions, compliance costs and other risks relating to governmental regulation, including with respect to environmentalmatters; risks relating to our indebtedness; our ability to successfully complete mergers, acquisitions and divestitures; the extent to which insurance covers any losseswe may experience; our limited control over third parties who operate our oil and gas properties; midstream capacity constraints and potential interruptions inproduction; competition for leases, materials, people and capital; cyberattacks targeting our systems and infrastructure; and any of the other risks and uncertaintiesidentified in our Form 10-K and our other filings with the SEC. Investors are cautioned that any such statements are not guarantees of future performance and thatactual results or developments may differ materially from those projected in the forward-looking statements. The forward-looking statements in this presentation aremade as of the date of this presentation, even if subsequently made available by Devon on its website or otherwise. Devon does not undertake any obligation toupdate the forward-looking statements as a result of new information, future events or otherwise.
Use of Non-GAAP InformationThis presentation may include non-GAAP financial measures. Such non-GAAP measures are not alternatives to GAAP measures, and you should not consider thesenon-GAAP measures in isolation or as a substitute for analysis of our results as reported under GAAP. For additional disclosure regarding such non-GAAP measures,including reconciliations to their most directly comparable GAAP measure, please refer to Devon’s third-quarter 2016 earnings release at www.devonenergy.com.
Cautionary Note to InvestorsThe SEC permits oil and gas companies, in their filings with the SEC, to disclose only proved, probable and possible reserves that meet the SEC's definitions for suchterms, and price and cost sensitivities for such reserves, and prohibits disclosure of resources that do not constitute such reserves. This release may contain certainterms, such as resource potential, potential locations, risk and unrisked locations, estimated ultimate recovery (EUR), exploration target size and other similar terms.These estimates are by their nature more speculative than estimates of proved, probable and possible reserves and accordingly are subject to substantially greater riskof being actually realized. The SEC guidelines strictly prohibit us from including these estimates in filings with the SEC. Investors are urged to consider closely thedisclosure in our Form 10-K, available at www.devonenergy.com. You can also obtain this form from the SEC by calling 1-800-SEC-0330 or from the SEC’s website atwww.sec.gov.