Embed Size (px)
Citation preview

November 16, 2016
Q3 2016 Earnings Conference Call

WARDED2014\7. Analyst Presentation\Cruise_AP_v31.pptx
22
Safe Harbor Statement
This material contains forward-looking statements. These statements constitute “forward-looking” statements within the meaning of Section
21E of the Securities Exchange Act of 1934, as amended, and as defined in the U.S. Private Securities Litigation Reform Act of 1995. These
forward-looking statements can be identified by terminology such as “will,” “expects,” “anticipates,” “future,” “intends,” “plans,” “believes,”
“estimates,” “target,” “confident” and similar statements.
Such statements are based upon management’s current expectations and current market and operating conditions, and relate to events that
involve known or unknown risks, uncertainties and other factors, all of which are difficult to predict and many of which are
beyond Yirendai’s control. Forward-looking statements involve risks, uncertainties and other factors that could cause actual results to differ
materially from those contained in any such statements.
Potential risks and uncertainties include, but are not limited to, uncertainties as to Yirendai’s ability to attract and retain borrowers and
investors on its marketplace, its ability to introduce new loan products and platform enhancements, its ability to compete effectively, PRC
regulations and policies relating to the peer-to-peer lending service industry in China, general economic conditions in China, and Yirendai’s
ability to meet the standards necessary to maintain listing of its ADSs on the NYSE or other stock exchange, including its ability to cure any
non-compliance with the NYSE’s continued listing criteria.
Further information regarding these and other risks, uncertainties or factors is included in Yirendai’s filings with the U.S. Securities and
Exchange Commission. All information provided in this material is as of the date of this material, and Yirendai does not undertake any
obligation to update any forward-looking statement as a result of new information, future events or otherwise, except as required under
applicable law.

Offering borrowers in China easy
access to unsecured credit and
investors an attractive investment
opportunity, by connecting them
directly through our online
marketplace
Our Mission
3
WARDED2014\7. Analyst Presentation\Cruise_AP_v31.pptx
44
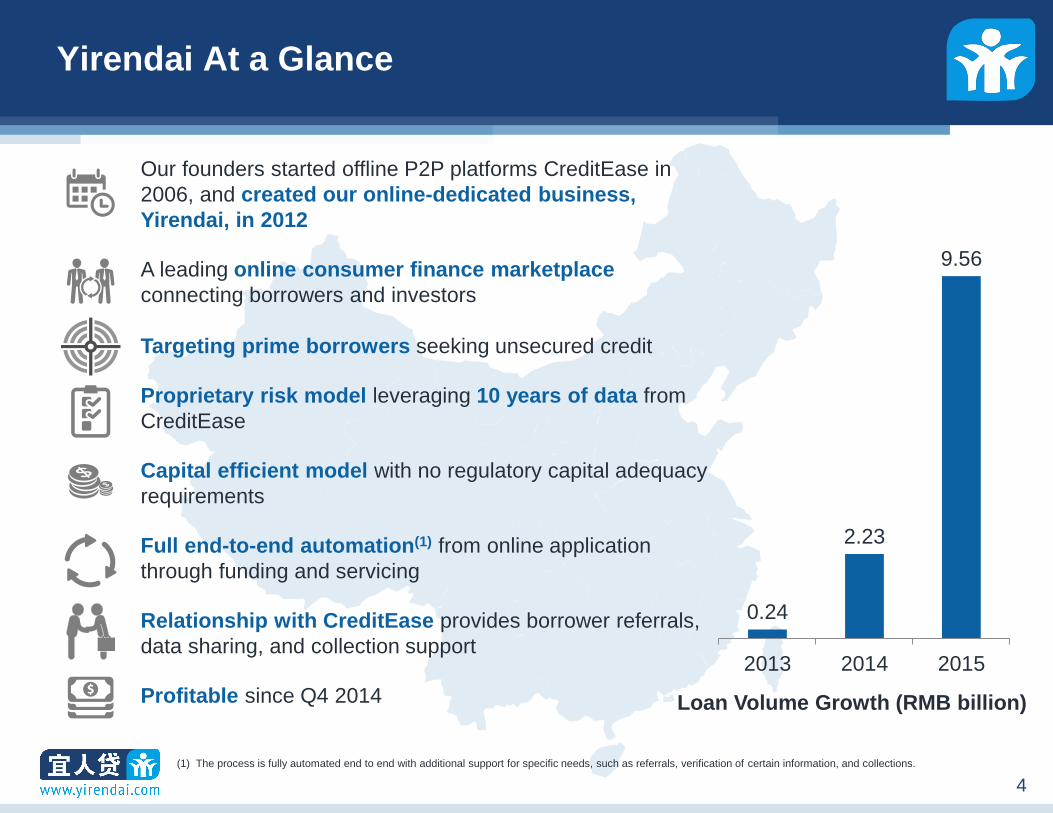
Yirendai At a Glance
Loan Volume Growth (RMB billion)
(1) The process is fully automated end to end with additional support for specific needs, such as referrals, verification of certain information, and collections.
Our founders started offline P2P platforms CreditEase in
2006, and created our online-dedicated business,
Yirendai, in 2012
A leading online consumer finance marketplace
connecting borrowers and investors
Targeting prime borrowers seeking unsecured credit
Proprietary risk model leveraging 10 years of data from
CreditEase
Capital efficient model with no regulatory capital adequacy
requirements
Full end-to-end automation(1) from online application
through funding and servicing
Relationship with CreditEase provides borrower referrals,
data sharing, and collection support
Profitable since Q4 2014
0.24
2.23
9.56
2013 2014 2015
WARDED2014\7. Analyst Presentation\Cruise_AP_v31.pptx
55
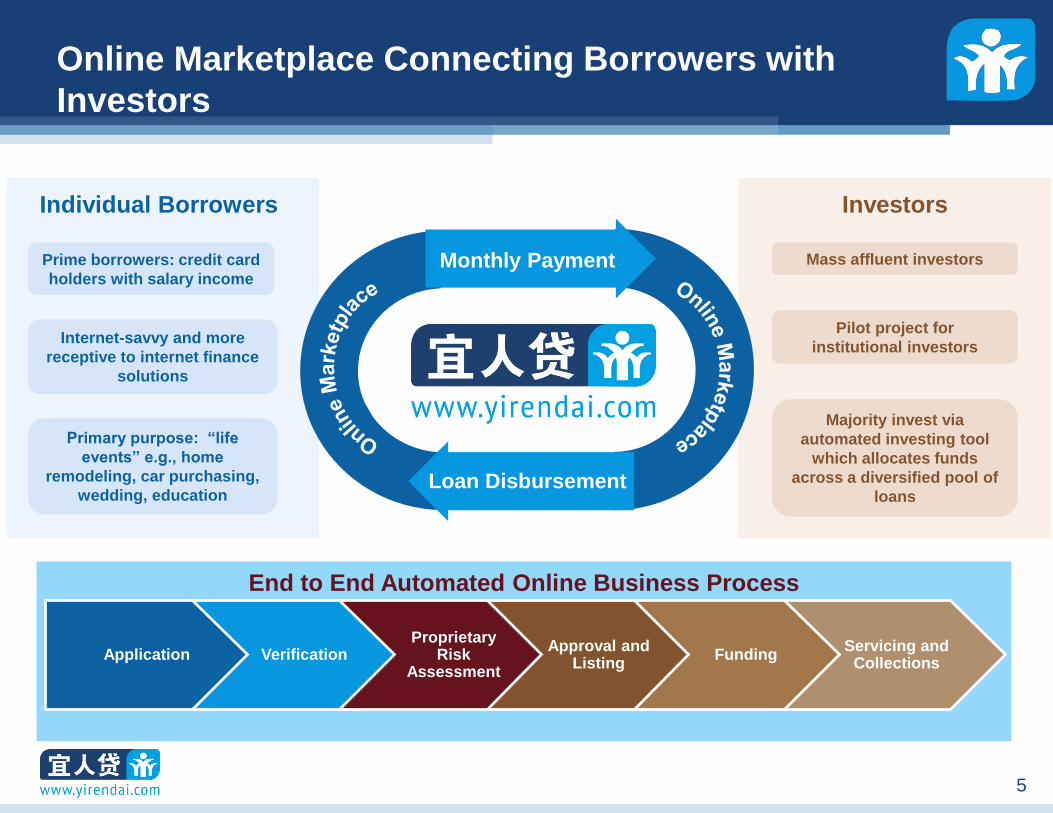
Online Marketplace Connecting Borrowers with
Investors
Application VerificationProprietary
Risk Assessment
Approval and Listing
FundingServicing and
Collections
End to End Automated Online Business Process
InvestorsIndividual Borrowers
Loan Disbursement
Monthly PaymentPrime borrowers: credit card
holders with salary income
Internet-savvy and more
receptive to internet finance
solutions
Primary purpose: “life
events” e.g., home
remodeling, car purchasing,
wedding, education
Mass affluent investors
Pilot project for
institutional investors
Majority invest via
automated investing tool
which allocates funds
across a diversified pool of
loans
WARDED2014\7. Analyst Presentation\Cruise_AP_v31.pptx
66
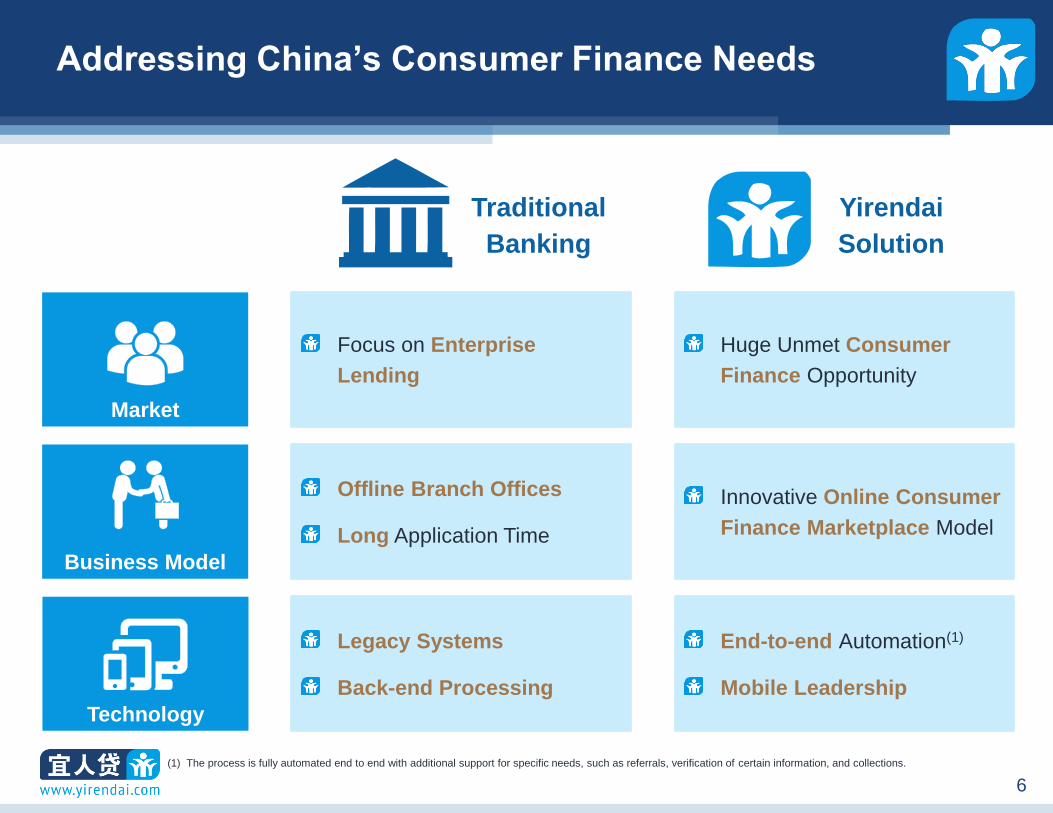
Addressing China’s Consumer Finance Needs
Market
Technology
Business Model
Offline Branch Offices
Long Application Time
Focus on Enterprise
Lending
Legacy Systems
Back-end Processing
Innovative Online Consumer
Finance Marketplace Model
Huge Unmet Consumer
Finance Opportunity
End-to-end Automation(1)
Mobile Leadership
Traditional
Banking
Yirendai
Solution
(1) The process is fully automated end to end with additional support for specific needs, such as referrals, verification of certain information, and collections.

WARDED2014\7. Analyst Presentation\Cruise_AP_v31.pptx
77
Capital Efficient Marketplace Model
No Regulatory Capital
Adequacy or Liquidity
Requirements
No Co-Investing
No Deposits Matched Assets and
Liabilities

Investment Highlights
WARDED2014\7. Analyst Presentation\Cruise_AP_v31.pptx
99
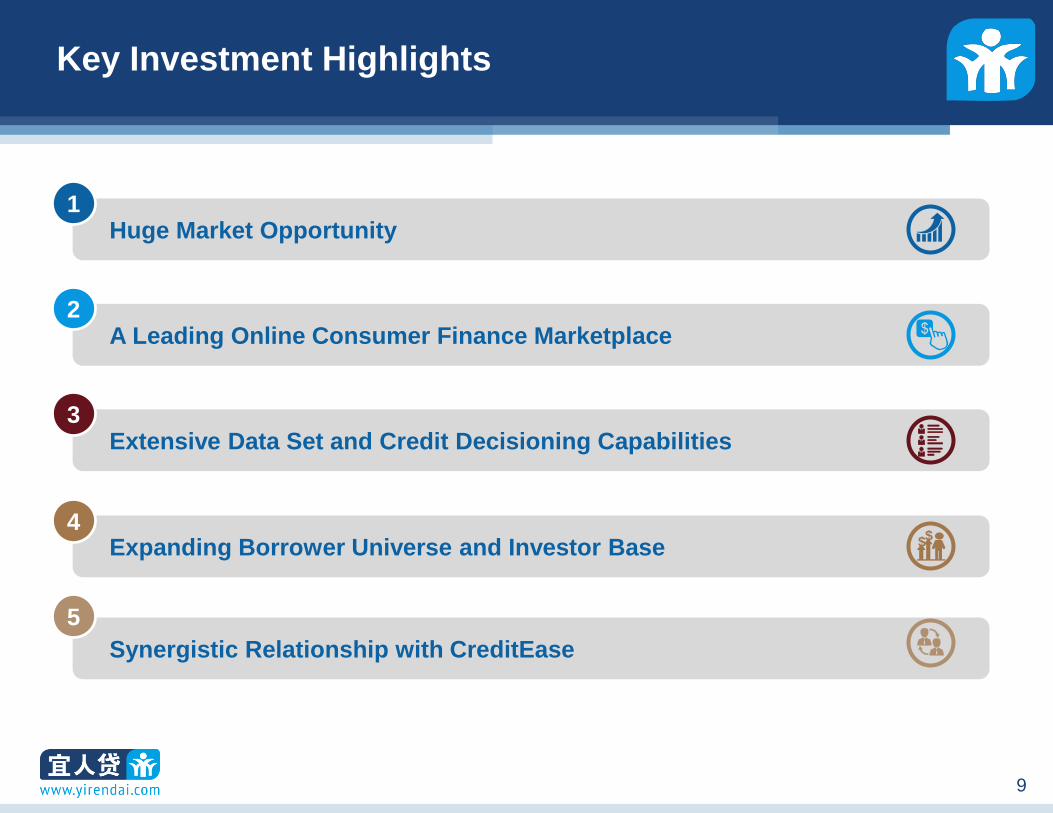
Key Investment Highlights
Huge Market Opportunity
A Leading Online Consumer Finance Marketplace
Extensive Data Set and Credit Decisioning Capabilities
Expanding Borrower Universe and Investor Base$$
Synergistic Relationship with CreditEase
1
2
3
4
5

WARDED2014\7. Analyst Presentation\Cruise_AP_v31.pptx
1010
Unsecured Consumer Finance Market in China (1)
4,353
12,330
2015 2019E
(By outstanding loan balance, RMB Billion)
Huge Unsecured Consumer Finance Market (1)1
Source: iResearch
(1) Outstanding balance of unsecured consumption loans in China, such as credit cards and other unsecured loans from banks and other consumer financing companies.
Immediately addressable market:
prime borrowers with unmet
unsecured credit needs
• RMB 4.4 trillion in 2015
Future target market may extend
to broader unmet unsecured credit
needs
• New borrower groups beyond
prime borrowers
• New industry verticals
• Other unsecured loan
products

WARDED2014\7. Analyst Presentation\Cruise_AP_v31.pptx
1111
51.6%
86.1%
(2015 Consumption as % of GDP)
54.4%
78.4%
2015
(2015 Consumption Loan Balance(1) as a %
of Consumption)
Multiple Drivers of Growth
Rising GDP
7.9
55.8
China U.S.
(2015 GDP per Capita, US$‘000)
Source: World Bank Source: CIA World FactBook Source: National Bureau of Statistics of China, CIA World
FactBook, iResearch and Federal Reserve Bank
of New York
1
More ConsumptionMore Financing of
Consumption+ +
(1) Consists of secured consumption loans such as car loans and home mortgages, and unsecured consumption loans such as credit cards and other unsecured loans from
banks and consumer financing companies

WARDED2014\7. Analyst Presentation\Cruise_AP_v31.pptx
1212
(1) From inception in March 2012 through September 30, 2016
(2) As of September 30, 2016
92,479
New Borrowers
in Q3 2016
RMB
25.7 Billion
Cumulative Loan
Facilitations (1)
2 A Leading Online Consumer Finance Marketplace
171,460
New Investors
in Q3 2016
RMB
17.0 Billion
Remaining Principal of
Performing Loans (2)
WARDED2014\7. Analyst Presentation\Cruise_AP_v31.pptx
1313
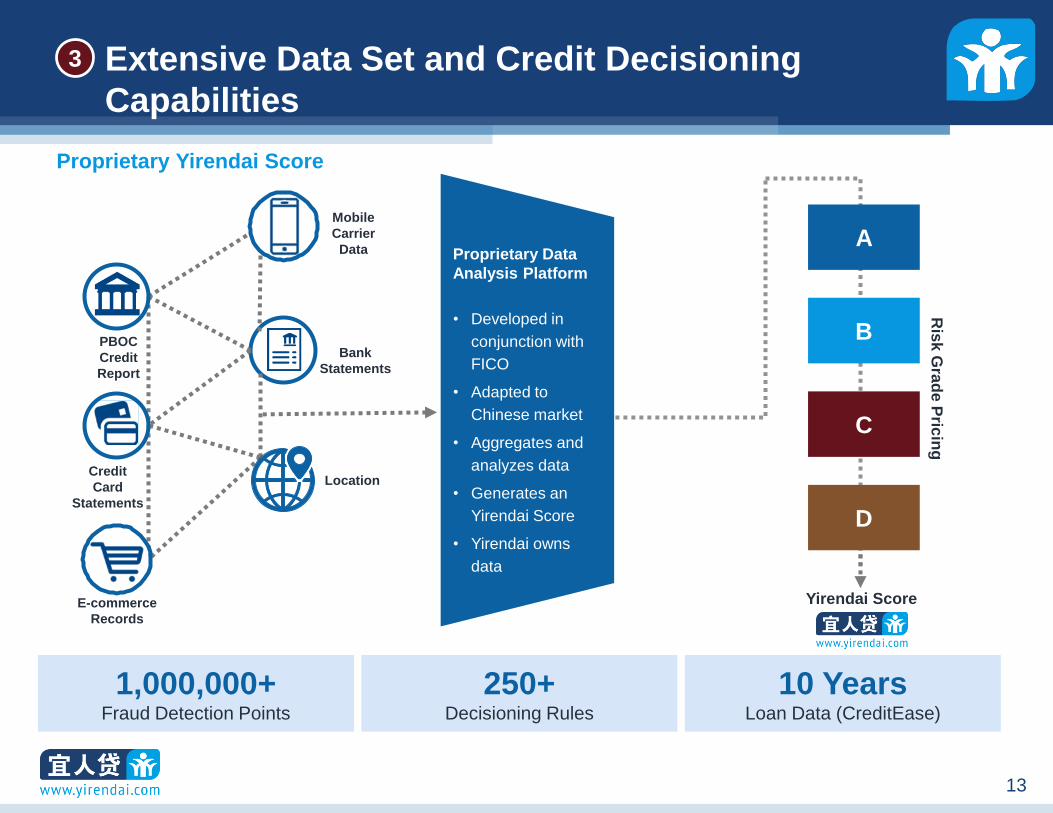
E-commerce
Records
Credit
Card
Statements
Bank
Statements
Location
Mobile
Carrier
DataA
B
C
D
Yirendai Score
PBOC
Credit
Report
Ris
k G
rad
e P
ricin
g
Proprietary Yirendai Score
10 YearsLoan Data (CreditEase)
1,000,000+Fraud Detection Points
250+Decisioning Rules
Proprietary Data
Analysis Platform
• Developed in
conjunction with
FICO
• Adapted to
Chinese market
• Aggregates and
analyzes data
• Generates an
Yirendai Score
• Yirendai owns
data
Extensive Data Set and Credit Decisioning
Capabilities
3
WARDED2014\7. Analyst Presentation\Cruise_AP_v31.pptx
1414
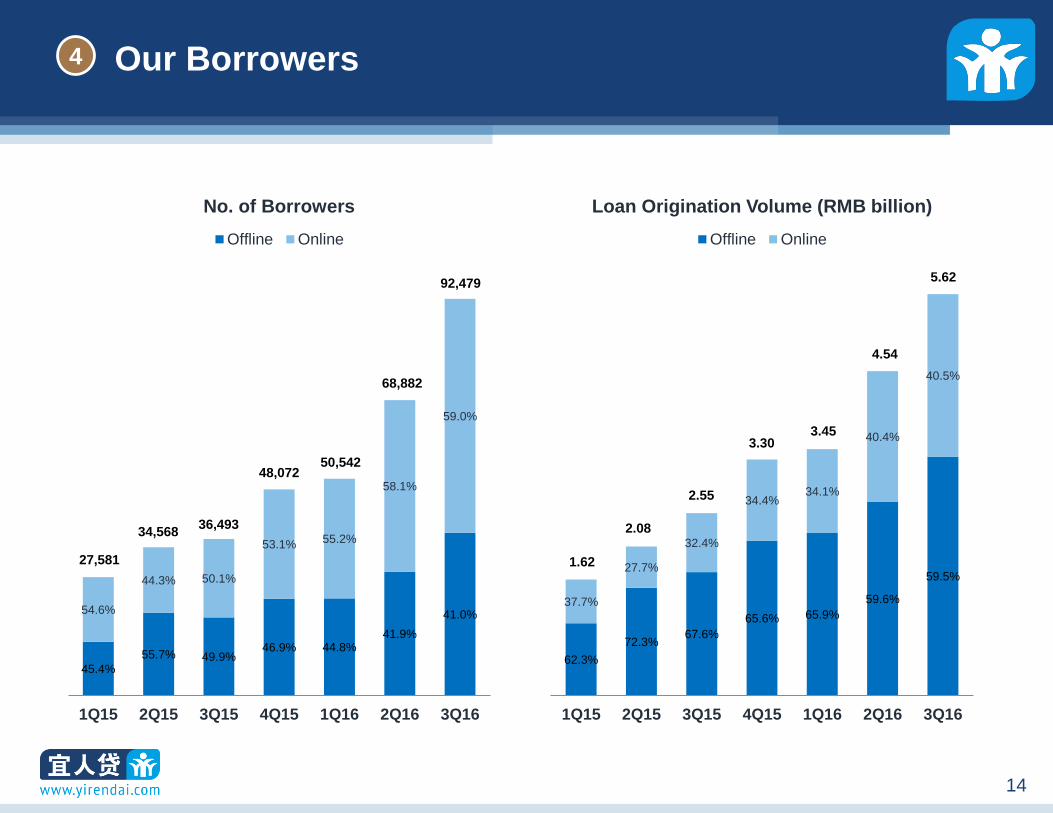
Our Borrowers
45.4%
55.7% 49.9%46.9% 44.8%
41.9%
41.0%54.6%
44.3% 50.1%
53.1% 55.2%
58.1%
59.0%
1Q15 2Q15 3Q15 4Q15 1Q16 2Q16 3Q16
No. of Borrowers
Offline Online
27,581
34,56836,493
48,07250,542
68,882
92,479
62.3%
72.3%67.6%
65.6% 65.9%
59.6%
59.5%
37.7%
27.7%
32.4%
34.4%34.1%
40.4%
40.5%
1Q15 2Q15 3Q15 4Q15 1Q16 2Q16 3Q16
Loan Origination Volume (RMB billion)
Offline Online
1.62
2.08
2.55
3.303.45
4.54
5.62
4

WARDED2014\7. Analyst Presentation\Cruise_AP_v31.pptx
1515
Synergistic Relationship with CreditEase
Current model suitable for nascent Chinese unsecured consumer finance market
Receive borrower referrals
from CreditEase’s sales
network across 200+
locations in China
Leverage CreditEase’s loan
data to help advance
Yirendai’s risk algorithms
Utilize CreditEase’s
collections team
5
30,000 sales personnel 3,000,000+ borrowers

Financial Highlights

WARDED2014\7. Analyst Presentation\Cruise_AP_v31.pptx
1717
Financial Highlights
Marketplace Model
Disciplined Growth of Loan Facilitations
Sophisticated Risk Pricing Product Portfolio
Robust Growth and Profitability
Proven Credit Performance
1
2
3
4
5
Business Outlook6

WARDED2014\7. Analyst Presentation\Cruise_AP_v31.pptx
1818
Marketplace Model1
Principal + Interest
Transaction Fees Service Fees
Loans
Borrowers Investors
Monthly management fee charged
to investors for using the automated
investing tool and the self-directed
investing tool
Service Fees from Investors
2
Charged to borrowers for loan
facilitation services
Based upon the pricing and amount of
the underlying loan
Transaction Fees from Borrowers
1
Includes penalty fees for
prepayment and late payment, and
other service fees
Secondary market transaction fee
Other Revenue
3

WARDED2014\7. Analyst Presentation\Cruise_AP_v31.pptx
1919
170252
686
1,121
1,621
2,084
2,551
3,3023,447
4,539
5,617
0
1,000
2,000
3,000
4,000
5,000
6,000
1Q14 2Q14 3Q14 4Q14 1Q15 2Q15 3Q15 4Q15 1Q16 2Q16 3Q16
Disciplined Growth of Loan Facilitations2
(RMB Million)

WARDED2014\7. Analyst Presentation\Cruise_AP_v31.pptx
2020
Q3 2016 Loan Facilitation Breakdown3
BVery Good
Credit
4.7% 17.3%
AExcellent
Credit
7.0% 5.6%
DFair
Credit
79.4% 27.6%
CGood
Credit
8.9% 24.8%
Average Transaction Fee Rate (1)% Q3 2016 Loan Facilitation Volume
(1) The transaction fee rate is calculated as the total transaction fee that we charge borrowers for the entire life of the loan, divided by the total amount of principal. The
average transaction fee rate presented in the table above is the simple average of the transaction fee rates for loans falling under the same pricing grade, but with different
tenures and repayment schedules

WARDED2014\7. Analyst Presentation\Cruise_AP_v31.pptx
2121
Net Revenue Growth4
196.5
1,313.6
0.0
200.0
400.0
600.0
800.0
1,000.0
1,200.0
1,400.0
2014 2015
Annual
12.7 18.5 49.8
115.6
185.2
306.2
370.7
451.6
556.4
733.8
876.7
0.0
100.0
200.0
300.0
400.0
500.0
600.0
700.0
800.0
900.0
1Q14 2Q14 3Q14 4Q14 1Q15 2Q15 3Q15 4Q15 1Q16 2Q16 3Q16
Quarterly
(RMB Million) (RMB Million)

WARDED2014\7. Analyst Presentation\Cruise_AP_v31.pptx
2222
Adjusted EBITDA4
(26.5)
402.7
(60.0)
0.0
60.0
120.0
180.0
240.0
300.0
360.0
420.0
2014 2015
Annual Quarterly
(RMB Million) (RMB Million)
Adjusted EBITDA Margin (%) (1)
(13.5) 30.7 28.0(176.9) (178.3) (22.7) 34.7 20.2 36.4 34.3
(22.4)(32.9)
(11.3)
40.1 37.4
111.6 127.2 126.5
206.6
265.0
220.7
(40.0)
0.0
40.0
80.0
120.0
160.0
200.0
240.0
280.0
1Q14 2Q14 3Q14 4Q14 1Q15 2Q15 3Q15 4Q15 1Q16 2Q16 3Q16
37.1 36.1 25.2
(1) The adjusted EBITDA margin is calculated as adjusted EBITDA divided by total net revenue.

WARDED2014\7. Analyst Presentation\Cruise_AP_v31.pptx
2323
Net Income4
(27.7)
275.3
(100.0)
(50.0)
0.0
50.0
100.0
150.0
200.0
250.0
300.0
2014 2015
Annual Quarterly
(RMB Million) (RMB Million)
(14.1)
Net Income Margin (%) (1)
21.0 (178.4) (179.5) (23.4) 34.4 14.9 26.1 22.8 18.4
(22.6) (33.2)(11.6)
39.7 27.6
80.0 84.4 83.3
131.7
260.6
344.3
(50.0)
0.0
50.0
100.0
150.0
200.0
250.0
1Q14 2Q14 3Q14 4Q14 1Q15 2Q15 3Q15 4Q15 1Q16 2Q16 3Q16
35.5 39.323.7
(1) The net income margin is calculated as net income divided by total net revenue.

WARDED2014\7. Analyst Presentation\Cruise_AP_v31.pptx
2424
Proven Credit Performance5
Cumulative M3+ Net Charge Off Rates (1) (2)
Loans Facilitated Before 2015 (Guarantee Model) (3)
(1) As of September 30, 2016
(2) “M3+ Net Charge Off Rate”, with respect to loans facilitated during a specified time period, which we refer to as a vintage, as the difference between (i) the total balance
of outstanding principal of loans that become over three months delinquent during a specified period and the remainder of the expected interest for the life of such loans,
and (ii) the total amount of recovered past due payments of principal and accrued interest in the same period with respect to all loans in the same vintage that have ever
become over three months delinquent, divided by (iii) the total initial principal of the loans facilitated in such vintage.
(3) Before January 2015, Yirendai worked with a guarantee company to provide investors with the option of purchasing the assurance that their principal and interest would
be repaid if their loans defaulted, and the guarantee company charged investors 10% of the loan interest for the guarantee service.
(Months)0.0%
2.0%
4.0%
6.0%
8.0%
10.0%
12.0%
14.0%
4 5 6 7 8 9 10 11 12 13 14 15 16 17 18 19 20 21 22 23 24 25 26 27 28 29 30 31 32 33 34 35 36
2013Q1 2013Q2 2013Q3 2013Q4 2014Q1 2014Q2 2014Q3 2014Q4

WARDED2014\7. Analyst Presentation\Cruise_AP_v31.pptx
2525
Proven Credit Performance5
Cumulative M3+ Net Charge Off Rates (1) (2)
Loans Facilitated Since 2015 (Risk Reserve Model) (3)
(1) As of September 30, 2016
(2) “M3+ Net Charge Off Rate”, with respect to loans facilitated during a specified time period, which we refer to as a vintage, as the difference between (i) the total balance
of outstanding principal of loans that become over three months delinquent during a specified period and the remainder of the expected interest for the life of such loans,
and (ii) the total amount of recovered past due payments of principal and accrued interest in the same period with respect to all loans in the same vintage that have ever
become over three months delinquent, divided by (iii) the total initial principal of the loans facilitated in such vintage.
(3) In January 2015, Yirendai launched the risk reserve fund arrangement, under which we set aside a certain amount of cash at the inception of each loan in an interest-
bearing custody account. If a loan originated on or after January 1, 2015 defaults, we will withdraw funds from the risk reserve fund to repay the principal and accrued
interest for the defaulted loan, unless the risk reserve fund is depleted.
(Months)0.0%
2.0%
4.0%
6.0%
8.0%
10.0%
12.0%
14.0%
4 5 6 7 8 9 10 11 12 13 14 15 16 17 18 19 20 21 22 23 24
2015Q1 2015Q2 2015Q3 2015Q4 2016Q1 2016Q2
WARDED2014\7. Analyst Presentation\Cruise_AP_v31.pptx
2626
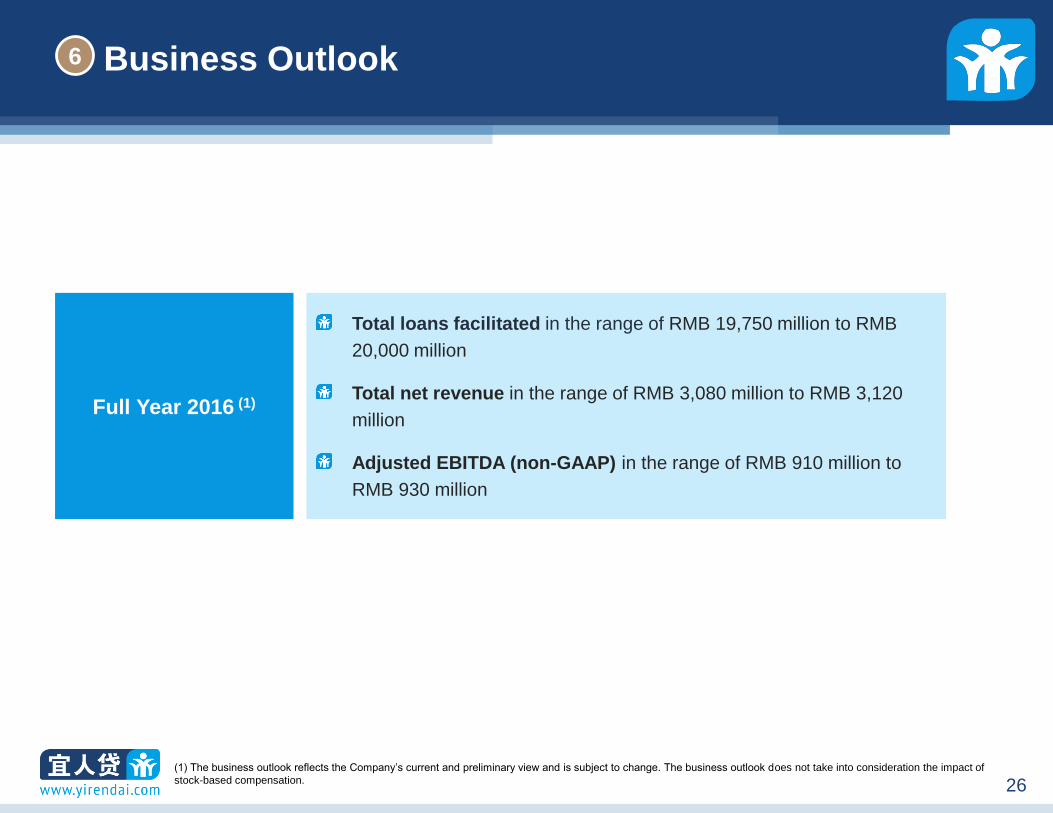
Business Outlook6
Full Year 2016 (1)
Total loans facilitated in the range of RMB 19,750 million to RMB
20,000 million
Total net revenue in the range of RMB 3,080 million to RMB 3,120
million
Adjusted EBITDA (non-GAAP) in the range of RMB 910 million to
RMB 930 million
(1) The business outlook reflects the Company’s current and preliminary view and is subject to change. The business outlook does not take into consideration the impact of
stock-based compensation.

Appendix

WARDED2014\7. Analyst Presentation\Cruise_AP_v31.pptx
2828
Income Statement
Unaudited Condensed Consolidated Statement of Operations
(in thousands, except for share, per share and per ADS data, and percentages)
For the Three Months Ended For the Nine Months Ended
September
30, 2015
June 30,
2016
September
30, 2016
September
30, 2016
September
30, 2015
September
30, 2016
September
30, 2016
RMB RMB RMB USD RMB RMB USD
Net revenue:
Loan facilitation services 362,080 713,383 848,322 127,213 842,389 2,096,793 314,432
Post-origination services 5,671 17,232 23,487 3,522 14,500 59,115 8,865
Others 2,909 3,176 4,902 735 5,134 10,973 1,645
Total net revenue 370,660 733,791 876,711 131,470 862,023 2,166,881 324,942
Operating costs and expenses:
Sales and marketing 182,350 355,246 423,003 63,433 436,656 1,033,085 154,920
Origination and servicing 27,415 42,653 62,449 9,364 59,012 141,856 21,273
General and administrative 34,599 73,330 188,961 28,336 92,305 322,397 48,346
Total operating costs and expenses 244,364 471,229 674,413 101,133 587,973 1,497,338 224,539
Interest income 1,435 7,253 9,778 1,466 1,685 22,065 3,309
Non operating income, net - 91 259 39 - 350 53
Income before provision for income taxes 127,731 269,906 212,335 31,842 275,735 691,958 103,765
Income tax expense 43,287 9,286 (131,946) (19,786) 83,686 (44,659) (6,697)
Net income 84,444 260,620 344,281 51,628 192,049 736,617 110,462
WARDED2014\7. Analyst Presentation\Cruise_AP_v31.pptx
2929
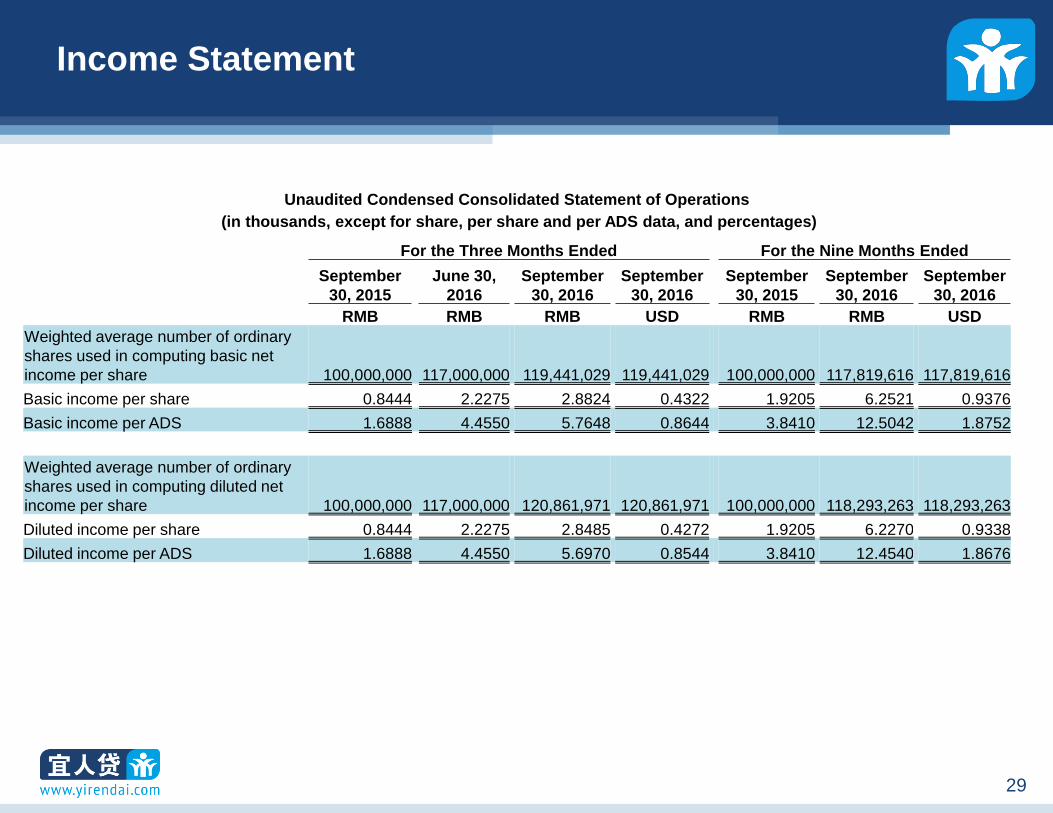
Income Statement
Unaudited Condensed Consolidated Statement of Operations
(in thousands, except for share, per share and per ADS data, and percentages)
For the Three Months Ended For the Nine Months Ended
September
30, 2015
June 30,
2016
September
30, 2016
September
30, 2016
September
30, 2015
September
30, 2016
September
30, 2016
RMB RMB RMB USD RMB RMB USD
Weighted average number of ordinary
shares used in computing basic net
income per share 100,000,000 117,000,000 119,441,029 119,441,029 100,000,000 117,819,616 117,819,616
Basic income per share 0.8444 2.2275 2.8824 0.4322 1.9205 6.2521 0.9376
Basic income per ADS 1.6888 4.4550 5.7648 0.8644 3.8410 12.5042 1.8752
Weighted average number of ordinary
shares used in computing diluted net
income per share 100,000,000 117,000,000 120,861,971 120,861,971 100,000,000 118,293,263 118,293,263
Diluted income per share 0.8444 2.2275 2.8485 0.4272 1.9205 6.2270 0.9338
Diluted income per ADS 1.6888 4.4550 5.6970 0.8544 3.8410 12.4540 1.8676
WARDED2014\7. Analyst Presentation\Cruise_AP_v31.pptx
3030
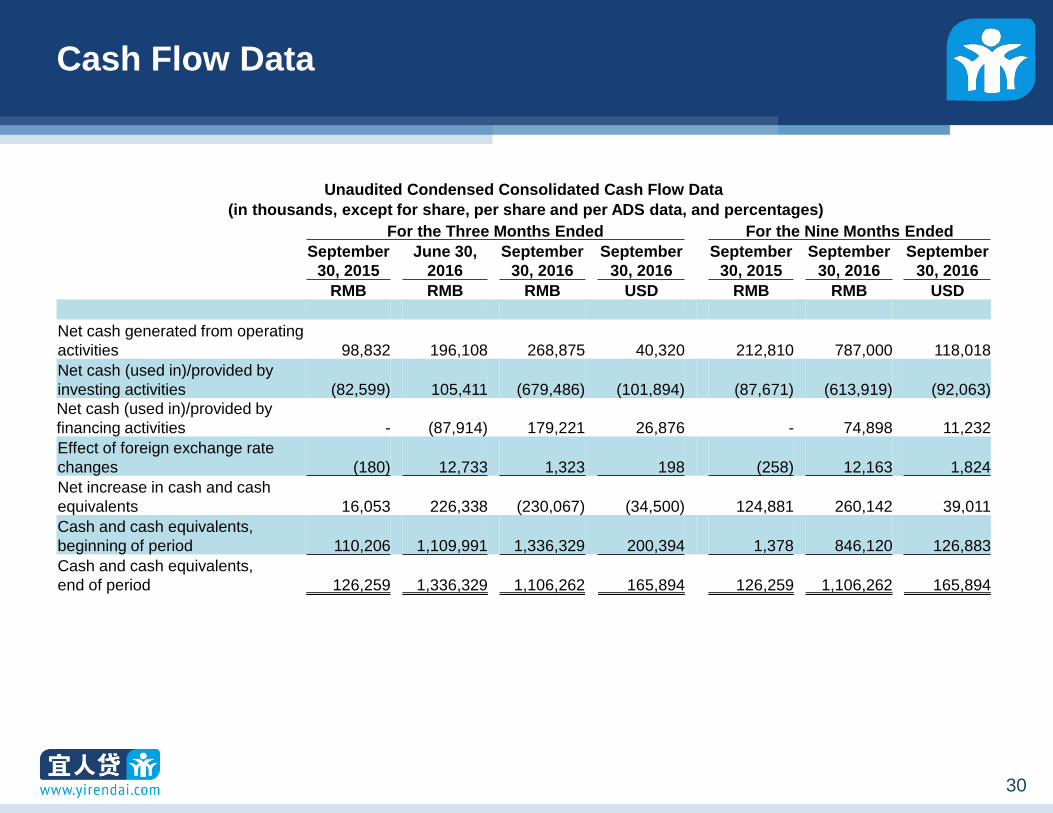
Cash Flow Data
Unaudited Condensed Consolidated Cash Flow Data
(in thousands, except for share, per share and per ADS data, and percentages)
For the Three Months Ended For the Nine Months Ended
September
30, 2015
June 30,
2016
September
30, 2016
September
30, 2016
September
30, 2015
September
30, 2016
September
30, 2016
RMB RMB RMB USD RMB RMB USD
Net cash generated from operating
activities 98,832 196,108 268,875 40,320 212,810 787,000 118,018
Net cash (used in)/provided by
investing activities (82,599) 105,411 (679,486) (101,894) (87,671) (613,919) (92,063)
Net cash (used in)/provided by
financing activities - (87,914) 179,221 26,876 - 74,898 11,232
Effect of foreign exchange rate
changes (180) 12,733 1,323 198 (258) 12,163 1,824
Net increase in cash and cash
equivalents 16,053 226,338 (230,067) (34,500) 124,881 260,142 39,011
Cash and cash equivalents,
beginning of period 110,206 1,109,991 1,336,329 200,394 1,378 846,120 126,883
Cash and cash equivalents,
end of period 126,259 1,336,329 1,106,262 165,894 126,259 1,106,262 165,894

WARDED2014\7. Analyst Presentation\Cruise_AP_v31.pptx
3131
Balance Sheet
Unaudited Condensed Balance Sheet
(in thousands, except for share, per share and per ADS data, and percentages)
For the Three Months Ended For the Nine Months Ended
September
30, 2015
June 30,
2016
September
30, 2016
September
30, 2016
September
30, 2015
September
30, 2016
September
30, 2016
RMB RMB RMB USD RMB RMB USD
Cash and cash equivalents 126,259 1,336,329 1,106,262 165,894 126,259 1,106,262 165,894
Restricted cash 313,766 792,637 974,345 146,112 313,766 974,345 146,112
Loans at fair value - 175,614 367,949 55,177 - 367,949 55,177
Held-to-maturity investments 80,000 2,500 172,500 25,868 80,000 172,500 25,868
Available-for-sale investments - - 298,000 44,688 - 298,000 44,688
Other assets 531,385 734,263 1,111,946 166,745 531,385 1,111,946 166,745
Total assets 1,051,410 3,041,343 4,031,002 604,484 1,051,410 4,031,002 604,484
Liabilities from risk reserve fund guarantee 376,328 928,166 1,238,689 185,752 376,328 1,238,689 185,752
Payable to investors at fair value - 166,193 355,340 53,286 - 355,340 53,286
Other liabilities 259,822 566,865 695,907 104,358 259,822 695,907 104,358
Total liabilities 636,150 1,661,224 2,289,936 343,396 636,150 2,289,936 343,396
Total equity 415,260 1,380,119 1,741,066 261,088 415,260 1,741,066 261,088

WARDED2014\7. Analyst Presentation\Cruise_AP_v31.pptx
3232
Operating Highlights
Operating Highlights
(in thousands, except for number of borrowers, number of investors and percentages)
For the Three Months Ended For the Nine Months Ended
September
30, 2015
June 30,
2016
September
30, 2016
Septembe
r 30, 2016
September
30, 2015
September
30, 2016
September
30, 2016
RMB RMB RMB USD RMB RMB USD
Operating Highlights:
Amount of loans facilitated 2,551,320 4,538,687 5,617,485 842,391 6,256,065 13,602,688 2,039,842
Loans generated from online channels 826,703 1,832,078 2,275,473 341,227 2,016,681 5,282,933 792,222
Loans generated from offline channels 1,724,617 2,706,609 3,342,012 501,164 4,239,384 8,319,755 1,247,620
Fees billed 587,781 1,110,849 1,322,598 198,335 1,380,518 3,280,861 491,994
Remaining principal of performing loans 6,720,677 13,771,180 17,028,346 2,553,550 6,720,677 17,028,346 2,553,550
Remaining principal of performing loans
covered by risk reserve fund 5,432,918 12,963,604 16,204,583 2,430,019 5,432,918 16,204,583 2,430,019
Number of borrowers 36,493 68,882 92,479 92,479 98,546 211,458 211,458
Borrowers from online channels 18,299 40,033 54,585 54,585 48,645 122,221 122,221
Borrowers from offline channels 18,194 28,849 37,894 37,894 49,901 89,237 89,237
Number of investors 144,107 196,059 171,460 171,460 185,704 473,984 473,984
Investors from online channels 143,607 196,059 171,460 171,460 176,700 473,984 473,984
Investors from offline channels 500 - - - 9,004 - -
Adjusted EBITDA 127,240 264,962 220,716 33,099 276,218 692,291 103,815
EBITDA margin 34.3% 36.1% 25.2% 25.2% 32.0% 31.9% 31.9%

WARDED2014\7. Analyst Presentation\Cruise_AP_v31.pptx
3333
Reconciliation of GAAP to Non-GAAP Measures
Reconciliation of GAAP to Non-GAAP Measures
(in thousands)
For the Three Months Ended For the Nine Months Ended
September
30, 2015
June 30,
2016
September
30, 2016
September
30, 2016
September
30, 2015
September
30, 2016
September
30, 2016
RMB RMB RMB USD RMB RMB USD
Reconciliation of Net Revenues
Fees billed:
Transaction fees billed to borrowers 592,777 1,095,749 1,298,247 194,683 1,404,031 3,230,892 484,501
Upfront fees billed to borrowers 569,227 1,016,393 1,192,449 178,818 1,364,213 2,982,135 447,198
Monthly fees billed to borrowers 23,550 79,356 105,798 15,865 39,818 248,757 37,303
Service fees billed to investors 26,558 88,068 110,943 16,637 51,880 263,563 39,524
Others 3,083 3,366 5,196 779 5,436 11,631 1,744
VAT (34,637) (76,334) (91,788) (13,764) (80,829) (225,225) (33,775)
Total fees billed 587,781 1,110,849 1,322,598 198,335 1,380,518 3,280,861 491,994
Stand-ready liabilities associated
with risk reserve fund (178,592) (363,095) (430,569) (64,568) (437,924) (1,069,386) (160,364)
Deferred revenue (18,471) (15,857) (16,553) (2,482) (44,410) (52,776) (7,914)
Cash incentives (27,725) (19,556) (24,074) (3,610) (58,988) (55,337) (8,298)
VAT 7,667 21,450 25,309 3,795 22,827 63,519 9,524
Net revenues 370,660 733,791 876,711 131,470 862,023 2,166,881 324,942
Reconciliation of EBITDA
Net income 84,444 260,620 344,281 51,628 192,049 736,617 110,462
Interest income (1,435) (7,253) (9,778) (1,466) (1,685) (22,065) (3,309)
Income tax expense 43,287 9,286 (131,946) (19,786) 83,686 (44,659) (6,697)
Depreciation and amortization 944 2,309 2,816 422 2,168 7,055 1,058
Share-based compensation - - 15,343 2,301 - 15,343 2,301
Adjusted EBITDA 127,240 264,962 220,716 33,099 276,218 692,291 103,815

WARDED2014\7. Analyst Presentation\Cruise_AP_v31.pptx
3434
Delinquency Rates
Delinquency Rates
Delinquent for
15-29 days 30-59 days 60-89 days
All Loans
December 31, 2013 0.2% 0.4% 0.3%
December 31, 2014 0.3% 0.2% 0.2%
December 31, 2015 0.4% 0.5% 0.4%
March 31, 2016 0.5% 0.8% 0.5%
June 30, 2016 0.5% 0.7% 0.5%
September 30, 2016 0.5% 0.8% 0.6%
Online Channels
December 31, 2013 0.1% 0.9% 0.3%
December 31, 2014 0.4% 0.3% 0.2%
December 31, 2015 0.6% 0.8% 0.6%
March 31, 2016 0.6% 1.2% 0.8%
June 30, 2016 0.6% 0.8% 0.7%
September 30, 2016 0.5% 0.8% 0.8%
Offline Channels
December 31, 2013 0.3% 0.2% 0.2%
December 31, 2014 0.3% 0.2% 0.2%
December 31, 2015 0.3% 0.4% 0.3%
March 31, 2016 0.5% 0.7% 0.4%
June 30, 2016 0.5% 0.6% 0.4%
September 30, 2016 0.5% 0.7% 0.5%
WARDED2014\7. Analyst Presentation\Cruise_AP_v31.pptx
3535
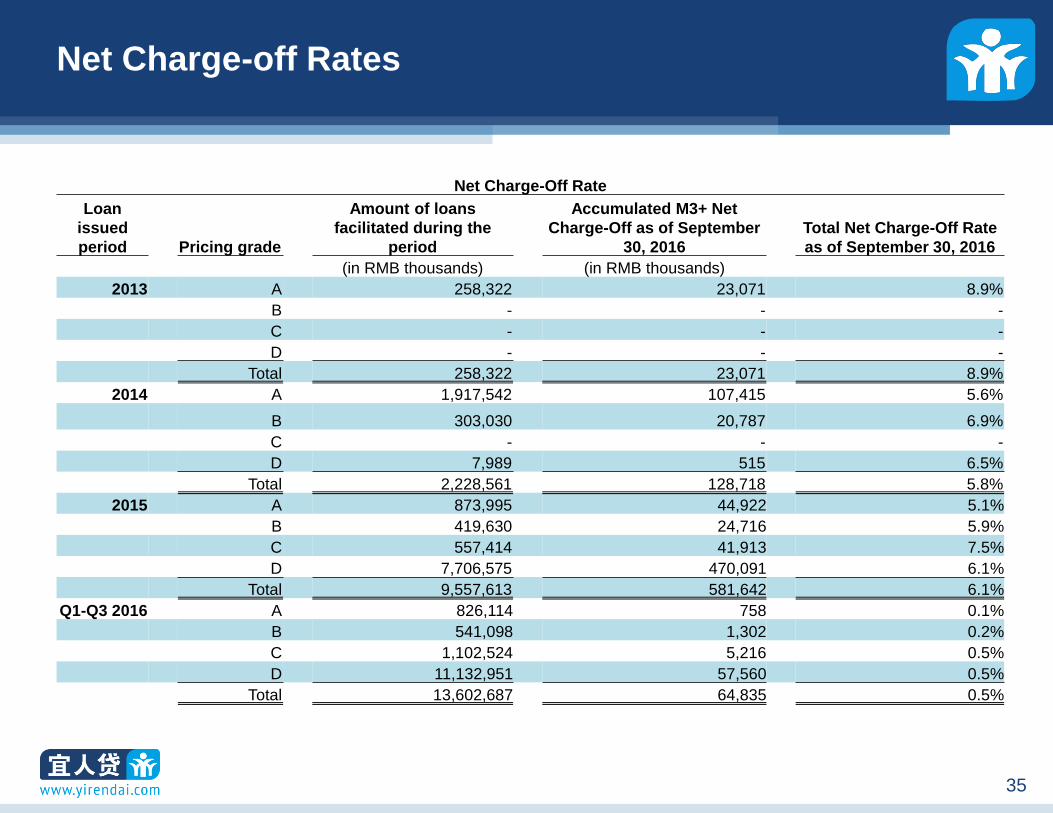
Net Charge-off Rates
Net Charge-Off Rate
Loan
issued
period Pricing grade
Amount of loans
facilitated during the
period
Accumulated M3+ Net
Charge-Off as of September
30, 2016
Total Net Charge-Off Rate
as of September 30, 2016
(in RMB thousands) (in RMB thousands)
2013 A 258,322 23,071 8.9%
B - - -
C - - -
D - - -
Total 258,322 23,071 8.9%
2014 A 1,917,542 107,415 5.6%
B 303,030 20,787 6.9%
C - - -
D 7,989 515 6.5%
Total 2,228,561 128,718 5.8%
2015 A 873,995 44,922 5.1%
B 419,630 24,716 5.9%
C 557,414 41,913 7.5%
D 7,706,575 470,091 6.1%
Total 9,557,613 581,642 6.1%
Q1-Q3 2016 A 826,114 758 0.1%
B 541,098 1,302 0.2%
C 1,102,524 5,216 0.5%
D 11,132,951 57,560 0.5%
Total 13,602,687 64,835 0.5%

36
A Leading Online Consumer
Finance Marketplace in China