Embed Size (px)
Citation preview

Q3 2016 EARNINGS CALL
Disclosures regarding Forward Looking Statements & Non-GAAP Financial Measures (pages 12-22)
THIRD QUARTER 2016 EARNINGS CALL
November 16, 2016
Q3 2016 EARNINGS CALL
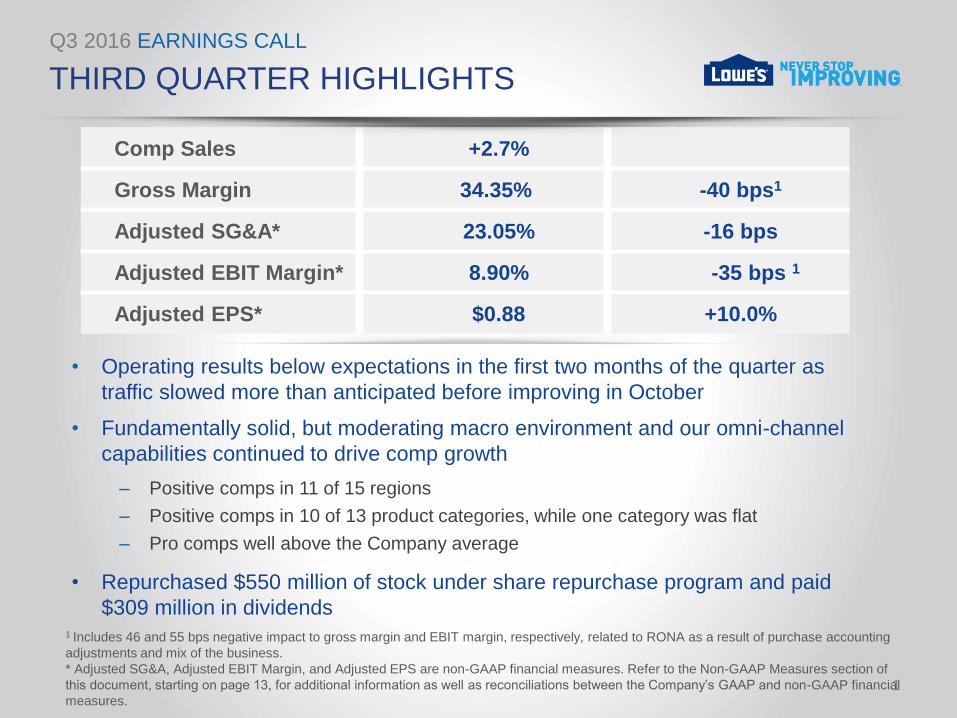
• Repurchased $550 million of stock under share repurchase program and paid
$309 million in dividends
THIRD QUARTER HIGHLIGHTS
1
Comp Sales +2.7%
Gross Margin 34.35% -40 bps1
Adjusted SG&A* 23.05% -16 bps
Adjusted EBIT Margin* 8.90% -35 bps 1
Adjusted EPS* $0.88 +10.0%
• Operating results below expectations in the first two months of the quarter as
traffic slowed more than anticipated before improving in October
• Fundamentally solid, but moderating macro environment and our omni-channel
capabilities continued to drive comp growth
‒ Positive comps in 11 of 15 regions
‒ Positive comps in 10 of 13 product categories, while one category was flat
‒ Pro comps well above the Company average
1 Includes 46 and 55 bps negative impact to gross margin and EBIT margin, respectively, related to RONA as a result of purchase accounting
adjustments and mix of the business.
* Adjusted SG&A, Adjusted EBIT Margin, and Adjusted EPS are non-GAAP financial measures. Refer to the Non-GAAP Measures section of
this document, starting on page 13, for additional information as well as reconciliations between the Company’s GAAP and non-GAAP financial
measures.
Q3 2016 EARNINGS CALL
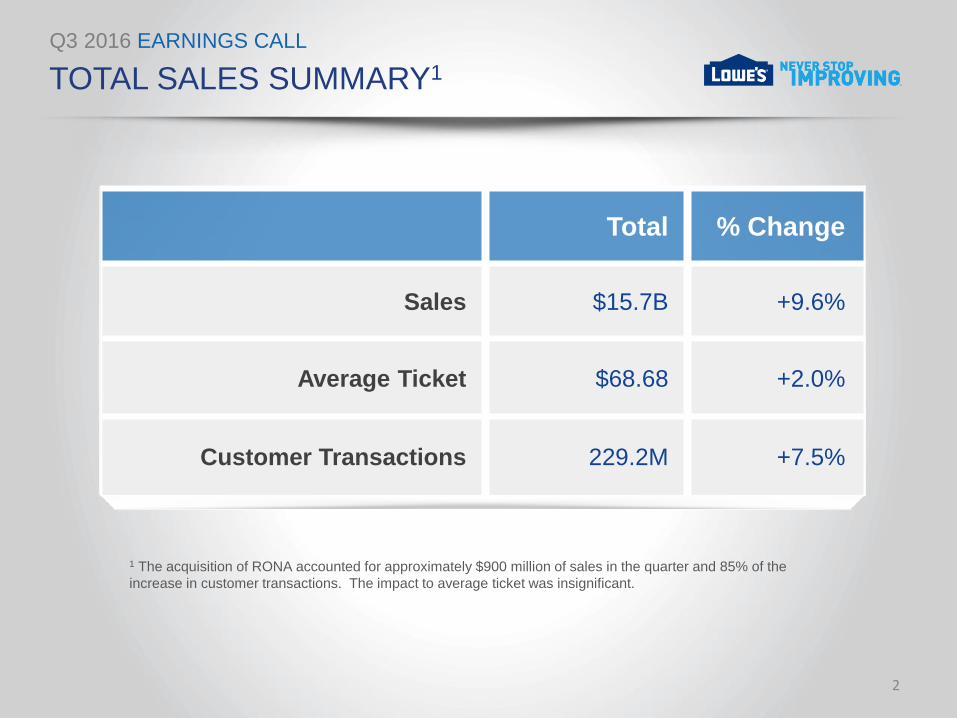
TOTAL SALES SUMMARY1
2
Total % Change
Sales $15.7B +9.6%
Average Ticket $68.68 +2.0%
Customer Transactions 229.2M +7.5%
1 The acquisition of RONA accounted for approximately $900 million of sales in the quarter and 85% of the
increase in customer transactions. The impact to average ticket was insignificant.
Q3 2016 EARNINGS CALL
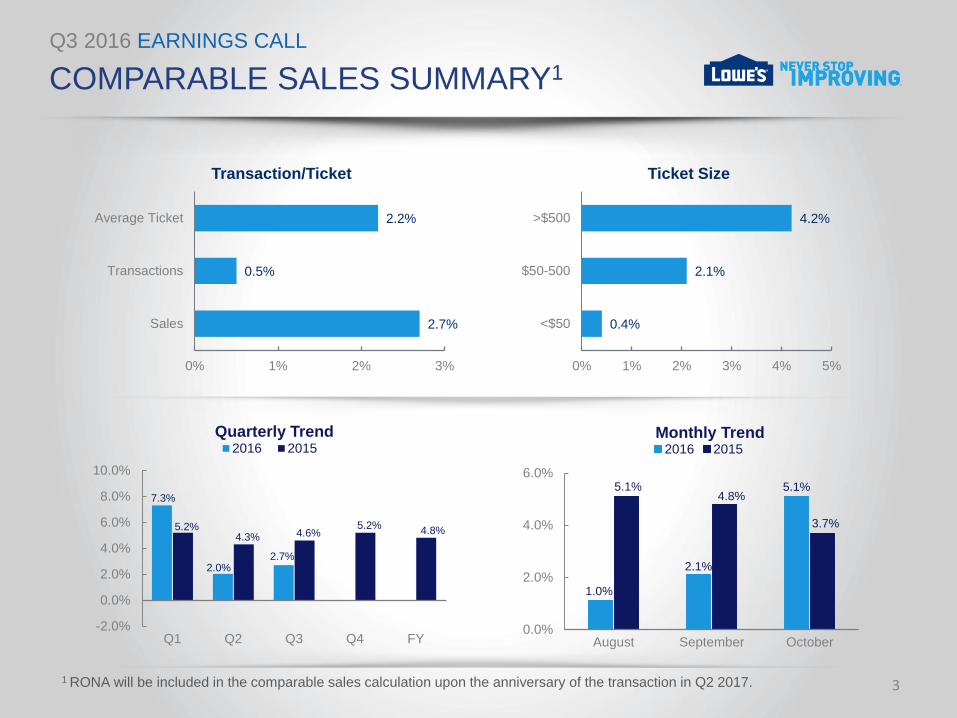
2.7%
0.5%
2.2%
0% 1% 2% 3%
Sales
Transactions
Average Ticket
Transaction/Ticket
7.3%
2.0% 2.7%
5.2% 4.3% 4.6%
5.2% 4.8%
-2.0%
0.0%
2.0%
4.0%
6.0%
8.0%
10.0%
Q1 Q2 Q3 Q4 FY
Quarterly Trend 2016 2015
0.4%
2.1%
4.2%
0% 1% 2% 3% 4% 5%
<$50
$50-500
>$500
Ticket Size
1.0%
2.1%
5.1% 5.1% 4.8%
3.7%
0.0%
2.0%
4.0%
6.0%
August September October
Monthly Trend
2016 2015
COMPARABLE SALES SUMMARY1
3 1 RONA will be included in the comparable sales calculation upon the anniversary of the transaction in Q2 2017.
Q3 2016 EARNINGS CALL
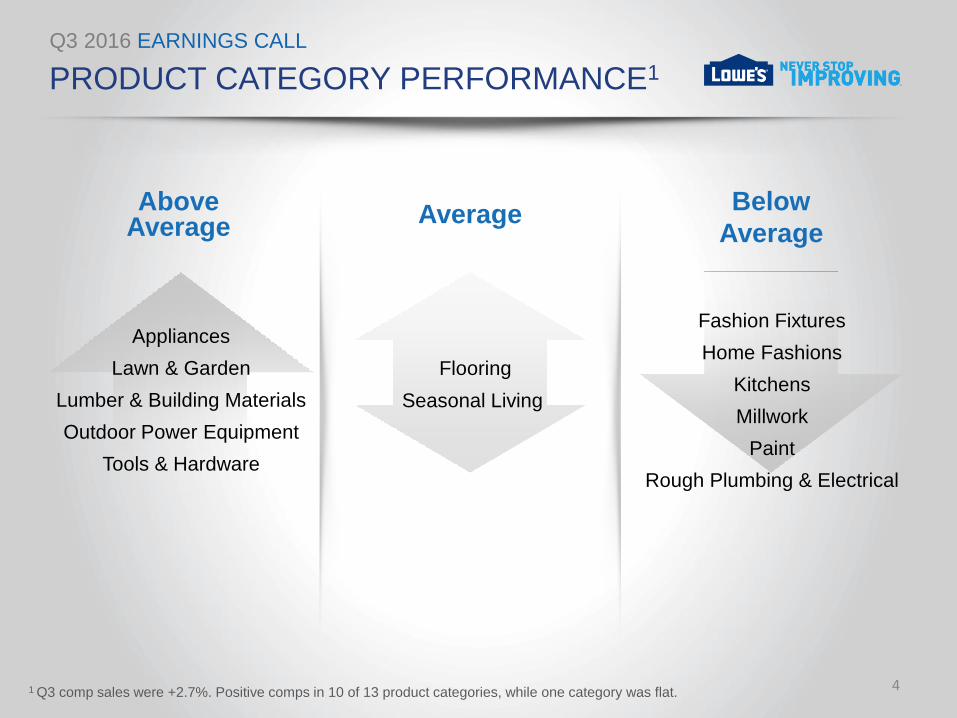
Appliances
Lawn & Garden
Lumber & Building Materials
Outdoor Power Equipment
Tools & Hardware
PRODUCT CATEGORY PERFORMANCE1
4 1 Q3 comp sales were +2.7%. Positive comps in 10 of 13 product categories, while one category was flat.
Fashion Fixtures
Home Fashions
Kitchens
Millwork
Paint
Rough Plumbing & Electrical
Flooring
Seasonal Living
Above Average
Average Below
Average
Q3 2016 EARNINGS CALL
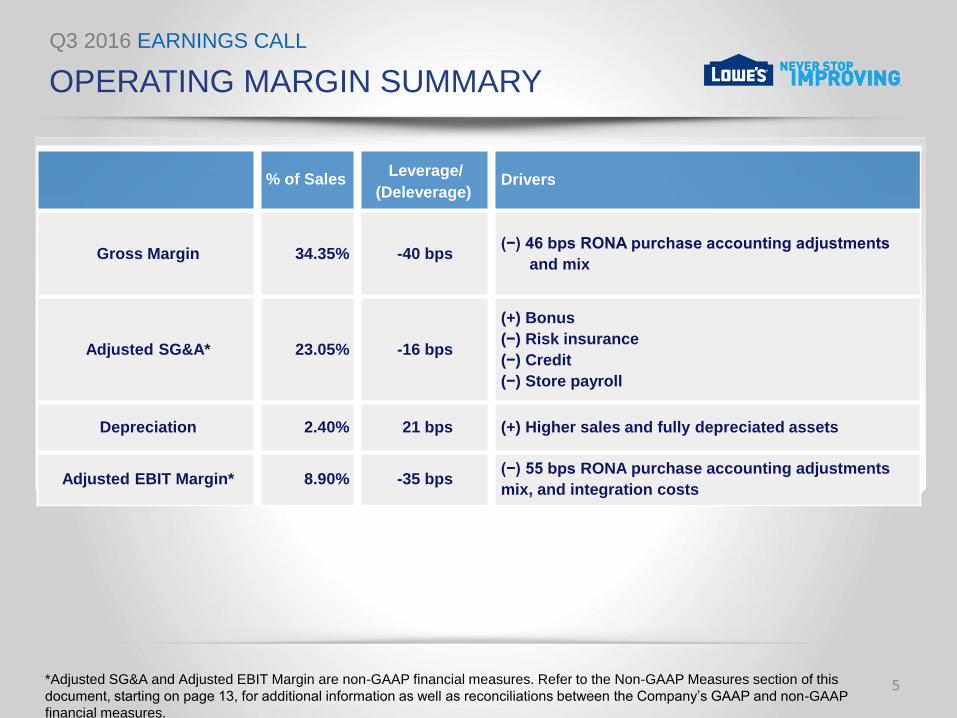
OPERATING MARGIN SUMMARY
5
% of Sales Drivers
Gross Margin 34.35% -40 bps (−) 46 bps RONA purchase accounting adjustments
and mix
Adjusted SG&A* 23.05% -16 bps
(+) Bonus
(−) Risk insurance
(−) Credit
(−) Store payroll
Depreciation 2.40% 21 bps (+) Higher sales and fully depreciated assets
Adjusted EBIT Margin* 8.90% -35 bps (−) 55 bps RONA purchase accounting adjustments
mix, and integration costs
Leverage/
(Deleverage)
*Adjusted SG&A and Adjusted EBIT Margin are non-GAAP financial measures. Refer to the Non-GAAP Measures section of this
document, starting on page 13, for additional information as well as reconciliations between the Company’s GAAP and non-GAAP
financial measures.
Q3 2016 EARNINGS CALL
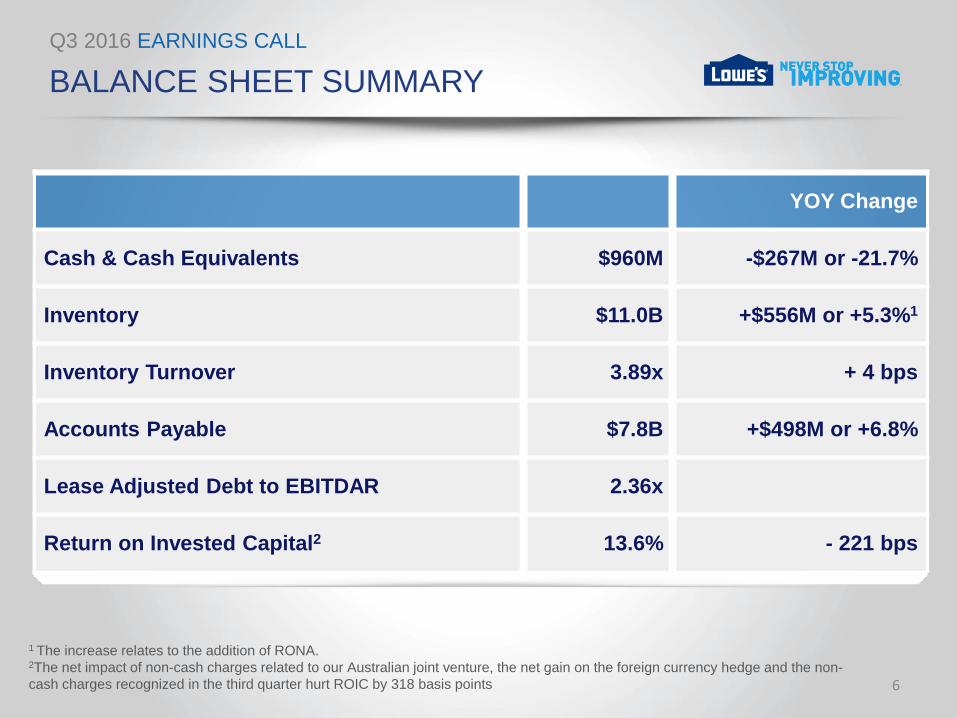
YOY Change
Cash & Cash Equivalents $960M -$267M or -21.7%
Inventory $11.0B +$556M or +5.3%1
Inventory Turnover 3.89x + 4 bps
Accounts Payable $7.8B +$498M or +6.8%
Lease Adjusted Debt to EBITDAR 2.36x
Return on Invested Capital2 13.6% - 221 bps
BALANCE SHEET SUMMARY
6
1 The increase relates to the addition of RONA. 2The net impact of non-cash charges related to our Australian joint venture, the net gain on the foreign currency hedge and the non-
cash charges recognized in the third quarter hurt ROIC by 318 basis points
Q3 2016 EARNINGS CALL
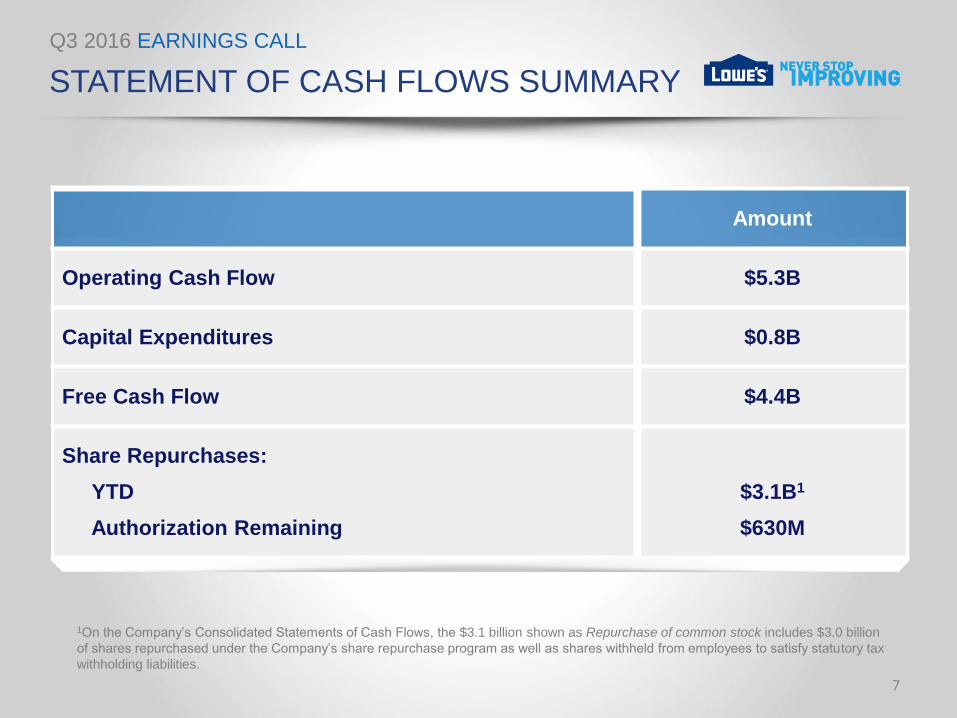
Amount
Operating Cash Flow $5.3B
Capital Expenditures $0.8B
Free Cash Flow $4.4B
Share Repurchases:
YTD
Authorization Remaining
$3.1B1
$630M
STATEMENT OF CASH FLOWS SUMMARY
7
1On the Company’s Consolidated Statements of Cash Flows, the $3.1 billion shown as Repurchase of common stock includes $3.0 billion
of shares repurchased under the Company’s share repurchase program as well as shares withheld from employees to satisfy statutory tax
withholding liabilities.
Q3 2016 EARNINGS CALL
ECONOMIC LANDSCAPE
8
• Key drivers of home improvement spending are real disposable
personal income, home prices, and housing turnover.
• The outlook for the home improvement industry remains positive,
supported by a solid consumer backdrop, lagging benefits from
existing home sales, and rising home prices that encourage the
customer to engage in discretionary remodels and upgrades on top of
routine maintenance.
• Our quarterly Consumer Sentiment Survey revealed that favorable
views around personal finances, home values, and home improvement
spending are holding steady.
Q3 2016 EARNINGS CALL
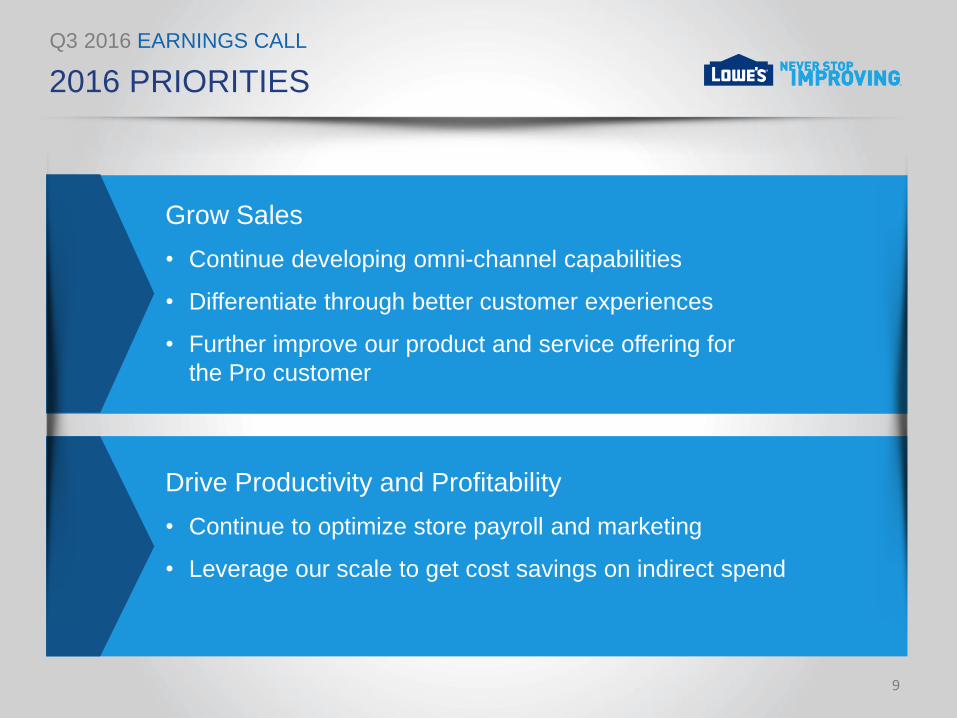
2016 PRIORITIES
Grow Sales
• Continue developing omni-channel capabilities
• Differentiate through better customer experiences
• Further improve our product and service offering for
the Pro customer
Drive Productivity and Profitability
• Continue to optimize store payroll and marketing
• Leverage our scale to get cost savings on indirect spend
9
Q3 2016 EARNINGS CALL
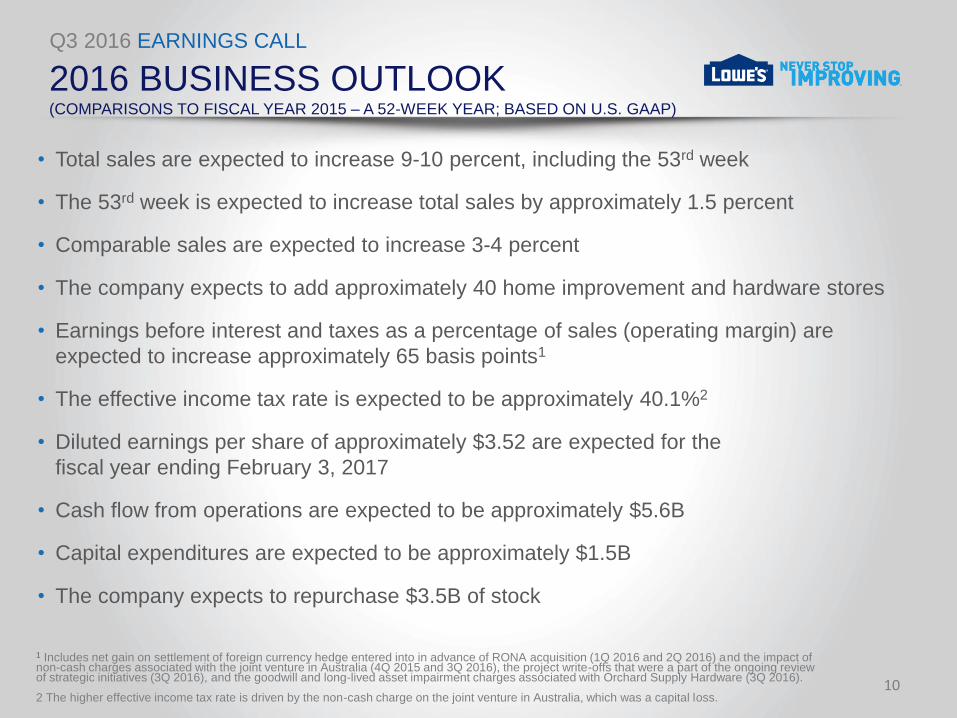
2016 BUSINESS OUTLOOK (COMPARISONS TO FISCAL YEAR 2015 – A 52-WEEK YEAR; BASED ON U.S. GAAP)
10
• Total sales are expected to increase 9-10 percent, including the 53rd week
• The 53rd week is expected to increase total sales by approximately 1.5 percent
• Comparable sales are expected to increase 3-4 percent
• The company expects to add approximately 40 home improvement and hardware stores
• Earnings before interest and taxes as a percentage of sales (operating margin) are
expected to increase approximately 65 basis points1
• The effective income tax rate is expected to be approximately 40.1%2
• Diluted earnings per share of approximately $3.52 are expected for the
fiscal year ending February 3, 2017
• Cash flow from operations are expected to be approximately $5.6B
• Capital expenditures are expected to be approximately $1.5B
• The company expects to repurchase $3.5B of stock
1 Includes net gain on settlement of foreign currency hedge entered into in advance of RONA acquisition (1Q 2016 and 2Q 2016) and the impact of non-cash charges associated with the joint venture in Australia (4Q 2015 and 3Q 2016), the project write-offs that were a part of the ongoing review of strategic initiatives (3Q 2016), and the goodwill and long-lived asset impairment charges associated with Orchard Supply Hardware (3Q 2016). 2 The higher effective income tax rate is driven by the non-cash charge on the joint venture in Australia, which was a capital loss.
Q3 2016 EARNINGS CALL
APPENDIX
Q3 2016 EARNINGS CALL
FORWARD LOOKING STATEMENTS
12
This presentation includes “forward-looking statements” within the meaning of the Private Securities Litigation Reform Act of 1995. Statements including words such as “believe”,
“expect”, “anticipate”, “plan”, “desire”, “project”, “estimate”, “intend”, “will”, “should”, “could”, “would”, “may”, “strategy”, “potential”, “opportunity” and similar expressions are
forward-looking statements. Forward-looking statements involve estimates, expectations, projections, goals, forecasts, assumptions, risks and uncertainties. Forward-looking
statements include, but are not limited to, statements about future financial and operating results, Lowe’s plans, objectives , business outlook, priorities, expectations and
intentions, expectations for sales growth, comparable sales, earnings and performance, shareholder value, capital expenditures, cash flows, the housing market, the home
improvement industry, demand for services, share repurchases, Lowe’s strategic initiatives, including those regarding the acquisition by Lowe’s Companies, Inc. of RONA, inc.
and the expected impact of the transaction on Lowe’s strategic and operational plans and financial results, and any statement of an assumption underlying any of the foregoing
and other statements that are not historical facts. Although we believe that the expectations, opinions, projections, and comments reflected in these forward-looking statements
are reasonable, such statements involve risks and uncertainties and we can give no assurance that such statements will prove to be correct. Actual results may differ materially
from these expressed or implied in such statements. A wide variety of potential risks, uncertainties, and other factors could materially affect our ability to achieve the results either
expressed or implied by these forward-looking statements including, but not limited to, changes in general economic conditions, such as the rate of unemployment, interest rate
and currency fluctuations, fuel and other energy costs, slower growth in personal income, changes in consumer spending, changes in the rate of housing turnover, the availability
of consumer credit and of mortgage financing, inflation or deflation of commodity prices, and other factors that can negatively affect our customers, as well as our ability to: (i)
respond to adverse trends in the housing industry, such as a demographic shift from single family to multi-family housing, a reduced rate of growth in household formation, and
slower rates of growth in housing renovation and repair activity, as well as uneven recovery in commercial building activity; (ii) secure, develop, and otherwise implement new
technologies and processes necessary to realize the benefits of our strategic initiatives focused on omni-channel sales and marketing presence and enhance our efficiency; (iii)
attract, train, and retain highly-qualified associates; (iv) manage our business effectively as we adapt our traditional operating model to meet the changing expectations of our
customers; (v) maintain, improve, upgrade and protect our critical information systems from data security breaches and other cyber threats; (vi) respond to fluctuations in the
prices and availability of services, supplies, and products; (vii) respond to the growth and impact of competition; (viii) address changes in existing or new laws or regulations that
affect consumer credit, employment/labor, trade, product safety, transportation/logistics, energy costs, health care, tax or environmental issues; (ix) positively and effectively
manage our public image and reputation and respond appropriately to unanticipated failures to maintain a high level of product and service quality that could result in a negative
impact on customer confidence and adversely affect sales; and (x) effectively manage our relationships with selected suppliers of brand name products and key vendors and
service providers, including third party installers. In addition, we could experience impairment losses if either the actual results of our operating stores are not consistent with the
assumptions and judgments we have made in estimating future cash flows and determining asset fair values, or we are required to reduce the carrying amount of our investment
in certain unconsolidated entities that are accounted for under the equity method. With respect to the acquisition of RONA, inc. potential risks include the effect of the transaction
on Lowe’s and RONA’s strategic relationships, operating results and businesses generally; our ability to integrate personnel, labor models, financial, IT and others systems
successfully; disruption of our ongoing business and distraction of management; hiring additional management and other critical personnel; increasing the scope geographic
diversity and complexity of our operations; significant transaction costs or unknown liabilities; and failure to realize the expected benefits of the transaction. For more information
about these and other risks and uncertainties that we are exposed to, you should read the “Risk Factors” and “Management’s Discussion and Analysis of Financial Condition and
Results of Operations—Critical Accounting Policies and Estimates” included in our most recent Annual Report on Form 10-K filed with the U.S. Securities and Exchange
Commission (the “SEC”) and the description of material changes thereto, if any, included in our Quarterly Reports on Form 10-Q or subsequent filings with the SEC.
The forward-looking statements contained in this presentation are expressly qualified in their entirety by the foregoing cautionary statements. The foregoing list of important
factors that may affect future results is not exhaustive when relying on forward-looking statements to make decisions, investors and others should carefully consider the foregoing
factors and other uncertainties and potential events. All such forward-looking statements are based upon data available as of the date of this presentation or other specified date
and speak only as of such date. All subsequent written and oral forward-looking statements attributable to us or any person acting on our behalf about any of the matters covered
in this presentation are qualified by these cautionary statements and in the “Risk Factors” included in our most recent Annual Report on Form 10-K and the description of material
changes thereto, if any, included in our Quarterly Reports on Form 10-Q or subsequent filings with the SEC. We expressly disclaim any obligation to update or revise any
forward-looking statement, whether as a result of new information, change in circumstances, future events, or otherwise, except as may be required by law.
Q3 2016 EARNINGS CALL
NON-GAAP MEASURES
13
Management is using non-GAAP financial measures in this presentation because it considers them to be important supplemental
measures of the Company’s performance. Management also believes that these non-GAAP financial measures provide additional
insight for analysts and investors in evaluating the Company’s financial and operating performance. We have presented non-
GAAP financial measures of adjusted EBIT margin, adjusted SG&A and adjusted earnings per common share to exclude the
impact of certain non-cash charges as further detailed in the presentation and related earnings release. Management also uses
the non-GAAP financial measures of EBITDAR, lease-adjusted debt, return on invested capital (ROIC) and free cash flow. The
Company believes these non-GAAP financial measures provide useful insight for analysts and investors in evaluating what
management considers the Company’s core financial performance. These non-GAAP financial measures should not be
considered alternatives to, or more meaningful indicators of, the company’s net earnings, earnings per common share, total debt
or other financial measures as prepared in accordance with GAAP. The Company’s methods of determining these non-GAAP
financial measures may differ from the methods used by other companies for these or similar non-GAAP financial measures.
Accordingly, these non-GAAP financial measures may not be comparable to measures used by other companies.
Detailed reconciliations between the Company’s GAAP and non-GAAP financial results are shown below and available on the
Company’s website at www.lowes.com/investor.
Q3 2016 EARNINGS CALL
NON-GAAP MEASURES
14
EBIT Margin (Operating Margin)
We define EBIT Margin as earnings before interest and taxes as a percentage of sales.
Lowe’s believes that EBIT Margin is a useful measure to describe the Company’s operating profit.
EBITDAR
We define EBITDAR as earnings before interest, taxes, depreciation, amortization, share-based
payments, rent, and certain non-cash charges as defined by the Company’s credit facility.
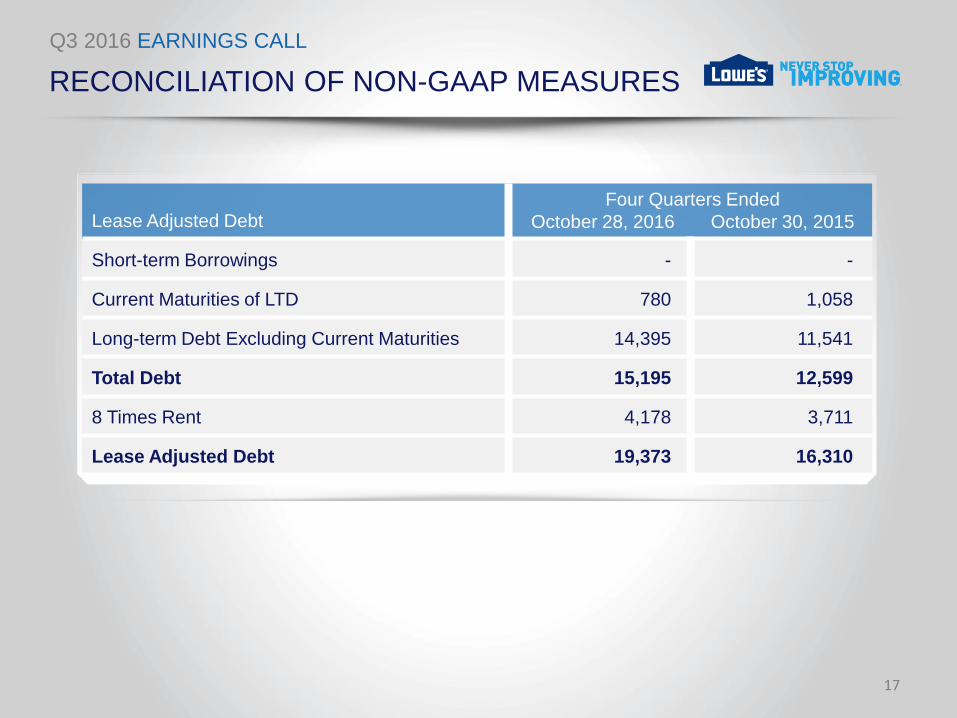
Lease-Adjusted Debt
We define Lease-Adjusted Debt as short-term debt, current maturities of long-term debt, long-term
debt excluding current maturities, and eight times the last four quarters’ rent. We believe eight times
rent is a reasonable industry standard estimate of the economic value of our leased assets.
Lowe’s believes the ratio of Lease-Adjusted Debt to EBITDAR is a useful supplemental measure, as
it provides an indication of the results generated by the Company in relation to its level of
indebtedness by reflecting cash flow that could be used to repay debt.
Q3 2016 EARNINGS CALL
NON-GAAP MEASURES
15
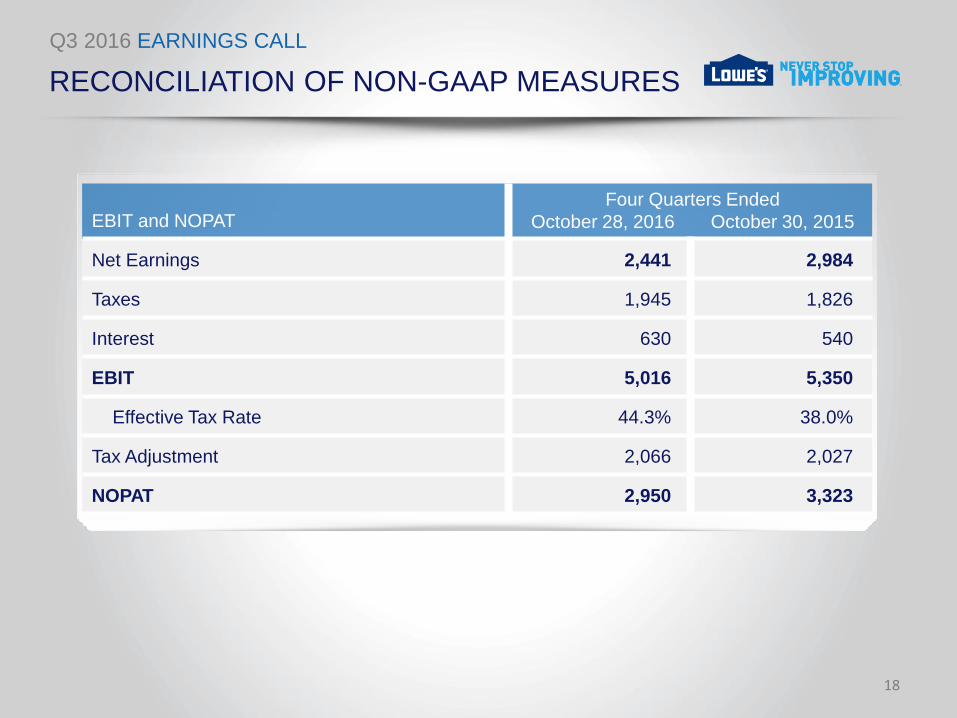
ROIC
We define ROIC as trailing four quarters’ Net Operating Profit after Tax (NOPAT) divided by the average of ending debt and equity for the last five quarters.
Lowe’s believes ROIC is a useful measure of how effectively the Company uses capital
togenerate profits.
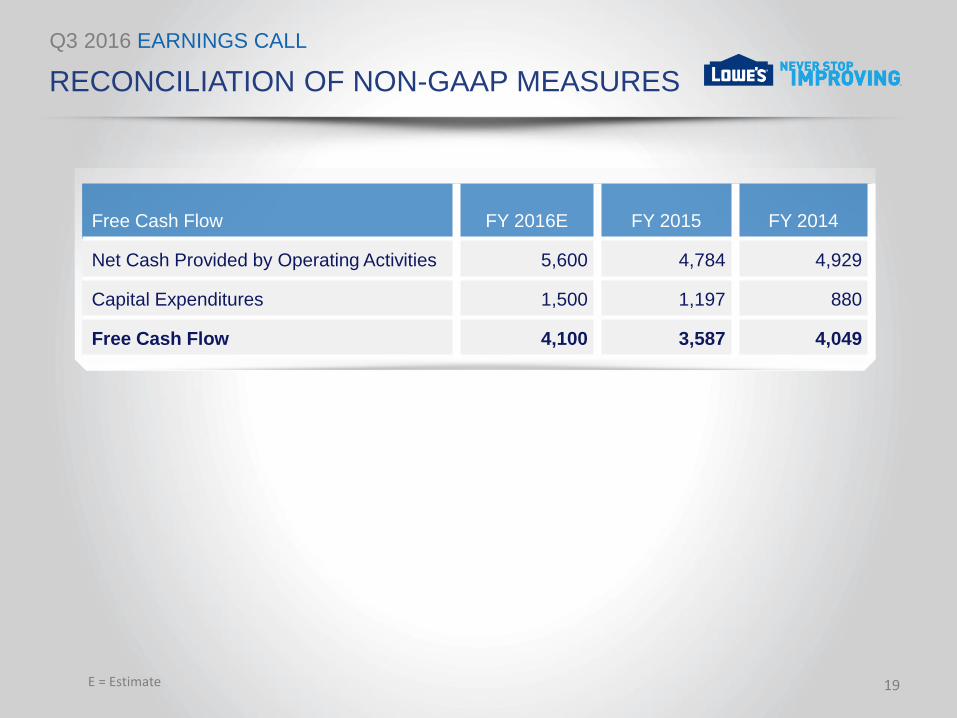
Free Cash Flow
We define Free Cash Flow as net cash provided by operating activities less capital
expenditures.
Lowe’s believes Free Cash Flow is a useful measure to describe the Company’s financial
performance and measures its ability to generate excess cash from its business operations.
Q3 2016 EARNINGS CALL
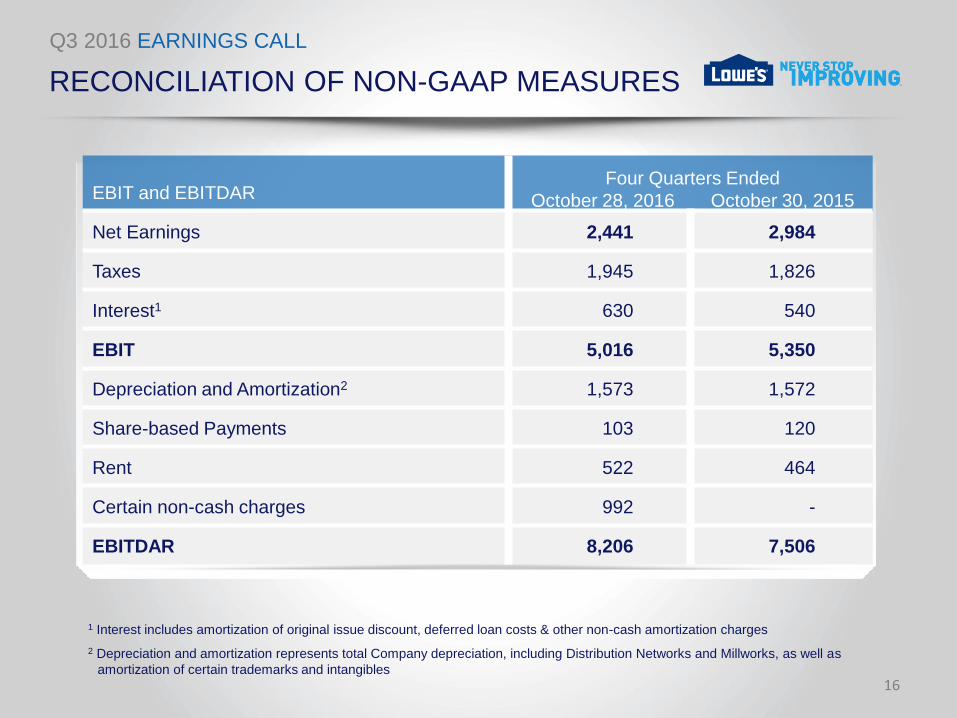
EBIT and EBITDAR
Net Earnings 2,441 2,984
Taxes 1,945 1,826
Interest1 630 540
EBIT 5,016 5,350
Depreciation and Amortization2 1,573 1,572
Share-based Payments 103 120
Rent 522 464
Certain non-cash charges 992 -
EBITDAR 8,206 7,506
RECONCILIATION OF NON-GAAP MEASURES
16
1 Interest includes amortization of original issue discount, deferred loan costs & other non-cash amortization charges
2 Depreciation and amortization represents total Company depreciation, including Distribution Networks and Millworks, as well as
amortization of certain trademarks and intangibles
Four Quarters Ended
October 28, 2016 October 30, 2015
Q3 2016 EARNINGS CALL
RECONCILIATION OF NON-GAAP MEASURES
17
Lease Adjusted Debt
Short-term Borrowings - -
Current Maturities of LTD 780 1,058
Long-term Debt Excluding Current Maturities 14,395 11,541
Total Debt 15,195 12,599
8 Times Rent 4,178 3,711
Lease Adjusted Debt 19,373 16,310
Four Quarters Ended
October 28, 2016 October 30, 2015
Q3 2016 EARNINGS CALL
RECONCILIATION OF NON-GAAP MEASURES
18
EBIT and NOPAT
Net Earnings 2,441 2,984
Taxes 1,945 1,826
Interest 630 540
EBIT 5,016 5,350
Effective Tax Rate 44.3% 38.0%
Tax Adjustment 2,066 2,027
NOPAT 2,950 3,323
Four Quarters Ended
October 28, 2016 October 30, 2015
Q3 2016 EARNINGS CALL
RECONCILIATION OF NON-GAAP MEASURES
19 E = Estimate
Free Cash Flow FY 2016E FY 2015 FY 2014
Net Cash Provided by Operating Activities 5,600 4,784 4,929
Capital Expenditures 1,500 1,197 880
Free Cash Flow 4,100 3,587 4,049
Q3 2016 EARNINGS CALL
RECONCILIATION OF NON-GAAP MEASURES
20
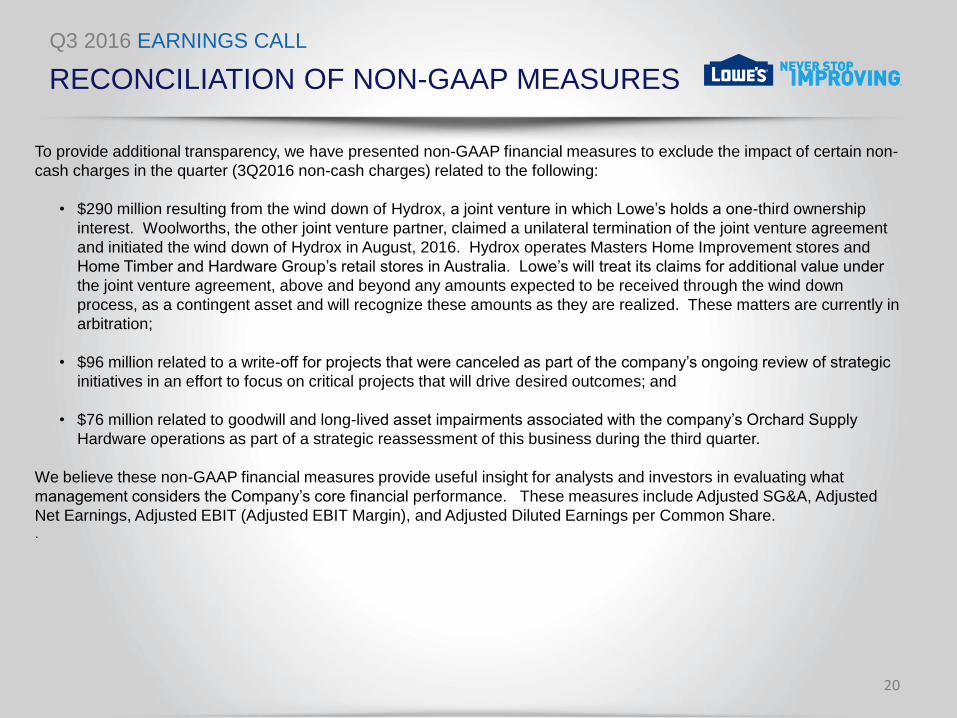
To provide additional transparency, we have presented non-GAAP financial measures to exclude the impact of certain non-
cash charges in the quarter (3Q2016 non-cash charges) related to the following:
• $290 million resulting from the wind down of Hydrox, a joint venture in which Lowe’s holds a one-third ownership
interest. Woolworths, the other joint venture partner, claimed a unilateral termination of the joint venture agreement
and initiated the wind down of Hydrox in August, 2016. Hydrox operates Masters Home Improvement stores and
Home Timber and Hardware Group’s retail stores in Australia. Lowe’s will treat its claims for additional value under
the joint venture agreement, above and beyond any amounts expected to be received through the wind down
process, as a contingent asset and will recognize these amounts as they are realized. These matters are currently in
arbitration;
• $96 million related to a write-off for projects that were canceled as part of the company’s ongoing review of strategic
initiatives in an effort to focus on critical projects that will drive desired outcomes; and
• $76 million related to goodwill and long-lived asset impairments associated with the company’s Orchard Supply
Hardware operations as part of a strategic reassessment of this business during the third quarter.
We believe these non-GAAP financial measures provide useful insight for analysts and investors in evaluating what
management considers the Company’s core financial performance. These measures include Adjusted SG&A, Adjusted
Net Earnings, Adjusted EBIT (Adjusted EBIT Margin), and Adjusted Diluted Earnings per Common Share. .
Q3 2016 EARNINGS CALL
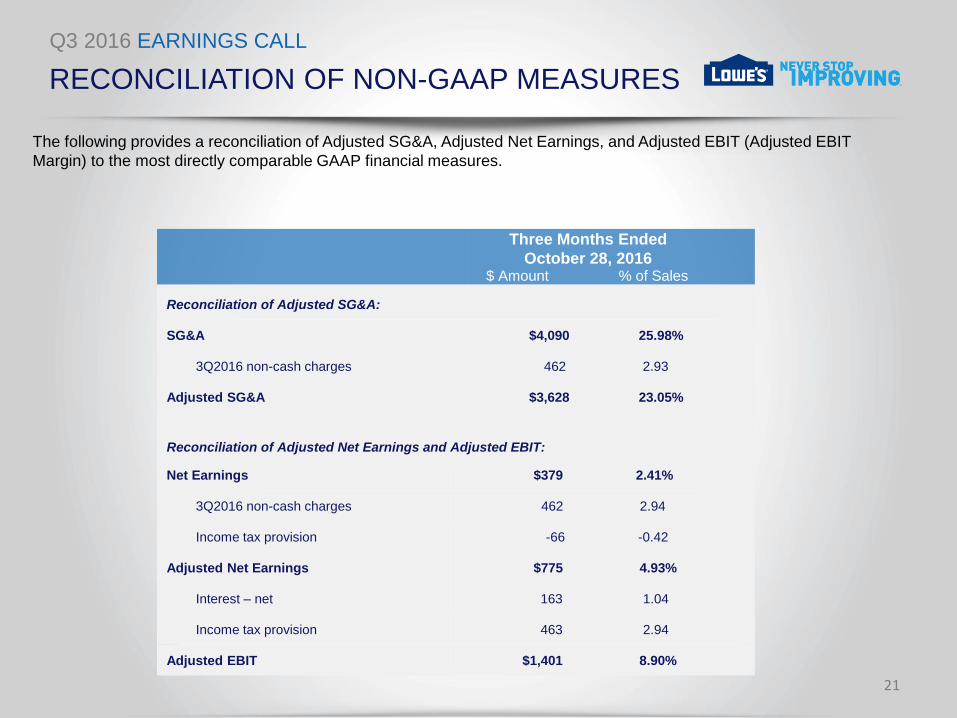
RECONCILIATION OF NON-GAAP MEASURES
21
Reconciliation of Adjusted SG&A:
SG&A $4,090 25.98%
3Q2016 non-cash charges 462 2.93
Adjusted SG&A $3,628 23.05%
Reconciliation of Adjusted Net Earnings and Adjusted EBIT:
Net Earnings $379 2.41%
3Q2016 non-cash charges 462 2.94
Income tax provision -66 -0.42
Adjusted Net Earnings $775 4.93%
Interest – net 163 1.04
Income tax provision 463 2.94
Adjusted EBIT $1,401 8.90%
Three Months Ended
October 28, 2016
The following provides a reconciliation of Adjusted SG&A, Adjusted Net Earnings, and Adjusted EBIT (Adjusted EBIT
Margin) to the most directly comparable GAAP financial measures.
$ Amount % of Sales
Q3 2016 EARNINGS CALL
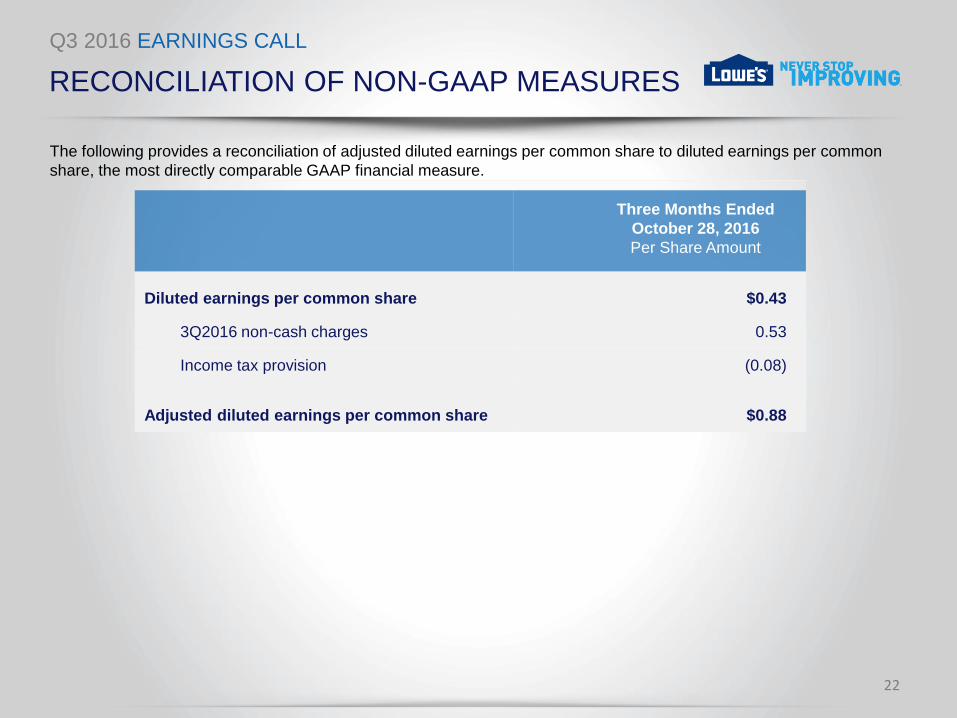
RECONCILIATION OF NON-GAAP MEASURES
22
Diluted earnings per common share $0.43
3Q2016 non-cash charges 0.53
Income tax provision (0.08)
Adjusted diluted earnings per common share $0.88
Three Months Ended
October 28, 2016
Per Share Amount
The following provides a reconciliation of adjusted diluted earnings per common share to diluted earnings per common
share, the most directly comparable GAAP financial measure.
Quarter Ended
January 29, 2016

Q3 2016 EARNINGS CALL
INVESTOR RELATIONS CONTACTS
23
TIFFANY MASON
Senior Vice President, Corporate Finance and Treasurer
704.758.2033
HEATHER HOLLANDER
Director, Investor Relations
704.758.3579
Investor Relations Website
www.Lowes.com/investor