Embed Size (px)
Citation preview

Q3 2016
Conference Call November 1, 2016
Forward-Looking Statements
& Non-GAAP Measures
2
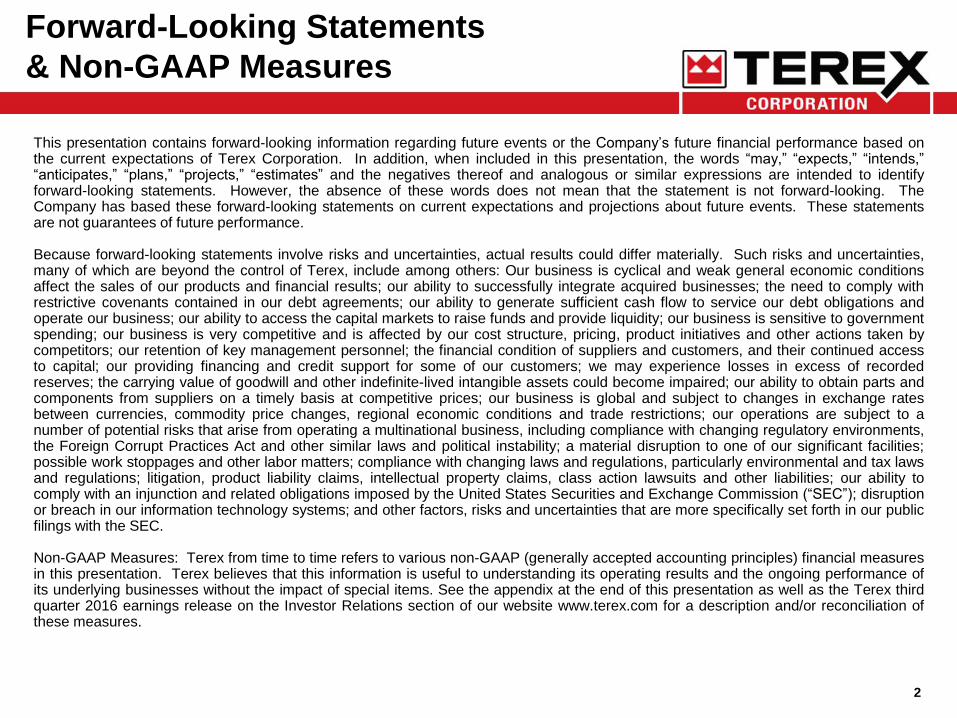
This presentation contains forward-looking information regarding future events or the Company’s future financial performance based on the current expectations of Terex Corporation. In addition, when included in this presentation, the words “may,” “expects,” “intends,” “anticipates,” “plans,” “projects,” “estimates” and the negatives thereof and analogous or similar expressions are intended to identify forward-looking statements. However, the absence of these words does not mean that the statement is not forward-looking. The Company has based these forward-looking statements on current expectations and projections about future events. These statements are not guarantees of future performance. Because forward-looking statements involve risks and uncertainties, actual results could differ materially. Such risks and uncertainties, many of which are beyond the control of Terex, include among others: Our business is cyclical and weak general economic conditions affect the sales of our products and financial results; our ability to successfully integrate acquired businesses; the need to comply with restrictive covenants contained in our debt agreements; our ability to generate sufficient cash flow to service our debt obligations and operate our business; our ability to access the capital markets to raise funds and provide liquidity; our business is sensitive to government spending; our business is very competitive and is affected by our cost structure, pricing, product initiatives and other actions taken by competitors; our retention of key management personnel; the financial condition of suppliers and customers, and their continued access to capital; our providing financing and credit support for some of our customers; we may experience losses in excess of recorded reserves; the carrying value of goodwill and other indefinite-lived intangible assets could become impaired; our ability to obtain parts and components from suppliers on a timely basis at competitive prices; our business is global and subject to changes in exchange rates between currencies, commodity price changes, regional economic conditions and trade restrictions; our operations are subject to a number of potential risks that arise from operating a multinational business, including compliance with changing regulatory environments, the Foreign Corrupt Practices Act and other similar laws and political instability; a material disruption to one of our significant facilities; possible work stoppages and other labor matters; compliance with changing laws and regulations, particularly environmental and tax laws and regulations; litigation, product liability claims, intellectual property claims, class action lawsuits and other liabilities; our ability to comply with an injunction and related obligations imposed by the United States Securities and Exchange Commission (“SEC”); disruption or breach in our information technology systems; and other factors, risks and uncertainties that are more specifically set forth in our public filings with the SEC. Non-GAAP Measures: Terex from time to time refers to various non-GAAP (generally accepted accounting principles) financial measures in this presentation. Terex believes that this information is useful to understanding its operating results and the ongoing performance of its underlying businesses without the impact of special items. See the appendix at the end of this presentation as well as the Terex third quarter 2016 earnings release on the Investor Relations section of our website www.terex.com for a description and/or reconciliation of these measures.

Focus
Simplify
Execute to Win
Terex Strategy
3

Focus the Portfolio
Taking Action:
• Completed sale of
German Compact
Construction
business
• MHPS sale
progressing
4

Simplify the Company
Taking Action:
• Streamlined operating
structure
• Executing footprint
rationalization ‒ Cranes (Waverly)
‒ AWP (Scissors, Washington,
California, Texas)
‒ MP (Austria)
• Reducing cost structure
5

Execute to Win
Strengthen Core
Management Processes:
• Strategy development and
deployment
• Commercial and
operational execution
• Talent management
• Drive greater accountability
and focus on execution
6

MHPS Sale Update
7
7
• Approved by EU(1) and US
regulators
• Approved by Konecranes
shareholders
• Expect to close in early 2017,
as planned
• Benefits of the sale are not
included in our current
financials
• More focused company will
drive need to re-size corporate
cost structure
(1) Conditional upon Konecranes divesting STAHL CraneSystems

8
Financial Summary
• Sales down 16% in the
quarter versus prior year
• Q3 EPS of $0.31 as reported,
$0.19 as adjusted(1)
• Net cash provided by
operating activities of
$106 million, free cash flow(1)
of $47 million in the quarter
• Repurchased $80 million of
stock in the quarter
• Backlog down 9% year on
year
(1) See the appendix for reconciliation to US GAAP
Results are Continuing Operations, Except Cash Figures

Q3 Operating Results
USD Millions, except Earnings per Share
9
Note: Results shown are for Continuing Operations, Except ROIC
(1) See the appendix for reconciliation to US GAAP
Q3 2016 Q3 2016 Q3 2015 Q3 2015
As Reported As Adjusted(1)As Reported As Adjusted(1)
Net Sales $1,056.4 $1,056.4 $1,255.4 $1,255.4
% Change vs 2015 (15.9%) (15.9%)
Income (loss) from Operations 39.6 49.0 92.1 106.4
Operating Margin 3.7% 4.6% 7.3% 8.5%
Interest & Other Income (Expense) (25.7) (23.1) (36.2) (27.6)
Effective Tax Rate (138.8%) 21.2% 45.8% 38.7%
Earnings (loss) per Share $0.31 $0.19 $0.28 $0.44
EBITDA(1) $57.9 $67.3 $103.8 $118.1
% Net Sales 5.5% 6.4% 8.3% 9.4%
ROIC(1) 25.6% 9.7%

2016 Full Year Outlook - Updated
(1) Excludes the impact of future acquisitions, divestitures, restructuring and other unusual items
(2) Continuing Operations 10
USD Millions, except Earnings per Share
Net Sales
Operating
Profit (Loss) Net Sales
Operating
Profit (Loss)
AWP Down ~ 15% 8.5% - 9.5% Down ~ 13% ~9.5%
Cranes Down ~ 15% 1.5% - 2.5% Down ~ 20% ~(2.5%)
MP ~ Flat 8.5% - 9.5% no change no change
Corp. and Other $200 -$ 250 ($40) - ($50) no change ~($40)
Net Sales(2)
EPS(2)
Free Cash Flow
$4.2 - $4.4 billion
$0.70 - $0.80
$150 - 200
Previous Guidance(1) Updated Guidance(1)
Previous Guidance(1)
$4.3 - $4.5 billion
$0.85 - $1.15
$200 - 250
Updated Guidance(1)

Aerial Work Platforms
USD Millions
• NA market decline - replacement cycle
• Western Europe slowing
• Pricing pressure
• Inventory management
11 (1) See the appendix for reconciliation to US GAAP
Q3 '16 Q3 '15 YTD '16 YTD '15
Net Sales 484.4$ 580.9$ 1,598.8$ 1,786.7$
% Change vs. '15 (16.6%) (10.5%)
Operating Profit, as reported 48.6 78.9 159.2 228.6
Operating Margin % 10.0% 13.6% 10.0% 12.8%
Operating Profit, as adjusted(1) 49.0 78.9 166.7 228.6
Operating Margin % 10.1% 13.6% 10.4% 12.8%
Backlog 253 301
% Change vs. '15 (16%)
“Celebrating 50 years of innovation and
performance with our Customers”
$614 $392 $947 $512 $383 $444 $701 $418 $409 $378
85%66%
206%
100%
57%
80%
162%
83%
70%
80%
0%
50%
100%
150%
200%
250%
$0
$200
$400
$600
$800
$1,000
Q2 '14 Q3 '14 Q4 '14 Q1 '15 Q2 '15 Q3 '15 Q4 '15 Q1 '16 Q2 '16 Q3 '16
Net Bookings Book-to-Bill Ratio

Cranes
12
USD Millions
(1) See the appendix for reconciliation to US GAAP
Q3 '16 Q3 '15 YTD '16 YTD '15
Net Sales 282.8$ 379.3$ 947.5$ 1,160.3$
% Change vs. '15 (25.4%) (18.3%)
Operating Profit, as reported (12.1) 12.1 (41.5) 35.8
Operating Margin % (4.3%) 3.2% (4.4%) 3.1%
Operating Profit, as adjusted(1) (10.5) 16.5 (18.8) 40.2
Operating Margin % (3.7%) 4.4% (2.0%) 3.5%
Backlog 317 401
% Change vs. '15 (21%)
• Mobile cranes markets weaker
than expected
• Operational issues
• Leadership changes
AT40
Demag® AC
$462 $252 $423 $340 $400 $272 $416 $293 $279 $228
99%
67%
97% 97% 95%
74%
103%
97%
82%
83%
0%
20%
40%
60%
80%
100%
120%
$50
$100
$150
$200
$250
$300
$350
$400
$450
$500
Q2 '14 Q3 '14 Q4 '14 Q1 '15 Q2 '15 Q3 '15 Q4 '15 Q1 '16 Q2 '16 Q3 '16
Net Bookings Book-to-Bill Ratio

Materials Processing
13
• Good execution
• Concrete market
continuing to grow
• Crushing & Screening
market stable in
aggregates, but mining remains weak
• Fuchs® material handler volume down
USD Millions
(1) See the appendix for reconciliation to US GAAP
Q3 '16 Q3 '15 YTD '16 YTD '15
Net Sales 228.2$ 238.7$ 708.2$ 698.6$
% Change vs. '15 (4.4%) 1.4%
Operating Profit, as reported 19.5 17.6 63.9 54.8
Operating Margin % 8.5% 7.4% 9.0% 7.8%
Operating Profit, as adjusted(1) 19.7 20.7 65.2 57.9
Operating Margin % 8.6% 8.7% 9.2% 8.3%
Backlog 203 139
% Change vs. '15 46%$240 $191 $231 $266 $183 $214 $244 $261 $236 $265
99%88%
101%
130%
77%
93%
104%
119%
94%
118%
0%
20%
40%
60%
80%
100%
120%
140%
0
40
80
120
160
200
240
280
Q2 '14 Q3 '14 Q4 '14 Q1 '15 Q2 '15 Q3 '15 Q4 '15 Q1 '16 Q2 '16 Q3 '16
Net Bookings Book-to-Bill Ratio

Summary
Mixed global markets:
• Weakening mobile crane markets
• Caution prevails in NA rental channel
– replacement cycle
• Aggregates steady, continued growth
in NA concrete
Focus, Simplify & Execute:
• Complete the pending sale of MHPS
• Manage through the NA replacement
cycle in AWP
• Turnaround the mobile crane business
• Address global cost structure
14
14

Questions?
15

Appendix
16

Backlog Trend
Backlog shown is Continuing Operations, deliverable in less than 12 months
USD Millions
17
$ % $ %
Terex (114) (12%) (77) (9%)
Corp & Other (21) (39%) (9) (21%)
MP 34 20% 64 46%
Cranes (38) (11%) (84) (21%)
AWP (89) (26%) (48) (16%)
Sequential
Change
Year on Year
Change
524 421
218
704 706
441
301
570 517
342 253
652
636
527
512 535
514
401
407 398
355
317
156
150
128
130 193
153
139
149 187
169
203
144
113
71
60
90
74
42
52 58
54
33
March 2014 June 2014 September2014
December2014
March 2015 June 2015 September2015
December2015
March 2016 June 2016 September2016
AWP Cranes MP Corporate & Other
1,182
1,406
1,524
883
1,476
944
1,178
1,320
1,160
920
806
Q3 Q3 Q3

North America
Western Europe Asia/
Pacific
E. Europe, Middle
East & Africa
LATAM
Sales by Geography 2016 vs 2015
18
(18)%
Actual FX-Adj.
(18)% 3%
Q3
Actual FX-Adj.
Q3
Actual FX-Adj.
Q3
(32)%
Actual FX-Adj.
(29)% Q3
Actual FX-Adj.
Q3
Continuing Operations Global Sales
25%
(60)% (60)%
(15)% (12)%
27%
15%
6%2%
50%
2016 Q3
Western Europe
Asia / Pacific
E. Eu, ME, Africa
LATAM
North America
27%
10%
7%5%
51%
2015 Q3
24%

Q3 2016 Adjustments
19
USD Millions, except Earnings per Share
Q3 2016 Q3 2016
As Reported As Adjusted
Net Sales 1,056.4$ - - - 1,056.4$
Income (loss) from Operations 39.6 3.6 5.8 - 49.0
Interest & Other Income (Expense) (25.7) 2.6 - - (23.1)
Income (Loss) from Cont. Ops. Before Taxes 13.9 6.2 5.8 - 25.9
Benefit from (Provision for) Income Taxes 19.3 (0.9) (1.9) (22.0) (5.5)
Income (Loss) from Continuing Operations(1) 33.3$ 5.3 3.9 (22.0) 20.5$
Earnings (loss) per Share 0.31$ 0.05$ 0.03$ (0.20)$ 0.19$
Deal Related
Restructuring
& Related Tax Related
(1) Excludes $0.1 million net loss attributable to non-controlling interest

Q3 2015 Adjustments
20
USD Millions, except Earnings per Share
Q3 2015 Q3 2015
As Reported As Adjusted
Net Sales 1,255.4$ - - - 1,255.4$
Income (loss) from Operations 92.1 - 11.8 2.5 106.4
Interest & Other Income (Expense) (36.2) 8.6 - - (27.6)
Income (Loss) from Cont. Ops. Before Taxes 55.9 8.6 11.8 2.5 78.8
Benefit from (Provision for) Income Taxes (25.6) (0.7) (3.3) (0.9) (30.5)
Income (Loss) from Continuing Operations 30.3$ 7.9 8.5 1.6 48.3$
Earnings (loss) per Share 0.28$ 0.07$ 0.07$ 0.02$ 0.44$
Deal Related
Restructuring
& Related
Product
Campaign
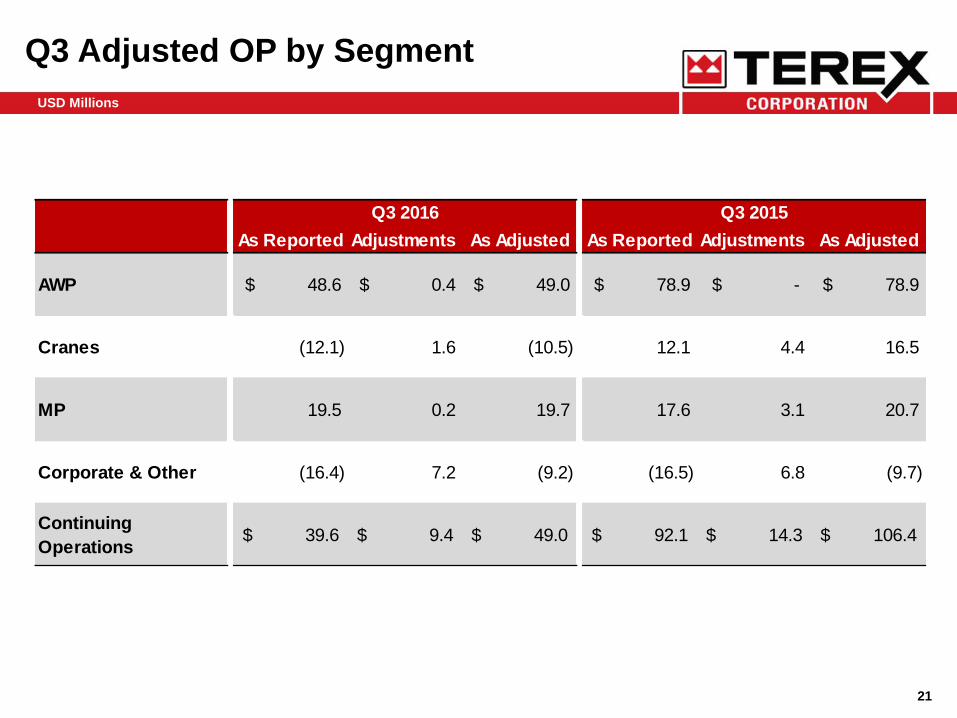
Q3 Adjusted OP by Segment
USD Millions
21
As Reported Adjustments As Adjusted As Reported Adjustments As Adjusted
AWP $ 48.6 $ 0.4 $ 49.0 $ 78.9 $ - $ 78.9
Cranes (12.1) 1.6 (10.5) 12.1 4.4 16.5
MP 19.5 0.2 19.7 17.6 3.1 20.7
Corporate & Other (16.4) 7.2 (9.2) (16.5) 6.8 (9.7)
Continuing
Operations39.6$ 9.4$ 49.0$ 92.1$ 14.3$ 106.4$
Q3 2016 Q3 2015

YTD Operating Results
USD Millions, except Earnings per Share
22
Note: Results shown are for Continuing Operations, Except ROIC
(1) See appendix for reconciliation to US GAAP
YTD 2016 YTD 2016 YTD 2015 YTD 2015
As Reported As Adjusted(1)As Reported As Adjusted(1)
Net Sales $3,468.4 $3,468.4 $3,854.1 $3,854.1
% Change vs 2015 (10.0%) (10.0%)
Income (loss) from Operations 124.3 184.5 266.5 280.8
Operating Margin 3.6% 5.3% 6.9% 7.3%
Interest & Other Income (Expense) (86.0) (68.7) (97.5) (88.9)
Effective Tax Rate (215.4%) 24.0% 38.2% 36.2%
Earnings (loss) per Share $1.10 $0.81 $0.95 $1.12
EBITDA(1) $175.0 $235.2 $316.4 $330.7
% Net Sales 5.0% 6.8% 8.2% 8.6%
ROIC(1) 25.6% 9.7%

YTD 2016 YTD 2016
As Reported As Adjusted
Net Sales 3,468.4$ - - - 3,468.4$
Income (loss) from Operations 124.3 12.2 48.0 - 184.5
Interest & Other Income (Expense) (86.0) 17.3 - - (68.7)
Income (Loss) from Cont. Ops. Before Taxes 38.3 29.5 48.0 - 115.8
Benefit from (Provision for) Income Taxes 82.5 (6.4) (14.2) (89.7) (27.8)
Income (Loss) from Continuing Operations(1) 120.9$ 23.1 33.8 (89.7) 88.1$
Earnings (loss) per Share 1.10$ 0.21$ 0.32$ (0.82)$ 0.81$
Deal Related
Restructuring
& Related Tax Related
YTD 2016 Adjustments
23
USD Millions, except Earnings per Share
(1) Excludes $0.1 million net loss attributable to non-controlling interest

YTD 2015 Adjustments
24
USD Millions, except Earnings per Share
YTD 2015 YTD 2015
As Reported As Adjusted
Net Sales 3,854.1$ - - - 3,854.1$
Income (loss) from Operations 266.5 - 11.8 2.5 280.8
Interest & Other Income (Expense) (97.5) 8.6 - - (88.9)
Income (Loss) from Cont. Ops. Before Taxes 169.0 8.6 11.8 2.5 191.9
Benefit from (Provision for) Income Taxes (64.5) (0.7) (3.3) (0.9) (69.4)
Income (Loss) from Continuing Operations(1) 104.6$ 7.9 8.5 1.6 122.6$
Earnings (loss) per Share 0.95$ 0.07$ 0.08$ 0.02$ 1.12$
Deal Related
Restructuring
& Related
Product
Campaign
(1) Excludes $0.1 million net loss attributable to non-controlling interest

YTD Adjusted OP by Segment
USD Millions
25
As Reported Adjustments As Adjusted As Reported Adjustments As Adjusted
AWP $ 159.2 $ 7.5 $ 166.7 $ 228.6 $ - $ 228.6
Cranes (41.5) 22.7 (18.8) 35.8 4.4 40.2
MP 63.9 1.3 65.2 54.8 3.1 57.9
Corporate & Other (57.3) 28.7 (28.6) (52.7) 6.8 (45.9)
Continuing
Operations124.3$ 60.2$ 184.5$ 266.5$ 14.3$ 280.8$
YTD 2015YTD 2016

Glossary
26
In an effort to provide investors with additional information regarding the Company’s results,
Terex refers to various GAAP (U.S. generally accepted accounting principles) and non-GAAP
financial measures which management believes provides useful information to investors.
These non-GAAP measures may not be comparable to similarly titled measures being
disclosed by other companies. In addition, the Company believes that non-GAAP financial
measures should be considered in addition to, and not in lieu of, GAAP financial measures.
Terex believes that this non-GAAP information is useful to understanding its operating results
and the ongoing performance of its underlying businesses. Management of Terex uses both
GAAP and non-GAAP financial measures to establish internal budgets and targets and to
evaluate the Company’s financial performance against such budgets and targets.
The amounts described below are unaudited, are reported in millions of U.S. dollars (except
per share data and percentages), and are as of or for the period ended September 30, 2016,
unless otherwise indicated.
As changes in foreign currency exchange rates have a non-operating impact on the translation
of our financial results, we believe excluding the effect of these changes assists in the
assessment of our business results between periods. We calculate the translation effect of
foreign currency exchange rate changes by translating the current period results at the rates
that the comparable prior periods were translated to isolate the foreign exchange component of
the fluctuation from the operational component.

Glossary: Free Cash Flow
USD Millions
27
Free Cash Flow - We calculate a non-GAAP measure of free cash flow. We define free cash
flow as Net cash provided by (used in) operating activities, plus (minus) increases
(decreases) in Terex Financial Services (“TFS”) assets, plus (minus) decreases (increases)
in cash balances held for settlement on securitized assets, less Capital expenditures. We
believe that the measure of free cash flow provides management and investors further useful
information on cash generation or use in our primary operations.
2016 2015 2016 2015
Net cash provided by (used in) operating activities 106.4$ 28.2$ 90.8$ (56.6)$
Increase (Decrease) in TFS Assets (39.3) 56.0 (59.8) 177.5
(Increase) Decrease in cash for securitization settlement - 2.0 6.2 (4.8)
Capital expenditures (20.1) (24.7) (64.2) (73.4)
Free Cash Flow 47.0$ 61.5$ (27.0)$ 42.7$
Three Months
Ended September 30,
Nine Months
Ended September 30,
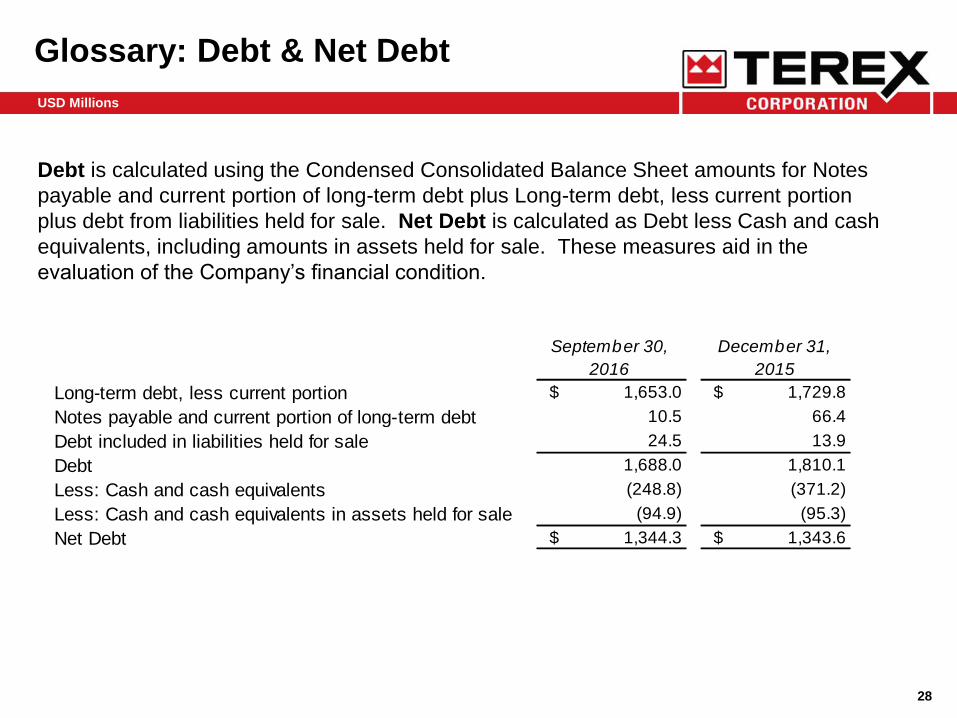
Glossary: Debt & Net Debt
USD Millions
28
Debt is calculated using the Condensed Consolidated Balance Sheet amounts for Notes
payable and current portion of long-term debt plus Long-term debt, less current portion
plus debt from liabilities held for sale. Net Debt is calculated as Debt less Cash and cash
equivalents, including amounts in assets held for sale. These measures aid in the
evaluation of the Company’s financial condition.
Long-term debt, less current portion $ 1,653.0 $ 1,729.8
Notes payable and current portion of long-term debt 10.5 66.4
Debt included in liabilities held for sale 24.5 13.9
Debt 1,688.0 1,810.1
Less: Cash and cash equivalents (248.8) (371.2)
Less: Cash and cash equivalents in assets held for sale (94.9) (95.3)
Net Debt $ 1,344.3 $ 1,343.6
September 30,
2016
December 31,
2015

Glossary: EBITDA
USD Millions
29
EBITDA is defined as earnings, before interest, other non-operating income (loss), income (loss) attributable to non-controlling
interest, taxes, depreciation and amortization. The Company calculates this by subtracting the following items from Net income
(loss) attributable to Terex Corporation: Net loss (income) attributable to noncontrolling interests; (Gain) loss on disposition of
discontinued operations- net of tax; and (Income) loss from discontinued operations – net of tax. Then adds the Provision for (benefit
from) income taxes; Interest & Other (Income) Expense; the Depreciation and Amortization amounts reported in the Consolidated
Statement of Cash Flows less amortization of debt issuance costs that are recorded in Interest expense. Terex believes that disclosure of EBITDA will be helpful to those reviewing its performance, as EBITDA provides information on
Terex’s ability to meet debt service, capital expenditure and working capital requirements, and is also an indicator of profitability.
Net income (loss) attributable to Terex Corporation $ 96.8 $ 43.6 $ 91.1 $ 129.4
Net income (loss) attributable to noncontrolling interest 0.5 1.3 (0.2) 3.0
Net income (loss) 97.3 44.9 90.9 132.4
(Gain) loss on disposition of discontinued operations- net of tax — 1.2 (3.5) (1.5)
(Income) loss from discontinued operations – net of tax (64.1) (15.8) 33.4 (26.4)
Income (loss) from continuing operations 33.2 30.3 120.8 104.5
Provision for (benefit from) income taxes (19.3) 25.6 (82.5) 64.5
Interest & Other (Income) Expense 25.7 36.2 86.0 97.5
Income (loss) from operations 39.6 92.1 124.3 266.5
Depreciation 17.5 10.8 48.4 47.5
Amortization 2.1 2.2 6.3 6.3
Bank fee amortization not included in Income (loss) from operations (1.3) (1.3) (4.0) (3.9)
EBITDA 57.9 103.8 175.0 316.4
Operating profit adjustments 9.4 14.3 60.2 14.3
Adjusted EBITDA $ 67.3 $ 118.1 $ 235.2 $ 330.7
2015 2016 2015
Ended September 30,
Nine MonthsThree Months
Ended September 30,
2016

Glossary: ROIC
30
Return on Invested Capital (“ROIC”) continues to be a metric we use to measure our
performance. ROIC and Non-GAAP Measures assist in showing how effectively we utilize capital
invested in our operations. After-tax ROIC is determined by dividing the sum of NOPAT for each
of the previous four quarters by the average of the sum of Total Terex Corporation stockholders’
equity plus Debt (as defined below) less Cash and cash equivalents for the previous five
quarters. NOPAT for each quarter is calculated by multiplying Income (loss) from continuing and
discontinued operations by a figure equal to one minus the effective tax rate of the Company.
We believe that earnings from discontinued operations, as well as the net assets that comprise
those operations’ invested capital, should be included in this calculation because it captures the
financial returns on our capital allocation decisions for the measured periods. Furthermore, we
believe returns on capital deployed in TFS do not represent our primary operations and,
therefore, TFS assets and results from operations have been excluded from the Non-GAAP
Measures. The effective tax rate is equal to the (Provision for) benefit from income taxes divided
by Income (loss) from continuing operations before income taxes for the respective quarter. Debt
is calculated using amounts for Notes payable and current portion of long-term debt plus Long-
term debt, less current portion. We calculate ROIC using the last four quarters’ adjusted NOPAT
as this represents the most recent 12-month period at any given point of determination. In order
for the denominator of the ROIC ratio to properly match the operational period reflected in the
numerator, we include the average of five quarters’ ending balance sheet amounts so that the
denominator includes the average of the opening through ending balances (on a quarterly basis)
thereby providing, over the same time period as the numerator, four quarters of average invested
capital.

Glossary: ROIC Continued
USD Millions
See reconciliation of adjusted amounts below on the following ROIC tables. Amounts are as of and for the three months ended for the
period referenced in the tables.
31

Glossary: ROIC Continued
USD Millions
32