Embed Size (px)
Citation preview
RELEASE
1
PRESS RELEASE
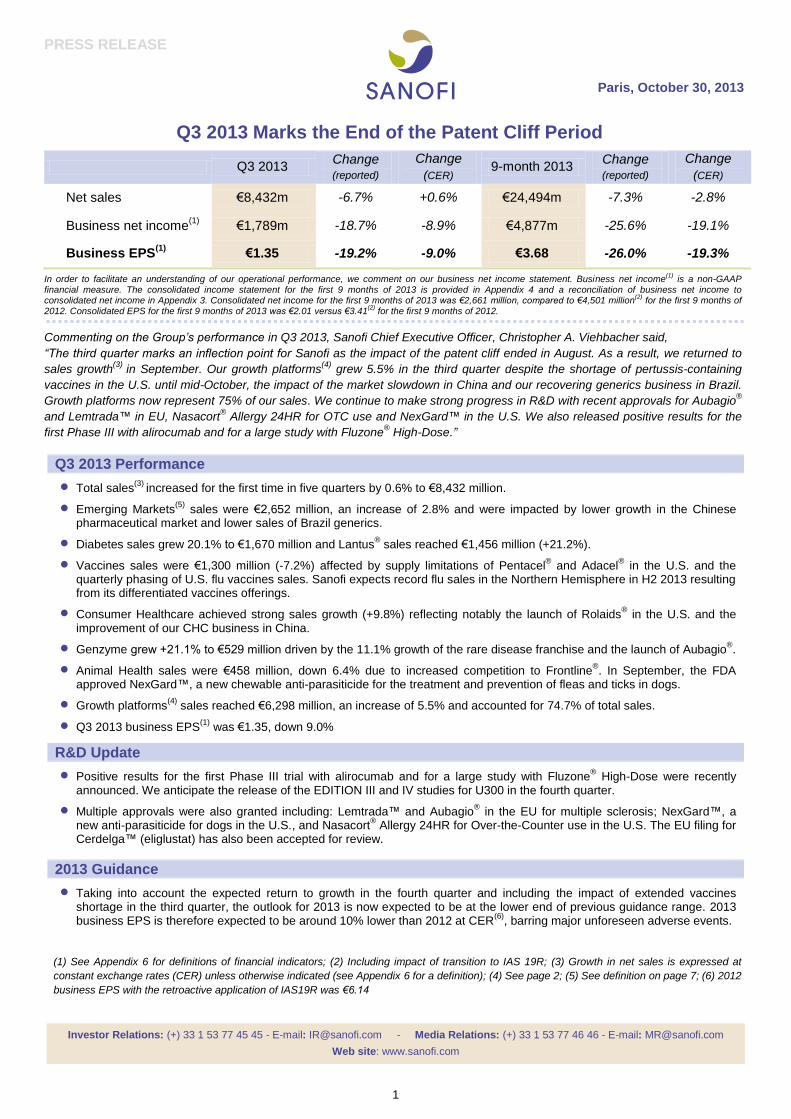
Q3 2013 Marks the End of the Patent Cliff Period
Q3 2013 Change (reported)
Change
(CER) 9-month 2013
Change (reported)
Change
(CER)
Net sales €8,432m -6.7% +0.6% €24,494m -7.3% -2.8%
Business net income(1)
€1,789m -18.7% -8.9% €4,877m -25.6% -19.1%
Business EPS(1)
€1.35 -19.2% -9.0% €3.68 -26.0% -19.3%
In order to facilitate an understanding of our operational performance, we comment on our business net income statement. Business net income(1)
is a non-GAAP financial measure. The consolidated income statement for the first 9 months of 2013 is provided in Appendix 4 and a reconciliation of business net income to consolidated net income in Appendix 3. Consolidated net income for the first 9 months of 2013 was €2,661 million, compared to €4,501 million
(2) for the first 9 months of
2012. Consolidated EPS for the first 9 months of 2013 was €2.01 versus €3.41(2)
for the first 9 months of 2012.
Commenting on the Group’s performance in Q3 2013, Sanofi Chief Executive Officer, Christopher A. Viehbacher said,
“The third quarter marks an inflection point for Sanofi as the impact of the patent cliff ended in August. As a result, we returned to
sales growth(3)
in September. Our growth platforms(4)
grew 5.5% in the third quarter despite the shortage of pertussis-containing
vaccines in the U.S. until mid-October, the impact of the market slowdown in China and our recovering generics business in Brazil.
Growth platforms now represent 75% of our sales. We continue to make strong progress in R&D with recent approvals for Aubagio®
and Lemtrada™ in EU, Nasacort® Allergy 24HR for OTC use and NexGard™ in the U.S. We also released positive results for the
first Phase III with alirocumab and for a large study with Fluzone® High-Dose.”
Q3 2013 Performance
Total sales(3)
increased for the first time in five quarters by 0.6% to €8,432 million.
Emerging Markets(5)
sales were €2,652 million, an increase of 2.8% and were impacted by lower growth in the Chinese pharmaceutical market and lower sales of Brazil generics.
Diabetes sales grew 20.1% to €1,670 million and Lantus® sales reached €1,456 million (+21.2%).
Vaccines sales were €1,300 million (-7.2%) affected by supply limitations of Pentacel® and Adacel
® in the U.S. and the
quarterly phasing of U.S. flu vaccines sales. Sanofi expects record flu sales in the Northern Hemisphere in H2 2013 resulting from its differentiated vaccines offerings.
Consumer Healthcare achieved strong sales growth (+9.8%) reflecting notably the launch of Rolaids® in the U.S. and the
improvement of our CHC business in China.
Genzyme grew +21.1% to €529 million driven by the 11.1% growth of the rare disease franchise and the launch of Aubagio®.
Animal Health sales were €458 million, down 6.4% due to increased competition to Frontline®. In September, the FDA
approved NexGard™, a new chewable anti-parasiticide for the treatment and prevention of fleas and ticks in dogs.
Growth platforms(4)
sales reached €6,298 million, an increase of 5.5% and accounted for 74.7% of total sales.
Q3 2013 business EPS(1)
was €1.35, down 9.0%
R&D Update
Positive results for the first Phase III trial with alirocumab and for a large study with Fluzone® High-Dose were recently
announced. We anticipate the release of the EDITION III and IV studies for U300 in the fourth quarter.
Multiple approvals were also granted including: Lemtrada™ and Aubagio® in the EU for multiple sclerosis; NexGard™, a
new anti-parasiticide for dogs in the U.S., and Nasacort® Allergy 24HR for Over-the-Counter use in the U.S. The EU filing for
Cerdelga™ (eliglustat) has also been accepted for review.
2013 Guidance
Taking into account the expected return to growth in the fourth quarter and including the impact of extended vaccines shortage in the third quarter, the outlook for 2013 is now expected to be at the lower end of previous guidance range. 2013 business EPS is therefore expected to be around 10% lower than 2012 at CER
(6), barring major unforeseen adverse events.
(1) See Appendix 6 for definitions of financial indicators; (2) Including impact of transition to IAS 19R; (3) Growth in net sales is expressed at
constant exchange rates (CER) unless otherwise indicated (see Appendix 6 for a definition); (4) See page 2; (5) See definition on page 7; (6) 2012
business EPS with the retroactive application of IAS19R was €6.14
Paris, October 30, 2013
Investor Relations: (+) 33 1 53 77 45 45 - E-mail: [email protected] - Media Relations: (+) 33 1 53 77 46 46 - E-mail: [email protected]
Web site: www.sanofi.com
2
2013 third-quarter and 9-month sales
Unless otherwise indicated, all sales growth figures in this press release are stated at constant exchange rates(1)
.
2013 third-quarter sales reached €8,432 million, a decrease of 6.7% on a reported basis. Exchange rate
movements had a negative effect of 7.3 percentage points largely due to the depreciation of the Japanese Yen,
U.S. Dollar, Brazilian Real, Venezuelan Bolivar, Australian Dollar, South African Rand and Russian Ruble against
the Euro.
Year-to-date sales were €24,494 million, a decrease of 7.3% on a reported basis. Exchange rate movements had
an unfavorable effect of 4.5 percentage points mainly driven by the depreciation of the Japanese Yen, U.S.
Dollar, Venezuelan Bolivar, Brazilian Real, Australian dollar and South African Rand against the Euro.
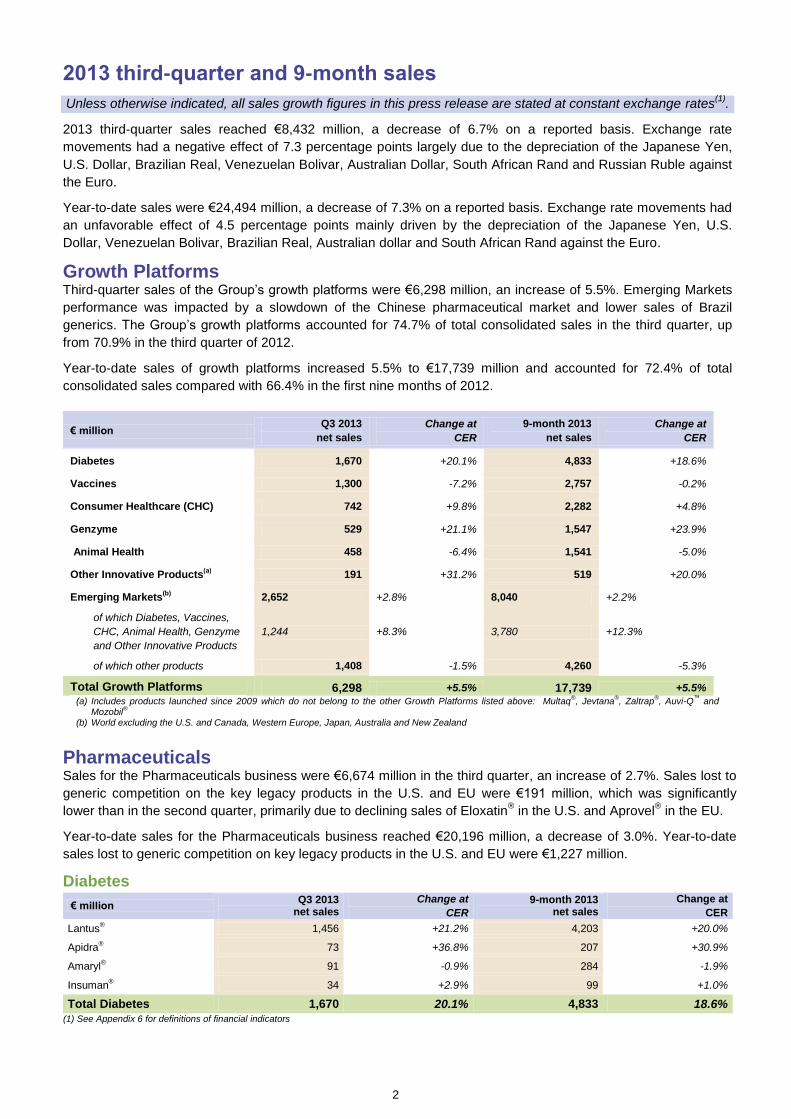
Growth Platforms Third-quarter sales of the Group’s growth platforms were €6,298 million, an increase of 5.5%. Emerging Markets
performance was impacted by a slowdown of the Chinese pharmaceutical market and lower sales of Brazil
generics. The Group’s growth platforms accounted for 74.7% of total consolidated sales in the third quarter, up
from 70.9% in the third quarter of 2012.
Year-to-date sales of growth platforms increased 5.5% to €17,739 million and accounted for 72.4% of total
consolidated sales compared with 66.4% in the first nine months of 2012.
€ million Q3 2013
net sales
Change at
CER
9-month 2013
net sales
Change at
CER
Diabetes 1,670 +20.1% 4,833 +18.6%
Vaccines 1,300 -7.2% 2,757 -0.2%
Consumer Healthcare (CHC) 742 +9.8% 2,282 +4.8%
Genzyme 529 +21.1% 1,547 +23.9%
Animal Health 458 -6.4% 1,541 -5.0%
Other Innovative Products(a)
191 +31.2% 519 +20.0%
Emerging Markets(b)
2,652 +2.8% 8,040 +2.2%
of which Diabetes, Vaccines,
CHC, Animal Health, Genzyme
and Other Innovative Products
1,244 +8.3% 3,780 +12.3%
of which other products 1,408 -1.5% 4,260 -5.3%
Total Growth Platforms 6,298 +5.5% 17,739 +5.5%
(a) Includes products launched since 2009 which do not belong to the other Growth Platforms listed above: Multaq®, Jevtana
®, Zaltrap
®, Auvi-Q
™ and
Mozobil®
(b) World excluding the U.S. and Canada, Western Europe, Japan, Australia and New Zealand
Pharmaceuticals Sales for the Pharmaceuticals business were €6,674 million in the third quarter, an increase of 2.7%. Sales lost to
generic competition on the key legacy products in the U.S. and EU were €191 million, which was significantly
lower than in the second quarter, primarily due to declining sales of Eloxatin® in the U.S. and Aprovel
® in the EU.
Year-to-date sales for the Pharmaceuticals business reached €20,196 million, a decrease of 3.0%. Year-to-date
sales lost to generic competition on key legacy products in the U.S. and EU were €1,227 million.
Diabetes
€ million Q3 2013
net sales
Change at
CER
9-month 2013 net sales
Change at
CER
Lantus® 1,456 +21.2% 4,203 +20.0%
Apidra® 73 +36.8% 207 +30.9%
Amaryl® 91 -0.9% 284 -1.9%
Insuman® 34 +2.9% 99 +1.0%
Total Diabetes 1,670 20.1% 4,833 18.6% (1) See Appendix 6 for definitions of financial indicators
3
The Diabetes division recorded its eleventh quarter of double-digit growth (up 20.1%) to €1,670 million. Lantus®
sales reached €1,456 million, an increase of 21.2%. In the U.S., Lantus® sales were €985 million, an increase of
30.4%, helped by price increases and switches from vials to SoloSTAR® pen. In the U.S., Lantus
® SoloSTAR
®
sales represented 57.4% of total Lantus® sales in the quarter, versus 51.5% in the third quarter of 2012. Lantus
®
sales in Western Europe reached €201 million, an increase of 3.0%, and were €198 million in Emerging Markets,
an increase of 5.9%. Year-to-date sales of Lantus® totaled €4,203 million, up 20.0%.
Apidra® continued to record dynamic performance with sales of €73 million (up 36.8%) and €207 million (up
30.9%) in the third quarter and the first nine months, respectively.
Sales of Amaryl® were €91 million (down 0.9%) impacted by generic competition in Japan where sales
decreased 13.3% to €20 million. In Emerging Markets, Amaryl® grew 7.4% to €65 million. Year-to-date sales of
Amaryl® were €284 million (down 1.9%), of which €203 million were generated in Emerging Markets (up 9.6%).
Lyxumia® (lixisenatide), a once-daily prandial GLP-1 receptor agonist is now commercialized in several countries
in Europe (including UK, Germany, Spain), in Japan and in Mexico. In Germany the GBA (Gemeinsamer
Bundesausschuss) saw no additional benefit over the GBA-selected comparator therapies, due to factors
including lack of study data versus these comparators. Sanofi disagrees with the decision of the GBA and is
evaluating its options. Third-quarter sales of Lyxumia® were €3 million.
Year-to-date sales of the Diabetes division totaled €4,833 million, an increase of 18.6%.
Genzyme
€ million Q3 2013
net sales
Change at
CER
9-month 2013
net sales
Change at
CER
Cerezyme® 165 +8.6% 507 +14.3%
Myozyme®
/ Lumizyme® 127 +14.7% 369 +11.4%
Fabrazyme® 96 +19.5% 279 +40.9%
Aldurazyme® 38 +7.9% 116 +11.0%
Total Rare Diseases 485 +11.1% 1,450 +16.2%
Aubagio® 44 - 97 -
Total Multiple Sclerosis 44 - 97 -
Total Genzyme 529 +21.1% 1,547 +23.9%
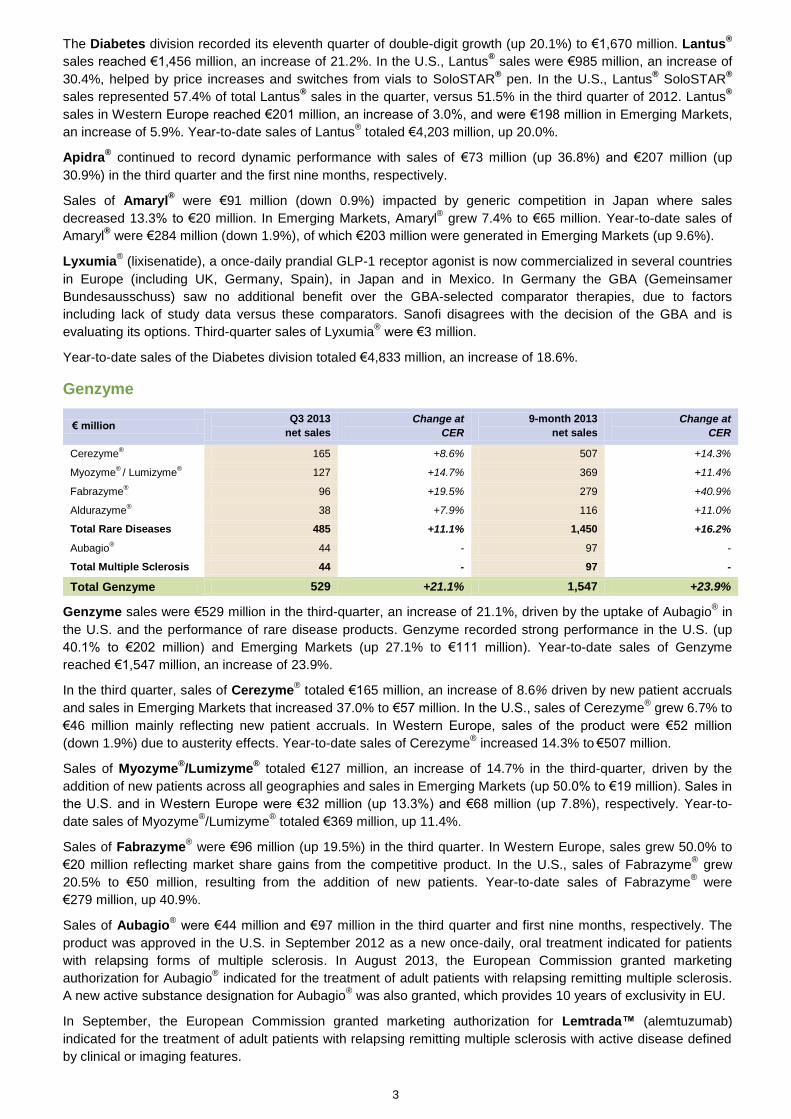
Genzyme sales were €529 million in the third-quarter, an increase of 21.1%, driven by the uptake of Aubagio® in
the U.S. and the performance of rare disease products. Genzyme recorded strong performance in the U.S. (up
40.1% to €202 million) and Emerging Markets (up 27.1% to €111 million). Year-to-date sales of Genzyme
reached €1,547 million, an increase of 23.9%.
In the third quarter, sales of Cerezyme® totaled €165 million, an increase of 8.6% driven by new patient accruals
and sales in Emerging Markets that increased 37.0% to €57 million. In the U.S., sales of Cerezyme® grew 6.7% to
€46 million mainly reflecting new patient accruals. In Western Europe, sales of the product were €52 million
(down 1.9%) due to austerity effects. Year-to-date sales of Cerezyme® increased 14.3% to
€507 million.
Sales of Myozyme®/Lumizyme
® totaled €127 million, an increase of 14.7% in the third-quarter, driven by the
addition of new patients across all geographies and sales in Emerging Markets (up 50.0% to €19 million). Sales in
the U.S. and in Western Europe were €32 million (up 13.3%) and €68 million (up 7.8%), respectively. Year-to-
date sales of Myozyme®/Lumizyme
® totaled €369 million, up 11.4%.
Sales of Fabrazyme® were €96 million (up 19.5%) in the third quarter. In Western Europe, sales grew 50.0% to
€20 million reflecting market share gains from the competitive product. In the U.S., sales of Fabrazyme® grew
20.5% to €50 million, resulting from the addition of new patients. Year-to-date sales of Fabrazyme®
were
€279 million, up 40.9%.
Sales of Aubagio® were €44 million and €97 million in the third quarter and first nine months, respectively. The
product was approved in the U.S. in September 2012 as a new once-daily, oral treatment indicated for patients
with relapsing forms of multiple sclerosis. In August 2013, the European Commission granted marketing
authorization for Aubagio® indicated for the treatment of adult patients with relapsing remitting multiple sclerosis.
A new active substance designation for Aubagio® was also granted, which provides 10 years of exclusivity in EU.
In September, the European Commission granted marketing authorization for Lemtrada™ (alemtuzumab)
indicated for the treatment of adult patients with relapsing remitting multiple sclerosis with active disease defined
by clinical or imaging features.
4
Other Innovative Products(7)
€ million Q3 2013
net sales
Change at
CER
9-month 2013
net sales
Change at
CER
Multaq® 67 +7.7% 198 +5.7%
Jevtana® 59 +12.5% 165 -2.9%
Auvi-Q® 27 - 42 -
Mozobil® 25 0.0% 76 +9.9%
Zaltrap® 13 +100.0% 38 +457.1%
Total Other Innovative Products 191 +31.2% 519 +20.0%
(7) Includes new product launches which do not belong to the other Growth Platforms
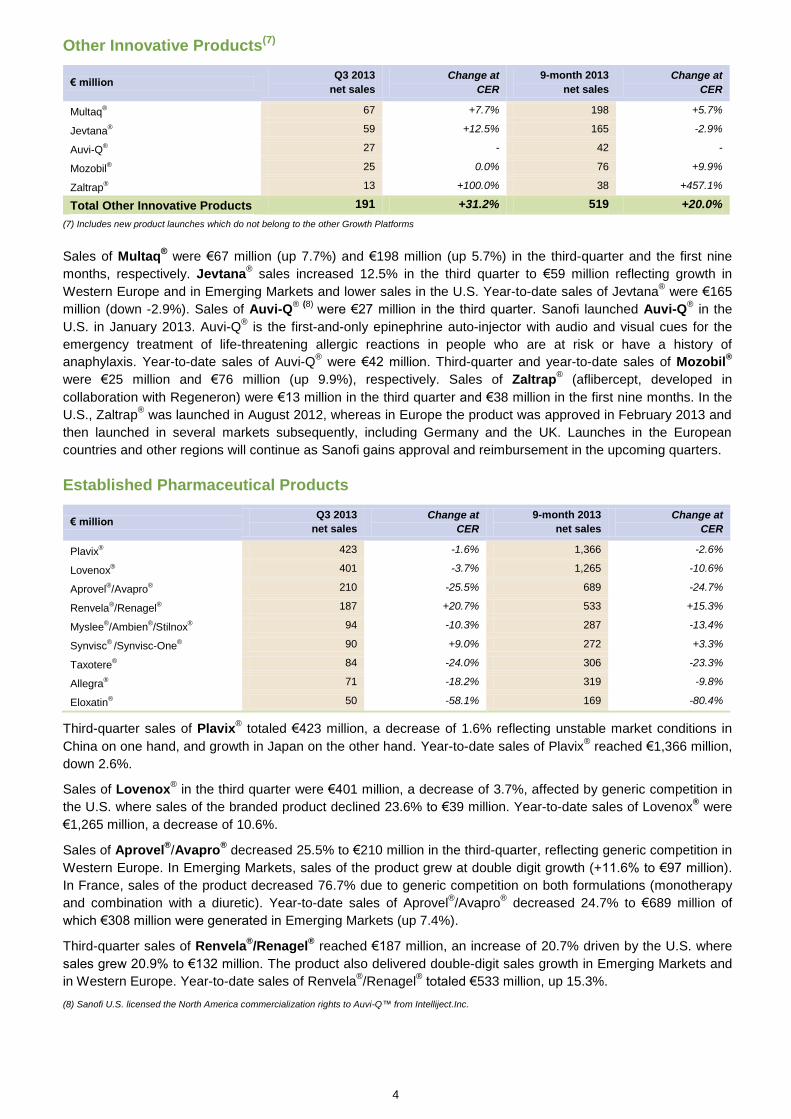
Sales of Multaq® were €67 million (up 7.7%) and €198 million (up 5.7%) in the third-quarter and the first nine
months, respectively. Jevtana® sales increased 12.5% in the third quarter to €59 million reflecting growth in
Western Europe and in Emerging Markets and lower sales in the U.S. Year-to-date sales of Jevtana® were €165
million (down -2.9%). Sales of Auvi-Q® (8)
were €27 million in the third quarter. Sanofi launched Auvi-Q® in the
U.S. in January 2013. Auvi-Q® is the first-and-only epinephrine auto-injector with audio and visual cues for the
emergency treatment of life-threatening allergic reactions in people who are at risk or have a history of
anaphylaxis. Year-to-date sales of Auvi-Q® were €42 million. Third-quarter and year-to-date sales of Mozobil
®
were €25 million and €76 million (up 9.9%), respectively. Sales of Zaltrap® (aflibercept, developed in
collaboration with Regeneron) were €13 million in the third quarter and €38 million in the first nine months. In the
U.S., Zaltrap® was launched in August 2012, whereas in Europe the product was approved in February 2013 and
then launched in several markets subsequently, including Germany and the UK. Launches in the European
countries and other regions will continue as Sanofi gains approval and reimbursement in the upcoming quarters.
Established Pharmaceutical Products
€ million Q3 2013
net sales
Change at
CER
9-month 2013
net sales
Change at
CER
Plavix® 423 -1.6% 1,366 -2.6%
Lovenox® 401 -3.7% 1,265 -10.6%
Aprovel®/Avapro
® 210 -25.5% 689 -24.7%
Renvela®/Renagel
® 187 +20.7% 533 +15.3%
Myslee®/Ambien
®/Stilnox
® 94 -10.3% 287 -13.4%
Synvisc®
/Synvisc-One® 90 +9.0% 272 +3.3%
Taxotere® 84 -24.0% 306 -23.3%
Allegra® 71 -18.2% 319 -9.8%
Eloxatin® 50 -58.1% 169 -80.4%
Third-quarter sales of Plavix® totaled €423 million, a decrease of 1.6% reflecting unstable market conditions in
China on one hand, and growth in Japan on the other hand. Year-to-date sales of Plavix® reached €1,366 million,
down 2.6%.
Sales of Lovenox® in the third quarter were €401 million, a decrease of 3.7%, affected by generic competition in
the U.S. where sales of the branded product declined 23.6% to €39 million. Year-to-date sales of Lovenox® were
€1,265 million, a decrease of 10.6%.
Sales of Aprovel®/Avapro
® decreased 25.5% to €210 million in the third-quarter, reflecting generic competition in
Western Europe. In Emerging Markets, sales of the product grew at double digit growth (+11.6% to €97 million).
In France, sales of the product decreased 76.7% due to generic competition on both formulations (monotherapy
and combination with a diuretic). Year-to-date sales of Aprovel®/Avapro
® decreased 24.7% to €689 million of
which €308 million were generated in Emerging Markets (up 7.4%).
Third-quarter sales of Renvela®/Renagel
® reached €187 million, an increase of 20.7% driven by the U.S. where
sales grew 20.9% to €132 million. The product also delivered double-digit sales growth in Emerging Markets and
in Western Europe. Year-to-date sales of Renvela®/Renagel
® totaled €533 million, up 15.3%.
(8) Sanofi U.S. licensed the North America commercialization rights to Auvi-Q™ from Intelliject.Inc.
5
Sales of the Ambien®
family of products were €94 million, a decrease of 10.3% in the third quarter impacted by
generic competition in Japan where sales decreased 13.7% to €48 million. Year-to-date sales of the Ambien®
family of products totaled €287 million, down 13.4%.
Sales of Synvisc®/Synvisc-One
® were €90 million (up 9.0%) and €272 million (up 3.3%), in the third-quarter and
first nine months, respectively.
Sales of Taxotere® were €84 million in the third-quarter, a decrease of 24.0%, affected by generic competition
globally. Year-to-date sales of Taxotere® were €306 million, down 23.3%.
Third-quarter sales of Allegra® as a prescription drug decreased 18.2% to €71 million reflecting generic
competition in Japan (sales were down 28.6% to €41 million). Year-to-date sales of Allegra® were €319 million,
down 9.8%.
Third-quarter sales of Eloxatin® decreased 58.1% to €50 million due to generic competition in the U.S. where the
product lost its market exclusivity on August 9, 2012. Year-to-date sales of Eloxatin® decreased 80.4% to €169
million.
Consumer Healthcare
€ million Q3 2013
net sales
Change at
CER
9-month 2013
net sales
Change at
CER
Doliprane® 71 +10.9% 222 +12.1%
Allegra® 60 +22.2% 224 +11.0%
Essentiale® 39 +20.0% 147 +20.6%
Enterogermina® 32 +35.7% 100 +19.4%
No Spa® 32 +17.2% 86 +6.0%
Lactacyd® 27 +3.4% 78 +2.5%
Dorflex® 24 +0.0% 70 +5.3%
Other CHC Products 457 +6.4% 1,355 +0.6%
Total Consumer Healthcare 742 +9.8% 2,282 +4.8%
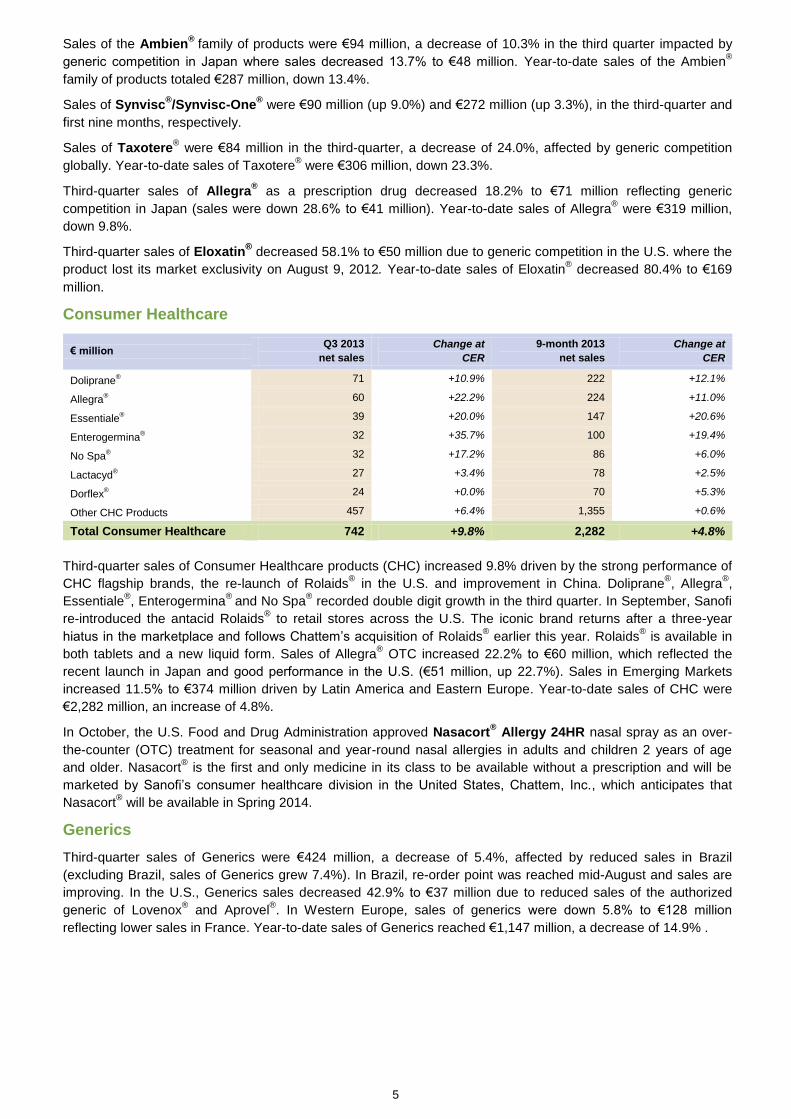
Third-quarter sales of Consumer Healthcare products (CHC) increased 9.8% driven by the strong performance of
CHC flagship brands, the re-launch of Rolaids® in the U.S. and improvement in China. Doliprane
®, Allegra
®,
Essentiale®, Enterogermina
® and No Spa
® recorded double digit growth in the third quarter. In September, Sanofi
re-introduced the antacid Rolaids® to retail stores across the U.S. The iconic brand returns after a three-year
hiatus in the marketplace and follows Chattem’s acquisition of Rolaids® earlier this year. Rolaids
® is available in
both tablets and a new liquid form. Sales of Allegra® OTC increased 22.2% to €60 million, which reflected the
recent launch in Japan and good performance in the U.S. (€51 million, up 22.7%). Sales in Emerging Markets
increased 11.5% to €374 million driven by Latin America and Eastern Europe. Year-to-date sales of CHC were
€2,282 million, an increase of 4.8%.
In October, the U.S. Food and Drug Administration approved Nasacort® Allergy 24HR nasal spray as an over-
the-counter (OTC) treatment for seasonal and year-round nasal allergies in adults and children 2 years of age
and older. Nasacort® is the first and only medicine in its class to be available without a prescription and will be
marketed by Sanofi’s consumer healthcare division in the United States, Chattem, Inc., which anticipates that
Nasacort® will be available in Spring 2014.
Generics
Third-quarter sales of Generics were €424 million, a decrease of 5.4%, affected by reduced sales in Brazil
(excluding Brazil, sales of Generics grew 7.4%). In Brazil, re-order point was reached mid-August and sales are
improving. In the U.S., Generics sales decreased 42.9% to €37 million due to reduced sales of the authorized
generic of Lovenox® and Aprovel
®. In Western Europe, sales of generics were down 5.8% to €128 million
reflecting lower sales in France. Year-to-date sales of Generics reached €1,147 million, a decrease of 14.9% .
6
Vaccines
€ million Q3 2013
net sales
Change at
CER
9-month 2013
net sales
Change at
CER
Influenza Vaccines
(incl. Vaxigrip® and Fluzone
®)
559 -3.9% 731 -2.4%
Polio/Pertussis/Hib Vaccines
(incl. Pentacel®, Pentaxim
® and Imovax
®)
244 -17.2% 807 +2.1%
Meningitis/Pneumonia Vaccines
(incl. Menactra®)
211 -3.5% 414 -0.7%
Travel and Other Endemics Vaccines 101 +31.3% 273 +9.6%
Adult Booster Vaccines (incl. Adacel ®
) 84 -36.4% 293 -19.3%
Other Vaccines 101 +6.0% 239 +22.9%
Total Vaccines
(consolidated sales) 1,300 -7.2% 2,757 -0.2%
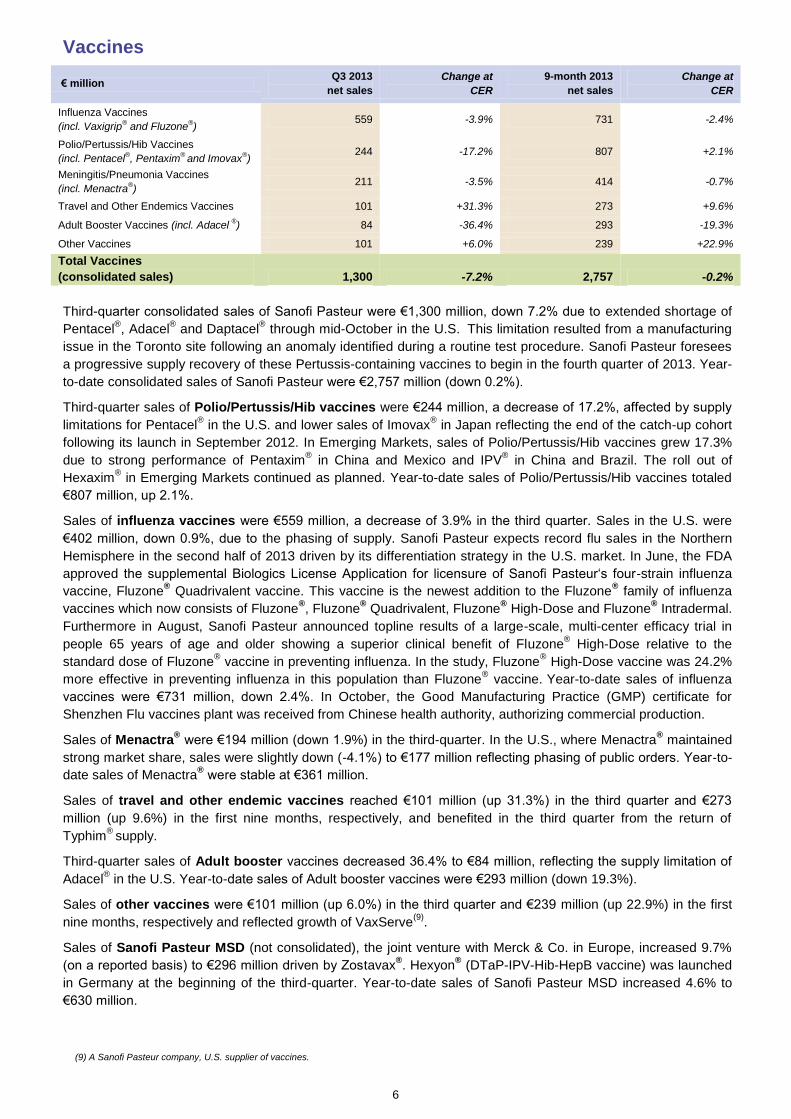
Third-quarter consolidated sales of Sanofi Pasteur were €1,300 million, down 7.2% due to extended shortage of
Pentacel®, Adacel
® and Daptacel
® through mid-October in the U.S.
This limitation resulted from a manufacturing
issue in the Toronto site following an anomaly identified during a routine test procedure. Sanofi Pasteur foresees
a progressive supply recovery of these Pertussis-containing vaccines to begin in the fourth quarter of 2013. Year-
to-date consolidated sales of Sanofi Pasteur were €2,757 million (down 0.2%).
Third-quarter sales of Polio/Pertussis/Hib vaccines were €244 million, a decrease of 17.2%, affected by supply
limitations for Pentacel® in the U.S. and lower sales of Imovax
® in Japan reflecting the end of the catch-up cohort
following its launch in September 2012. In Emerging Markets, sales of Polio/Pertussis/Hib vaccines grew 17.3%
due to strong performance of Pentaxim® in China and Mexico and IPV
® in China and Brazil. The roll out of
Hexaxim® in Emerging Markets continued as planned. Year-to-date sales of Polio/Pertussis/Hib vaccines totaled
€807 million, up 2.1%.
Sales of influenza vaccines were €559 million, a decrease of 3.9% in the third quarter. Sales in the U.S. were
€402 million, down 0.9%, due to the phasing of supply. Sanofi Pasteur expects record flu sales in the Northern
Hemisphere in the second half of 2013 driven by its differentiation strategy in the U.S. market. In June, the FDA
approved the supplemental Biologics License Application for licensure of Sanofi Pasteur‘s four-strain influenza
vaccine, Fluzone® Quadrivalent vaccine. This vaccine is the newest addition to the Fluzone
® family of influenza
vaccines which now consists of Fluzone®, Fluzone
® Quadrivalent, Fluzone
® High-Dose and Fluzone
® Intradermal.
Furthermore in August, Sanofi Pasteur announced topline results of a large-scale, multi-center efficacy trial in
people 65 years of age and older showing a superior clinical benefit of Fluzone® High-Dose relative to the
standard dose of Fluzone® vaccine in preventing influenza. In the study, Fluzone
® High-Dose vaccine was 24.2%
more effective in preventing influenza in this population than Fluzone® vaccine.
Year-to-date sales of influenza
vaccines were €731 million, down 2.4%. In October, the Good Manufacturing Practice (GMP) certificate for
Shenzhen Flu vaccines plant was received from Chinese health authority, authorizing commercial production.
Sales of Menactra® were €194 million (down 1.9%) in the third-quarter. In the U.S., where Menactra
® maintained
strong market share, sales were slightly down (-4.1%) to €177 million reflecting phasing of public orders. Year-to-
date sales of Menactra® were stable at €361 million.
Sales of travel and other endemic vaccines reached €101 million (up 31.3%) in the third quarter and €273
million (up 9.6%) in the first nine months, respectively, and benefited in the third quarter from the return of
Typhim®
supply.
Third-quarter sales of Adult booster vaccines decreased 36.4% to €84 million, reflecting the supply limitation of
Adacel® in the U.S. Year-to-date sales of Adult booster vaccines were €293 million (down 19.3%).
Sales of other vaccines were €101 million (up 6.0%) in the third quarter and €239 million (up 22.9%) in the first
nine months, respectively and reflected growth of VaxServe(9)
.
Sales of Sanofi Pasteur MSD (not consolidated), the joint venture with Merck & Co. in Europe, increased 9.7%
(on a reported basis) to €296 million driven by Zostavax®. Hexyon
® (DTaP-IPV-Hib-HepB vaccine) was launched
in Germany at the beginning of the third-quarter. Year-to-date sales of Sanofi Pasteur MSD increased 4.6% to
€630 million.
(9) A Sanofi Pasteur company, U.S. supplier of vaccines.
7
Animal Health
€ million Q3 2013
net sales
Change at
CER
9-month 2013
net sales
Change at
CER
Companion Animal 279 -10.0% 976 -9.7%
Production Animal 179 +0.5% 565 +4.3%
Total Animal Health 458 -6.4% 1,541 -5.0%
of which fipronil products 151 -10.1% 515 -17.6%
of which avermectin products 90 -11.9% 335 +4.5%
of which Vaccines 160 -1.7% 521 +3.5%
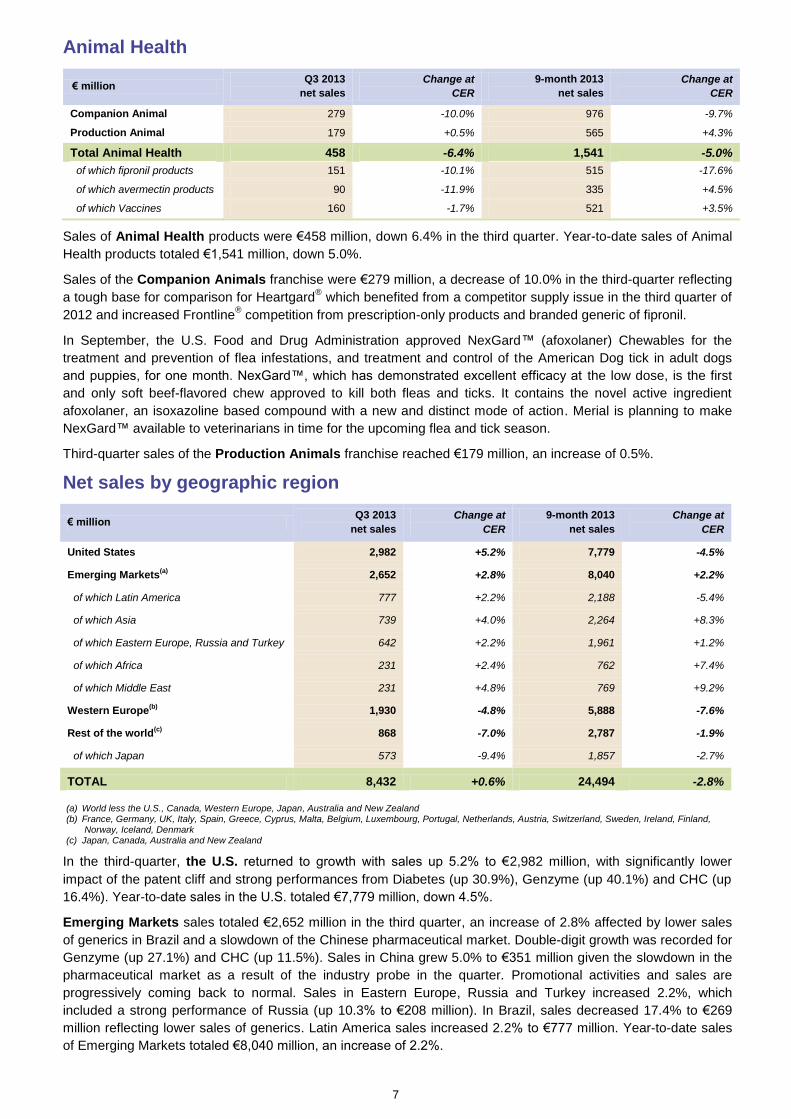
Sales of Animal Health products were €458 million, down 6.4% in the third quarter. Year-to-date sales of Animal
Health products totaled €1,541 million, down 5.0%.
Sales of the Companion Animals franchise were €279 million, a decrease of 10.0% in the third-quarter reflecting
a tough base for comparison for Heartgard® which benefited from a competitor supply issue in the third quarter of
2012 and increased Frontline® competition from prescription-only products and branded generic of fipronil.
In September, the U.S. Food and Drug Administration approved NexGard™ (afoxolaner) Chewables for the
treatment and prevention of flea infestations, and treatment and control of the American Dog tick in adult dogs
and puppies, for one month. NexGard™, which has demonstrated excellent efficacy at the low dose, is the first
and only soft beef-flavored chew approved to kill both fleas and ticks. It contains the novel active ingredient
afoxolaner, an isoxazoline based compound with a new and distinct mode of action. Merial is planning to make
NexGard™ available to veterinarians in time for the upcoming flea and tick season.
Third-quarter sales of the Production Animals franchise reached €179 million, an increase of 0.5%.
Net sales by geographic region
€ million Q3 2013
net sales
Change at
CER
9-month 2013
net sales
Change at
CER
United States 2,982 +5.2% 7,779 -4.5%
Emerging Markets(a)
2,652 +2.8% 8,040 +2.2%
of which Latin America 777 +2.2% 2,188 -5.4%
of which Asia 739 +4.0% 2,264 +8.3%
of which Eastern Europe, Russia and Turkey 642 +2.2% 1,961 +1.2%
of which Africa 231 +2.4% 762 +7.4%
of which Middle East 231 +4.8% 769 +9.2%
Western Europe(b)
1,930 -4.8% 5,888 -7.6%
Rest of the world(c)
868 -7.0% 2,787 -1.9%
of which Japan 573 -9.4% 1,857 -2.7%
TOTAL 8,432 +0.6% 24,494 -2.8%
(a) World less the U.S., Canada, Western Europe, Japan, Australia and New Zealand (b) France, Germany, UK, Italy, Spain, Greece, Cyprus, Malta, Belgium, Luxembourg, Portugal, Netherlands, Austria, Switzerland, Sweden, Ireland, Finland,
Norway, Iceland, Denmark (c) Japan, Canada, Australia and New Zealand
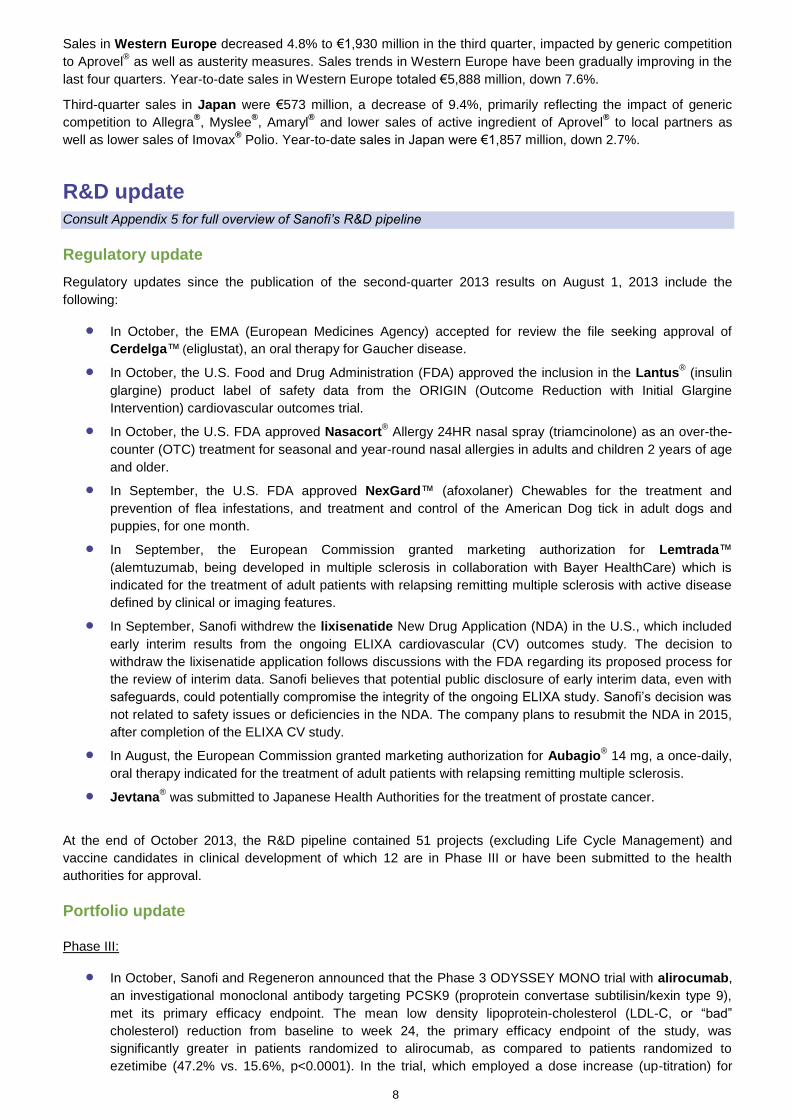
In the third-quarter, the U.S. returned to growth with sales up 5.2% to €2,982 million, with significantly lower
impact of the patent cliff and strong performances from Diabetes (up 30.9%), Genzyme (up 40.1%) and CHC (up
16.4%). Year-to-date sales in the U.S. totaled €7,779 million, down 4.5%.
Emerging Markets sales totaled €2,652 million in the third quarter, an increase of 2.8% affected by lower sales
of generics in Brazil and a slowdown of the Chinese pharmaceutical market. Double-digit growth was recorded for
Genzyme (up 27.1%) and CHC (up 11.5%). Sales in China grew 5.0% to €351 million given the slowdown in the
pharmaceutical market as a result of the industry probe in the quarter. Promotional activities and sales are
progressively coming back to normal. Sales in Eastern Europe, Russia and Turkey increased 2.2%, which
included a strong performance of Russia (up 10.3% to €208 million). In Brazil, sales decreased 17.4% to €269
million reflecting lower sales of generics. Latin America sales increased 2.2% to €777 million. Year-to-date sales
of Emerging Markets totaled €8,040 million, an increase of 2.2%.
8
Sales in Western Europe decreased 4.8% to €1,930 million in the third quarter, impacted by generic competition
to Aprovel® as well as austerity measures. Sales trends in Western Europe have been gradually improving in the
last four quarters. Year-to-date sales in Western Europe totaled €5,888 million, down 7.6%.
Third-quarter sales in Japan were €573 million, a decrease of 9.4%, primarily reflecting the impact of generic
competition to Allegra®, Myslee
®, Amaryl
® and lower sales of active ingredient of Aprovel
® to local partners as
well as lower sales of Imovax® Polio. Year-to-date sales in Japan were €1,857 million, down 2.7%.
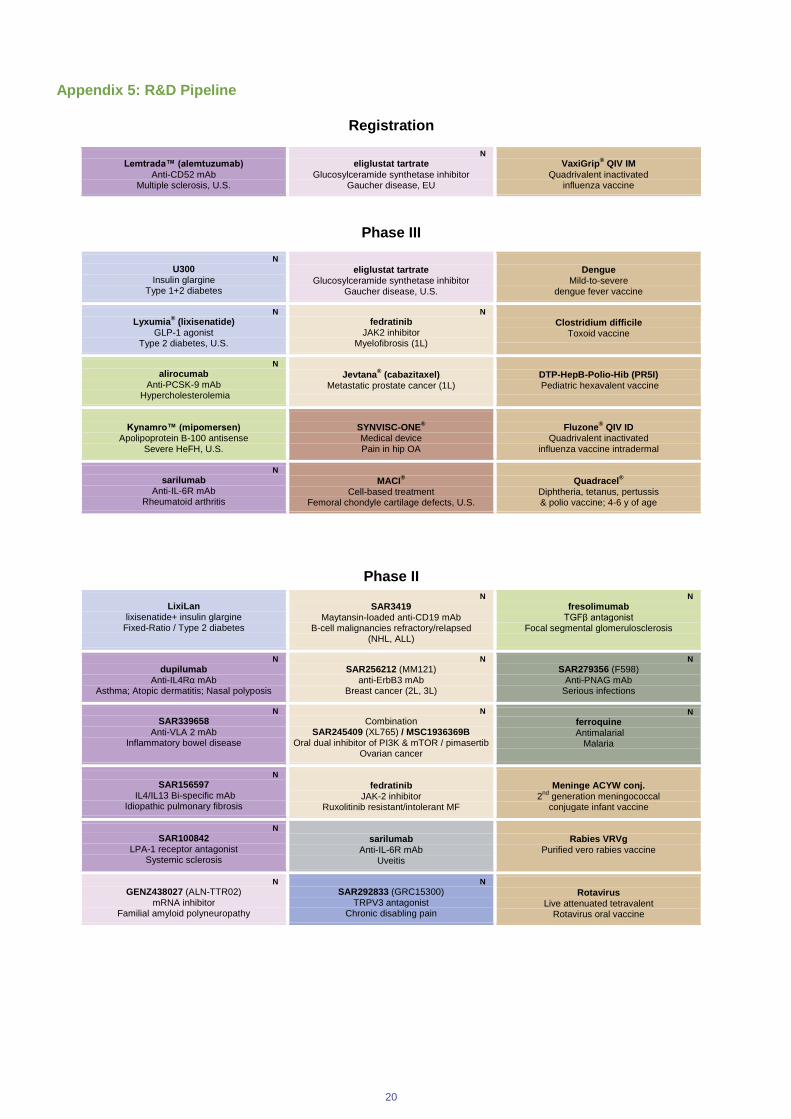
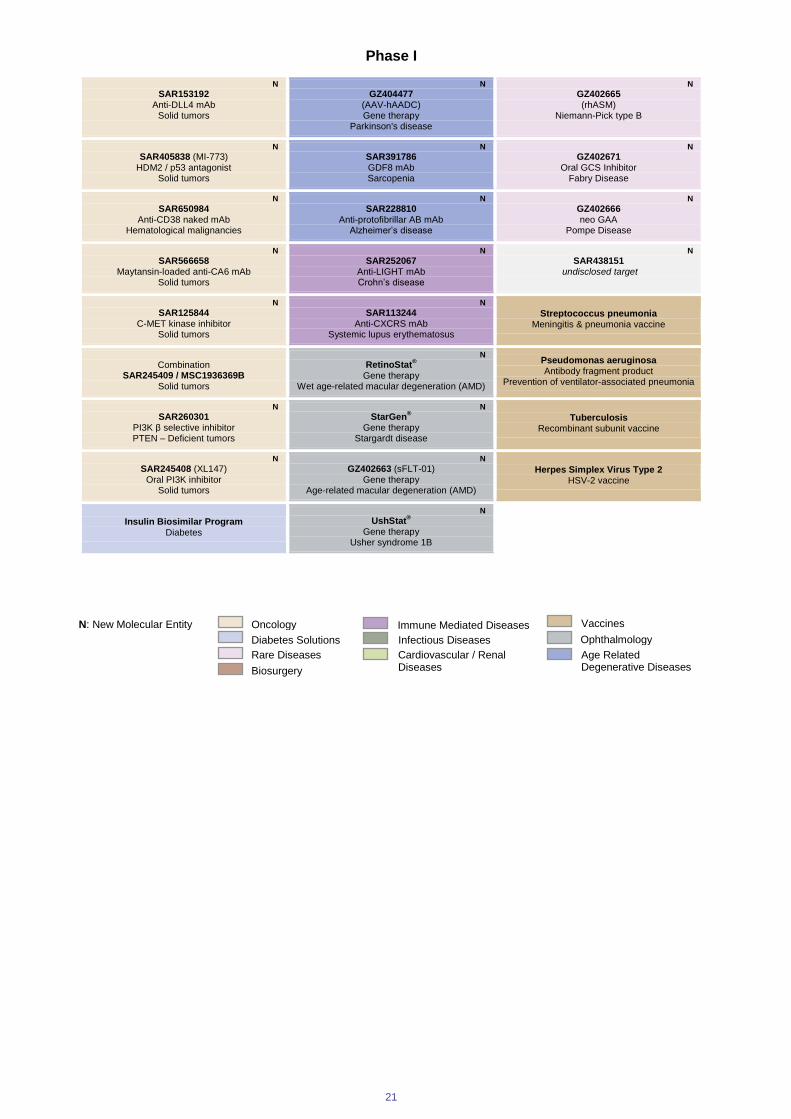
R&D update Consult Appendix 5 for full overview of Sanofi’s R&D pipeline
Regulatory update
Regulatory updates since the publication of the second-quarter 2013 results on August 1, 2013 include the
following:
In October, the EMA (European Medicines Agency) accepted for review the file seeking approval of
Cerdelga™ (eliglustat), an oral therapy for Gaucher disease.
In October, the U.S. Food and Drug Administration (FDA) approved the inclusion in the Lantus® (insulin
glargine) product label of safety data from the ORIGIN (Outcome Reduction with Initial Glargine
Intervention) cardiovascular outcomes trial.
In October, the U.S. FDA approved Nasacort® Allergy 24HR nasal spray (triamcinolone) as an over-the-
counter (OTC) treatment for seasonal and year-round nasal allergies in adults and children 2 years of age
and older.
In September, the U.S. FDA approved NexGard™ (afoxolaner) Chewables for the treatment and
prevention of flea infestations, and treatment and control of the American Dog tick in adult dogs and
puppies, for one month.
In September, the European Commission granted marketing authorization for Lemtrada™
(alemtuzumab, being developed in multiple sclerosis in collaboration with Bayer HealthCare) which is
indicated for the treatment of adult patients with relapsing remitting multiple sclerosis with active disease
defined by clinical or imaging features.
In September, Sanofi withdrew the lixisenatide New Drug Application (NDA) in the U.S., which included
early interim results from the ongoing ELIXA cardiovascular (CV) outcomes study. The decision to
withdraw the lixisenatide application follows discussions with the FDA regarding its proposed process for
the review of interim data. Sanofi believes that potential public disclosure of early interim data, even with
safeguards, could potentially compromise the integrity of the ongoing ELIXA study. Sanofi’s decision was
not related to safety issues or deficiencies in the NDA. The company plans to resubmit the NDA in 2015,
after completion of the ELIXA CV study.
In August, the European Commission granted marketing authorization for Aubagio® 14 mg, a once-daily,
oral therapy indicated for the treatment of adult patients with relapsing remitting multiple sclerosis.
Jevtana® was submitted to Japanese Health Authorities for the treatment of prostate cancer.
At the end of October 2013, the R&D pipeline contained 51 projects (excluding Life Cycle Management) and
vaccine candidates in clinical development of which 12 are in Phase III or have been submitted to the health
authorities for approval.
Portfolio update
Phase III:
In October, Sanofi and Regeneron announced that the Phase 3 ODYSSEY MONO trial with alirocumab,
an investigational monoclonal antibody targeting PCSK9 (proprotein convertase subtilisin/kexin type 9),
met its primary efficacy endpoint. The mean low density lipoprotein-cholesterol (LDL-C, or “bad”
cholesterol) reduction from baseline to week 24, the primary efficacy endpoint of the study, was
significantly greater in patients randomized to alirocumab, as compared to patients randomized to
ezetimibe (47.2% vs. 15.6%, p<0.0001). In the trial, which employed a dose increase (up-titration) for
9
patients who did not achieve an LDL-C level of 70 mg/dL, the majority of patients remained on the initial
low dose of alirocumab of 75 mg.
The Phase III clinical program called Cdiffense to evaluate the safety, immunogenicity and efficacy of an
investigational vaccine for the prevention of primary symptomatic Clostridium difficile infection (CDI) was
initiated in August. Clostridium difficile (C. diff) is a potentially life-threatening, spore-forming bacterium
that causes intestinal disease. The Cdiffense Phase III clinical program has started recruiting volunteers
and will include up to 15,000 adults. Volunteers for the study should be age 50 or older and planning an
upcoming hospitalization or have had at least two hospital stays and have received systemic antibiotics in
the past year.
In August, Sanofi Pasteur announced topline results of a large-scale, multi-center efficacy trial in people
65 years of age and older showing a superior clinical benefit of Fluzone® High-Dose (Influenza Virus
Vaccine) relative to the standard dose of Fluzone vaccine in preventing influenza. In the study, Fluzone®
High-Dose vaccine was 24.2% more effective in preventing influenza in adults 65 years of age and older
than Fluzone® vaccine. This large, multi-year trial also reaffirmed the safety of Fluzone
® High-Dose
vaccine as demonstrated in previous studies.
Phase II:
A Phase IIa evaluating dupilumab in nasal polyposis was initiated in September.
The Phase II study evaluating SAR256212 (MM-121 - Partnership with Merrimack) in ovarian cancer did
not meet its primary endpoint (progression free survival) for the overall and unselected population of
women with platinum resistant ovarian cancer. Analysis on patient tumor samples of pre-specified
biomarkers mechanistically linked to ErbB3 for the identification of a subset of patients who benefit from
SAR256212 in combination with paclitaxel is ongoing. In the Phase II study evaluating SAR256212 in
combination with erlotinib in non-small cell lung cancer, two cohorts did not pass interim analyses and the
third one showed negative results in its final analysis, for the overall population. Biomarker analysis is
ongoing. SAR256212 is still being evaluated in two other Phase II studies for the treatment of breast
cancers
Following Phase II results in non-hodgkin lymphoma (NHL), Sanofi decided not to pursue development of
SAR245409 (XL765 - Partnership with Exelixis) in this indication. However, a Phase II study in ovarian
cancer in association with pimasertib (MEK inhibitor from Merck KgaA) is ongoing.
The development of fedratinib (Jak2 inhibitor) as a single agent in the treatment of Polycythemia Vera
(PV) has been halted. Sanofi is currently investigating other options for the role of fedratinib in PV.
A Phase II study evaluating Jevtana® in Small Cell Lung Cancer did not meet its primary endpoint.
Sanofi has decided not to pursue the development of FOV1101 (FDC prednisolone/cyclosporine) in
Allergic conjunctivitis.
Phase II studies for the following projects did not meet their primary endpoints and were subsequently
discontinued: SAR110894 (H3 receptor Antagonist - in Alzheimer’s disease), SAR113945 (IKK-B-inhibitor
– osteoarthritis), SAR97276 (in monotherapy in the treatment of malaria).
Phase I:
GZ402666 (recombinant human α-glucosidase, an enzyme replacement therapy) entered Phase I for the
treatment of Pompe disease.
A vaccine candidate against Herpes Simplex Virus Type 2 also entered Phase I development.
It has been decided to discontinue two early stage projects: SAR126119 (TAFia inhibitor) in acute
ischemic stroke and SAR127963 (P75 receptor antagonist) in trauma brain injury.
10
Third-quarter and first nine months 2013 financial results
Business Net Income(1)
Sanofi generated third-quarter net sales of €8,432 million, a decrease of 6.7% on a reported basis (+0.6% at
constant exchange rates). Year-to-date sales were €24,494 million, a decrease of 7.3% on a reported basis
(-2.8% at constant exchange rates).
Other revenues decreased 57.0% to €86 million in the third quarter, impacted by the end of royalties on Enbrel®
sales in the U.S. In the third quarter of 2012, this line included most of the one-time payment of $80 million paid
by Bristol-Myers Squibb in relation to the Avalide® supply disruption in the U.S. In the first nine months of 2013,
other revenues were €267 million which was down 69.4%.
Gross profit reached €5,645 million in the third quarter, a decrease of 11.3% (down 3.6% at constant exchange
rates). The ratio of cost of sales to net sales reached 34.1% compared to 31.8% in the third quarter of 2012. The
evolution of this ratio reflected mix effects from lower sales of high margin vaccines and companion animal
brands, unfavorable currency impact, loss of sales from key genericized products and lower sales of generics in
Brazil. Year-to-date gross profit reached €16,680 million, down 12.6% (or 7.9% at constant exchange rates). In
the first nine months of 2013, the ratio of cost of sales to net sales was 33.0%.
Third-quarter Research and Development expenses were €1,183 million, an increase of 3.4%. In the third
quarter 2013, R&D expenses included reclassification of expenses from a R&D Joint-Venture in vaccines while
Q3 2012 included a reimbursement from the SPMSD joint-venture related to Hexyon®. Excluding these items,
R&D expenses increased 2.3% at constant exchange rates reflecting investment in the late-stage portfolio. Year-
to-date R&D expenses were €3,524 million (down 0.8% or up 1.4% at constant exchange rates). In the first nine
months of 2013, the ratio of R&D to net sales was 14.4%, versus 13.4% in the same period of 2012.
Selling and general expenses decreased 7.4% to €2,016 million in the third-quarter. At constant exchange
rates, SG&A decreased 0.8% reflecting good cost control and commercial investment of Genzyme in multiple
sclerosis and sustained investment in the Diabetes business. General expenses increased 2.9% at constant
exchange rates. Year-to-date SG&A expenses were €6,454 million, a decrease of 1.9% (or an increase of 2.1%
at constant exchange rates). In the first nine months of 2013, the ratio of selling and general expenses to net
sales was 26.3%, versus 24.9% in the same period of 2012.
Other current operating income net of expenses was an income of €28 million in the third quarter versus an
income of €76 million in the third quarter of 2012 and reflected especially lower income from partners. In the first
nine months of 2013, other current operating income net of expenses was an income of €198 million.
The share of profits from associates was €38 million in the third quarter (versus €6 million in the third quarter of
2012) and included a reclassification of expenses from a R&D Joint-Venture in vaccines. Year-to-date share of
profits from associates were €59 million versus €425 million in the same period of 2012, impacted by the loss of
exclusivity of Plavix® in the U.S. in May 2012.
Non-controlling interests decreased 7.7% to -€36 million in the third quarter, notably reflecting lower profit
generated by Plavix® and Avapro
® mainly in Europe attributable to Bristol-Myers Squibb. In the first nine months
of 2013, non-controlling interests were -€122 million, down 14.7%.
Third-quarter business operating income reached €2,476 million, a decline of 19.8% (down 10.4% at constant
exchange rates). The ratio of business operating income to net sales was 29.4% compared to 34.1% in the third
quarter of 2012. Year-to-date business operating income was €6,837 million, a decrease of 26.7% (down 20.6%
at constant exchange rates). The ratio of business operating income to net sales was 27.9%, compared to 35.3%
in the same period of 2012.
Net financial expenses were €123 million, compared to €135 million in the third quarter of 2012. Year-to-date
net financial expenses were €400 million versus €460 million in the first nine months of 2012.
The effective tax rate was 24.0% in the third quarter compared to 25.1% in the third quarter of 2012. The year-
to-date effective tax rate was 24.0% versus 27.0% for the same period of 2012 mainly due to the constant
evolution of our geographical mix of earnings as well as recent and ongoing procedures with the tax authorities in
a number of countries which had or are expected to have a positive impact in 2013.
(1) See Appendix 6 for definitions of financial indicators, and Appendix 3 for reconciliation of business net income to consolidated net income attributable to equity
holders of Sanofi
11
Business net income(1)
was €1,789 million in the third-quarter, a decrease of 18.7% (down 8.9% at constant
exchange rates). In the first nine months of 2013, business net income decreased 25.6% (or 19.1% at constant
exchange rates) to €4,877 million. The ratio of business net income to net sales was 19.9%, compared to 24.8%
in the first nine months of 2012.
In the third quarter of 2013, Business earnings per share(1)
(EPS) was €1.35, down 19.2% and 9.0% on a
reported basis and at constant exchange rates, respectively. In the third quarter of 2013, currency fluctuations
impacted Business EPS by €0.17 or more than 10%. The average number of shares outstanding was 1,323.5
million this quarter versus 1,318.4 million in the third quarter of 2012. In the first nine months of 2013, Business
earnings per share(1)
was €3.68 down 26.0% and 19.3% on a reported basis and at constant exchange rates,
respectively. The average number of shares outstanding was 1,323.8 million in the first nine months of 2013
versus 1,319.0 million in the first nine months of 2012.
From business net income to consolidated net income (see Appendix 3)
In the first nine months of 2013, the main reconciling items between business net income and consolidated net
income attributable to equity holders of Sanofi were:
- A €2,232 million amortization charge on intangible assets related to fair value remeasurement of acquired
companies (primarily Aventis: €941 million, Genzyme: €696 million and Merial €292 million) and to
acquired intangible assets (licenses/products: €85 million). A €689 million amortization charge on
intangible assets related to fair value remeasurement of acquired companies (primarily Aventis: €261
million, Genzyme €228 million and Merial €97 million), and to acquired intangible assets
(licenses/products: €31 million) was booked in the third quarter. These items have no cash impact on the
Group.
- An impairment loss (net of reversals related to intangible assets) against intangible assets of €468 million
(of which €28 million in Q3 2013 mainly related to the termination of the collaboration with Rib-X and to
SAR245409 following the decision to end the development in NHL). This item has no cash impact on the
Group.
- A charge of €185 million mainly reflecting an increase in the fair value of contingent considerations related
to the CVRs (€60 million, of which €22 million in Q3 2013) and contingent considerations related to Bayer
(€94 million, of which €45 million in Q3 2013) and Targegen (€34 million).
- A charge of €7 million arising from the workdown of inventories of acquired companies remeasured at fair
value due to the application of purchase accounting to acquisitions. This item has no cash impact on the
Group.
- €230 million of restructuring costs (including €71 million in the third quarter mainly related to Europe and
Japan).
- A €1,038 million tax effect arising from the items listed above, comprising €723 million generated by
amortization charged against intangible assets, €189 million associated with impairment loss on intangible
assets and €81 million associated with restructuring costs. The third quarter tax effect was €289 million,
including €233 million of deferred taxes generated by amortization charged against intangible assets,
€9 million associated with impairment loss on intangible assets and €24 million linked to restructuring
costs (see Appendix 3).
- A €109 million tax (3%) on dividends paid to Sanofi shareholders.
- In “Share of profits/losses from associates”, a charge of €26 million, net of tax, mainly relating to the share
of amortization of intangible assets (of which €9 million in Q3 2013). This item has no cash impact on the
Group.
(1) See Appendix 6 for definitions of financial indicators, and Appendix 3 for reconciliation of business net income to consolidated net income attributable to
equity holders of Sanofi
12
Net Debt
In the first nine months of 2013, net cash generated by operating activities was €4,527 million after changes in
working capital (€1,015 million) and after an exceptional funding of €305 million related to U.S. pension plans.
This amount covered part of repurchasing of shares (€1,391 million) partially offset by proceeds from the
issuance of new shares (€796 million), dividend paid by Sanofi (€3,638 million), capital expenditures
(€865 million), acquisitions and partnerships net of disposals (€164 million) and restructuring costs (€489 million).
As a consequence, net debt increased from €7,719 million at December 31, 2012 to €8,788 million at September
30, 2013 (net of €4,696 million cash and cash equivalents). Net debt decreased from 10,172 million at June 30,
2013 to €8,788 million at September 30, 2013.
Forward-Looking Statements This press release contains forward-looking statements as defined in the Private Securities Litigation Reform Act of 1995, as amended.
Forward-looking statements are statements that are not historical facts. These statements include projections and estimates and their
underlying assumptions, statements regarding plans, objectives, intentions and expectations with respect to future financial results, events,
operations, services, product development and potential, and statements regarding future performance. Forward-looking statements are
generally identified by the words “expects”, “anticipates”, “believes”, “intends”, “estimates”, “plans” and similar expressions. Although Sanofi’s
management believes that the expectations reflected in such forward-looking statements are reasonable, investors are cautioned that forward-
looking information and statements are subject to various risks and uncertainties, many of which are difficult to predict and generally beyond
the control of Sanofi, that could cause actual results and developments to differ materially from those expressed in, or implied or projected by,
the forward-looking information and statements. These risks and uncertainties include among other things, the uncertainties inherent in
research and development, future clinical data and analysis, including post marketing, decisions by regulatory authorities, such as the FDA or
the EMA, regarding whether and when to approve any drug, device or biological application that may be filed for any such product candidates
as well as their decisions regarding labeling and other matters that could affect the availability or commercial potential of such product
candidates, the absence of guarantee that the product candidates if approved will be commercially successful, the future approval and
commercial success of therapeutic alternatives, the Group’s ability to benefit from external growth opportunities, trends in exchange rates and
prevailing interest rates, the impact of cost containment policies and subsequent changes thereto, the average number of shares outstanding,
as well as those discussed or identified in the public filings with the SEC and the AMF made by Sanofi, including those listed under “Risk
Factors” and “Cautionary Statement Regarding Forward-Looking Statements” in Sanofi’s annual report on Form 20-F for the year ended
December 31, 2012. Other than as required by applicable law, Sanofi does not undertake any obligation to update or revise any forward-
looking information or statements.
Appendices
List of appendices
Appendix 1: 2013 third-quarter and 2013 9-month consolidated net sales by geographic region and product
Appendix 2: 2013 third-quarter and 2013 9-month business net income statement
Appendix 3: Reconciliation of business net income to net income attributable to equity holders of Sanofi
Appendix 4: 2013 third-quarter and 2013 9-month consolidated income statement
Appendix 5: R&D pipeline
Appendix 6: Definitions
RELEASE
13
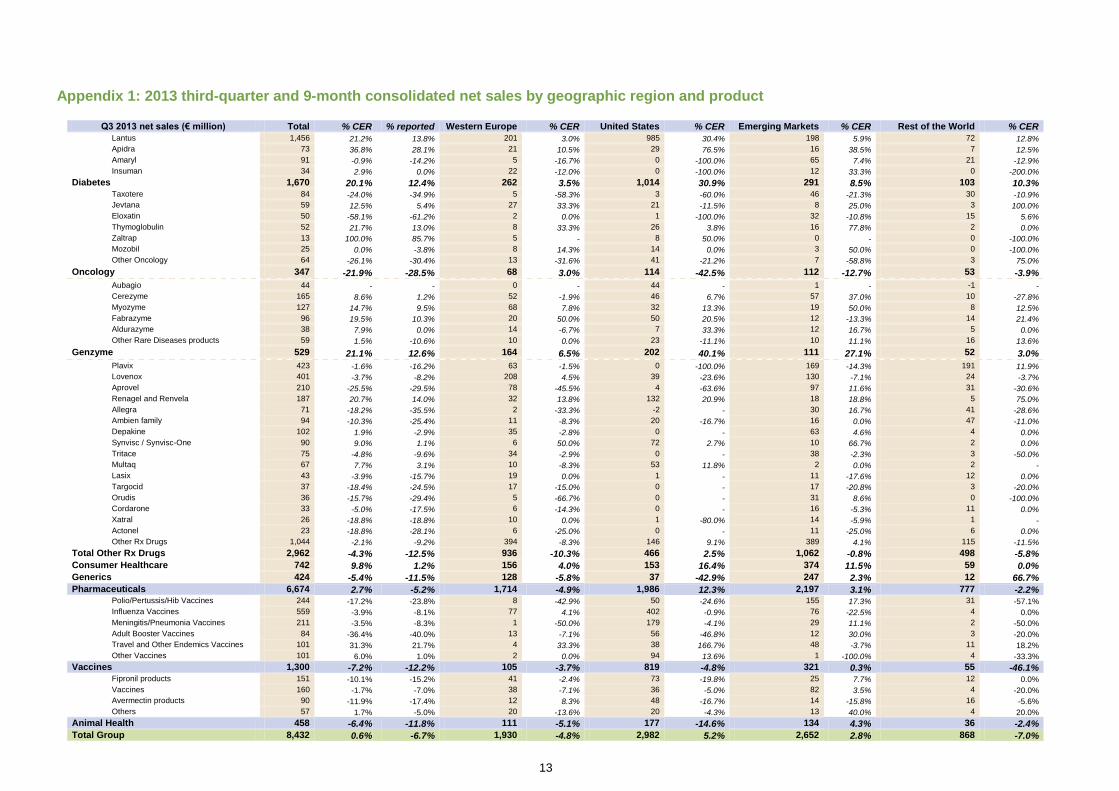
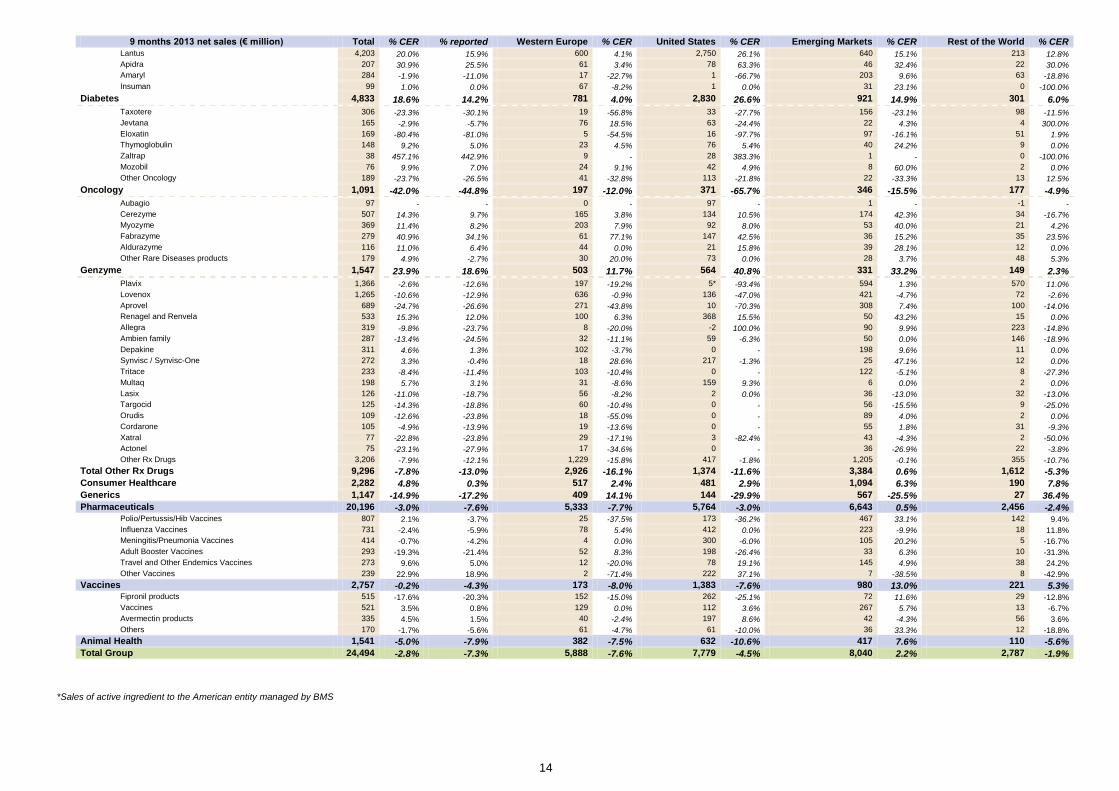
Appendix 1: 2013 third-quarter and 9-month consolidated net sales by geographic region and product
Q3 2013 net sales (€ million) Total % CER % reported Western Europe % CER United States % CER Emerging Markets % CER Rest of the World % CER
Lantus 1,456 21.2% 13.8% 201 3.0% 985 30.4% 198 5.9% 72 12.8%
Apidra 73 36.8% 28.1% 21 10.5% 29 76.5% 16 38.5% 7 12.5%
Amaryl 91 -0.9% -14.2% 5 -16.7% 0 -100.0% 65 7.4% 21 -12.9%
Insuman 34 2.9% 0.0% 22 -12.0% 0 -100.0% 12 33.3% 0 -200.0%
Diabetes 1,670 20.1% 12.4% 262 3.5% 1,014 30.9% 291 8.5% 103 10.3% Taxotere 84 -24.0% -34.9% 5 -58.3% 3 -60.0% 46 -21.3% 30 -10.9%
Jevtana 59 12.5% 5.4% 27 33.3% 21 -11.5% 8 25.0% 3 100.0%
Eloxatin 50 -58.1% -61.2% 2 0.0% 1 -100.0% 32 -10.8% 15 5.6%
Thymoglobulin 52 21.7% 13.0% 8 33.3% 26 3.8% 16 77.8% 2 0.0%
Zaltrap 13 100.0% 85.7% 5 - 8 50.0% 0 - 0 -100.0%
Mozobil 25 0.0% -3.8% 8 14.3% 14 0.0% 3 50.0% 0 -100.0%
Other Oncology 64 -26.1% -30.4% 13 -31.6% 41 -21.2% 7 -58.8% 3 75.0%
Oncology 347 -21.9% -28.5% 68 3.0% 114 -42.5% 112 -12.7% 53 -3.9%
Aubagio 44 - - 0 - 44 - 1 - -1 -
Cerezyme 165 8.6% 1.2% 52 -1.9% 46 6.7% 57 37.0% 10 -27.8%
Myozyme 127 14.7% 9.5% 68 7.8% 32 13.3% 19 50.0% 8 12.5%
Fabrazyme 96 19.5% 10.3% 20 50.0% 50 20.5% 12 -13.3% 14 21.4%
Aldurazyme 38 7.9% 0.0% 14 -6.7% 7 33.3% 12 16.7% 5 0.0%
Other Rare Diseases products 59 1.5% -10.6% 10 0.0% 23 -11.1% 10 11.1% 16 13.6%
Genzyme 529 21.1% 12.6% 164 6.5% 202 40.1% 111 27.1% 52 3.0%
Plavix 423 -1.6% -16.2% 63 -1.5% 0 -100.0% 169 -14.3% 191 11.9%
Lovenox 401 -3.7% -8.2% 208 4.5% 39 -23.6% 130 -7.1% 24 -3.7%
Aprovel 210 -25.5% -29.5% 78 -45.5% 4 -63.6% 97 11.6% 31 -30.6%
Renagel and Renvela 187 20.7% 14.0% 32 13.8% 132 20.9% 18 18.8% 5 75.0%
Allegra 71 -18.2% -35.5% 2 -33.3% -2 - 30 16.7% 41 -28.6%
Ambien family 94 -10.3% -25.4% 11 -8.3% 20 -16.7% 16 0.0% 47 -11.0%
Depakine 102 1.9% -2.9% 35 -2.8% 0 - 63 4.6% 4 0.0%
Synvisc / Synvisc-One 90 9.0% 1.1% 6 50.0% 72 2.7% 10 66.7% 2 0.0%
Tritace 75 -4.8% -9.6% 34 -2.9% 0 - 38 -2.3% 3 -50.0%
Multaq 67 7.7% 3.1% 10 -8.3% 53 11.8% 2 0.0% 2 -
Lasix 43 -3.9% -15.7% 19 0.0% 1 - 11 -17.6% 12 0.0%
Targocid 37 -18.4% -24.5% 17 -15.0% 0 - 17 -20.8% 3 -20.0%
Orudis 36 -15.7% -29.4% 5 -66.7% 0 - 31 8.6% 0 -100.0%
Cordarone 33 -5.0% -17.5% 6 -14.3% 0 - 16 -5.3% 11 0.0%
Xatral 26 -18.8% -18.8% 10 0.0% 1 -80.0% 14 -5.9% 1 -
Actonel 23 -18.8% -28.1% 6 -25.0% 0 - 11 -25.0% 6 0.0%
Other Rx Drugs 1,044 -2.1% -9.2% 394 -8.3% 146 9.1% 389 4.1% 115 -11.5%
Total Other Rx Drugs 2,962 -4.3% -12.5% 936 -10.3% 466 2.5% 1,062 -0.8% 498 -5.8%
Consumer Healthcare 742 9.8% 1.2% 156 4.0% 153 16.4% 374 11.5% 59 0.0%
Generics 424 -5.4% -11.5% 128 -5.8% 37 -42.9% 247 2.3% 12 66.7%
Pharmaceuticals 6,674 2.7% -5.2% 1,714 -4.9% 1,986 12.3% 2,197 3.1% 777 -2.2% Polio/Pertussis/Hib Vaccines 244 -17.2% -23.8% 8 -42.9% 50 -24.6% 155 17.3% 31 -57.1%
Influenza Vaccines 559 -3.9% -8.1% 77 4.1% 402 -0.9% 76 -22.5% 4 0.0%
Meningitis/Pneumonia Vaccines 211 -3.5% -8.3% 1 -50.0% 179 -4.1% 29 11.1% 2 -50.0%
Adult Booster Vaccines 84 -36.4% -40.0% 13 -7.1% 56 -46.8% 12 30.0% 3 -20.0%
Travel and Other Endemics Vaccines 101 31.3% 21.7% 4 33.3% 38 166.7% 48 -3.7% 11 18.2%
Other Vaccines 101 6.0% 1.0% 2 0.0% 94 13.6% 1 -100.0% 4 -33.3%
Vaccines 1,300 -7.2% -12.2% 105 -3.7% 819 -4.8% 321 0.3% 55 -46.1% Fipronil products 151 -10.1% -15.2% 41 -2.4% 73 -19.8% 25 7.7% 12 0.0%
Vaccines 160 -1.7% -7.0% 38 -7.1% 36 -5.0% 82 3.5% 4 -20.0%
Avermectin products 90 -11.9% -17.4% 12 8.3% 48 -16.7% 14 -15.8% 16 -5.6%
Others 57 1.7% -5.0% 20 -13.6% 20 -4.3% 13 40.0% 4 20.0%
Animal Health 458 -6.4% -11.8% 111 -5.1% 177 -14.6% 134 4.3% 36 -2.4%
Total Group 8,432 0.6% -6.7% 1,930 -4.8% 2,982 5.2% 2,652 2.8% 868 -7.0%
14
9 months 2013 net sales (€ million) Total % CER % reported Western Europe % CER United States % CER Emerging Markets % CER Rest of the World % CER
Lantus 4,203 20.0% 15.9% 600 4.1% 2,750 26.1% 640 15.1% 213 12.8%
Apidra 207 30.9% 25.5% 61 3.4% 78 63.3% 46 32.4% 22 30.0%
Amaryl 284 -1.9% -11.0% 17 -22.7% 1 -66.7% 203 9.6% 63 -18.8%
Insuman 99 1.0% 0.0% 67 -8.2% 1 0.0% 31 23.1% 0 -100.0%
Diabetes 4,833 18.6% 14.2% 781 4.0% 2,830 26.6% 921 14.9% 301 6.0%
Taxotere 306 -23.3% -30.1% 19 -56.8% 33 -27.7% 156 -23.1% 98 -11.5%
Jevtana 165 -2.9% -5.7% 76 18.5% 63 -24.4% 22 4.3% 4 300.0%
Eloxatin 169 -80.4% -81.0% 5 -54.5% 16 -97.7% 97 -16.1% 51 1.9%
Thymoglobulin 148 9.2% 5.0% 23 4.5% 76 5.4% 40 24.2% 9 0.0%
Zaltrap 38 457.1% 442.9% 9 - 28 383.3% 1 - 0 -100.0%
Mozobil 76 9.9% 7.0% 24 9.1% 42 4.9% 8 60.0% 2 0.0%
Other Oncology 189 -23.7% -26.5% 41 -32.8% 113 -21.8% 22 -33.3% 13 12.5%
Oncology 1,091 -42.0% -44.8% 197 -12.0% 371 -65.7% 346 -15.5% 177 -4.9%
Aubagio 97 - - 0 - 97 - 1 - -1 -
Cerezyme 507 14.3% 9.7% 165 3.8% 134 10.5% 174 42.3% 34 -16.7%
Myozyme 369 11.4% 8.2% 203 7.9% 92 8.0% 53 40.0% 21 4.2%
Fabrazyme 279 40.9% 34.1% 61 77.1% 147 42.5% 36 15.2% 35 23.5%
Aldurazyme 116 11.0% 6.4% 44 0.0% 21 15.8% 39 28.1% 12 0.0%
Other Rare Diseases products 179 4.9% -2.7% 30 20.0% 73 0.0% 28 3.7% 48 5.3%
Genzyme 1,547 23.9% 18.6% 503 11.7% 564 40.8% 331 33.2% 149 2.3%
Plavix 1,366 -2.6% -12.6% 197 -19.2% 5* -93.4% 594 1.3% 570 11.0%
Lovenox 1,265 -10.6% -12.9% 636 -0.9% 136 -47.0% 421 -4.7% 72 -2.6%
Aprovel 689 -24.7% -26.6% 271 -43.8% 10 -70.3% 308 7.4% 100 -14.0%
Renagel and Renvela 533 15.3% 12.0% 100 6.3% 368 15.5% 50 43.2% 15 0.0%
Allegra 319 -9.8% -23.7% 8 -20.0% -2 100.0% 90 9.9% 223 -14.8%
Ambien family 287 -13.4% -24.5% 32 -11.1% 59 -6.3% 50 0.0% 146 -18.9%
Depakine 311 4.6% 1.3% 102 -3.7% 0 - 198 9.6% 11 0.0%
Synvisc / Synvisc-One 272 3.3% -0.4% 18 28.6% 217 -1.3% 25 47.1% 12 0.0%
Tritace 233 -8.4% -11.4% 103 -10.4% 0 - 122 -5.1% 8 -27.3%
Multaq 198 5.7% 3.1% 31 -8.6% 159 9.3% 6 0.0% 2 0.0%
Lasix 126 -11.0% -18.7% 56 -8.2% 2 0.0% 36 -13.0% 32 -13.0%
Targocid 125 -14.3% -18.8% 60 -10.4% 0 - 56 -15.5% 9 -25.0%
Orudis 109 -12.6% -23.8% 18 -55.0% 0 - 89 4.0% 2 0.0%
Cordarone 105 -4.9% -13.9% 19 -13.6% 0 - 55 1.8% 31 -9.3%
Xatral 77 -22.8% -23.8% 29 -17.1% 3 -82.4% 43 -4.3% 2 -50.0%
Actonel 75 -23.1% -27.9% 17 -34.6% 0 - 36 -26.9% 22 -3.8%
Other Rx Drugs 3,206 -7.9% -12.1% 1,229 -15.8% 417 -1.8% 1,205 -0.1% 355 -10.7%
Total Other Rx Drugs 9,296 -7.8% -13.0% 2,926 -16.1% 1,374 -11.6% 3,384 0.6% 1,612 -5.3%
Consumer Healthcare 2,282 4.8% 0.3% 517 2.4% 481 2.9% 1,094 6.3% 190 7.8%
Generics 1,147 -14.9% -17.2% 409 14.1% 144 -29.9% 567 -25.5% 27 36.4%
Pharmaceuticals 20,196 -3.0% -7.6% 5,333 -7.7% 5,764 -3.0% 6,643 0.5% 2,456 -2.4% Polio/Pertussis/Hib Vaccines 807 2.1% -3.7% 25 -37.5% 173 -36.2% 467 33.1% 142 9.4%
Influenza Vaccines 731 -2.4% -5.9% 78 5.4% 412 0.0% 223 -9.9% 18 11.8%
Meningitis/Pneumonia Vaccines 414 -0.7% -4.2% 4 0.0% 300 -6.0% 105 20.2% 5 -16.7%
Adult Booster Vaccines 293 -19.3% -21.4% 52 8.3% 198 -26.4% 33 6.3% 10 -31.3%
Travel and Other Endemics Vaccines 273 9.6% 5.0% 12 -20.0% 78 19.1% 145 4.9% 38 24.2%
Other Vaccines 239 22.9% 18.9% 2 -71.4% 222 37.1% 7 -38.5% 8 -42.9%
Vaccines 2,757 -0.2% -4.3% 173 -8.0% 1,383 -7.6% 980 13.0% 221 5.3% Fipronil products 515 -17.6% -20.3% 152 -15.0% 262 -25.1% 72 11.6% 29 -12.8%
Vaccines 521 3.5% 0.8% 129 0.0% 112 3.6% 267 5.7% 13 -6.7%
Avermectin products 335 4.5% 1.5% 40 -2.4% 197 8.6% 42 -4.3% 56 3.6%
Others 170 -1.7% -5.6% 61 -4.7% 61 -10.0% 36 33.3% 12 -18.8%
Animal Health 1,541 -5.0% -7.9% 382 -7.5% 632 -10.6% 417 7.6% 110 -5.6%
Total Group 24,494 -2.8% -7.3% 5,888 -7.6% 7,779 -4.5% 8,040 2.2% 2,787 -1.9%
*Sales of active ingredient to the American entity managed by BMS
15
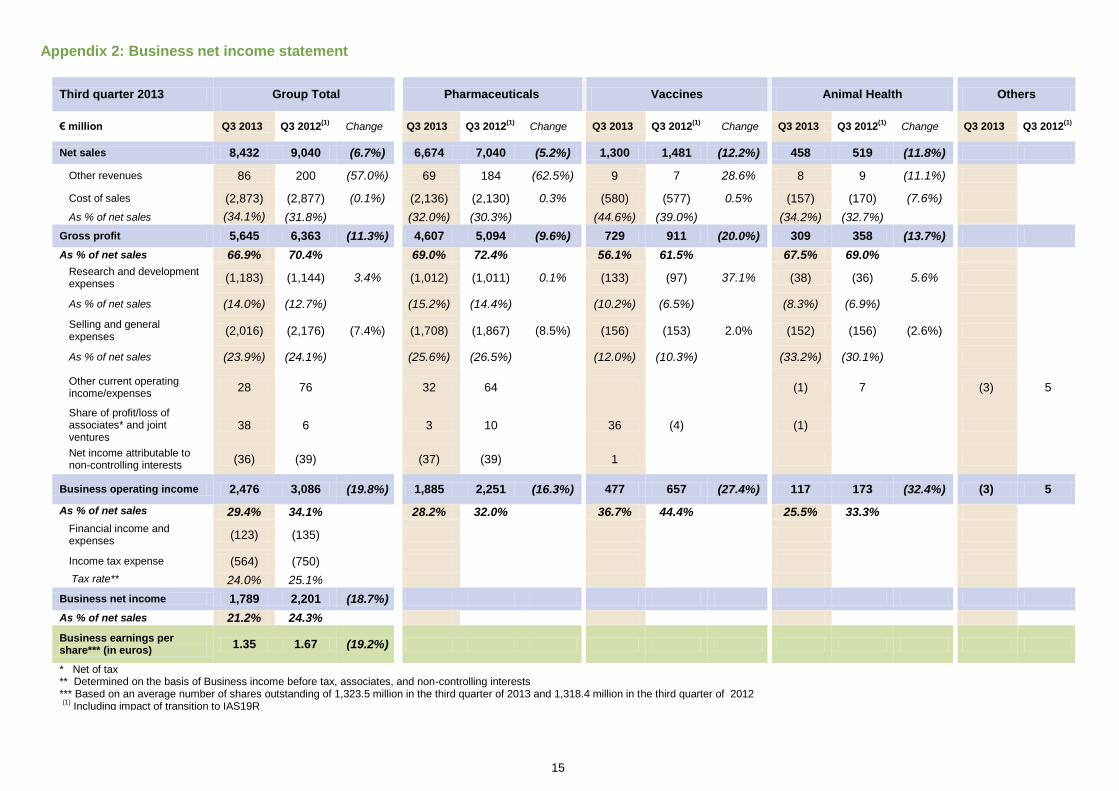
Appendix 2: Business net income statement
* Net of tax ** Determined on the basis of Business income before tax, associates, and non-controlling interests *** Based on an average number of shares outstanding of 1,323.5 million in the third quarter of 2013 and 1,318.4 million in the third quarter of 2012 (1)
Including impact of transition to IAS19R
Third quarter 2013 Group Total Pharmaceuticals Vaccines Animal Health Others
€ million Q3 2013 Q3 2012(1)
Change Q3 2013 Q3 2012(1)
Change Q3 2013 Q3 2012(1)
Change Q3 2013 Q3 2012(1)
Change Q3 2013 Q3 2012(1)
Net sales 8,432 9,040 (6.7%) 6,674 7,040 (5.2%) 1,300 1,481 (12.2%) 458 519 (11.8%)
Other revenues 86 200 (57.0%) 69 184 (62.5%) 9 7 28.6% 8 9 (11.1%)
Cost of sales (2,873) (2,877) (0.1%) (2,136) (2,130) 0.3% (580) (577) 0.5% (157) (170) (7.6%)
As % of net sales (34.1%)%)
(31.8%) (32.0%) (30.3%) (44.6%) (39.0%) (34.2%) (32.7%)
Gross profit 5,645 6,363 (11.3%) 4,607 5,094 (9.6%) 729 911 (20.0%) 309 358 (13.7%)
As % of net sales 66.9% 70.4% 69.0% 72.4% 56.1% 61.5% 67.5% 69.0%
Research and development expenses
(1,183) (1,144) 3.4% (1,012) (1,011) 0.1% (133) (97) 37.1% (38) (36) 5.6%
As % of net sales (14.0%) (12.7%) (15.2%) (14.4%) (10.2%) (6.5%) (8.3%) (6.9%)
Selling and general expenses
(2,016) (2,176) (7.4%) (1,708) (1,867) (8.5%) (156) (153) 2.0% (152) (156) (2.6%)
As % of net sales (23.9%) (24.1%) (25.6%) (26.5%) (12.0%) (10.3%) (33.2%) (30.1%)
Other current operating income/expenses
28 76 32 64 (1) 7 (3) 5
Share of profit/loss of associates* and joint ventures
38 6 3 10 36 (4) (1)
Net income attributable to non-controlling interests
(36) (39) (37) (39) 1
Business operating income 2,476 3,086 (19.8%) 1,885 2,251 (16.3%) 477 657 (27.4%) 117 173 (32.4%) (3) 5
As % of net sales 29.4% 34.1% 28.2% 32.0% 36.7% 44.4% 25.5% 33.3%
Financial income and expenses
(123) (135)
Income tax expense (564) (750)
Tax rate** 24.0% 25.1%
Business net income 1,789 2,201 (18.7%)
As % of net sales 21.2% 24.3%
Business earnings per share*** (in euros)
1.35 1.67 (19.2%)
16
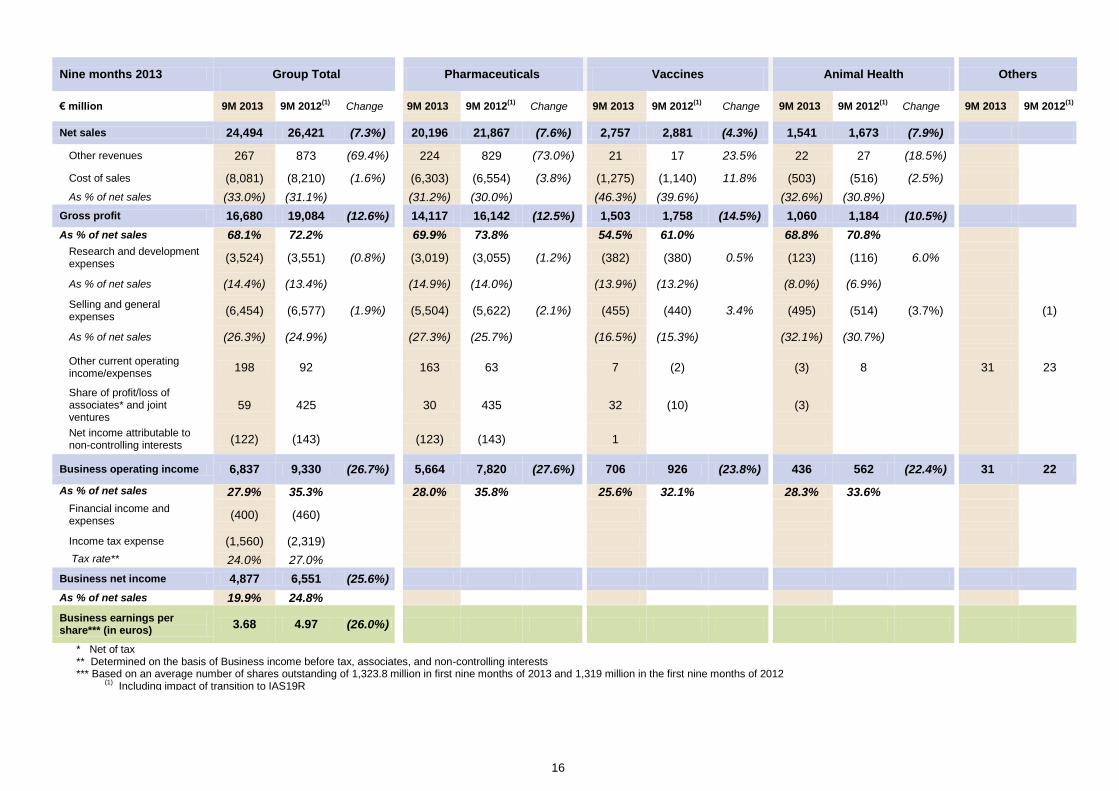
* Net of tax ** Determined on the basis of Business income before tax, associates, and non-controlling interests *** Based on an average number of shares outstanding of 1,323.8 million in first nine months of 2013 and 1,319 million in the first nine months of 2012
(1) Including impact of transition to IAS19R
Nine months 2013 Group Total Pharmaceuticals Vaccines Animal Health Others
€ million 9M 2013 9M 2012(1)
Change 9M 2013 9M 2012(1)
Change 9M 2013 9M 2012(1)
Change 9M 2013 9M 2012(1)
Change 9M 2013 9M 2012(1)
Net sales 24,494 26,421 (7.3%) 20,196 21,867 (7.6%) 2,757 2,881 (4.3%) 1,541 1,673 (7.9%)
Other revenues 267 873 (69.4%) 224 829 (73.0%) 21 17 23.5% 22 27 (18.5%)
Cost of sales (8,081) (8,210) (1.6%) (6,303) (6,554) (3.8%) (1,275) (1,140) 11.8% (503) (516) (2.5%)
As % of net sales (33.0%) (31.1%) (31.2%) (30.0%) (46.3%) (39.6%) (32.6%) (30.8%)
Gross profit 16,680 19,084 (12.6%) 14,117 16,142 (12.5%) 1,503 1,758 (14.5%) 1,060 1,184 (10.5%)
As % of net sales 68.1% 72.2% 69.9% 73.8% 54.5% 61.0% 68.8% 70.8%
Research and development expenses
(3,524) (3,551) (0.8%) (3,019) (3,055) (1.2%) (382) (380) 0.5% (123) (116) 6.0%
As % of net sales (14.4%) (13.4%) (14.9%) (14.0%) (13.9%) (13.2%) (8.0%) (6.9%)
Selling and general expenses
(6,454) (6,577) (1.9%) (5,504) (5,622) (2.1%) (455) (440) 3.4% (495) (514) (3.7%) (1)
As % of net sales (26.3%) (24.9%) (27.3%) (25.7%) (16.5%) (15.3%) (32.1%) (30.7%)
Other current operating income/expenses
198 92 163 63 7 (2) (3) 8 31 23
Share of profit/loss of associates* and joint ventures
59 425 30 435 32 (10) (3)
Net income attributable to non-controlling interests
(122) (143) (123) (143) 1
Business operating income 6,837 9,330 (26.7%) 5,664 7,820 (27.6%) 706 926 (23.8%) 436 562 (22.4%) 31 22
As % of net sales 27.9% 35.3% 28.0% 35.8% 25.6% 32.1% 28.3% 33.6%
Financial income and expenses
(400) (460)
Income tax expense (1,560) (2,319)
Tax rate** 24.0% 27.0%
Business net income 4,877 6,551 (25.6%)
As % of net sales 19.9% 24.8%
Business earnings per share*** (in euros)
3.68 4.97 (26.0%)
17
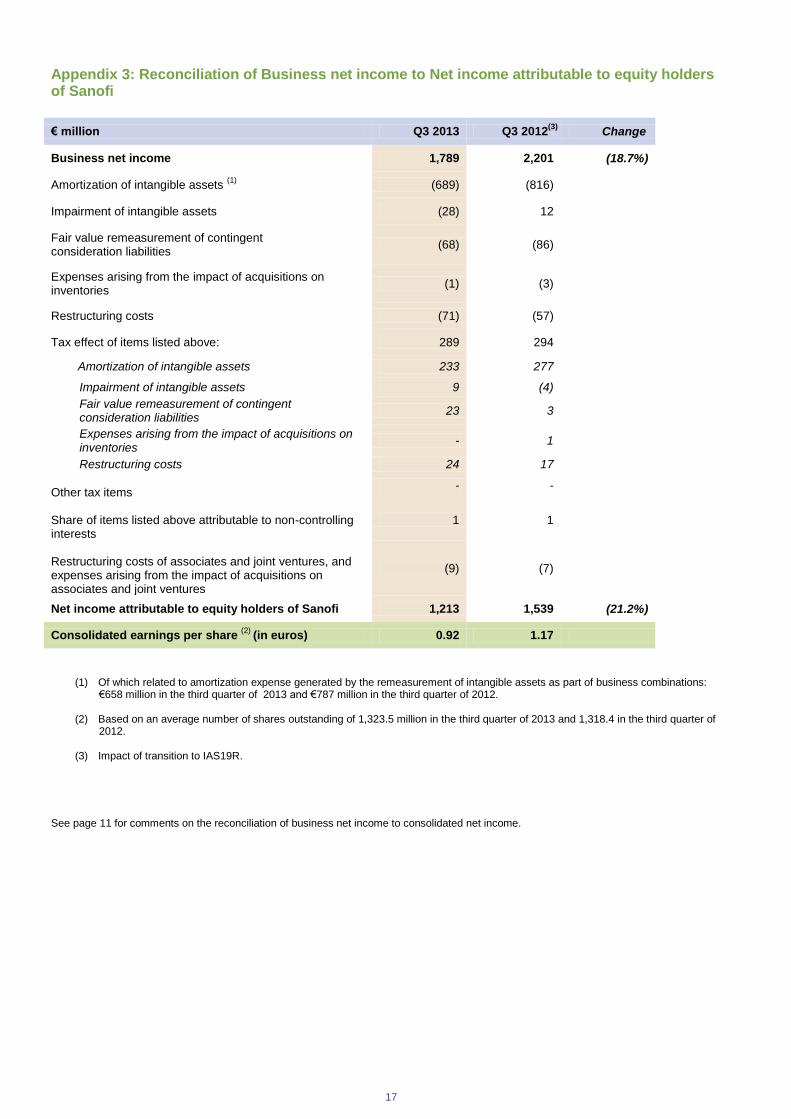
Appendix 3: Reconciliation of Business net income to Net income attributable to equity holders of Sanofi
€ million Q3 2013 Q3 2012(3)
Change
Business net income 1,789 2,201 (18.7%)
Amortization of intangible assets (1)
(689) (816)
Impairment of intangible assets (28) 12
Fair value remeasurement of contingent consideration liabilities
(68) (86)
Expenses arising from the impact of acquisitions on inventories
(1) (3)
Restructuring costs (71) (57)
Tax effect of items listed above: 289 294
Amortization of intangible assets 233 277
Impairment of intangible assets 9 (4)
Fair value remeasurement of contingent consideration liabilities
23 3
Expenses arising from the impact of acquisitions on inventories
- 1
Restructuring costs 24 17
Other tax items
- -
Share of items listed above attributable to non-controlling interests
1 1
Restructuring costs of associates and joint ventures, and expenses arising from the impact of acquisitions on associates and joint ventures
(9) (7)
Net income attributable to equity holders of Sanofi 1,213 1,539 (21.2%)
Consolidated earnings per share (2)
(in euros) 0.92 1.17
(1) Of which related to amortization expense generated by the remeasurement of intangible assets as part of business combinations:
€658 million in the third quarter of 2013 and €787 million in the third quarter of 2012.
(2) Based on an average number of shares outstanding of 1,323.5 million in the third quarter of 2013 and 1,318.4 in the third quarter of 2012.
(3) Impact of transition to IAS19R.
See page 11 for comments on the reconciliation of business net income to consolidated net income.
18
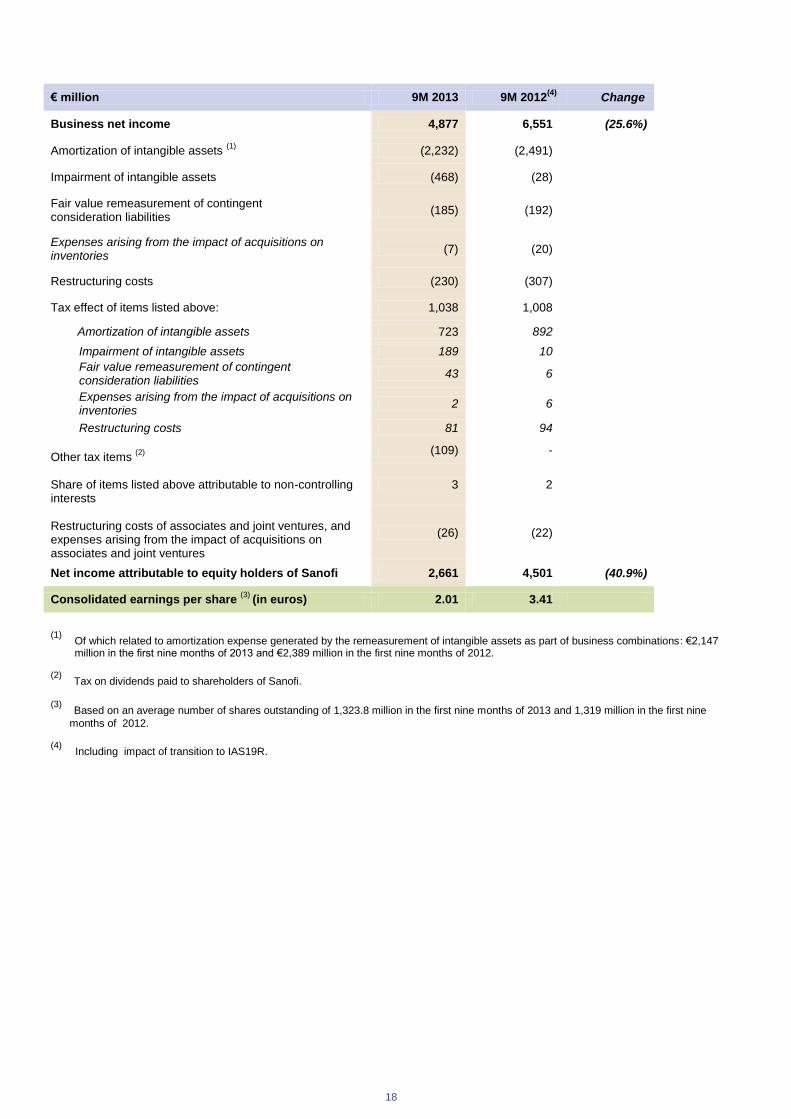
€ million 9M 2013 9M 2012(4)
Change
Business net income 4,877 6,551 (25.6%)
Amortization of intangible assets (1)
(2,232) (2,491)
Impairment of intangible assets (468) (28)
Fair value remeasurement of contingent consideration liabilities
(185) (192)
Expenses arising from the impact of acquisitions on inventories
(7) (20)
Restructuring costs (230) (307)
Tax effect of items listed above: 1,038 1,008
Amortization of intangible assets 723 892
Impairment of intangible assets 189 10
Fair value remeasurement of contingent consideration liabilities
43 6
Expenses arising from the impact of acquisitions on inventories
2 6
Restructuring costs 81 94
Other tax items
(2)
(109) -
Share of items listed above attributable to non-controlling interests
3 2
Restructuring costs of associates and joint ventures, and expenses arising from the impact of acquisitions on associates and joint ventures
(26) (22)
Net income attributable to equity holders of Sanofi 2,661 4,501 (40.9%)
Consolidated earnings per share (3)
(in euros) 2.01 3.41
(1) Of which related to amortization expense generated by the remeasurement of intangible assets as part of business combinations: €2,147
million in the first nine months of 2013 and €2,389 million in the first nine months of 2012. (2)
Tax on dividends paid to shareholders of Sanofi.
(3)
Based on an average number of shares outstanding of 1,323.8 million in the first nine months of 2013 and 1,319 million in the first nine
months of 2012. (4) Including impact of transition to IAS19R.
19
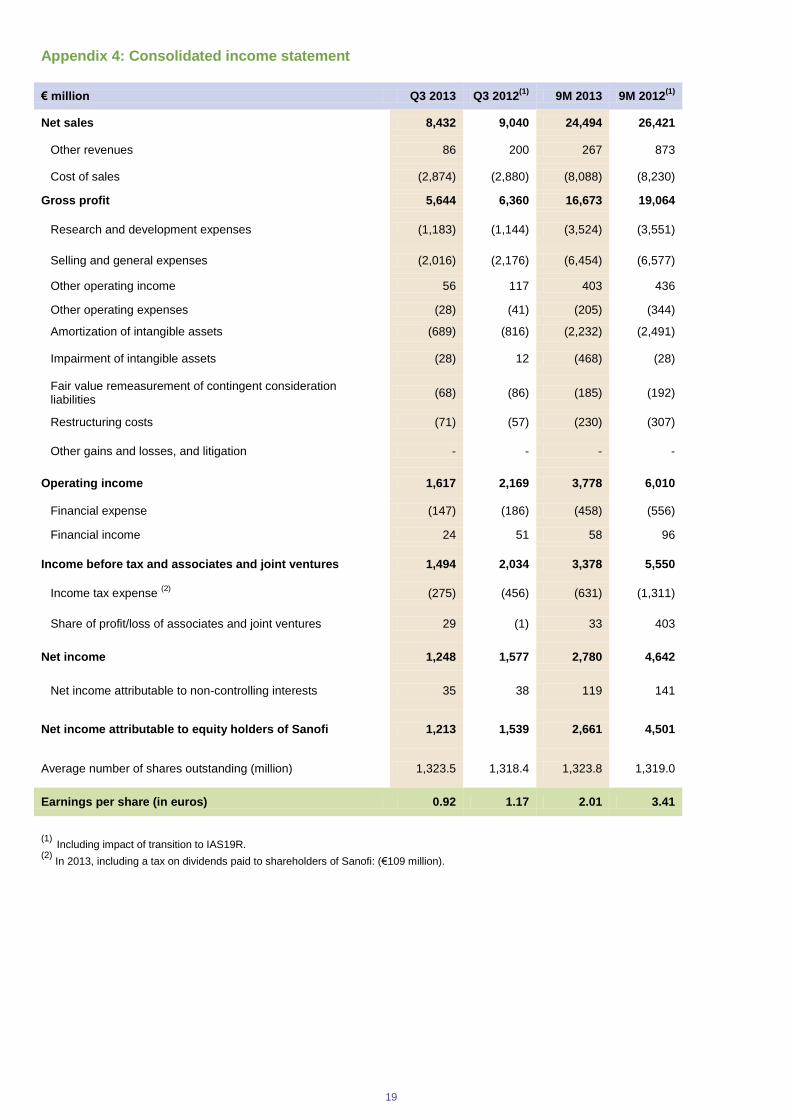
Appendix 4: Consolidated income statement
€ million Q3 2013 Q3 2012(1)
9M 2013 9M 2012(1)
Net sales 8,432 9,040 24,494 26,421
Other revenues 86 200 267 873
Cost of sales (2,874) (2,880) (8,088) (8,230)
Gross profit 5,644 6,360 16,673 19,064
Research and development expenses (1,183) (1,144) (3,524) (3,551)
Selling and general expenses (2,016) (2,176) (6,454) (6,577)
Other operating income 56 117 403 436
Other operating expenses (28) (41) (205) (344)
Amortization of intangible assets (689) (816) (2,232) (2,491)
Impairment of intangible assets (28) 12 (468) (28)
Fair value remeasurement of contingent consideration liabilities
(68) (86) (185) (192)
Restructuring costs (71) (57) (230) (307)
Other gains and losses, and litigation - - - -
Operating income 1,617 2,169 3,778 6,010
Financial expense (147) (186) (458) (556)
Financial income 24 51 58 96
Income before tax and associates and joint ventures 1,494 2,034 3,378 5,550
Income tax expense (2)
(275) (456) (631) (1,311)
Share of profit/loss of associates and joint ventures 29 (1) 33 403
Net income 1,248 1,577 2,780 4,642
Net income attributable to non-controlling interests 35 38 119 141
Net income attributable to equity holders of Sanofi 1,213 1,539 2,661 4,501
Average number of shares outstanding (million) 1,323.5 1,318.4 1,323.8 1,319.0
Earnings per share (in euros) 0.92 1.17 2.01 3.41
(1) Including impact of transition to IAS19R. (2)
In 2013, including a tax on dividends paid to shareholders of Sanofi: (€109 million).
20
Appendix 5: R&D Pipeline
Registration
Lemtrada™ (alemtuzumab)
Anti-CD52 mAb Multiple sclerosis, U.S.
N
eliglustat tartrate
Glucosylceramide synthetase inhibitor Gaucher disease, EU
VaxiGrip® QIV IM
Quadrivalent inactivated influenza vaccine
Phase III
N
U300 Insulin glargine
Type 1+2 diabetes
eliglustat tartrate
Glucosylceramide synthetase inhibitor Gaucher disease, U.S.
Dengue
Mild-to-severe dengue fever vaccine
N
Lyxumia® (lixisenatide)
GLP-1 agonist Type 2 diabetes, U.S.
N
fedratinib JAK2 inhibitor
Myelofibrosis (1L)
Clostridium difficile Toxoid vaccine
N
alirocumab Anti-PCSK-9 mAb
Hypercholesterolemia
Jevtana® (cabazitaxel)
Metastatic prostate cancer (1L) DTP-HepB-Polio-Hib (PR5I) Pediatric hexavalent vaccine
Kynamro™ (mipomersen)
Apolipoprotein B-100 antisense Severe HeFH, U.S.
SYNVISC-ONE
®
Medical device Pain in hip OA
Fluzone
® QIV ID
Quadrivalent inactivated influenza vaccine intradermal
N
sarilumab Anti-IL-6R mAb
Rheumatoid arthritis
MACI
®
Cell-based treatment Femoral chondyle cartilage defects, U.S.
Quadracel
®
Diphtheria, tetanus, pertussis & polio vaccine; 4-6 y of age
Phase II
LixiLan lixisenatide+ insulin glargine
Fixed-Ratio / Type 2 diabetes
N
SAR3419 Maytansin-loaded anti-CD19 mAb
B-cell malignancies refractory/relapsed (NHL, ALL)
N
fresolimumab TGFβ antagonist
Focal segmental glomerulosclerosis
N
dupilumab Anti-IL4Rα mAb
Asthma; Atopic dermatitis; Nasal polyposis
N
SAR256212 (MM121) anti-ErbB3 mAb
Breast cancer (2L, 3L)
N
SAR279356 (F598) Anti-PNAG mAb
Serious infections
N
SAR339658
Anti-VLA 2 mAb Inflammatory bowel disease
N
Combination SAR245409 (XL765) / MSC1936369B
Oral dual inhibitor of PI3K & mTOR / pimasertib Ovarian cancer
N
ferroquine Antimalarial
Malaria
N
SAR156597 IL4/IL13 Bi-specific mAb
Idiopathic pulmonary fibrosis
fedratinib
JAK-2 inhibitor Ruxolitinib resistant/intolerant MF
Meninge ACYW conj.
2nd
generation meningococcal conjugate infant vaccine
N
SAR100842 LPA-1 receptor antagonist
Systemic sclerosis
sarilumab
Anti-IL-6R mAb Uveitis
Rabies VRVg Purified vero rabies vaccine
N
GENZ438027 (ALN-TTR02) mRNA inhibitor
Familial amyloid polyneuropathy
N
SAR292833 (GRC15300) TRPV3 antagonist
Chronic disabling pain
Rotavirus
Live attenuated tetravalent Rotavirus oral vaccine
21
Phase I
N
SAR153192 Anti-DLL4 mAb
Solid tumors
N
GZ404477 (AAV-hAADC) Gene therapy
Parkinson's disease
N
GZ402665
(rhASM) Niemann-Pick type B
N
SAR405838 (MI-773) HDM2 / p53 antagonist
Solid tumors
N
SAR391786 GDF8 mAb Sarcopenia
N
GZ402671 Oral GCS Inhibitor
Fabry Disease
N
SAR650984 Anti-CD38 naked mAb
Hematological malignancies
N
SAR228810 Anti-protofibrillar AB mAb
Alzheimer’s disease
N
GZ402666 neo GAA
Pompe Disease
N
SAR566658 Maytansin-loaded anti-CA6 mAb
Solid tumors
N
SAR252067 Anti-LIGHT mAb Crohn’s disease
N
SAR438151 undisclosed target
N
SAR125844 C-MET kinase inhibitor
Solid tumors
N
SAR113244 Anti-CXCRS mAb
Systemic lupus erythematosus
Streptococcus pneumonia Meningitis & pneumonia vaccine
Combination SAR245409 / MSC1936369B
Solid tumors
N
RetinoStat®
Gene therapy Wet age-related macular degeneration (AMD)
Pseudomonas aeruginosa Antibody fragment product
Prevention of ventilator-associated pneumonia
N
SAR260301 PI3K β selective inhibitor PTEN – Deficient tumors
N
StarGen®
Gene therapy Stargardt disease
Tuberculosis Recombinant subunit vaccine
N
SAR245408 (XL147) Oral PI3K inhibitor
Solid tumors
N
GZ402663 (sFLT-01) Gene therapy
Age-related macular degeneration (AMD)
Herpes Simplex Virus Type 2
HSV-2 vaccine
Insulin Biosimilar Program Diabetes
N
UshStat®
Gene therapy Usher syndrome 1B
N: New Molecular Entity Immune Mediated Diseases
Rare Diseases
Oncology Diabetes Solutions
Vaccines Infectious Diseases Cardiovascular / Renal Diseases
Age Related Degenerative Diseases
Ophthalmology
Biosurgery
22
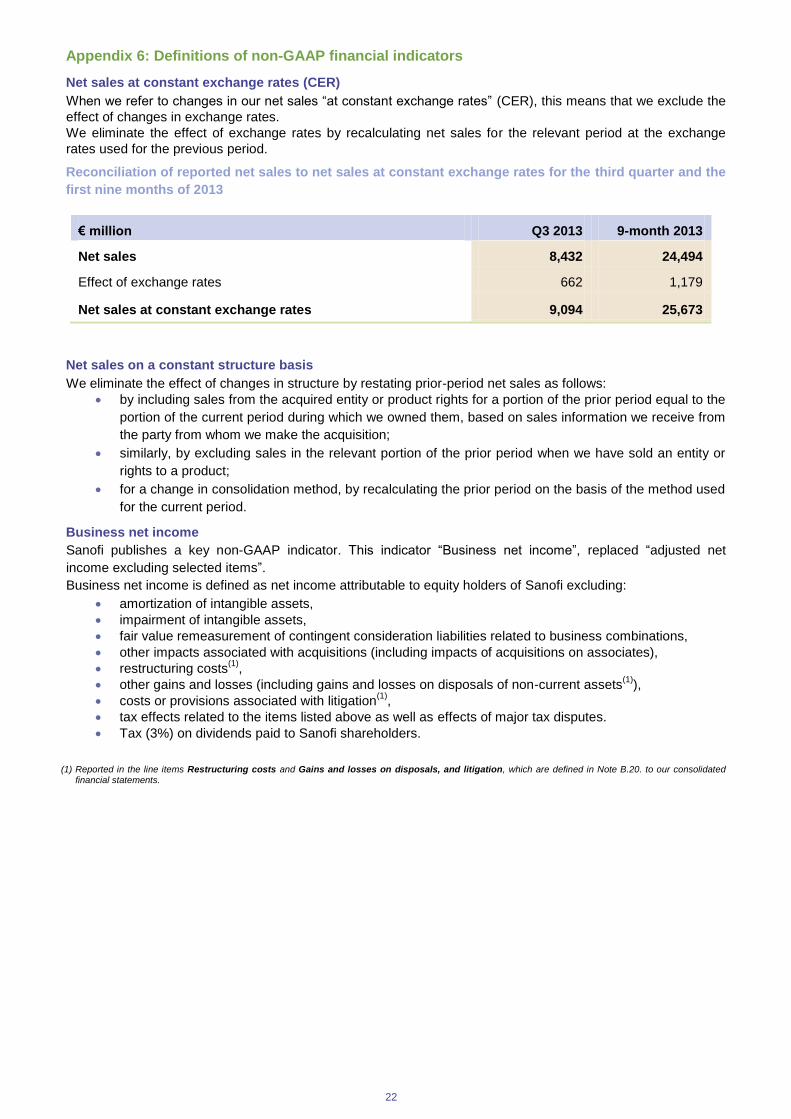
Appendix 6: Definitions of non-GAAP financial indicators
Net sales at constant exchange rates (CER)
When we refer to changes in our net sales “at constant exchange rates” (CER), this means that we exclude the
effect of changes in exchange rates.
We eliminate the effect of exchange rates by recalculating net sales for the relevant period at the exchange
rates used for the previous period.
Reconciliation of reported net sales to net sales at constant exchange rates for the third quarter and the
first nine months of 2013
€ million Q3 2013 9-month 2013
Net sales 8,432 24,494
Effect of exchange rates 662 1,179
Net sales at constant exchange rates 9,094 25,673
Net sales on a constant structure basis
We eliminate the effect of changes in structure by restating prior-period net sales as follows:
by including sales from the acquired entity or product rights for a portion of the prior period equal to the
portion of the current period during which we owned them, based on sales information we receive from
the party from whom we make the acquisition;
similarly, by excluding sales in the relevant portion of the prior period when we have sold an entity or
rights to a product;
for a change in consolidation method, by recalculating the prior period on the basis of the method used
for the current period.
Business net income
Sanofi publishes a key non-GAAP indicator. This indicator “Business net income”, replaced “adjusted net
income excluding selected items”.
Business net income is defined as net income attributable to equity holders of Sanofi excluding:
amortization of intangible assets,
impairment of intangible assets,
fair value remeasurement of contingent consideration liabilities related to business combinations,
other impacts associated with acquisitions (including impacts of acquisitions on associates),
restructuring costs(1)
,
other gains and losses (including gains and losses on disposals of non-current assets(1)
),
costs or provisions associated with litigation(1)
,
tax effects related to the items listed above as well as effects of major tax disputes.
Tax (3%) on dividends paid to Sanofi shareholders.
(1) Reported in the line items Restructuring costs and Gains and losses on disposals, and litigation, which are defined in Note B.20. to our consolidated financial statements.