Embed Size (px)
Citation preview

Henry C. Newell President and Chief Executive Officer Sherri L. Lemmer Senior Vice President and Chief Financial Officer Perry D. Grueber Director Investor Relations
Q3 2013 Conference Call October 29, 2013

Forward Looking Statements
The matters discussed in this news release concerning the company’s future performance or
anticipated financial results are forward-looking statements and are made pursuant to the safe
harbor provisions of the Private Securities Litigation Reform Act of 1995. Such statements involve
risks and uncertainties which may cause results to differ materially from those set forth in these
statements. Among other things, these risks and uncertainties include the strength of the
economy and demand for paper products, increases in raw material and energy prices,
manufacturing problems at company facilities, and other risks and assumptions described under
“Information Concerning Forward-Looking Statements” in Item 7 and in Item 1A of the company’s
Form 10-K for the year ended December 31, 2012. The company assumes no obligation to update
or supplement forward-looking statements that become untrue because of subsequent events.
Non-GAAP Financial Measures This presentation refers to certain non-U.S. GAAP financial measures. A reconciliation of those
numbers to U.S. GAAP financial measures is provided on the Company's website at:
www.wausaupaper.com/investors.
2 Q3 2013 Earnings Call

Q3 2013 Earnings Call 3
Our First Quarter as a
Tissue Company
Hank Newell President and CEO

Wausau Paper Transformation over the Last Twenty-Four Months
Q3 2013 Earnings Call 4
Strategic Repositioning
• Divested Premium Print & Color Brands
• Divested Timberlands
• Shut Brokaw and Brainerd Operations
• Divested Specialty Paper Business
Tissue Expansion
• Repositioned EcoSoft™ Brand
• Executed Largest Capital Expansion in Company History
• Launched DublNature® Brand (ATMOS)
• Grew Tissue Volume 2-3x Market
Organization
• New CEO, CFO, Tissue SVP & GM
• New Chairman, Five New Board Members
• Reduction & Realignment of Salaried Staffing
• New Enterprise Information Technology Platform

Third Quarter Highlights
• First quarter as Tissue only company
• Case volume up 7.4%, Revenue up 5.6%
• EBITDA margins* continue to expand Q1 7.6% Q2 10.1% Q3 11.5%
• Demonstrated solid progress ramping up and optimizing operations
• Announced policy to return approximately 50% of free cash to shareholders
Q3 2013 Earnings Call 5
* Represents Adjusted EBITDA margins. See Appendix for reconciliation of Adjusted EBITDA margins

Our Near-Term Focus
• Deliver Volume Growth at Target Margins
• Ramp up and Optimize Operations Platform
• Demonstrate Free Cash Flow Growth
• Increase Return of Cash to Shareholders
Q3 2013 Earnings Call 6

Deliver Volume Growth at Target Margins
• +6% volume CAGR is expectation over next 4-5 years
• Strong market acceptance of DublNature® premium products
• ≈46% of our volume “new” as result of EcoSoft™ repositioning and DublNature® premium product launch
• Further product introductions and new proprietary dispenser technology are in near-term pipeline
Q3 2013 Earnings Call 7

Building a Powerful Operational Platform
Major investments completed, now ramping up paper machine and optimizing operations platform:
• New Towel & Tissue machine in Harrodsburg
• Nine converting line retrofits for large scale parent rolls
• Eight premium converting line upgrades
• One new proprietary converting line in startup
• Major shift in distribution scale
Q3 2013 Earnings Call 8
Source of Significant Improvement

Ramping Up the New “ATMOS” Machine
0
10,000
20,000
Q4 12 Q1 13 Q2 13 Q3 13 Q413F
Q4 14Target
Conventional Premium (ATMOS)
Q3 2013 Earnings Call 9
• Flexible asset produces towel & tissue in conventional or ATMOS modes
• Conventional mode achieving cost structure and displacing higher cost purchased parent rolls
• ATMOS mode producing DublNature® premium products and progressing on ramp up curve
• Excellent quality and market acceptance of DublNature® premium products
• ATMOS product qualification • Inventory build
Tons

Realignment & Reduction of Staffing
Q3 2013 Earnings Call 10
569
347
271-195 -27
-76
0
200
400
600
January 2013 PaperDivestiture
BrainerdClosure
Post Paper Realignment/ Reduction
Goal
• 55% corporate, 22% overall salaried staffing reduction (Post Paper); approaching 20% by year end
• Operating functions consolidated in Kentucky; support functions in Wisconsin
• As company delivers growth targeting SG&A as 10-11% of sales; well-below relevant competitors
# A
uth
ori
zed
Sal
arie
d P
osi
tio
ns
22% Reduction

Capital Allocation
• Support organic growth needs to deliver EBITDA and ROCE commitments
• Targeting a leverage ratio of ≈2.5x total Debt / LTM EBITDA
• No major capital expansion in current plan; opportunistic acquisitions focused on capability or geography with strict return criteria
• Return of cash to shareholders through a growing dividend and/or share repurchase is a priority
Q3 2013 Earnings Call 11
4.9x4.3x 3.8x-4.0x
2.1x-2.3x
Q2 13 Q3 13 Q4 13F Q4 14F
Target ≈ 2.5
Total Debt / LTM EBITDA*
≈$10≈$15
≈$25
Maintenance Capital Growth Capital Dispenser Subsidy
2014F Uses of Cash$MM
Guidance * Continuing Operations

FINANCIAL REVIEW
Sherri Lemmer
12 Q3 2013 Earnings Call
2013 Q3 RESULTS
13 Q3 2013 Earnings Call

Financial Overview Sales Volume
Q3 2013 Earnings Call 14
Market growth is estimate based on industry sources and management estimates
Case Growth
2013 • Q4 Target +6% • Full Year +4-5%
2012 • Q4 +4.0% • Full Year +3.3%
Market Growth ≈1.5%
3.77
4.11 4.06 4.09
3.77
4.214.36
Q1 Q2 Q3 Q4 Q1 Q2 Q3
Case Shipments (MM) With % of Strategic Mix
2012 2013
49.2% 48.3% 48.5%
50.1% 47.6% 47.4%
48.4%
+7.4%

$81.9 $88.6 $86.8
$78.2 $87.6
$91.7
$0
$50
$100
$150
Q1 Q2 Q3
2012 2013
Financial Overview Net Sales
Q3 2013 Earnings Call 15
See Appendix for reclassification of Net Sales for Continuing Operations
Net Sales Continuing Operations
• Record Quarterly Sales
• Q3 +5.6% to prior year
• Nine-month Net Sales
• 2013 $257.5MM
• 2012 $257.2MM
($MM)

Financial Overview Adjusted EBITDA
Q3 2013 Earnings Call 16
• 2013 Quarter-over-Quarter Improvement
• +3.6% Sales Volume
• Improved Strategic Mix
• Increased Operating Efficiencies
• Increased Cost in Quarter Related to Realignment and Reduction Efforts
Adjusted EBITDA and EBITDA margin are non-GAAP measures. See Appendix for reconciliation of EBITDA to Adjusted EBITDA
$5.9
$8.8
$10.6 $1.3
$2.9
($2.4)
Q1 Q2 Q3 Deliver Growth
Optimize Operations
Repositioning & Other
($MM)
7.6%
10.1% 11.5%
2013 Adjusted EBITDA and EBITDA Margin Continuing Operations
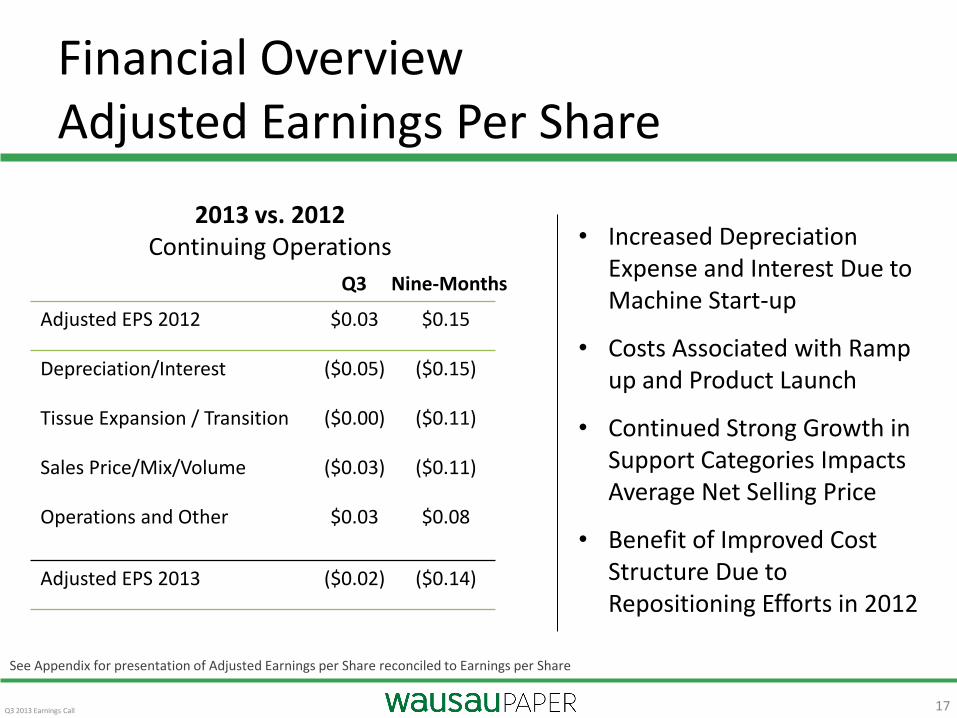
Financial Overview Adjusted Earnings Per Share
Q3 2013 Earnings Call 17
See Appendix for presentation of Adjusted Earnings per Share reconciled to Earnings per Share
2013 vs. 2012 Continuing Operations
Adjusted EPS 2012 $0.03 $0.15
Depreciation/Interest ($0.05) ($0.15)
Tissue Expansion / Transition ($0.00) ($0.11)
Sales Price/Mix/Volume ($0.03) ($0.11)
Operations and Other $0.03 $0.08
Adjusted EPS 2013 ($0.02) ($0.14)
Q3 Nine-Months
• Increased Depreciation Expense and Interest Due to Machine Start-up
• Costs Associated with Ramp up and Product Launch
• Continued Strong Growth in Support Categories Impacts Average Net Selling Price
• Benefit of Improved Cost Structure Due to Repositioning Efforts in 2012

Debt
• Credit Capacity
• $200MM under Unsecured Private Shelf Agreement (First Maturity June 2016)
• $100MM under Unsecured Bank Credit Facility (Expires June 2014)
• Cost Effective Structure
• Current Cost of Debt ≈ 5.1%
18 Q2 2013 Earnings Call
12/31/12 Net Debt* 9/30/13
9/30/13
(1) EBITDA is a non-GAAP measure and represents continuing operations only. See Appendix for reconciliation and presentation of LTM EBITDA (2) This calculation of Total Debt / Capital is not intended to be used for purposes of calculating debt covenant compliance *Net of $25.4MM in cash & cash equivalents
$196
$150$125
Quarterly Debt ($MM)
As of 9/30/13 Total Debt / LTM EBITDA(1) 4.3x Total Debt / Capital(2) 51.7%

Outlook
Q4 2013F Q4 2014F FY 2014F
Case Growth +6% +6% +6%
EBITDA $13-$15MM $20-$24MM $65-$70MM
EBITDA % 14-16% 20-24% 17-19%
Net EPS $0.01-$0.03 $0.10-$0.13 $0.21-$0.28
Q3 2013 Earnings Call 19

Q4 2014F EBITDA* Bridge
Q3 2013 Earnings Call 20
$5.9$8.8
$10.6
$13-$15
$20-$24$2
$2
$6
($2)
Q1 Q2 Q4F Q3 Q4F
PM3 Startup
Initial Launch
Launch & Optimize
2013 2014
Deliver Growth • Volume (Cases) • Strategic Mix
Optimize Operations
Input Costs
($MM)
* EBITDA is a non-GAAP measure and represents continuing operations only. See Appendix for reconciliation of EBITDA to Adjusted EBITDA

2014 First Half Impacts
• Demand Seasonality (Q1)
• Maintenance Outage (Q2)
• Artisan™ Product Trials / Launch
Q3 2013 Earnings Call 21
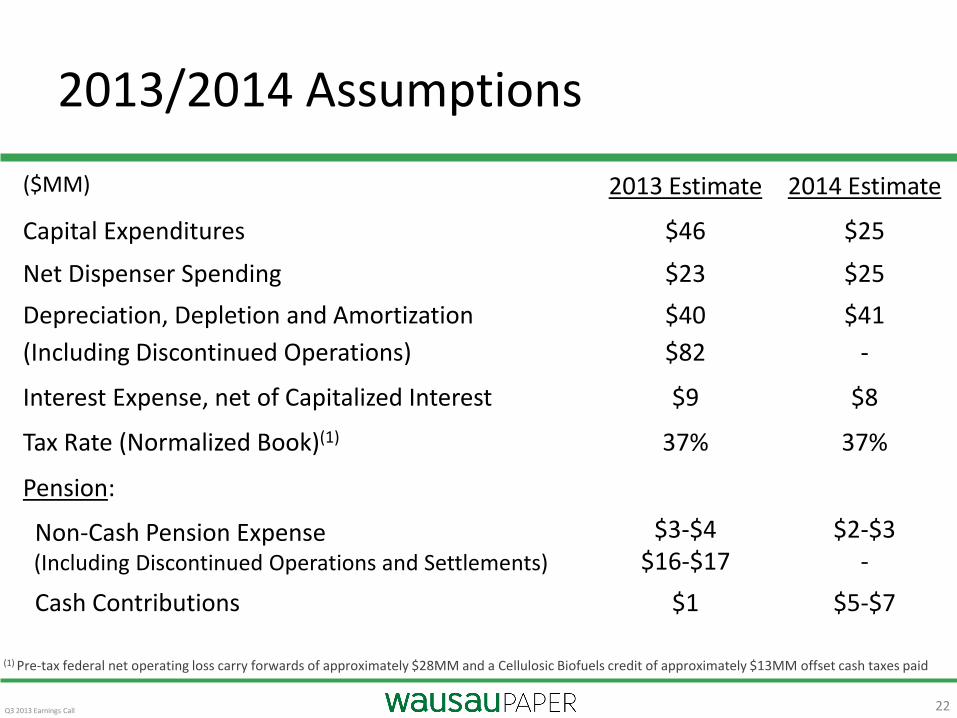
2013/2014 Assumptions
($MM) 2013 Estimate 2014 Estimate
Capital Expenditures $46 $25
Net Dispenser Spending $23 $25
Depreciation, Depletion and Amortization
(Including Discontinued Operations)
$40
$82
$41
-
Interest Expense, net of Capitalized Interest $9 $8
Tax Rate (Normalized Book)(1) 37% 37%
Pension:
Non-Cash Pension Expense (Including Discontinued Operations and Settlements)
$3-$4 $16-$17
$2-$3 -
Cash Contributions $1 $5-$7
22 Q3 2013 Earnings Call
(1) Pre-tax federal net operating loss carry forwards of approximately $28MM and a Cellulosic Biofuels credit of approximately $13MM offset cash taxes paid

Longer-Term View
Q3 2013 Earnings Call 23
• Well-positioned for significant earnings expansion and cash flow growth
• We have previously provided EBITDA guidance of ≈$140MM by 2017. Our outlook has not changed, but any long-term forecast has uncertainties
• Our improvement in earnings and cash flow is a ramp up curve and that improvement will not be in a straight line
• Macro factors such as fiber are expected to be offset by product pricing over time in our long-term outlook, but there will be lags in timing
$0
$25
$50
$75
$100
2013F 2014F Q4 2014FAnnualized
$38-$40
$65-$70
$80-$96
Overall Solid Progress on Path to Achieving our Objectives
Adjusted EBITDA Continuing Operations
($MM)

Summary
• A 100% Tissue company uniquely positioned to grow and deliver value
• Excellent third quarter progress delivering volume growth and margin expansion
• Return of cash to our shareholders is a priority
Q3 2013 Earnings Call 24

Q&A
25 Q3 2013 Earnings Call

26
Upcoming Events: Bank of America US Basic Materials Conference Boston, Massachusetts Wednesday, December 11, 2013 Q4 2013 Earnings Release - Monday, February 10, 2014 Next Investor and Analyst Conference Call - Tuesday, February 11, 2014
9 AM Central / 10 AM Eastern
Q3 2013 Earnings Call

APPENDIX
27 Q3 2013 Earnings Call
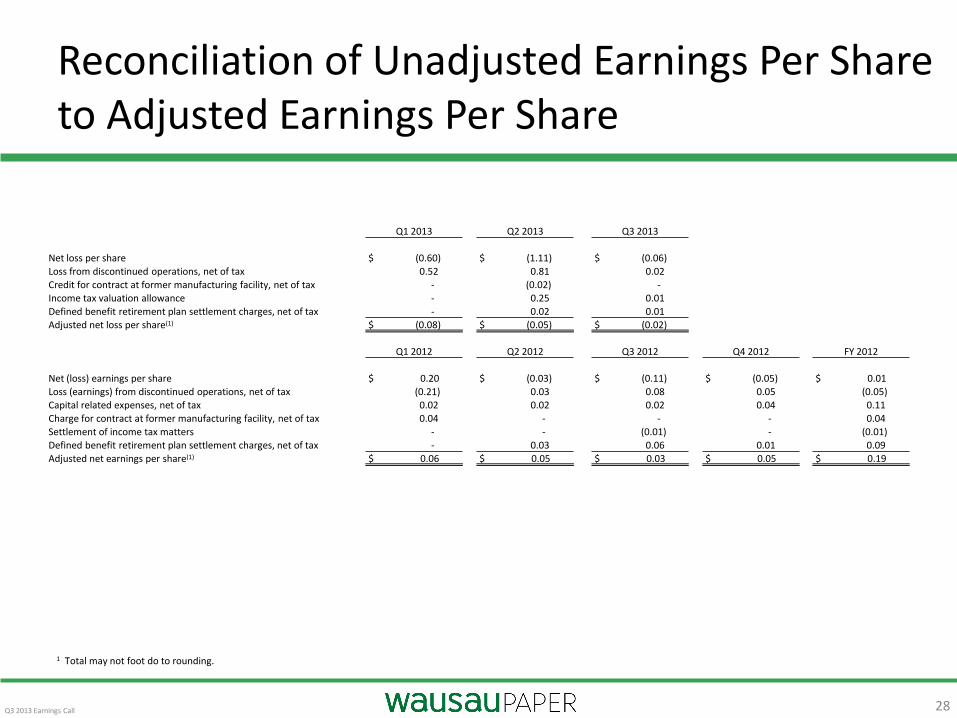
Reconciliation of Unadjusted Earnings Per Share to Adjusted Earnings Per Share
28
1 Total may not foot do to rounding.
Q3 2013 Earnings Call
Q1 2013 Q2 2013 Q3 2013
Net loss per share $ (0.60) $ (1.11) $ (0.06) Loss from discontinued operations, net of tax 0.52 0.81 0.02
Credit for contract at former manufacturing facility, net of tax - (0.02) -
Income tax valuation allowance - 0.25 0.01
Defined benefit retirement plan settlement charges, net of tax - 0.02 0.01 Adjusted net loss per share(1) $ (0.08) $ (0.05) $ (0.02)
Q1 2012 Q2 2012 Q3 2012 Q4 2012 FY 2012
Net (loss) earnings per share $ 0.20 $ (0.03) $ (0.11) $ (0.05) $ 0.01 Loss (earnings) from discontinued operations, net of tax (0.21) 0.03 0.08 0.05 (0.05) Capital related expenses, net of tax 0.02 0.02 0.02 0.04 0.11
Charge for contract at former manufacturing facility, net of tax 0.04 - - - 0.04
Settlement of income tax matters - - (0.01) - (0.01)
Defined benefit retirement plan settlement charges, net of tax - 0.03 0.06 0.01 0.09
Adjusted net earnings per share(1) $ 0.06 $ 0.05 $ 0.03 $ 0.05 $ 0.19

Reconciliation of Unadjusted EBITDA to Adjusted EBITDA
Q3 2013 Earnings Call 29
(in thousands) Q1 2013 Q2 2013 Q3 2013
Net loss $ (29,605) $ (54,826) $ (2,852)
Loss from discontinued operations, net of taxes 25,873 40,231 818
(Credit) provision for income taxes (2,420) 11,255 (132)
Interest expense and other, net 2,343 2,530 1,982
Operating loss (3,809) (810) (184)
Depreciation, depletion, and amortization 9,740 10,032 9,945
EBITDA $ 5,931 $ 9,222 $ 9,761
Net sales $ 78,193 $ 87,623 $ 91,663
EBITDA margin 7.6% 10.5% 10.6%
EBITDA $ 5,931 $ 9,222 $ 9,761
Capital related expenses - - -
Credit for contract at former manufacturing facility - (1,713)
Defined benefit retirement plan settlement charges 0 1,320 801
Adjusted EBITDA $ 5,931 $ 8,829 $ 10,562
Net sales $ 78,193 $ 87,623 $ 91,663
Adjusted EBITDA margin 7.6% 10.1% 11.5%
(in thousands) Q1 2012 Q2 2012 Q3 2012 Q4 2012 FY 2012
Net earnings (loss) $ 9,758 $ (1,315) $ (5,309) $ (2,458) $ 676
(Loss) earnings from discontinued operations, net of taxes (10,251) 1,614 3,708 2,691 (2,236)
(Credit) provision for income taxes (536) 709 (832) (23) (682)
Interest expense and other, net 735 1,000 661 985 3,381
Operating profit (loss) (294) 2,008 (1,772) 1,195 1,139
Depreciation, depletion, and amortization 7,201 7,285 7,410 8,677 30,573
EBITDA $ 6,907 $ 9,293 $ 5,638 $ 9,872 $ 31,712
Net sales $ 81,851 $ 88,559 $ 86,811 $ 86,961 $ 344,182
EBITDA margin 8.4% 10.5% 6.5% 11.4% 9.2%
EBITDA $ 6,907 $ 9,293 $ 5,638 $ 9,872 $ 31,712
Capital related expenses 1,923 1,498 1,947 2,985 8,353
Charge for contract at former manufacturing facility 3,324 - - - 3,324
Defined benefit retirement plan settlement charges - 2,240 4,388 519 7,147
Adjusted EBITDA $ 12,154 $ 13,031 $ 11,973 $ 13,376 $ 50,536
Net sales $ 81,851 $ 88,559 $ 86,811 $ 86,961 $ 344,182
Adjusted EBITDA margin 14.9% 14.7% 13.8% 15.4% 14.7%

Net Sales
30
Net Sales to Net Sales – Continuing Operations
Q1 12 Q2 12 Q3 12 Q4 12 2012 FY Q1 13
Consolidated Net Sales – As Reported $216.2 $ 212.9 $202.2 $190.9 $822.2 $188.0
Net Sales from Discontinued Operations (134.3) (124.3) (115.4) (103.9) (478.0) (109.8)
Consolidated Net Sales – Continuing Operations $81.9 $ 88.6 $86.8 $87.0 $344.2 $78.2
Q3 2013 Earnings Call