Embed Size (px)
Citation preview
Kuehne + Nagel International AG
Analyst Conference Call – Half-Year 2015 Results
July 14, 2015 (CET 14.00)
Schindellegi, Switzerland
Kuehne + Nagel Group – Half-Year 2015 Results
Forward-looking statements
This presentation contains forward-looking statements.
Such statements are subject to risks and uncertainties as various factors, many of
which are beyond the control of Kuehne + Nagel International AG, may cause actual
development and results to differ materially from the expectations contained in the
presentation.
Reference is also made to our disclaimer on the last slide of this presentation.
July 14, 2015 p. 2
p. 3 July 14, 2015 Kuehne + Nagel Group – Half-Year 2015 Results
Agenda
Overview Half-Year 2015
Financial review
Appendices
396
410
440
2014 2015 2015 cc
3,107
3,018
3,281
2014 2015 2015 cc
8,500
8,225
8,885
2014 2015 2015 cc
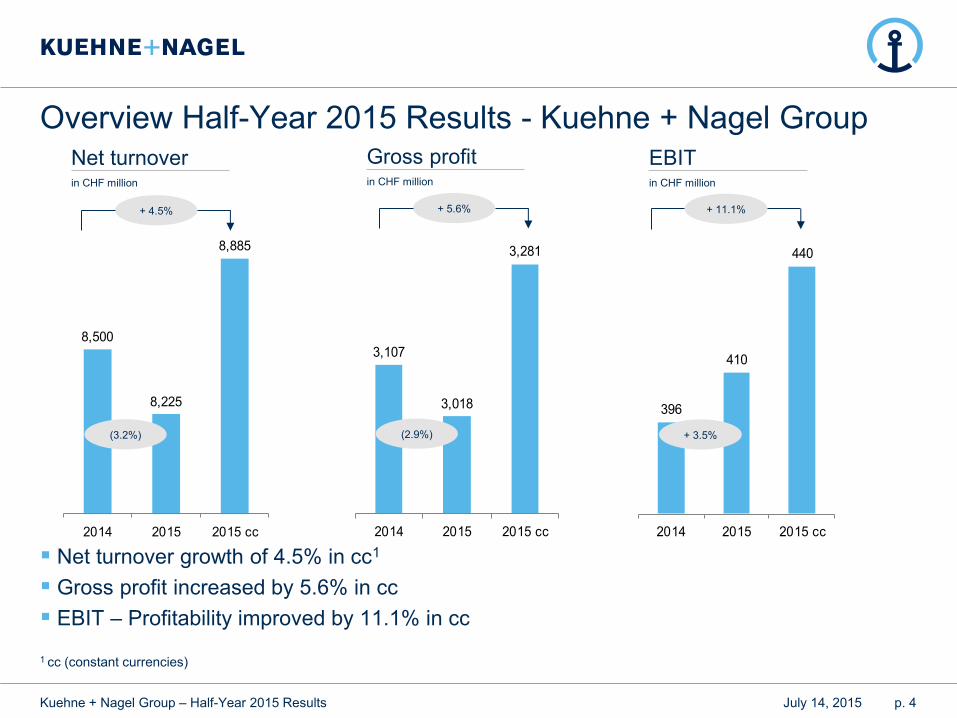
Overview Half-Year 2015 Results - Kuehne + Nagel Group
p. 4 July 14, 2015 Kuehne + Nagel Group – Half-Year 2015 Results
Net turnover growth of 4.5% in cc1
Gross profit increased by 5.6% in cc
EBIT – Profitability improved by 11.1% in cc
1 cc (constant currencies)
Net turnover
in CHF million
Gross profit
in CHF million
EBIT
in CHF million
(2.9%)
+ 5.6%
+ 3.5%
+ 11.1% + 4.5%
(3.2%)
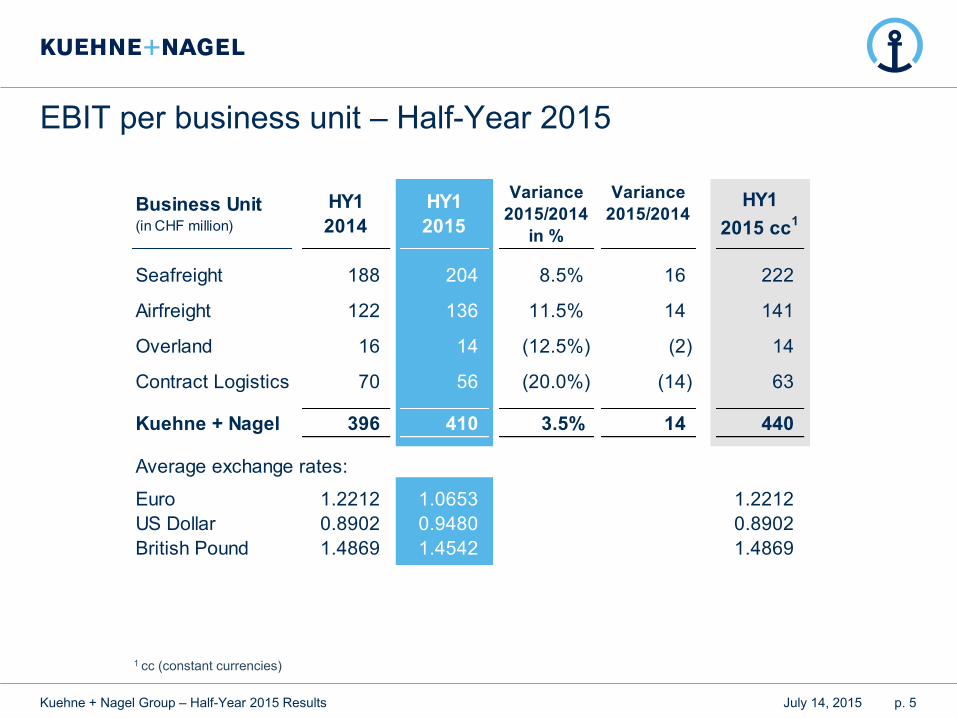
EBIT per business unit – Half-Year 2015
p. 5 July 14, 2015 Kuehne + Nagel Group – Half-Year 2015 Results
1 cc (constant currencies)
Seafreight 188 204 8.5% 16 222
Airfreight 122 136 11.5% 14 141
Overland 16 14 (12.5%) (2) 14
Contract Logistics 70 56 (20.0%) (14) 63
Kuehne + Nagel 396 410 3.5% 14 440
Average exchange rates:
Euro 1.2212 1.0653 1.2212
US Dollar 0.8902 0.9480 0.8902
British Pound 1.4869 1.4542 1.4869
Variance
2015/2014
in %
Variance
2015/2014HY1
2014
HY1
2015
HY1
2015 cc1
Business Unit (in CHF million)

Development of volumes
p. 6 July 14, 2015 Kuehne + Nagel Group – Half-Year 2015 Results
Seafreight
[TEU] ‘000
Volume decrease of 1.8% or 34,000 TEUs yoy
Yield increase of 4.4% or CHF 15 GP/TEU yoy
Airfreight
[TON] ‘000
Volume increase of 5.2% or 30,000 tons yoy
Yield decrease of 3.9% or CHF 3 GP/100kg yoy
2015 GP/100kg in CHF
2014 GP/100kg in CHF
2013 GP/100kg in CHF
2015 GP/TEU in CHF
2014 GP/TEU in CHF
2013 GP/TEU in CHF
838
911923
906896
996
896
996 991
937
890
968
390364 366
355
356
327
356
327 350343
364349
Q1 2014vs. 2013
Q2 2014vs. 2013
Q3 2014vs. 2013
Q4 2014vs. 2013
Q1 2015vs. 2014
Q2 2015vs. 2014
281277 279
297
285
295
285
295 297
317
304 306
7881
79
72
77 75
7775 75
69
7373
Q1 2014vs. 2013
Q2 2014vs. 2013
Q3 2014vs. 2013
Q4 2014vs. 2013
Q1 2015vs. 2014
Q2 2015vs. 2014
838
911 923 906 896
996 991 937
890
968
390 364 366 355 356
327 350 343
364 349
29.4 30.4
32.0 31.1
28.8 29.4
32.3
30.5 29.0
32.5
20.0
25.0
30.0
35.0
40.0
45.0
200
300
400
500
600
700
800
900
1'000
1'100
Q12013
Q22013
Q32013
Q42013
Q12014
Q22014
Q32014
Q42014
Q12015
Q22015
TEU '000
GP/TEUin CHF
ConversionRate in %
Conversion Rate in %
‘000 TEU,
CHF in %
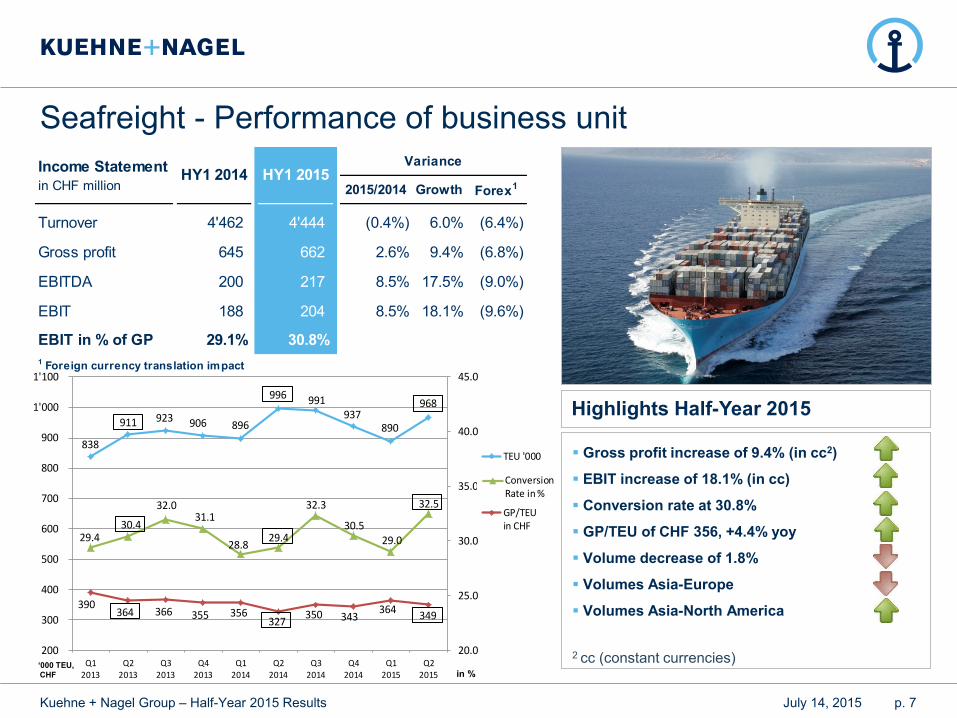
Seafreight - Performance of business unit
p. 7 July 14, 2015 Kuehne + Nagel Group – Half-Year 2015 Results
Gross profit increase of 9.4% (in cc2)
EBIT increase of 18.1% (in cc)
Conversion rate at 30.8%
GP/TEU of CHF 356, +4.4% yoy
Volume decrease of 1.8%
Volumes Asia-Europe
Volumes Asia-North America
2 cc (constant currencies)
Highlights Half-Year 2015
2015/2014 Growth Forex1
Turnover 4'462 4'444 (0.4%) 6.0% (6.4%)
Gross profit 645 662 2.6% 9.4% (6.8%)
EBITDA 200 217 8.5% 17.5% (9.0%)
EBIT 188 204 8.5% 18.1% (9.6%)
EBIT in % of GP 29.1% 30.8%
1 Foreign currency translation impact
HY1 2015Income Statement
in CHF millionHY1 2014
Variance
281 277 279 297
285 295 297
317 304
306
78 81 79 72 77 75 75 69 73 73
24.2 25.6 25.5 26.0
28.3 27.3 27.0 25.6
30.8 30.4
10.0
15.0
20.0
25.0
30.0
35.0
40.0
50
100
150
200
250
300
350
Q12013
Q22013
Q32013
Q42013
Q12014
Q22014
Q32014
Q42014
Q12015
Q22015
Tons '000
GP/100kgin CHF
ConversionRate
Conversion Rate in %
‘000 Tons,
CHF in %
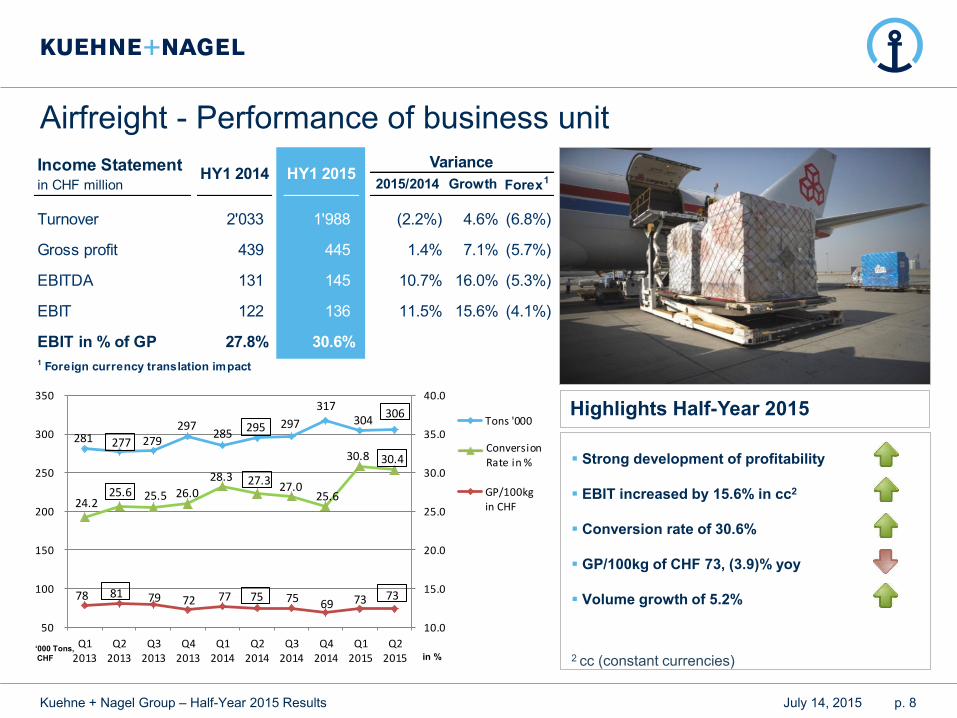
Airfreight - Performance of business unit
p. 8 July 14, 2015 Kuehne + Nagel Group – Half-Year 2015 Results
Strong development of profitability
EBIT increased by 15.6% in cc2
Conversion rate of 30.6%
GP/100kg of CHF 73, (3.9)% yoy
Volume growth of 5.2%
2 cc (constant currencies)
Highlights Half-Year 2015
2015/2014 Growth Forex1
Turnover 2'033 1'988 (2.2%) 4.6% (6.8%)
Gross profit 439 445 1.4% 7.1% (5.7%)
EBITDA 131 145 10.7% 16.0% (5.3%)
EBIT 122 136 11.5% 15.6% (4.1%)
EBIT in % of GP 27.8% 30.6%1 Foreign currency translation impact
HY1 2015Income Statement in CHF million
HY1 2014Variance
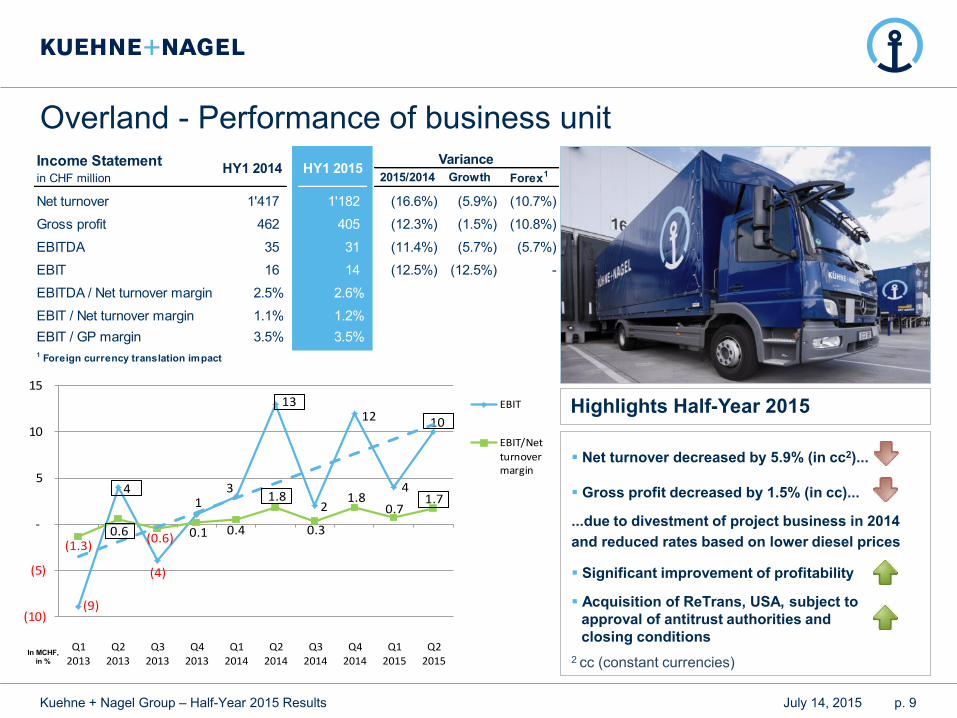
Overland - Performance of business unit
p. 9 July 14, 2015 Kuehne + Nagel Group – Half-Year 2015 Results
Net turnover decreased by 5.9% (in cc2)...
Gross profit decreased by 1.5% (in cc)...
...due to divestment of project business in 2014
and reduced rates based on lower diesel prices
Significant improvement of profitability
Acquisition of ReTrans, USA, subject to
approval of antitrust authorities and
closing conditions
2 cc (constant currencies)
Highlights Half-Year 2015
(9)
4
(4)
1 3
13
2
12
4
10
(1.3)0.6
(0.6) 0.1 0.4
1.8
0.3
1.8 0.7
1.7
(10)
(5)
-
5
10
15
Q1
2013
Q2
2013
Q3
2013
Q4
2013
Q1
2014
Q2
2014
Q3
2014
Q4
2014
Q1
2015
Q2
2015
EBIT
EBIT/Netturnovermargin
In MCHF,
in %
2015/2014 Growth Forex1
Net turnover 1'417 1'182 (16.6%) (5.9%) (10.7%)
Gross profit 462 405 (12.3%) (1.5%) (10.8%)
EBITDA 35 31 (11.4%) (5.7%) (5.7%)
EBIT 16 14 (12.5%) (12.5%) -
EBITDA / Net turnover margin 2.5% 2.6%
EBIT / Net turnover margin 1.1% 1.2%
EBIT / GP margin 3.5% 3.5%1 Foreign currency translation impact
Income Statement in CHF million
HY1 2014 HY1 2015Variance
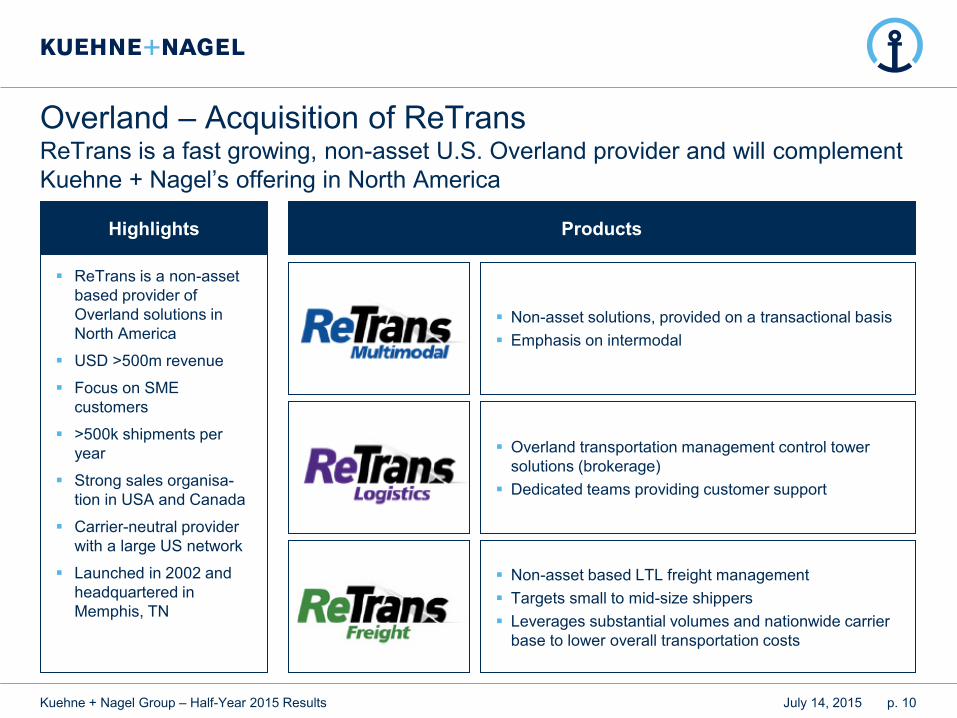
Overland – Acquisition of ReTrans ReTrans is a fast growing, non-asset U.S. Overland provider and will complement
Kuehne + Nagel’s offering in North America
p. 10 July 14, 2015 Kuehne + Nagel Group – Half-Year 2015 Results
Highlights
ReTrans is a non-asset
based provider of
Overland solutions in
North America
USD >500m revenue
Focus on SME
customers
>500k shipments per
year
Strong sales organisa-
tion in USA and Canada
Carrier-neutral provider
with a large US network
Launched in 2002 and
headquartered in
Memphis, TN
Products
Non-asset solutions, provided on a transactional basis
Emphasis on intermodal
Overland transportation management control tower
solutions (brokerage)
Dedicated teams providing customer support
Non-asset based LTL freight management
Targets small to mid-size shippers
Leverages substantial volumes and nationwide carrier
base to lower overall transportation costs
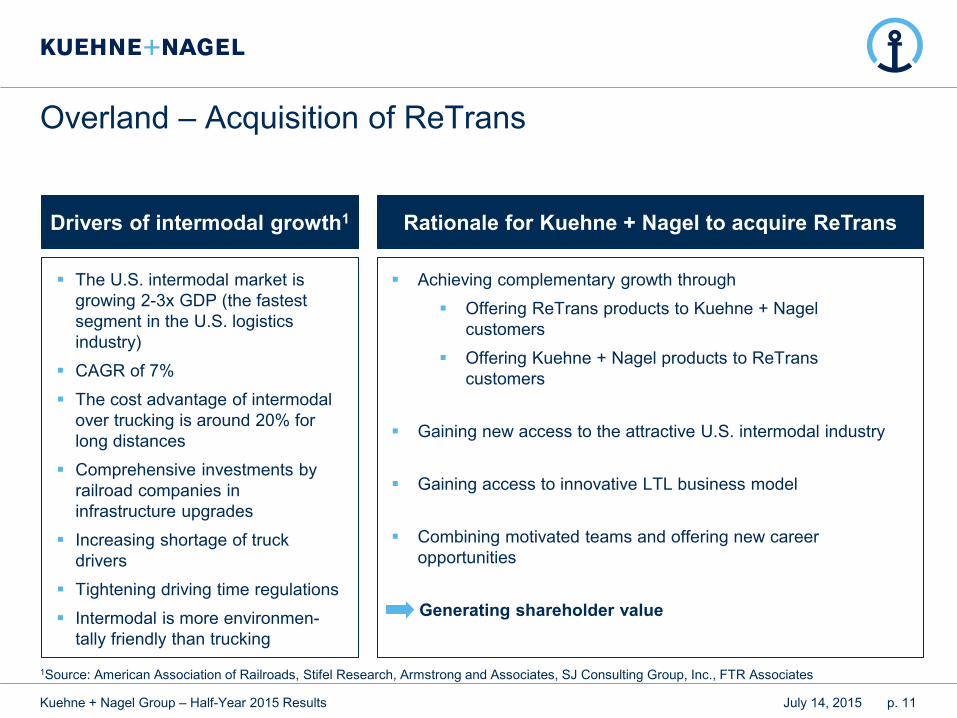
Overland – Acquisition of ReTrans
p. 11 July 14, 2015 Kuehne + Nagel Group – Half-Year 2015 Results
Rationale for Kuehne + Nagel to acquire ReTrans Drivers of intermodal growth1
The U.S. intermodal market is
growing 2-3x GDP (the fastest
segment in the U.S. logistics
industry)
CAGR of 7%
The cost advantage of intermodal
over trucking is around 20% for
long distances
Comprehensive investments by
railroad companies in
infrastructure upgrades
Increasing shortage of truck
drivers
Tightening driving time regulations
Intermodal is more environmen-
tally friendly than trucking
1Source: American Association of Railroads, Stifel Research, Armstrong and Associates, SJ Consulting Group, Inc., FTR Associates
Achieving complementary growth through
Offering ReTrans products to Kuehne + Nagel
customers
Offering Kuehne + Nagel products to ReTrans
customers
Gaining new access to the attractive U.S. intermodal industry
Gaining access to innovative LTL business model
Combining motivated teams and offering new career
opportunities
Generating shareholder value
Contract Logistics - Performance of business unit
p. 12 July 14, 2015 Kuehne + Nagel Group – Half-Year 2015 Results
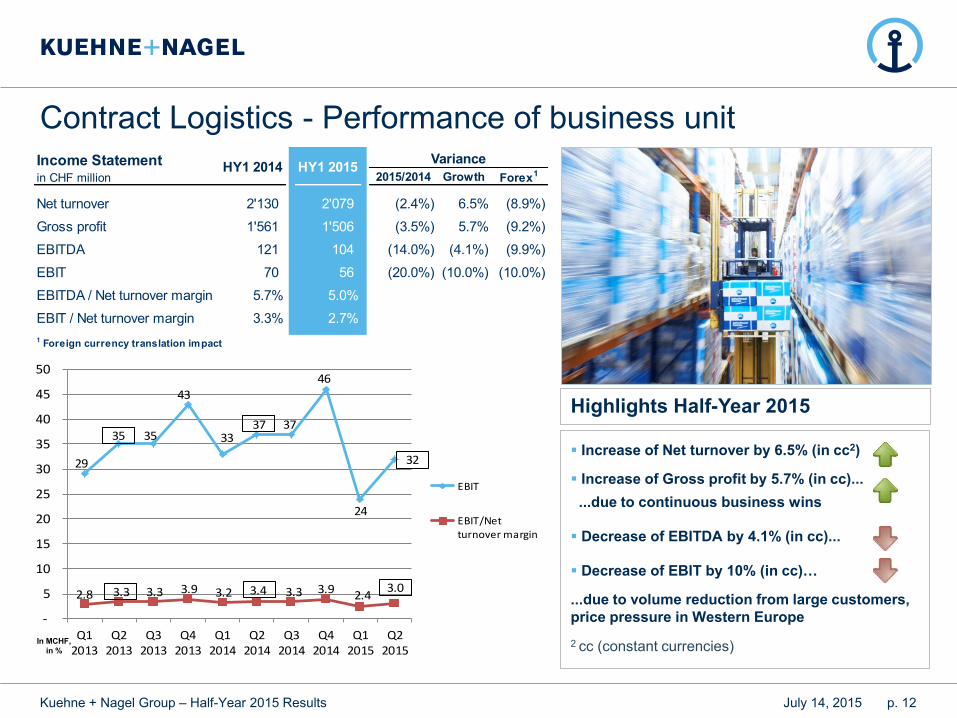
Increase of Net turnover by 6.5% (in cc2)
Increase of Gross profit by 5.7% (in cc)...
...due to continuous business wins
Decrease of EBITDA by 4.1% (in cc)...
Decrease of EBIT by 10% (in cc)…
...due to volume reduction from large customers,
price pressure in Western Europe
2 cc (constant currencies)
Highlights Half-Year 2015
29
35 35
43
33 37 37
46
24
32
2.8 3.3 3.3 3.9 3.2 3.4 3.3 3.9 2.4 3.0
-
5
10
15
20
25
30
35
40
45
50
Q12013
Q22013
Q32013
Q42013
Q12014
Q22014
Q32014
Q42014
Q12015
Q22015
EBIT
EBIT/Netturnover margin
In MCHF,
in %
2015/2014 Growth Forex1
Net turnover 2'130 2'079 (2.4%) 6.5% (8.9%)
Gross profit 1'561 1'506 (3.5%) 5.7% (9.2%)
EBITDA 121 104 (14.0%) (4.1%) (9.9%)
EBIT 70 56 (20.0%) (10.0%) (10.0%)
EBITDA / Net turnover margin 5.7% 5.0%
EBIT / Net turnover margin 3.3% 2.7%
1 Foreign currency translation impact
HY1 2015Income Statement in CHF million
HY1 2014Variance
p. 13 July 14, 2015 Kuehne + Nagel Group – Half-Year 2015 Results
Agenda
Overview Half-Year 2015
Financial review
Appendices
Income statement
p. 14 July 14, 2015 Kuehne + Nagel Group – Half-Year 2015 Results
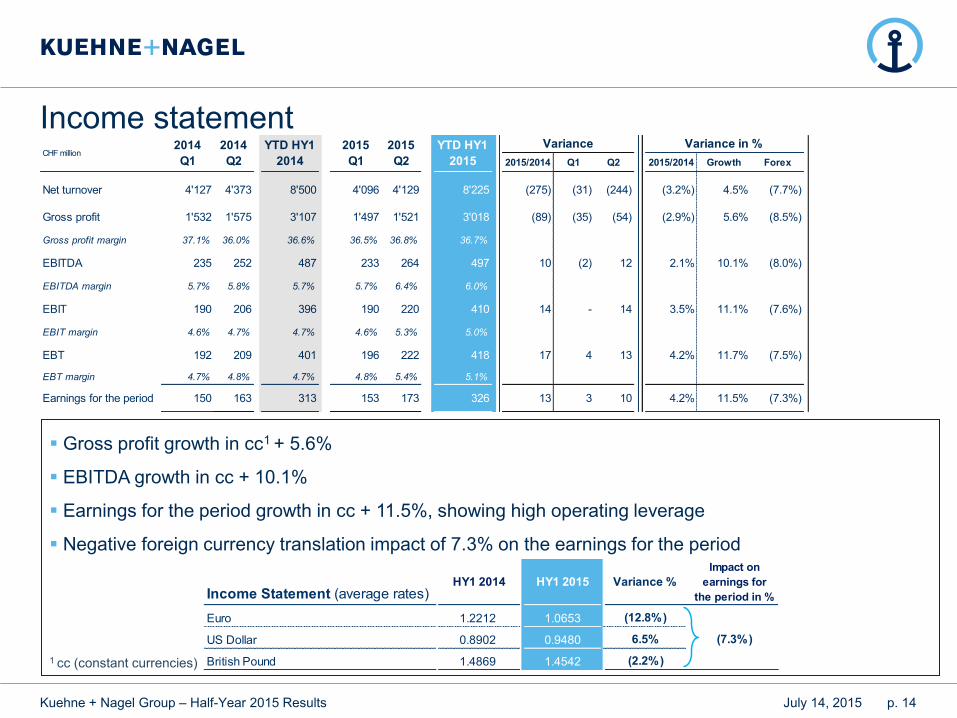
Gross profit growth in cc1 + 5.6%
EBITDA growth in cc + 10.1%
Earnings for the period growth in cc + 11.5%, showing high operating leverage
Negative foreign currency translation impact of 7.3% on the earnings for the period
1 cc (constant currencies)
2015/2014 Q1 Q2 2015/2014 Growth Forex
Net turnover 4'127 4'373 8'500 4'096 4'129 8'225 (275) (31) (244) (3.2%) 4.5% (7.7%)
Gross profit 1'532 1'575 3'107 1'497 1'521 3'018 (89) (35) (54) (2.9%) 5.6% (8.5%)
Gross profit margin 37.1% 36.0% 36.6% 36.5% 36.8% 36.7%
EBITDA 235 252 487 233 264 497 10 (2) 12 2.1% 10.1% (8.0%)
EBITDA margin 5.7% 5.8% 5.7% 5.7% 6.4% 6.0%
EBIT 190 206 396 190 220 410 14 - 14 3.5% 11.1% (7.6%)
EBIT margin 4.6% 4.7% 4.7% 4.6% 5.3% 5.0%
EBT 192 209 401 196 222 418 17 4 13 4.2% 11.7% (7.5%)
EBT margin 4.7% 4.8% 4.7% 4.8% 5.4% 5.1%
Earnings for the period 150 163 313 153 173 326 13 3 10 4.2% 11.5% (7.3%)
Variance in %VarianceYTD HY1
2015
YTD HY1
2014
2015
Q1
2015
Q2CHF million
2014
Q1
2014
Q2
Income Statement (average rates)
Euro 1.2212 1.0653 (12.8%)
US Dollar 0.8902 0.9480 6.5% (7.3%)
British Pound 1.4869 1.4542 (2.2%)
Variance %HY1 2015HY1 2014
Impact on
earnings for
the period in %
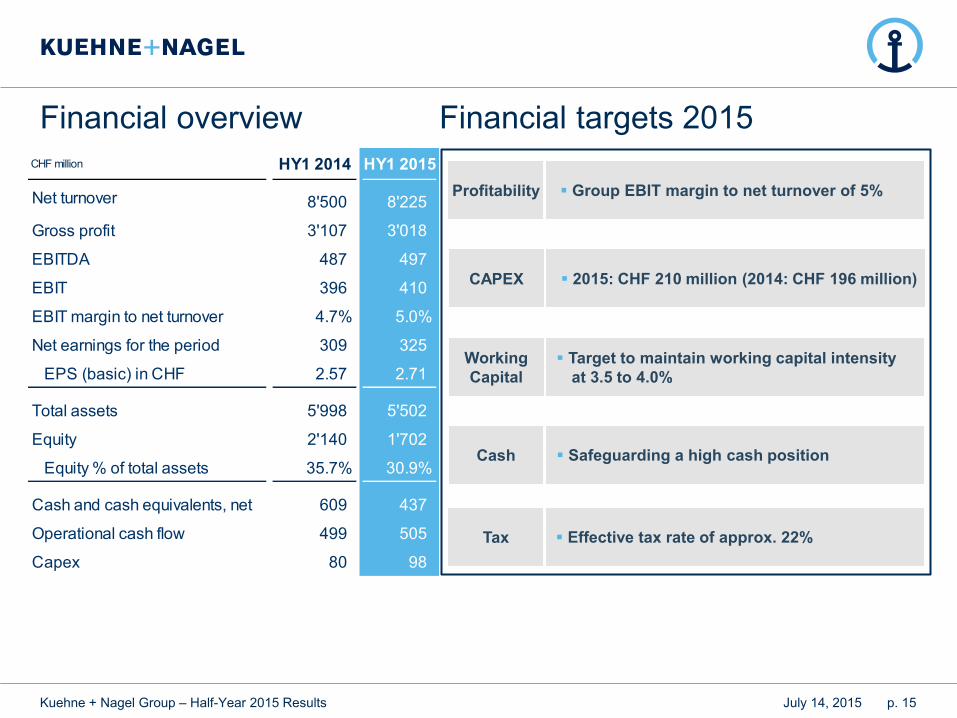
Financial overview Financial targets 2015
p. 15 July 14, 2015 Kuehne + Nagel Group – Half-Year 2015 Results
Working
Capital
Cash
Tax
Safeguarding a high cash position
Effective tax rate of approx. 22%
CAPEX 2015: CHF 210 million (2014: CHF 196 million)
Group EBIT margin to net turnover of 5%
Target to maintain working capital intensity
at 3.5 to 4.0%
Profitability
CHF million HY1 2014 HY1 2015
Net turnover 8'500 8'225
Gross profit 3'107 3'018
EBITDA 487 497
EBIT 396 410
EBIT margin to net turnover 4.7% 5.0%
Net earnings for the period 309 325
EPS (basic) in CHF 2.57 2.71
Total assets 5'998 5'502
Equity 2'140 1'702
Equity % of total assets 35.7% 30.9%
Cash and cash equivalents, net 609 437
Operational cash flow 499 505
Capex 80 98
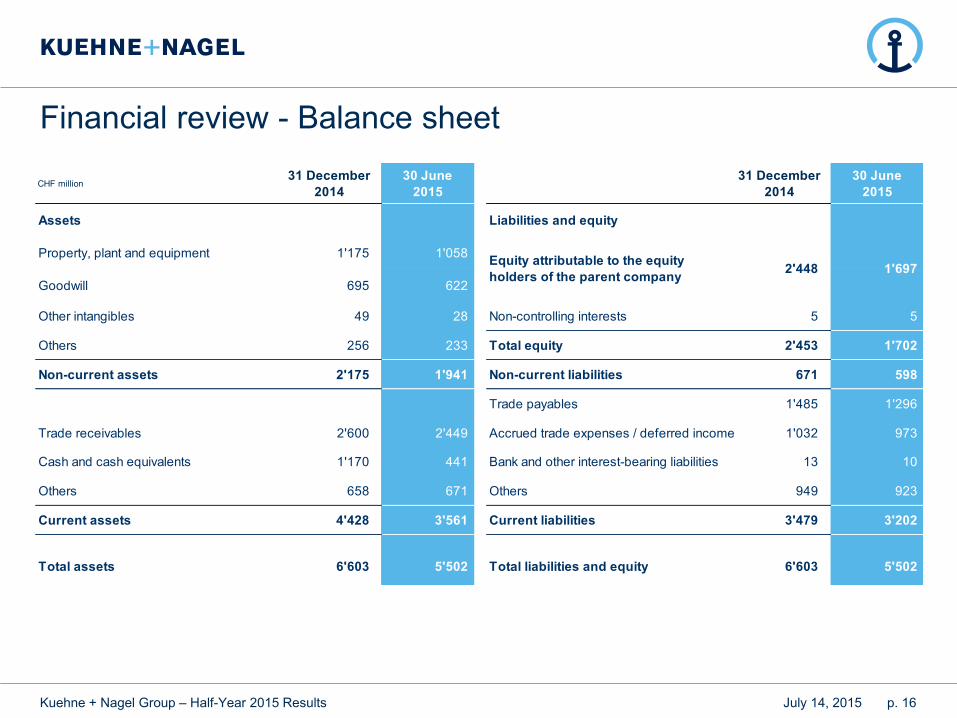
Financial review - Balance sheet
p. 16 July 14, 2015 Kuehne + Nagel Group – Half-Year 2015 Results
CHF million31 December
2014
30 June
2015
31 December
2014
30 June
2015
Assets Liabilities and equity
Property, plant and equipment 1'175 1'058
Goodwill 695 622
Other intangibles 49 28 Non-controlling interests 5 5
Others 256 233 Total equity 2'453 1'702
Non-current assets 2'175 1'941 Non-current liabilities 671 598
Trade payables 1'485 1'296
Trade receivables 2'600 2'449 Accrued trade expenses / deferred income 1'032 973
Cash and cash equivalents 1'170 441 Bank and other interest-bearing liabilities 13 10
Others 658 671 Others 949 923
Current assets 4'428 3'561 Current liabilities 3'479 3'202
Total assets 6'603 5'502 Total liabilities and equity 6'603 5'502
Equity attributable to the equity
holders of the parent company2'448 1'697
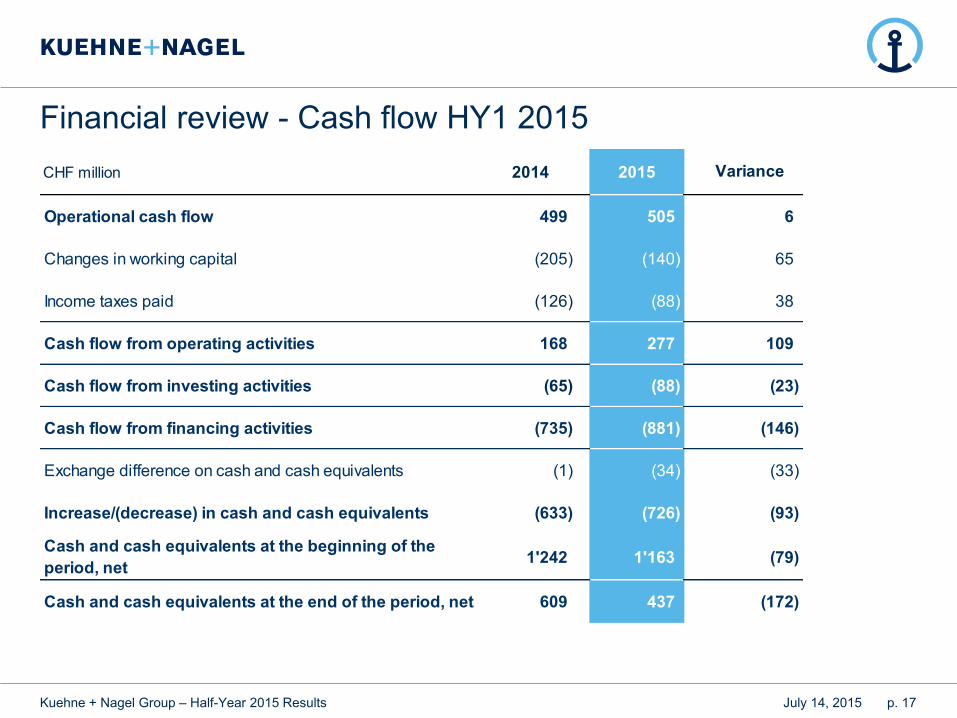
Financial review - Cash flow HY1 2015
p. 17 July 14, 2015 Kuehne + Nagel Group – Half-Year 2015 Results
CHF million 2014 2015
Operational cash flow 499 505 6
Changes in working capital (205) (140) 65
Income taxes paid (126) (88) 38
Cash flow from operating activities 168 277 109
Cash flow from investing activities (65) (88) (23)
Cash flow from financing activities (735) (881) (146)
Exchange difference on cash and cash equivalents (1) (34) (33)
Increase/(decrease) in cash and cash equivalents (633) (726) (93)
Cash and cash equivalents at the beginning of the
period, net1'242 1'163 (79)
Cash and cash equivalents at the end of the period, net 609 437 (172)
Variance
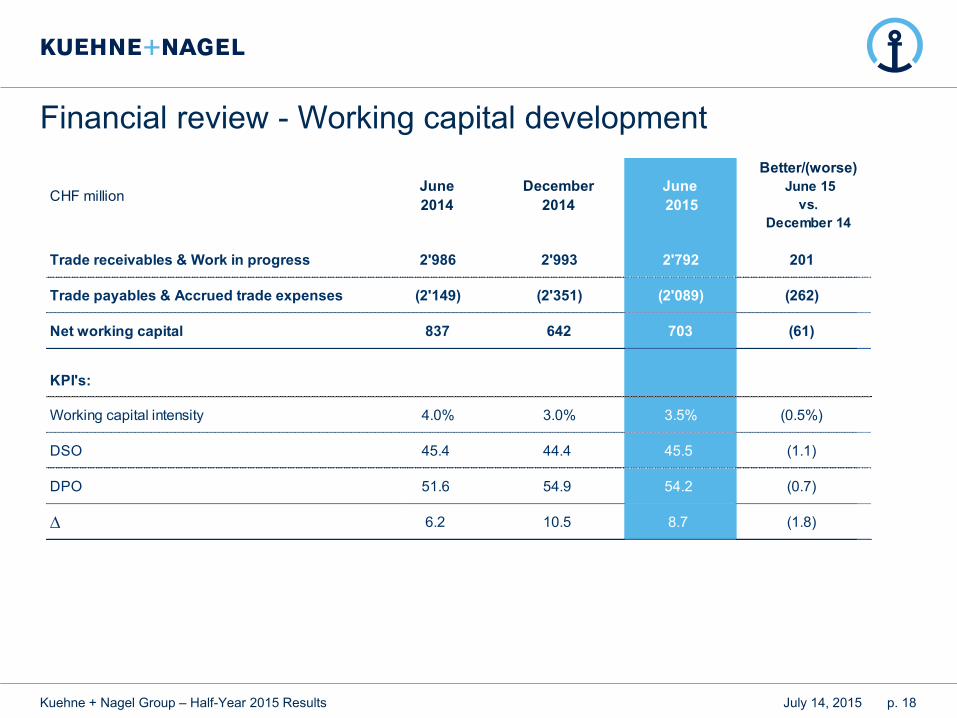
Financial review - Working capital development
p. 18 July 14, 2015 Kuehne + Nagel Group – Half-Year 2015 Results
CHF millionJune
2014
December
2014
June
2015
Trade receivables & Work in progress 2'986 2'993 2'792 201
Trade payables & Accrued trade expenses (2'149) (2'351) (2'089) (262)
Net working capital 837 642 703 (61)
KPI's:
Working capital intensity 4.0% 3.0% 3.5% (0.5%)
DSO 45.4 44.4 45.5 (1.1)
DPO 51.6 54.9 54.2 (0.7)
∆ 6.2 10.5 8.7 (1.8)
Better/(worse)
June 15
vs.
December 14
48% 48% 47%
48% 49%
51%
53%
55% 56%
58%
60%
64%
69%
40%
42%
44%
46%
48%
50%
52%
54%
56%
58%
60%
62%
64%
66%
68%
70%
72%
Q2/2012 Q3/2012 Q4/2012 Q1/2013 Q2/2013 Q3/2013 Q4/2013 Q1/2014 Q2/2014 Q3/2014 Q4/2014 Q1/2015 Q2/2015
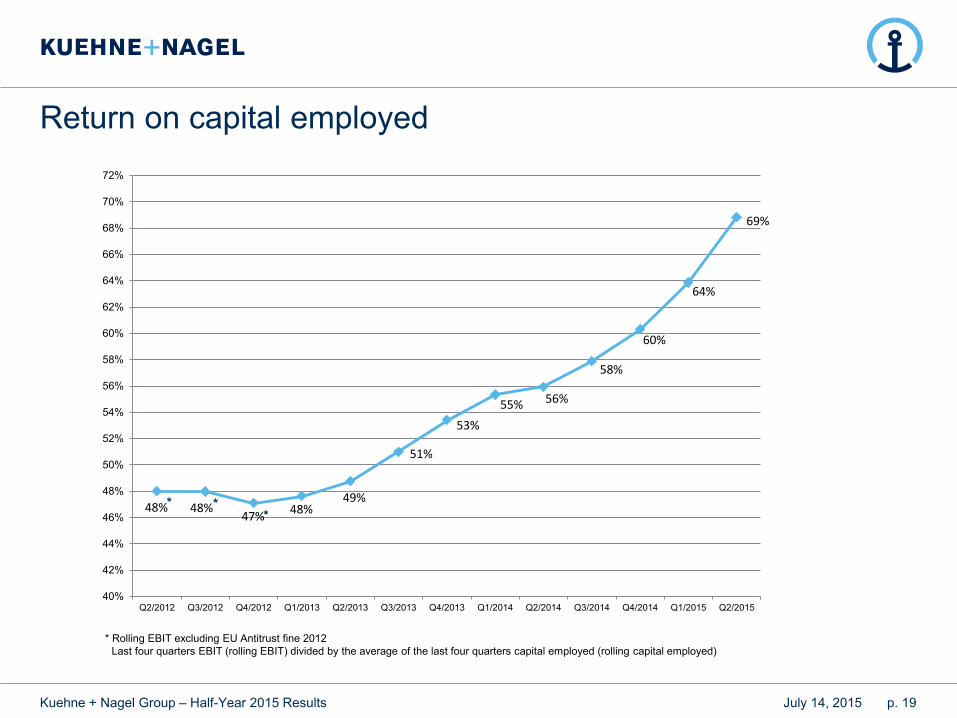
Return on capital employed
p. 19 July 14, 2015 Kuehne + Nagel Group – Half-Year 2015 Results
‘ * Rolling EBIT excluding EU Antitrust fine 2012
Last four quarters EBIT (rolling EBIT) divided by the average of the last four quarters capital employed (rolling capital employed)
* * *
Appendices
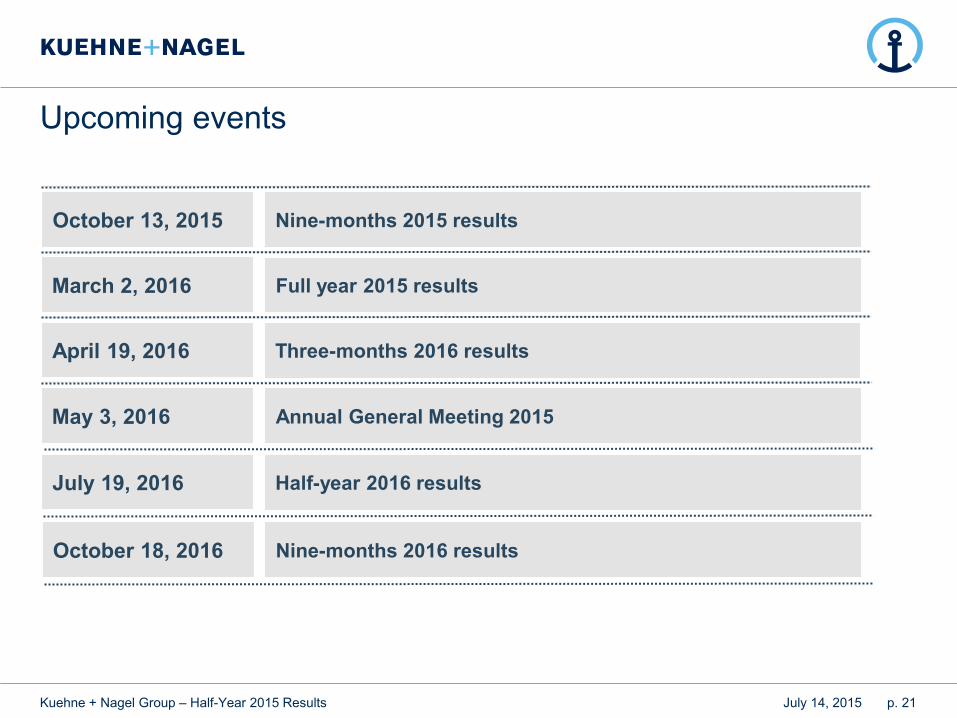
Upcoming events
p. 21 July 14, 2015 Kuehne + Nagel Group – Half-Year 2015 Results
Nine-months 2015 results October 13, 2015
Full year 2015 results March 2, 2016
Three-months 2016 results April 19, 2016
Annual General Meeting 2015 May 3, 2016
Half-year 2016 results July 19, 2016
Nine-months 2016 results October 18, 2016
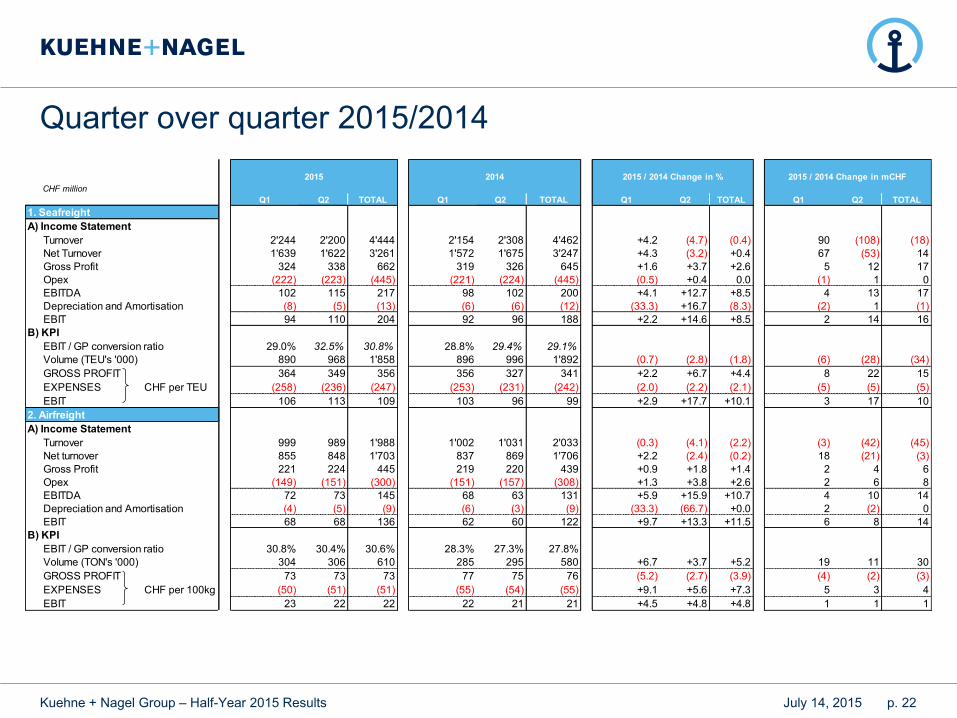
Quarter over quarter 2015/2014
p. 22 July 14, 2015 Kuehne + Nagel Group – Half-Year 2015 Results
CHF million
Q1 Q2 TOTAL Q1 Q2 TOTAL Q1 Q2 TOTAL Q1 Q2 TOTAL
1. Seafreight
A) Income Statement
Turnover 2'244 2'200 4'444 2'154 2'308 4'462 +4.2 (4.7) (0.4) 90 (108) (18)
Net Turnover 1'639 1'622 3'261 1'572 1'675 3'247 +4.3 (3.2) +0.4 67 (53) 14
Gross Profit 324 338 662 319 326 645 +1.6 +3.7 +2.6 5 12 17
Opex (222) (223) (445) (221) (224) (445) (0.5) +0.4 0.0 (1) 1 0
EBITDA 102 115 217 98 102 200 +4.1 +12.7 +8.5 4 13 17
Depreciation and Amortisation (8) (5) (13) (6) (6) (12) (33.3) +16.7 (8.3) (2) 1 (1)
EBIT 94 110 204 92 96 188 +2.2 +14.6 +8.5 2 14 16
B) KPI
EBIT / GP conversion ratio 29.0% 32.5% 30.8% 28.8% 29.4% 29.1%
Volume (TEU's '000) 890 968 1'858 896 996 1'892 (0.7) (2.8) (1.8) (6) (28) (34)
GROSS PROFIT 364 349 356 356 327 341 +2.2 +6.7 +4.4 8 22 15
EXPENSES CHF per TEU (258) (236) (247) (253) (231) (242) (2.0) (2.2) (2.1) (5) (5) (5)
EBIT 106 113 109 103 96 99 +2.9 +17.7 +10.1 3 17 10
2. Airfreight
A) Income Statement
Turnover 999 989 1'988 1'002 1'031 2'033 (0.3) (4.1) (2.2) (3) (42) (45)
Net turnover 855 848 1'703 837 869 1'706 +2.2 (2.4) (0.2) 18 (21) (3)
Gross Profit 221 224 445 219 220 439 +0.9 +1.8 +1.4 2 4 6
Opex (149) (151) (300) (151) (157) (308) +1.3 +3.8 +2.6 2 6 8
EBITDA 72 73 145 68 63 131 +5.9 +15.9 +10.7 4 10 14
Depreciation and Amortisation (4) (5) (9) (6) (3) (9) (33.3) (66.7) +0.0 2 (2) 0
EBIT 68 68 136 62 60 122 +9.7 +13.3 +11.5 6 8 14
B) KPI
EBIT / GP conversion ratio 30.8% 30.4% 30.6% 28.3% 27.3% 27.8%
Volume (TON's '000) 304 306 610 285 295 580 +6.7 +3.7 +5.2 19 11 30
GROSS PROFIT 73 73 73 77 75 76 (5.2) (2.7) (3.9) (4) (2) (3)
EXPENSES CHF per 100kg (50) (51) (51) (55) (54) (55) +9.1 +5.6 +7.3 5 3 4
EBIT 23 22 22 22 21 21 +4.5 +4.8 +4.8 1 1 1
2015 2014 2015 / 2014 Change in % 2015 / 2014 Change in mCHF
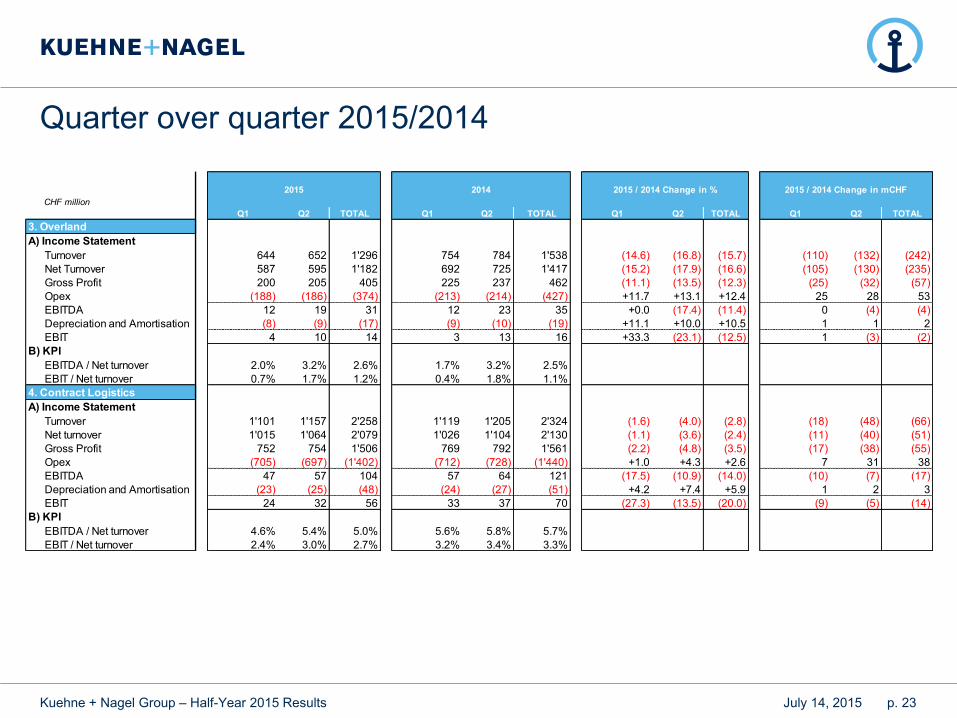
Quarter over quarter 2015/2014
p. 23 July 14, 2015 Kuehne + Nagel Group – Half-Year 2015 Results
CHF million
Q1 Q2 TOTAL Q1 Q2 TOTAL Q1 Q2 TOTAL Q1 Q2 TOTAL
3. Overland
A) Income Statement
Turnover 644 652 1'296 754 784 1'538 (14.6) (16.8) (15.7) (110) (132) (242)
Net Turnover 587 595 1'182 692 725 1'417 (15.2) (17.9) (16.6) (105) (130) (235)
Gross Profit 200 205 405 225 237 462 (11.1) (13.5) (12.3) (25) (32) (57)
Opex (188) (186) (374) (213) (214) (427) +11.7 +13.1 +12.4 25 28 53
EBITDA 12 19 31 12 23 35 +0.0 (17.4) (11.4) 0 (4) (4)
Depreciation and Amortisation (8) (9) (17) (9) (10) (19) +11.1 +10.0 +10.5 1 1 2
EBIT 4 10 14 3 13 16 +33.3 (23.1) (12.5) 1 (3) (2)
B) KPI
EBITDA / Net turnover 2.0% 3.2% 2.6% 1.7% 3.2% 2.5%
EBIT / Net turnover 0.7% 1.7% 1.2% 0.4% 1.8% 1.1%
4. Contract Logistics
A) Income Statement
Turnover 1'101 1'157 2'258 1'119 1'205 2'324 (1.6) (4.0) (2.8) (18) (48) (66)
Net turnover 1'015 1'064 2'079 1'026 1'104 2'130 (1.1) (3.6) (2.4) (11) (40) (51)
Gross Profit 752 754 1'506 769 792 1'561 (2.2) (4.8) (3.5) (17) (38) (55)
Opex (705) (697) (1'402) (712) (728) (1'440) +1.0 +4.3 +2.6 7 31 38
EBITDA 47 57 104 57 64 121 (17.5) (10.9) (14.0) (10) (7) (17)
Depreciation and Amortisation (23) (25) (48) (24) (27) (51) +4.2 +7.4 +5.9 1 2 3
EBIT 24 32 56 33 37 70 (27.3) (13.5) (20.0) (9) (5) (14)
B) KPI
EBITDA / Net turnover 4.6% 5.4% 5.0% 5.6% 5.8% 5.7%
EBIT / Net turnover 2.4% 3.0% 2.7% 3.2% 3.4% 3.3%
2015 2014 2015 / 2014 Change in % 2015 / 2014 Change in mCHF
Quarter over quarter 2015/2014
p. 24 July 14, 2015 Kuehne + Nagel Group – Half-Year 2015 Results
CHF million
Q1 Q2 TOTAL Q1 Q2 TOTAL Q1 Q2 TOTAL Q1 Q2 TOTAL
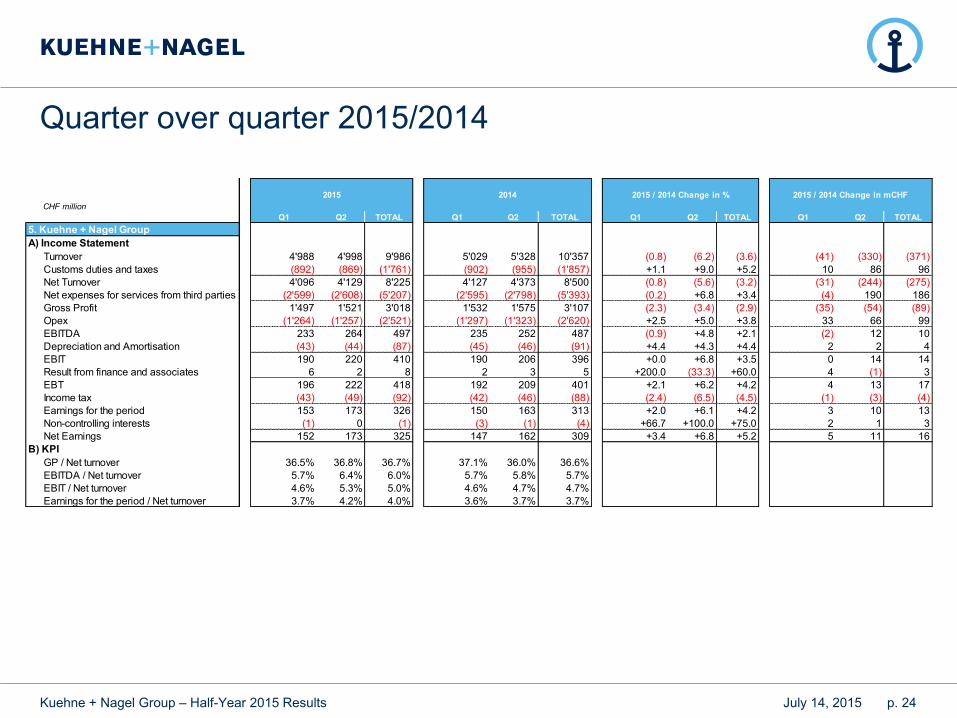
5. Kuehne + Nagel Group
A) Income Statement
Turnover 4'988 4'998 9'986 5'029 5'328 10'357 (0.8) (6.2) (3.6) (41) (330) (371)
Customs duties and taxes (892) (869) (1'761) (902) (955) (1'857) +1.1 +9.0 +5.2 10 86 96
Net Turnover 4'096 4'129 8'225 4'127 4'373 8'500 (0.8) (5.6) (3.2) (31) (244) (275)
Net expenses for services from third parties (2'599) (2'608) (5'207) (2'595) (2'798) (5'393) (0.2) +6.8 +3.4 (4) 190 186
Gross Profit 1'497 1'521 3'018 1'532 1'575 3'107 (2.3) (3.4) (2.9) (35) (54) (89)
Opex (1'264) (1'257) (2'521) (1'297) (1'323) (2'620) +2.5 +5.0 +3.8 33 66 99
EBITDA 233 264 497 235 252 487 (0.9) +4.8 +2.1 (2) 12 10
Depreciation and Amortisation (43) (44) (87) (45) (46) (91) +4.4 +4.3 +4.4 2 2 4
EBIT 190 220 410 190 206 396 +0.0 +6.8 +3.5 0 14 14
Result from finance and associates 6 2 8 2 3 5 +200.0 (33.3) +60.0 4 (1) 3
EBT 196 222 418 192 209 401 +2.1 +6.2 +4.2 4 13 17
Income tax (43) (49) (92) (42) (46) (88) (2.4) (6.5) (4.5) (1) (3) (4)
Earnings for the period 153 173 326 150 163 313 +2.0 +6.1 +4.2 3 10 13
Non-controlling interests (1) 0 (1) (3) (1) (4) +66.7 +100.0 +75.0 2 1 3
Net Earnings 152 173 325 147 162 309 +3.4 +6.8 +5.2 5 11 16
B) KPI
GP / Net turnover 36.5% 36.8% 36.7% 37.1% 36.0% 36.6%
EBITDA / Net turnover 5.7% 6.4% 6.0% 5.7% 5.8% 5.7%
EBIT / Net turnover 4.6% 5.3% 5.0% 4.6% 4.7% 4.7%
Earnings for the period / Net turnover 3.7% 4.2% 4.0% 3.6% 3.7% 3.7%
2015 2014 2015 / 2014 Change in % 2015 / 2014 Change in mCHF
Kuehne + Nagel Group – Half-Year 2015 Results
Contact
Markus Blanka-Graff Andrea Kobi
CFO Investor Relations
[email protected] [email protected]
Tel: +41 (0)44 7869 644 Tel: +41 (0)44 7869 561
Disclaimer
Investing in the shares of Kuehne + Nagel International AG involves risks.
Prospective investors are strongly requested to consult their investment advisors and tax advisors prior to investing in shares of Kuehne + Nagel International AG.
This document contains forward-looking statements which involve risks and uncertainties. These statements may be identified by such words as “may”, “plans”, “expects”, “believes” and similar expressions, or by their context. These statements are made on the basis of current knowledge and assumptions. Various factors could cause actual future results, performance or events to differ materially from those described in these statements. No obligation is assumed to update any forward-looking statements. Potential risks and uncertainties include such factors as general economic conditions, foreign exchange fluctuations, competitive product and pricing pressures and regulatory developments.
The information contained in this document has not been independently verified and no representation or warranty, express or implied, is made to, and no reliance should be placed on, the fairness, accuracy, completeness or correctness of the information or opinions contained herein. The information in this presentation is subject to change without notice, it may be incomplete or condensed, and it may not contain all material information concerning the Kuehne + Nagel Group. None of Kuehne + Nagel International AG or their respective affiliates shall have any liability whatsoever for any loss whatsoever arising from any use of this document, or otherwise arising in connection with this document.
This presentation is not an offer of securities for sale in the United States. The offer and sale of Kuehne + Nagel International AG securities has not been, and will not be registered under the United States Securities Act of 1933, as amended. Kuehne + Nagel International AG securities may not be offered or sold to anyone in the United States absent such registration, except pursuant to an appropriate exemption from registration. There will be no public offering of Kuehne + Nagel International AG securities in the United States.
July 14, 2015 p. 25