Embed Size (px)
Citation preview
Q2 & H1 FY2017 Results
Disclaimer
Certain statements in this communication may be ‘forward looking statements’ within the meaning of applicable
laws and regulations. These forward-looking statements involve a number of risks, uncertainties and other factors
that could cause actual results to differ materially from those suggested by the forward-looking statements.
Important developments that could affect the Company’s operations include changes in the industry structure,
significant changes in political and economic environment in India and overseas, tax laws, import duties, litigation
and labour relations.
The Phoenix Mills Ltd. (PML) will not be in any way responsible for any action taken based on such statements and
undertakes no obligation to publicly update these forward-looking statements to reflect subsequent events or
circumstances.
2
Q2 FY2017 Results
Portfolio Performance
Shareholding Pattern
Company Overview
3
Debt Profile
Financial Overview
Annexure
Company Overview
4
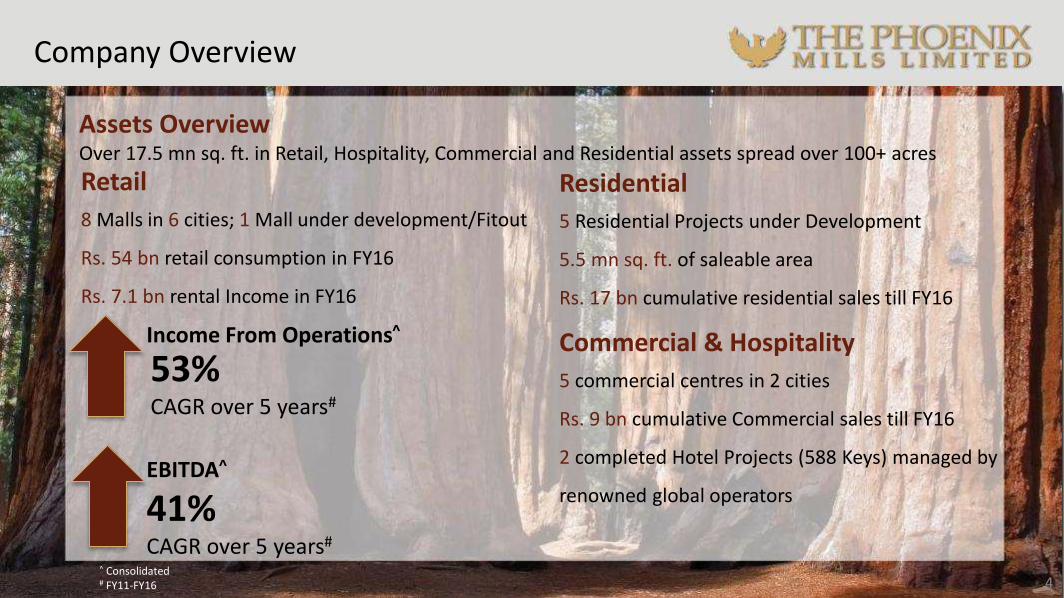
Assets OverviewOver 17.5 mn sq. ft. in Retail, Hospitality, Commercial and Residential assets spread over 100+ acres
Retail
8 Malls in 6 cities; 1 Mall under development/Fitout
Rs. 54 bn retail consumption in FY16
Rs. 7.1 bn rental Income in FY16
Residential
5 Residential Projects under Development
5.5 mn sq. ft. of saleable area
Rs. 17 bn cumulative residential sales till FY16
Commercial & Hospitality
5 commercial centres in 2 cities
Rs. 9 bn cumulative Commercial sales till FY16
2 completed Hotel Projects (588 Keys) managed by
renowned global operators
Income From Operations^
53%CAGR over 5 years#
EBITDA^
41%CAGR over 5 years#
^ Consolidated# FY11-FY16
Key Execution Milestones
5
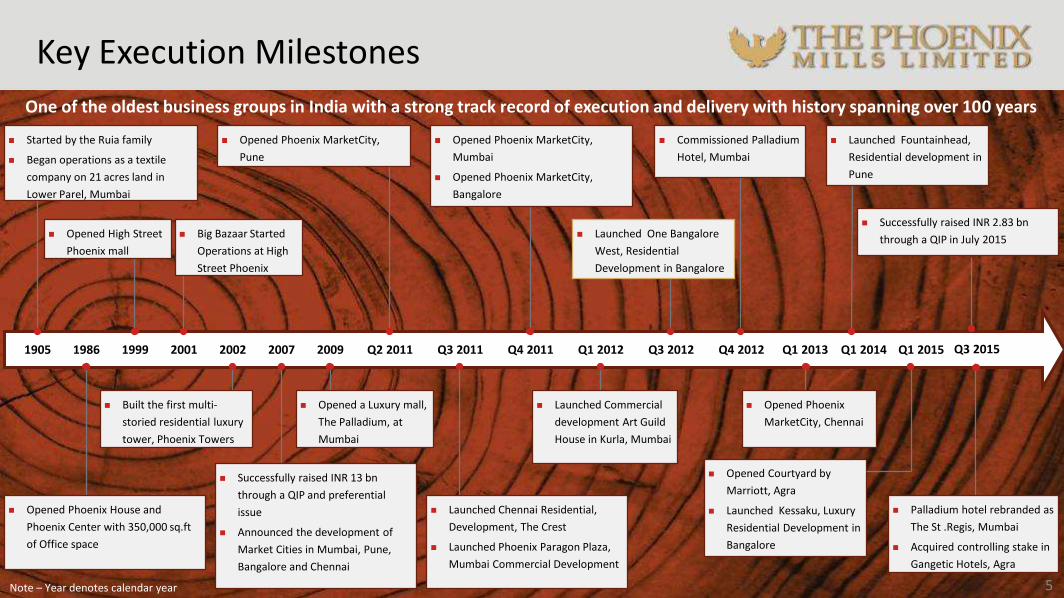
One of the oldest business groups in India with a strong track record of execution and delivery with history spanning over 100 years
Started by the Ruia family
Began operations as a textile
company on 21 acres land in
Lower Parel, Mumbai
Opened Phoenix MarketCity,
Pune
Opened Courtyard by
Marriott, Agra
Launched Kessaku, Luxury
Residential Development in
Bangalore
Opened Phoenix MarketCity,
Mumbai
Opened Phoenix MarketCity,
Bangalore
Commissioned Palladium
Hotel, Mumbai
1999 2002 Q1 20151905 Q1 2014Q4 2012 Q1 2013Q4 2011Q2 20112007 20091986 Q1 2012 Q3 20122001 Q3 2011
Successfully raised INR 13 bn
through a QIP and preferential
issue
Announced the development of
Market Cities in Mumbai, Pune,
Bangalore and Chennai
Built the first multi-
storied residential luxury
tower, Phoenix Towers
Opened a Luxury mall,
The Palladium, at
Mumbai
Opened High Street
Phoenix mall
Opened Phoenix
MarketCity, Chennai
Launched Chennai Residential,
Development, The Crest
Launched Phoenix Paragon Plaza,
Mumbai Commercial Development
Launched Commercial
development Art Guild
House in Kurla, Mumbai
Big Bazaar Started
Operations at High
Street Phoenix
Launched Fountainhead,
Residential development in
Pune
Launched One Bangalore
West, Residential
Development in Bangalore
Opened Phoenix House and
Phoenix Center with 350,000 sq.ft
of Office space
Note – Year denotes calendar year
Q3 2015
Successfully raised INR 2.83 bn
through a QIP in July 2015
Palladium hotel rebranded as
The St .Regis, Mumbai
Acquired controlling stake in
Gangetic Hotels, Agra
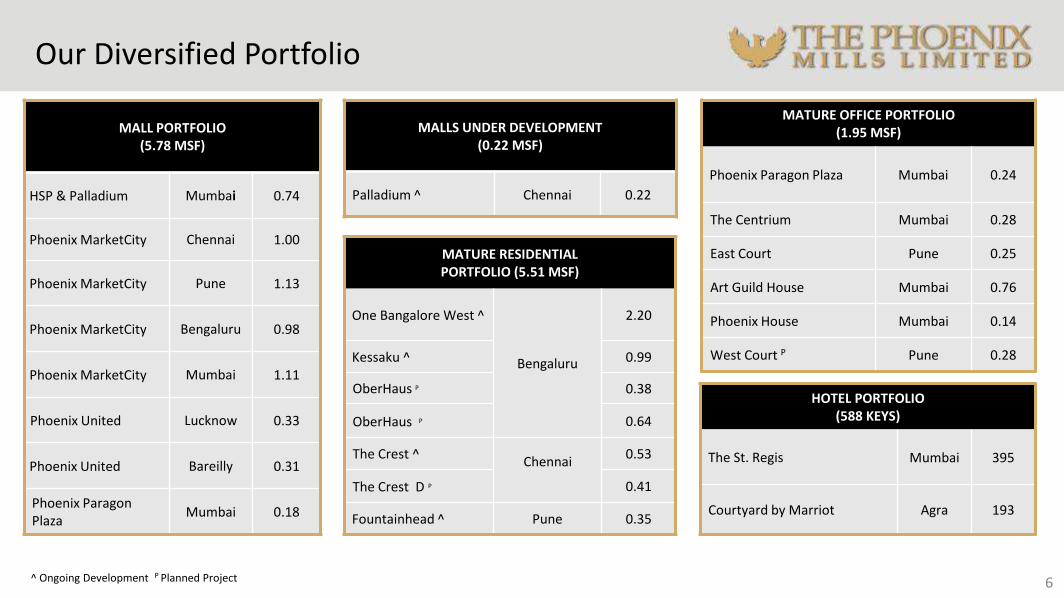
Our Diversified Portfolio
MALL PORTFOLIO (5.78 MSF)
HSP & Palladium Mumbai 0.74
Phoenix MarketCity Chennai 1.00
Phoenix MarketCity Pune 1.13
Phoenix MarketCity Bengaluru 0.98
Phoenix MarketCity Mumbai 1.11
Phoenix United Lucknow 0.33
Phoenix United Bareilly 0.31
Phoenix Paragon Plaza
Mumbai 0.18
MALLS UNDER DEVELOPMENT (0.22 MSF)
Palladium ̂ Chennai 0.22
MATURE RESIDENTIAL PORTFOLIO (5.51 MSF)
One Bangalore West ^
Bengaluru
2.20
Kessaku ^ 0.99
OberHaus P 0.38
OberHaus P 0.64
The Crest ^Chennai
0.53
The Crest D P 0.41
Fountainhead ̂ Pune 0.35
MATURE OFFICE PORTFOLIO (1.95 MSF)
Phoenix Paragon Plaza Mumbai 0.24
The Centrium Mumbai 0.28
East Court Pune 0.25
Art Guild House Mumbai 0.76
Phoenix House Mumbai 0.14
West Court P Pune 0.28
HOTEL PORTFOLIO(588 KEYS)
The St. Regis Mumbai 395
Courtyard by Marriot Agra 193
^ Ongoing Development P Planned Project 6
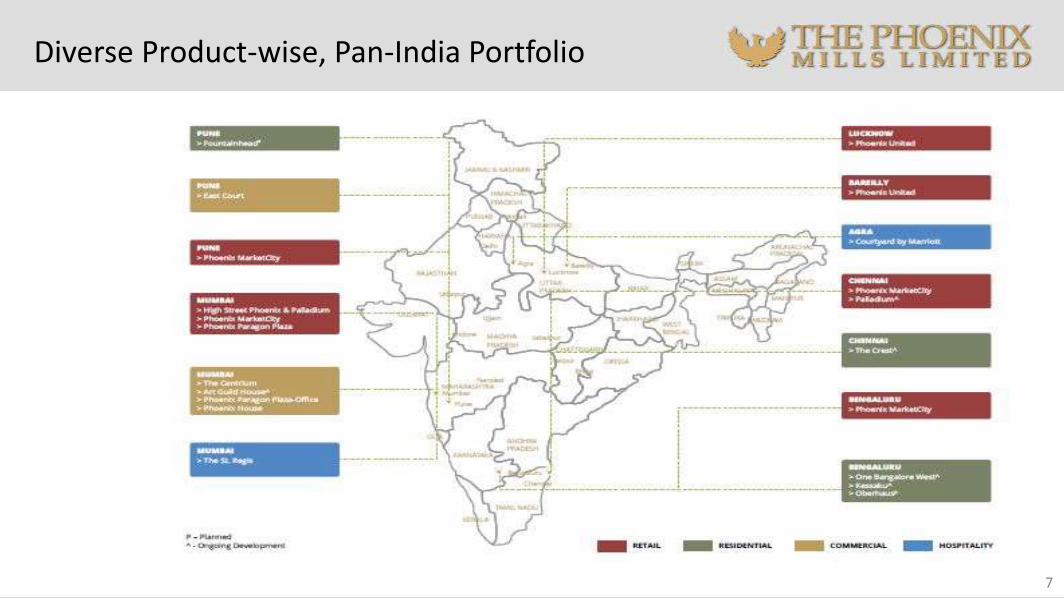
Diverse Product-wise, Pan-India Portfolio
7
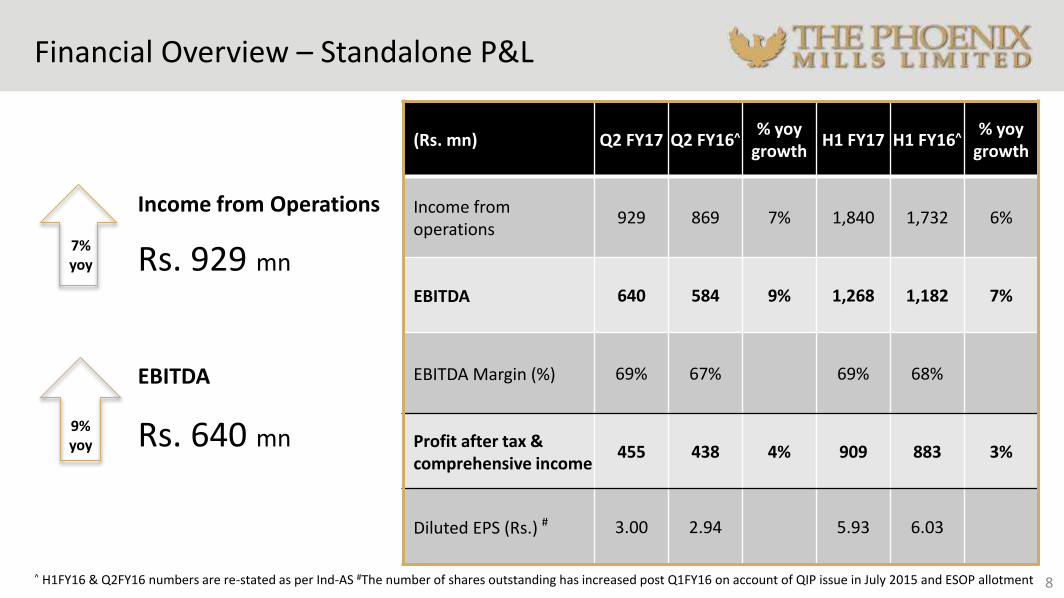
Financial Overview – Standalone P&L
(Rs. mn) Q2 FY17 Q2 FY16^% yoy
growthH1 FY17 H1 FY16^
% yoy growth
Income from operations
929 869 7% 1,840 1,732 6%
EBITDA 640 584 9% 1,268 1,182 7%
EBITDA Margin (%) 69% 67% 69% 68%
Profit after tax & comprehensive income
455 438 4% 909 883 3%
Diluted EPS (Rs.) # 3.00 2.94 5.93 6.03
8
Rs. 929 mn
EBITDA
Rs. 640 mn
7%yoy
9%yoy
Income from Operations
^ H1FY16 & Q2FY16 numbers are re-stated as per Ind-AS #The number of shares outstanding has increased post Q1FY16 on account of QIP issue in July 2015 and ESOP allotment
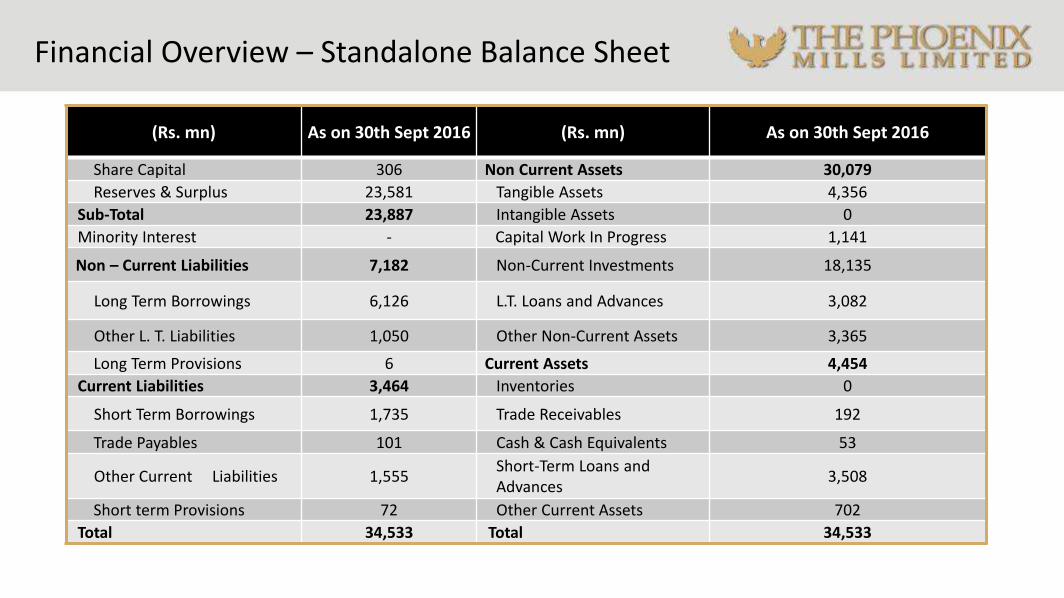
Financial Overview – Standalone Balance Sheet
(Rs. mn) As on 30th Sept 2016 (Rs. mn) As on 30th Sept 2016
Share Capital 306 Non Current Assets 30,079
Reserves & Surplus 23,581 Tangible Assets 4,356
Sub-Total 23,887 Intangible Assets 0
Minority Interest - Capital Work In Progress 1,141
Non – Current Liabilities 7,182 Non-Current Investments 18,135
Long Term Borrowings 6,126 L.T. Loans and Advances 3,082
Other L. T. Liabilities 1,050 Other Non-Current Assets 3,365
Long Term Provisions 6 Current Assets 4,454
Current Liabilities 3,464 Inventories 0
Short Term Borrowings 1,735 Trade Receivables 192
Trade Payables 101 Cash & Cash Equivalents 53
Other Current Liabilities 1,555Short-Term Loans and Advances
3,508
Short term Provisions 72 Other Current Assets 702
Total 34,533 Total 34,533
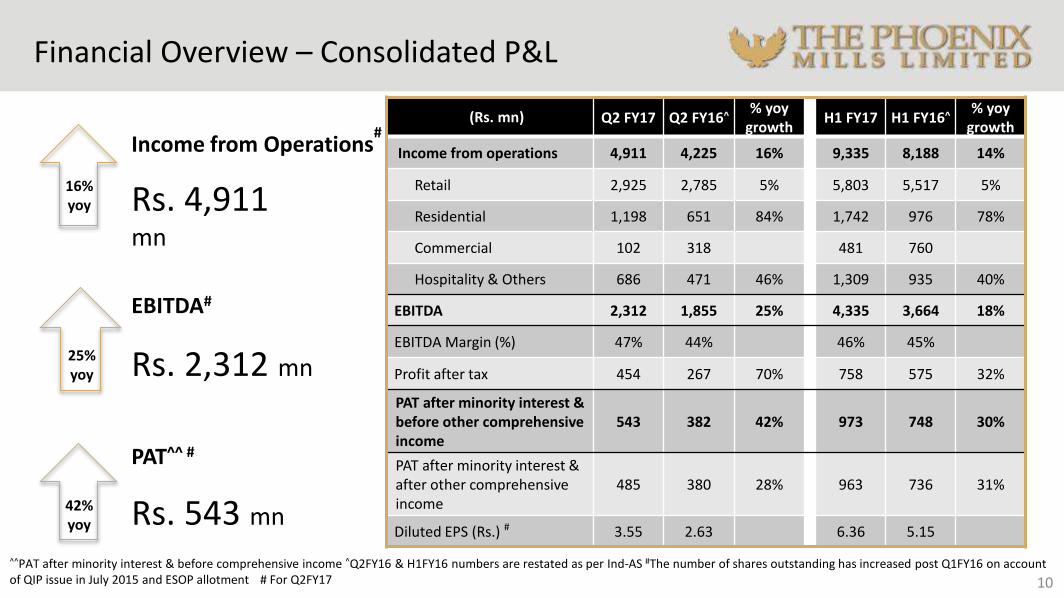
Financial Overview – Consolidated P&L
^^PAT after minority interest & before comprehensive income ^Q2FY16 & H1FY16 numbers are restated as per Ind-AS #The number of shares outstanding has increased post Q1FY16 on account of QIP issue in July 2015 and ESOP allotment # For Q2FY17 10
(Rs. mn) Q2 FY17 Q2 FY16^% yoy
growthH1 FY17 H1 FY16^
% yoygrowth
Income from operations 4,911 4,225 16% 9,335 8,188 14%
Retail 2,925 2,785 5% 5,803 5,517 5%
Residential 1,198 651 84% 1,742 976 78%
Commercial 102 318 481 760
Hospitality & Others 686 471 46% 1,309 935 40%
EBITDA 2,312 1,855 25% 4,335 3,664 18%
EBITDA Margin (%) 47% 44% 46% 45%
Profit after tax 454 267 70% 758 575 32%
PAT after minority interest & before other comprehensive income
543 382 42% 973 748 30%
PAT after minority interest & after other comprehensive income
485 380 28% 963 736 31%
Diluted EPS (Rs.) # 3.55 2.63 6.36 5.15
Income from Operations#
Rs. 4,911mn
EBITDA#
Rs. 2,312 mn
PAT^^ #
Rs. 543 mn
16%yoy
25%yoy
42%yoy
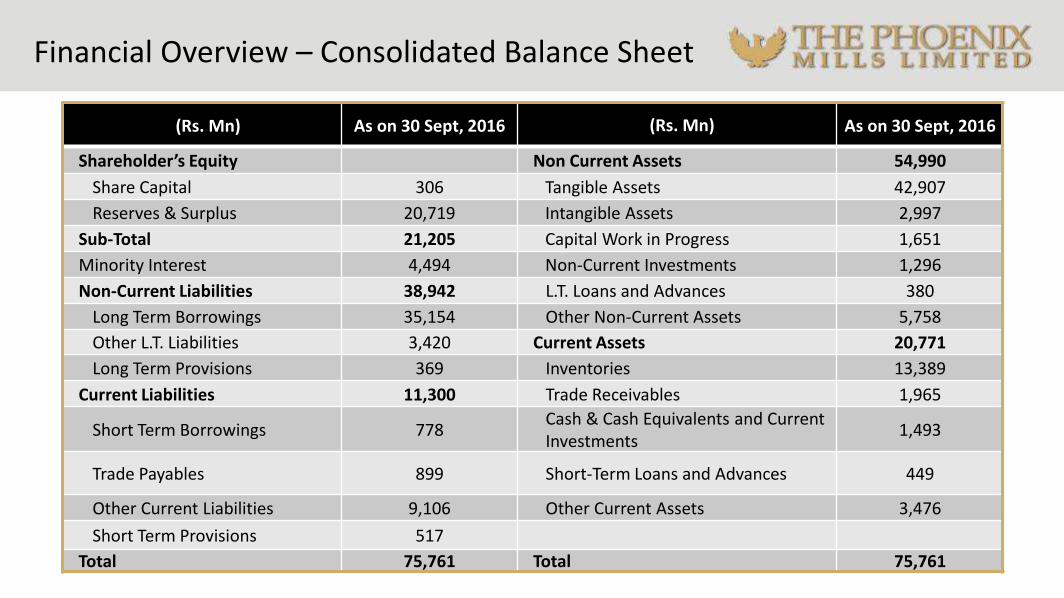
Financial Overview – Consolidated Balance Sheet
(Rs. Mn) As on 30 Sept, 2016 (Rs. Mn) As on 30 Sept, 2016
Shareholder’s Equity Non Current Assets 54,990
Share Capital 306 Tangible Assets 42,907
Reserves & Surplus 20,719 Intangible Assets 2,997
Sub-Total 21,205 Capital Work in Progress 1,651
Minority Interest 4,494 Non-Current Investments 1,296
Non-Current Liabilities 38,942 L.T. Loans and Advances 380
Long Term Borrowings 35,154 Other Non-Current Assets 5,758
Other L.T. Liabilities 3,420 Current Assets 20,771
Long Term Provisions 369 Inventories 13,389
Current Liabilities 11,300 Trade Receivables 1,965
Short Term Borrowings 778Cash & Cash Equivalents and Current Investments
1,493
Trade Payables 899 Short-Term Loans and Advances 449
Other Current Liabilities 9,106 Other Current Assets 3,476
Short Term Provisions 517
Total 75,761 Total 75,761
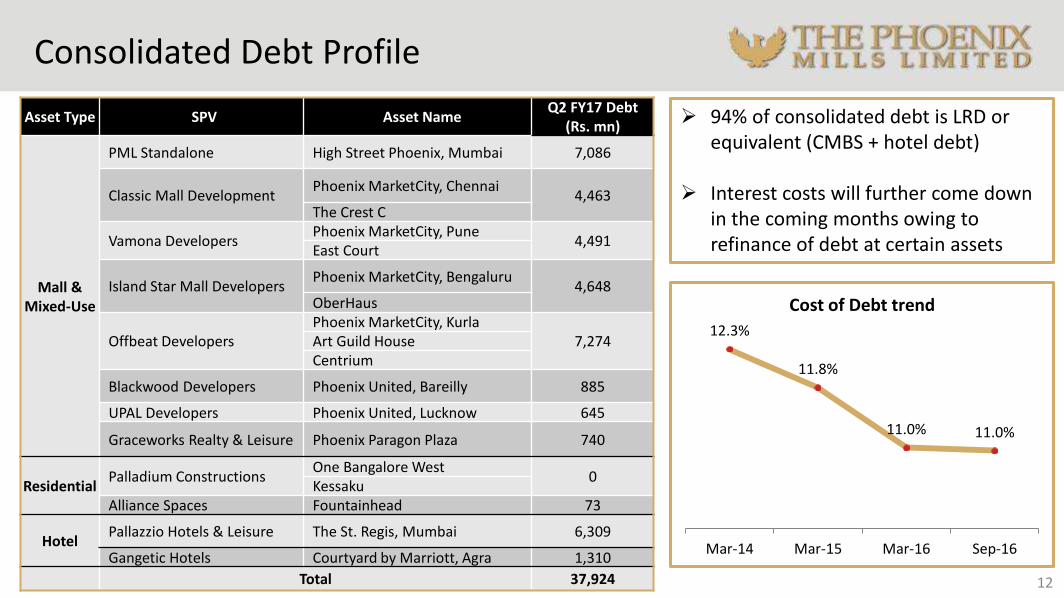
Consolidated Debt Profile
12
Asset Type SPV Asset Name Q2 FY17 Debt
(Rs. mn)
Mall & Mixed-Use
PML Standalone High Street Phoenix, Mumbai 7,086
Classic Mall DevelopmentPhoenix MarketCity, Chennai
4,463The Crest C
Vamona DevelopersPhoenix MarketCity, Pune
4,491East Court
Island Star Mall DevelopersPhoenix MarketCity, Bengaluru
4,648OberHaus
Offbeat DevelopersPhoenix MarketCity, Kurla
7,274Art Guild House Centrium
Blackwood Developers Phoenix United, Bareilly 885
UPAL Developers Phoenix United, Lucknow 645
Graceworks Realty & Leisure Phoenix Paragon Plaza 740
ResidentialPalladium Constructions
One Bangalore West 0
Kessaku Alliance Spaces Fountainhead 73
HotelPallazzio Hotels & Leisure The St. Regis, Mumbai 6,309
Gangetic Hotels Courtyard by Marriott, Agra 1,310
Total 37,924
94% of consolidated debt is LRD or equivalent (CMBS + hotel debt)
Interest costs will further come down in the coming months owing to refinance of debt at certain assets
12.3%
11.8%
11.0% 11.0%
Mar-14 Mar-15 Mar-16 Sep-16
Cost of Debt trend
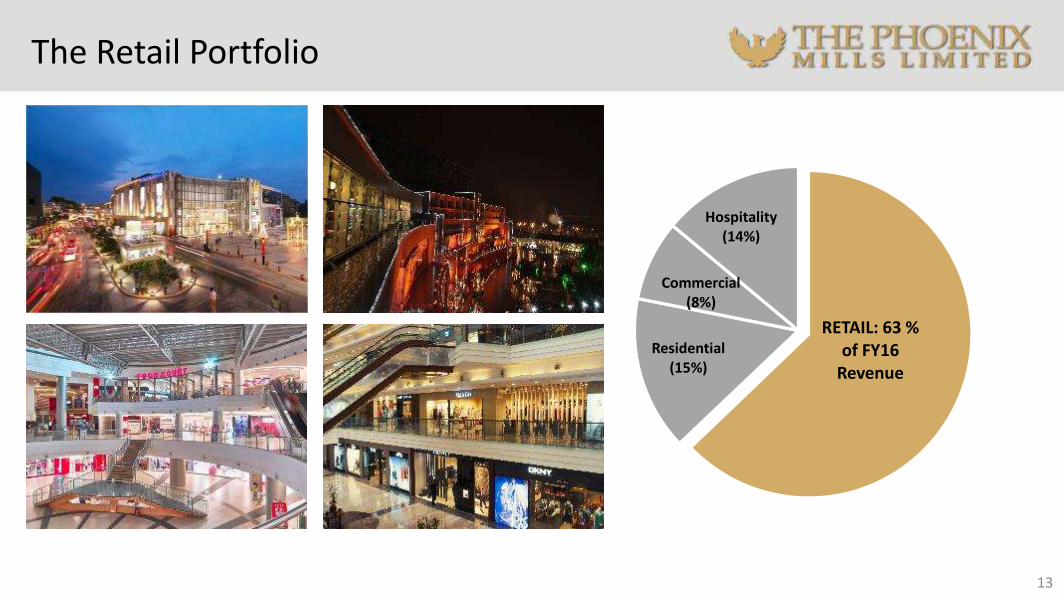
The Retail Portfolio
13
RETAIL: 63 % of FY16
Revenue
Residential (15%)
Commercial (8%)
Hospitality (14%)
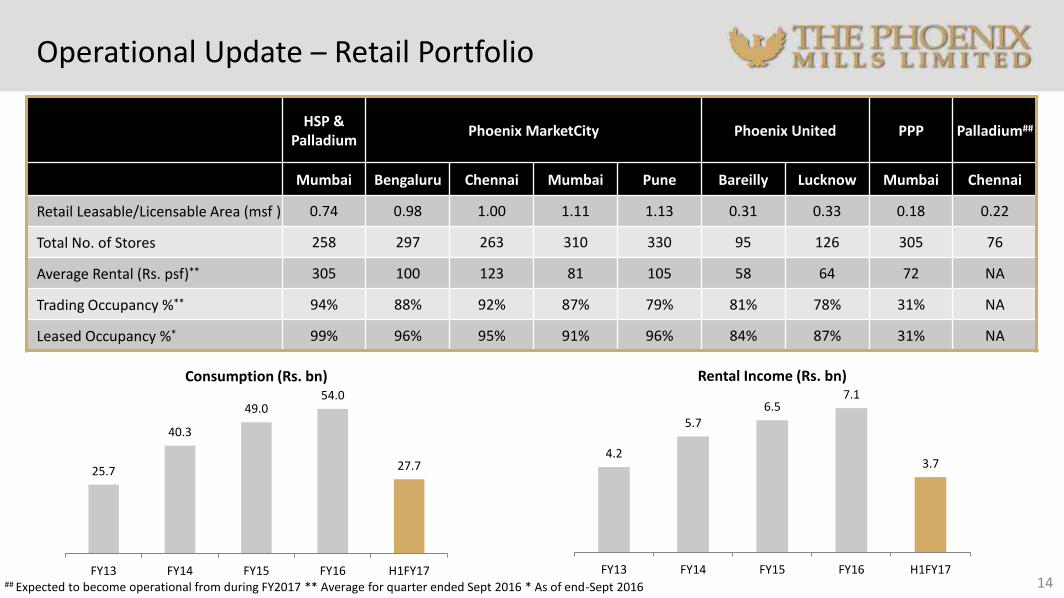
Operational Update – Retail Portfolio
## Expected to become operational from during FY2017 ** Average for quarter ended Sept 2016 * As of end-Sept 2016 14
HSP & Palladium
Phoenix MarketCity Phoenix United PPP Palladium##
Mumbai Bengaluru Chennai Mumbai Pune Bareilly Lucknow Mumbai Chennai
Retail Leasable/Licensable Area (msf ) 0.74 0.98 1.00 1.11 1.13 0.31 0.33 0.18 0.22
Total No. of Stores 258 297 263 310 330 95 126 305 76
Average Rental (Rs. psf)** 305 100 123 81 105 58 64 72 NA
Trading Occupancy %** 94% 88% 92% 87% 79% 81% 78% 31% NA
Leased Occupancy %* 99% 96% 95% 91% 96% 84% 87% 31% NA
25.7
40.3
49.054.0
27.7
FY13 FY14 FY15 FY16 H1FY17
Consumption (Rs. bn)
4.2
5.76.5
7.1
3.7
FY13 FY14 FY15 FY16 H1FY17
Rental Income (Rs. bn)
Q2 FY17 – Retail Key Highlights
15
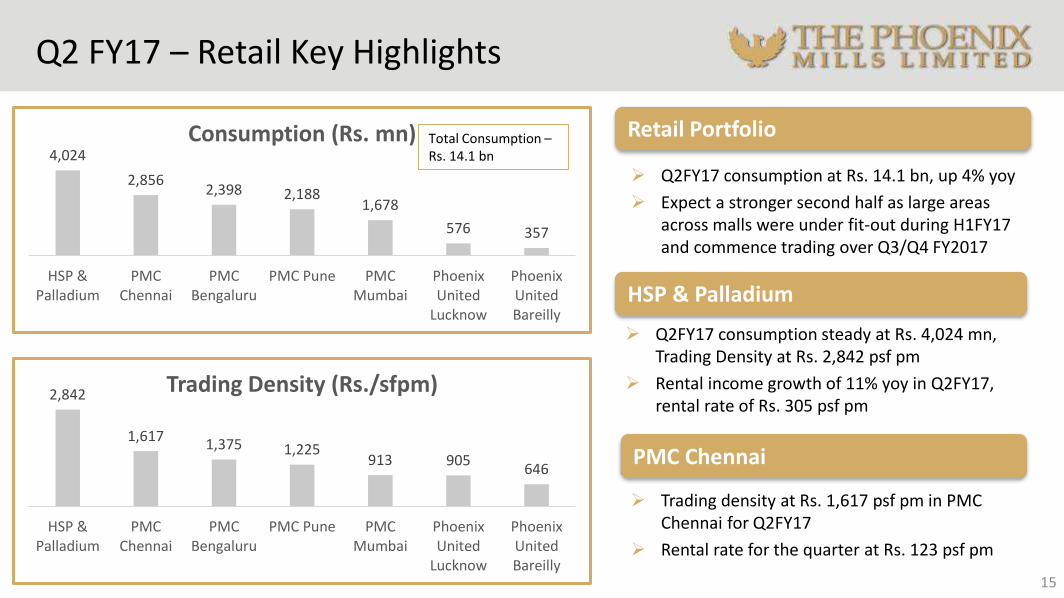
4,024
2,8562,398 2,188
1,678
576 357
HSP &Palladium
PMCChennai
PMCBengaluru
PMC Pune PMCMumbai
PhoenixUnited
Lucknow
PhoenixUnitedBareilly
Consumption (Rs. mn)
2,842
1,6171,375 1,225
913 905646
HSP &Palladium
PMCChennai
PMCBengaluru
PMC Pune PMCMumbai
PhoenixUnited
Lucknow
PhoenixUnitedBareilly
Trading Density (Rs./sfpm)
Q2FY17 consumption at Rs. 14.1 bn, up 4% yoy
Expect a stronger second half as large areas across malls were under fit-out during H1FY17 and commence trading over Q3/Q4 FY2017
Trading density at Rs. 1,617 psf pm in PMC Chennai for Q2FY17
Rental rate for the quarter at Rs. 123 psf pm
Retail Portfolio
PMC Chennai
Total Consumption –Rs. 14.1 bn
HSP & Palladium
Q2FY17 consumption steady at Rs. 4,024 mn, Trading Density at Rs. 2,842 psf pm
Rental income growth of 11% yoy in Q2FY17, rental rate of Rs. 305 psf pm
Q2 FY17 – Retail Key Highlights
16
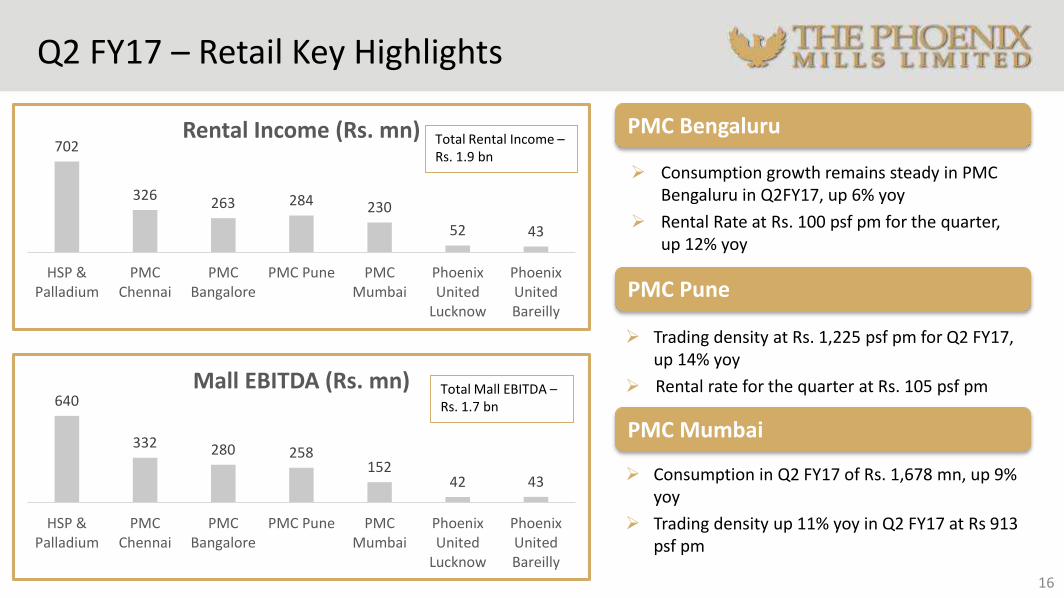
640
332 280 258152
42 43
HSP &Palladium
PMCChennai
PMCBangalore
PMC Pune PMCMumbai
PhoenixUnited
Lucknow
PhoenixUnitedBareilly
Mall EBITDA (Rs. mn) Total Mall EBITDA –Rs. 1.7 bn
702
326263 284 230
52 43
HSP &Palladium
PMCChennai
PMCBangalore
PMC Pune PMCMumbai
PhoenixUnited
Lucknow
PhoenixUnitedBareilly
Rental Income (Rs. mn) Total Rental Income –Rs. 1.9 bn
PMC Pune
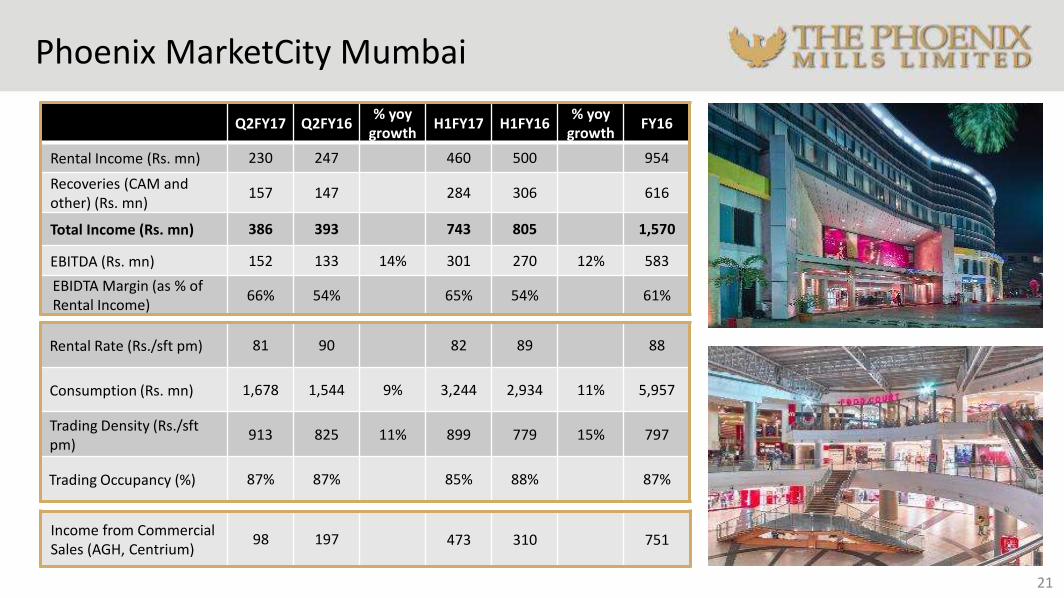
PMC Mumbai
Trading density at Rs. 1,225 psf pm for Q2 FY17,up 14% yoy
Rental rate for the quarter at Rs. 105 psf pm
Consumption in Q2 FY17 of Rs. 1,678 mn, up 9% yoy
Trading density up 11% yoy in Q2 FY17 at Rs 913 psf pm
PMC Bengaluru
Consumption growth remains steady in PMC Bengaluru in Q2FY17, up 6% yoy
Rental Rate at Rs. 100 psf pm for the quarter, up 12% yoy
High Street Phoenix & Palladium Mall
17
Q2FY17 Q2FY16 % yoy
growthH1FY17 H1FY16
% yoygrowth
FY16
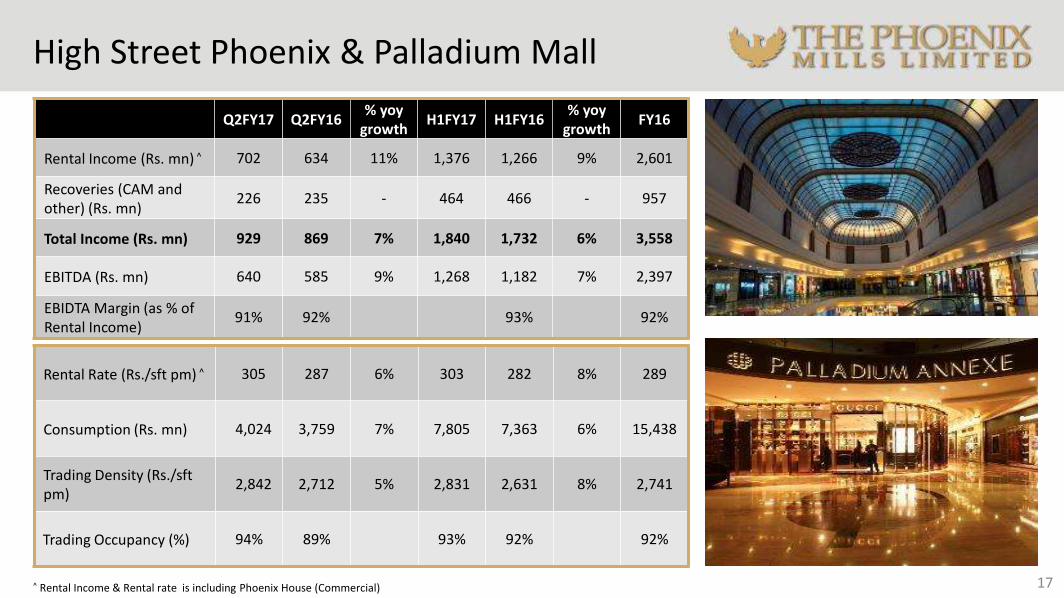
Rental Income (Rs. mn) ^ 702 634 11% 1,376 1,266 9% 2,601
Recoveries (CAM and other) (Rs. mn)
226 235 - 464 466 - 957
Total Income (Rs. mn) 929 869 7% 1,840 1,732 6% 3,558
EBITDA (Rs. mn) 640 585 9% 1,268 1,182 7% 2,397
EBIDTA Margin (as % of Rental Income)
91% 92% 93% 92%
Rental Rate (Rs./sft pm) ^ 305 287 6% 303 282 8% 289
Consumption (Rs. mn) 4,024 3,759 7% 7,805 7,363 6% 15,438
Trading Density (Rs./sft pm)
2,842 2,712 5% 2,831 2,631 8% 2,741
Trading Occupancy (%) 94% 89% 93% 92% 92%
^ Rental Income & Rental rate is including Phoenix House (Commercial)
Phoenix MarketCity Chennai
18
Q2FY17 Q2FY16 % yoy
growthH1FY17 H1FY16
% yoygrowth
FY16
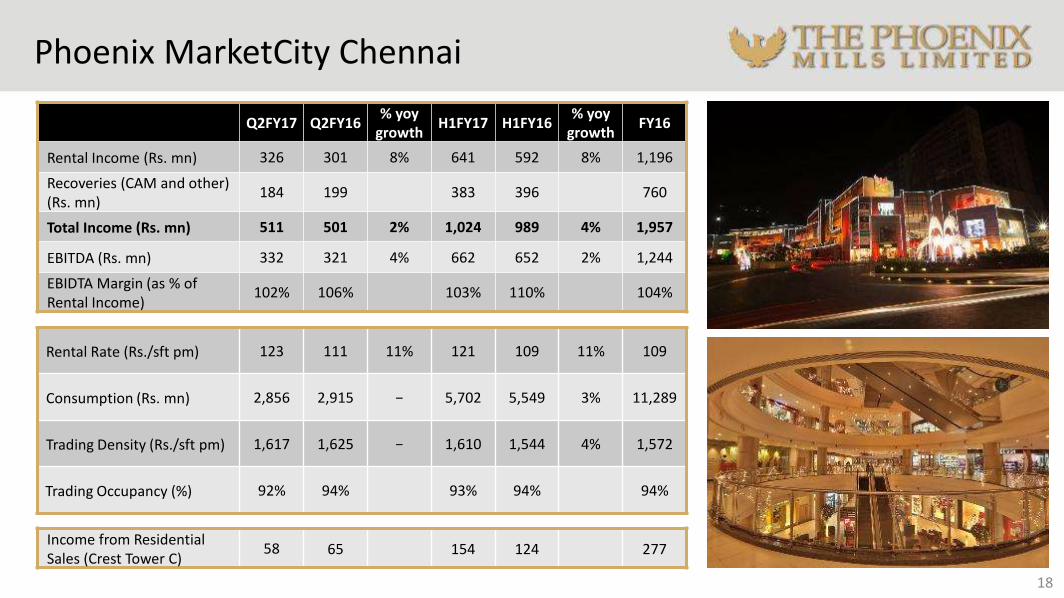
Rental Income (Rs. mn) 326 301 8% 641 592 8% 1,196
Recoveries (CAM and other) (Rs. mn)
184 199 383 396 760
Total Income (Rs. mn) 511 501 2% 1,024 989 4% 1,957
EBITDA (Rs. mn) 332 321 4% 662 652 2% 1,244
EBIDTA Margin (as % of Rental Income)
102% 106% 103% 110% 104%
Rental Rate (Rs./sft pm) 123 111 11% 121 109 11% 109
Consumption (Rs. mn) 2,856 2,915 − 5,702 5,549 3% 11,289
Trading Density (Rs./sft pm) 1,617 1,625 − 1,610 1,544 4% 1,572
Trading Occupancy (%) 92% 94% 93% 94% 94%
Income from Residential Sales (Crest Tower C)
58 65 154 124 277
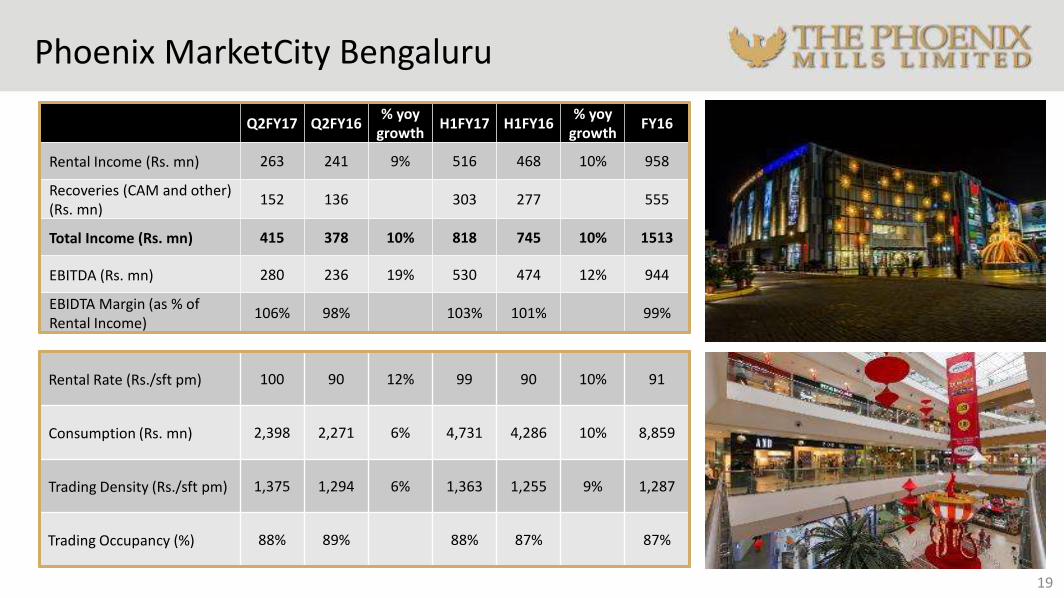
Phoenix MarketCity Bengaluru
19
Q2FY17 Q2FY16 % yoy
growthH1FY17 H1FY16
% yoygrowth
FY16
Rental Income (Rs. mn) 263 241 9% 516 468 10% 958
Recoveries (CAM and other) (Rs. mn)
152 136 303 277 555
Total Income (Rs. mn) 415 378 10% 818 745 10% 1513
EBITDA (Rs. mn) 280 236 19% 530 474 12% 944
EBIDTA Margin (as % of Rental Income)
106% 98% 103% 101% 99%
Rental Rate (Rs./sft pm) 100 90 12% 99 90 10% 91
Consumption (Rs. mn) 2,398 2,271 6% 4,731 4,286 10% 8,859
Trading Density (Rs./sft pm) 1,375 1,294 6% 1,363 1,255 9% 1,287
Trading Occupancy (%) 88% 89% 88% 87% 87%
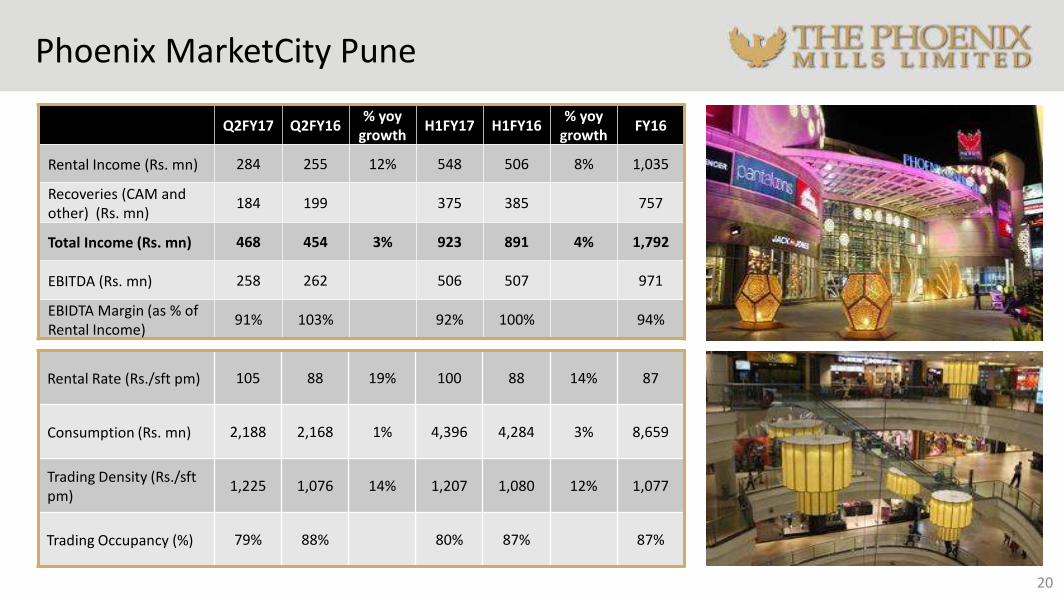
Phoenix MarketCity Pune
20
Q2FY17 Q2FY16 % yoy
growthH1FY17 H1FY16
% yoy growth
FY16
Rental Income (Rs. mn) 284 255 12% 548 506 8% 1,035
Recoveries (CAM and other) (Rs. mn)
184 199 375 385 757
Total Income (Rs. mn) 468 454 3% 923 891 4% 1,792
EBITDA (Rs. mn) 258 262 506 507 971
EBIDTA Margin (as % of Rental Income)
91% 103% 92% 100% 94%
Rental Rate (Rs./sft pm) 105 88 19% 100 88 14% 87
Consumption (Rs. mn) 2,188 2,168 1% 4,396 4,284 3% 8,659
Trading Density (Rs./sft pm)
1,225 1,076 14% 1,207 1,080 12% 1,077
Trading Occupancy (%) 79% 88% 80% 87% 87%
21
Q2FY17 Q2FY16 % yoy
growthH1FY17 H1FY16
% yoy growth
FY16
Rental Income (Rs. mn) 230 247 460 500 954
Recoveries (CAM and other) (Rs. mn)
157 147 284 306 616
Total Income (Rs. mn) 386 393 743 805 1,570
EBITDA (Rs. mn) 152 133 14% 301 270 12% 583
EBIDTA Margin (as % of Rental Income)
66% 54% 65% 54% 61%
Rental Rate (Rs./sft pm) 81 90 82 89 88
Consumption (Rs. mn) 1,678 1,544 9% 3,244 2,934 11% 5,957
Trading Density (Rs./sft pm)
913 825 11% 899 779 15% 797
Trading Occupancy (%) 87% 87% 85% 88% 87%
Income from Commercial Sales (AGH, Centrium)
98 197 473 310 751
Phoenix MarketCity Mumbai
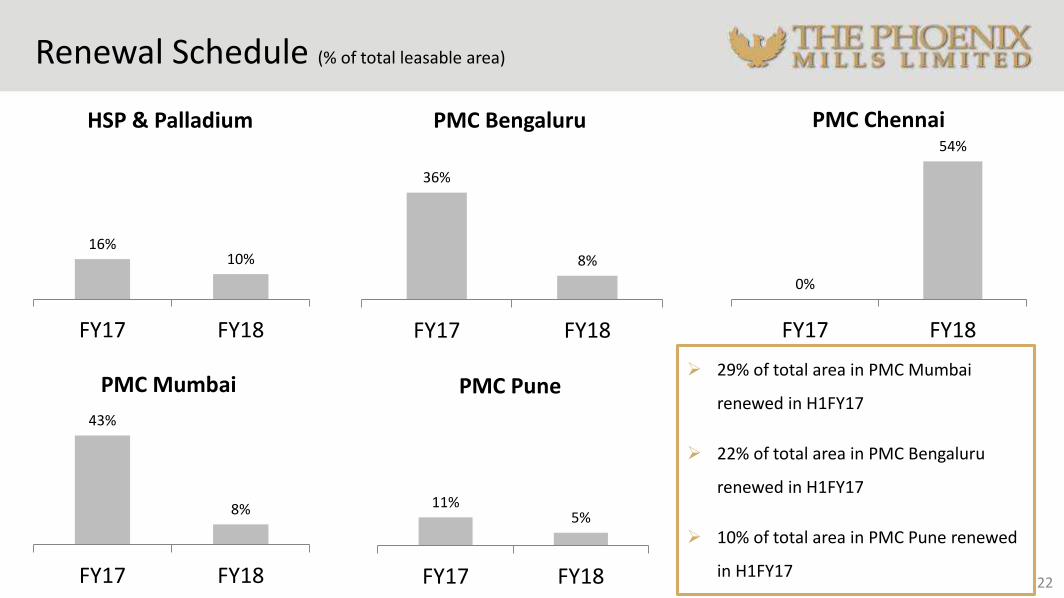
Renewal Schedule (% of total leasable area)
22
36%
8%
FY17 FY18
PMC Bengaluru
43%
8%
FY17 FY18
PMC Mumbai
16%10%
FY17 FY18
HSP & Palladium
11%5%
FY17 FY18
PMC Pune
0%
54%
FY17 FY18
PMC Chennai
29% of total area in PMC Mumbai
renewed in H1FY17
22% of total area in PMC Bengaluru
renewed in H1FY17
10% of total area in PMC Pune renewed
in H1FY17
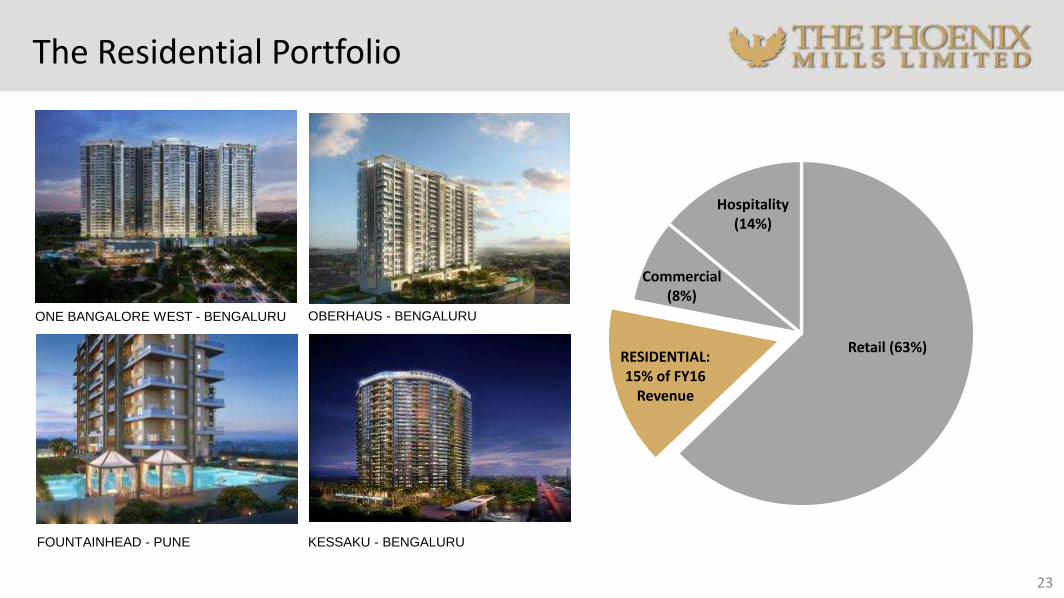
Retail (63%)RESIDENTIAL: 15% of FY16
Revenue
Commercial (8%)
Hospitality (14%)
The Residential Portfolio
ONE BANGALORE WEST - BENGALURU
FOUNTAINHEAD - PUNE KESSAKU - BENGALURU
23
OBERHAUS - BENGALURU
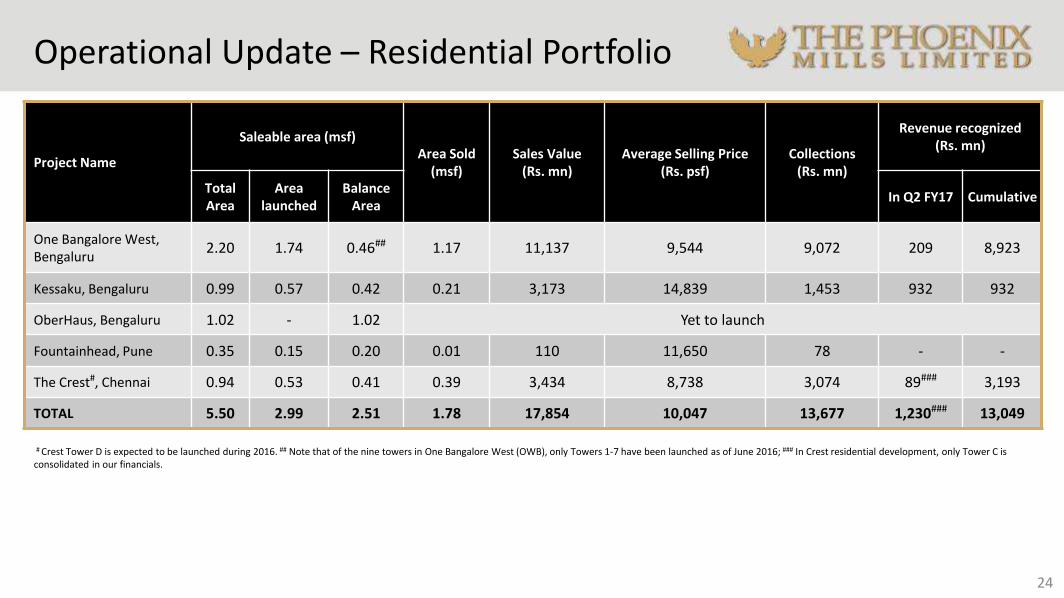
Operational Update – Residential Portfolio
# Crest Tower D is expected to be launched during 2016. ## Note that of the nine towers in One Bangalore West (OWB), only Towers 1-7 have been launched as of June 2016; ### In Crest residential development, only Tower C is consolidated in our financials.
24
Project Name
Saleable area (msf)Area Sold
(msf) Sales Value
(Rs. mn) Average Selling Price
(Rs. psf)Collections
(Rs. mn)
Revenue recognized (Rs. mn)
Total Area
Area launched
Balance Area
In Q2 FY17 Cumulative
One Bangalore West, Bengaluru
2.20 1.74 0.46## 1.17 11,137 9,544 9,072 209 8,923
Kessaku, Bengaluru 0.99 0.57 0.42 0.21 3,173 14,839 1,453 932 932
OberHaus, Bengaluru 1.02 - 1.02 Yet to launch
Fountainhead, Pune 0.35 0.15 0.20 0.01 110 11,650 78 - -
The Crest#, Chennai 0.94 0.53 0.41 0.39 3,434 8,738 3,074 89### 3,193
TOTAL 5.50 2.99 2.51 1.78 17,854 10,047 13,677 1,230### 13,049
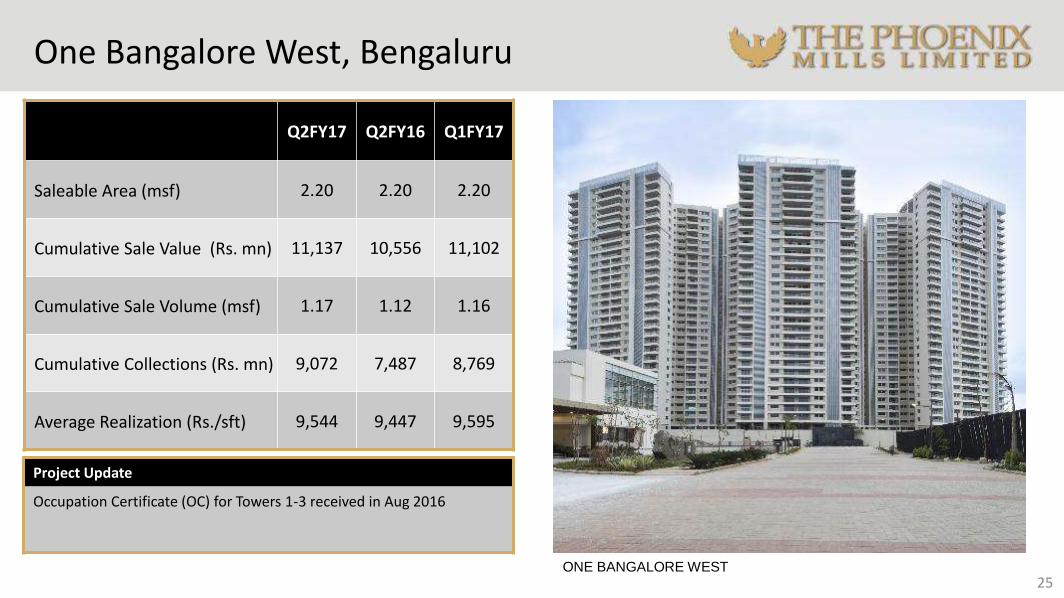
One Bangalore West, Bengaluru
25
Q2FY17 Q2FY16 Q1FY17
Saleable Area (msf) 2.20 2.20 2.20
Cumulative Sale Value (Rs. mn) 11,137 10,556 11,102
Cumulative Sale Volume (msf) 1.17 1.12 1.16
Cumulative Collections (Rs. mn) 9,072 7,487 8,769
Average Realization (Rs./sft) 9,544 9,447 9,595
ONE BANGALORE WEST
Project Update
Occupation Certificate (OC) for Towers 1-3 received in Aug 2016
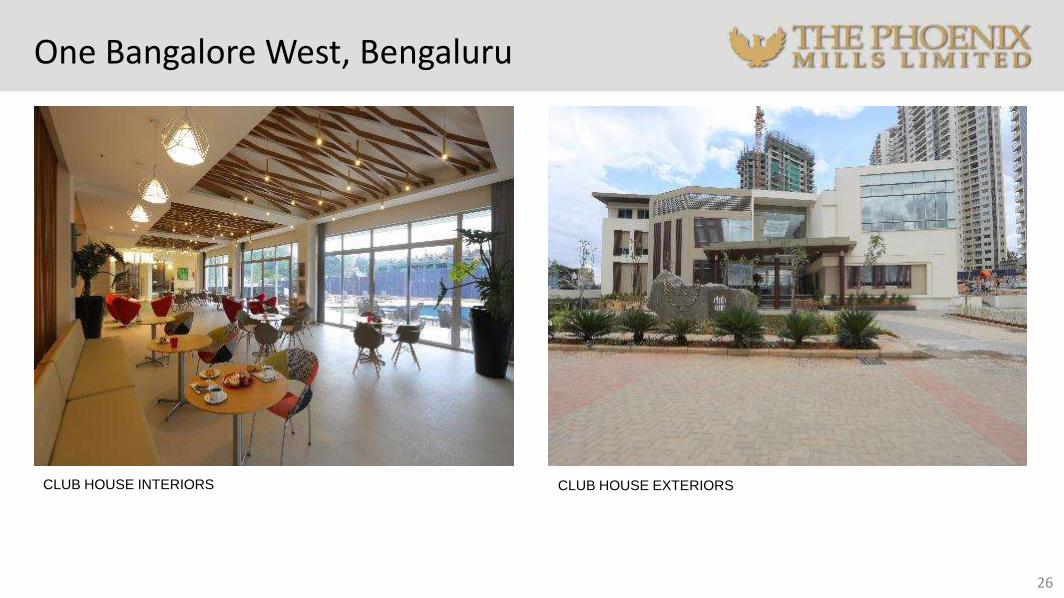
One Bangalore West, Bengaluru
26
CLUB HOUSE INTERIORS CLUB HOUSE EXTERIORS
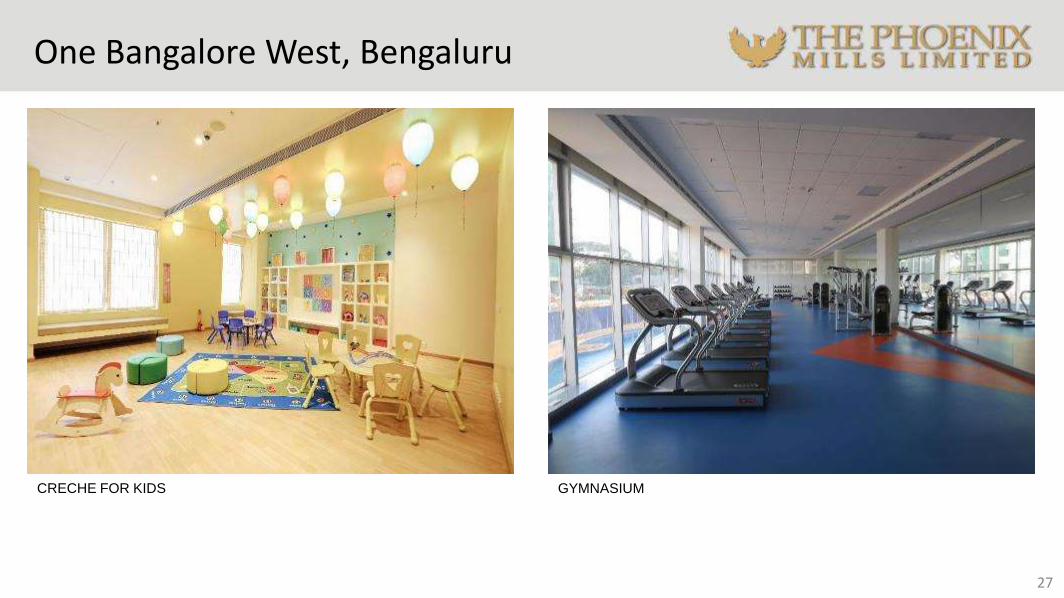
One Bangalore West, Bengaluru
27
CRECHE FOR KIDS GYMNASIUM
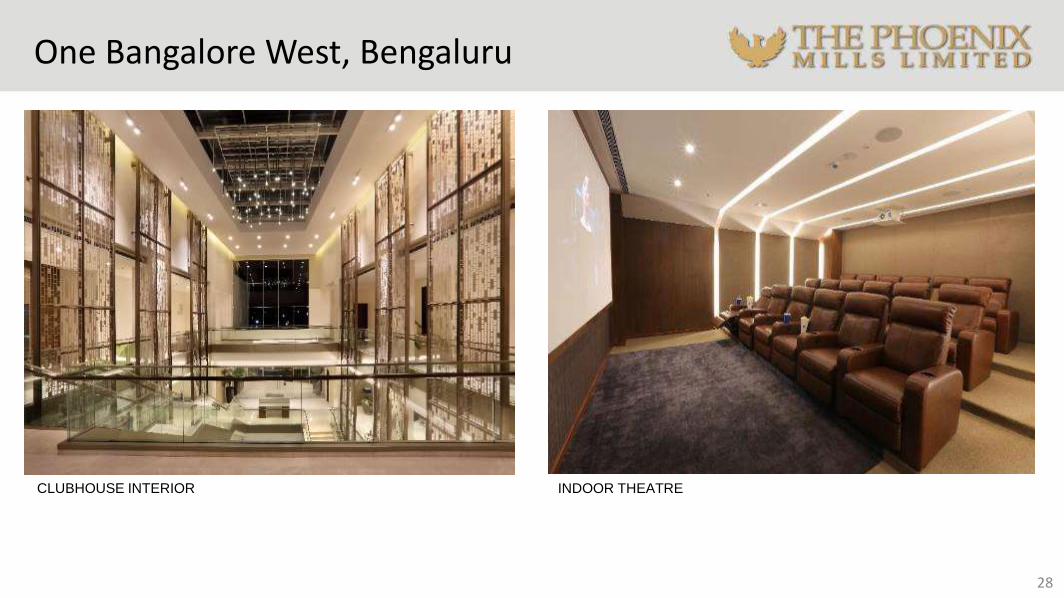
One Bangalore West, Bengaluru
28
CLUBHOUSE INTERIOR INDOOR THEATRE
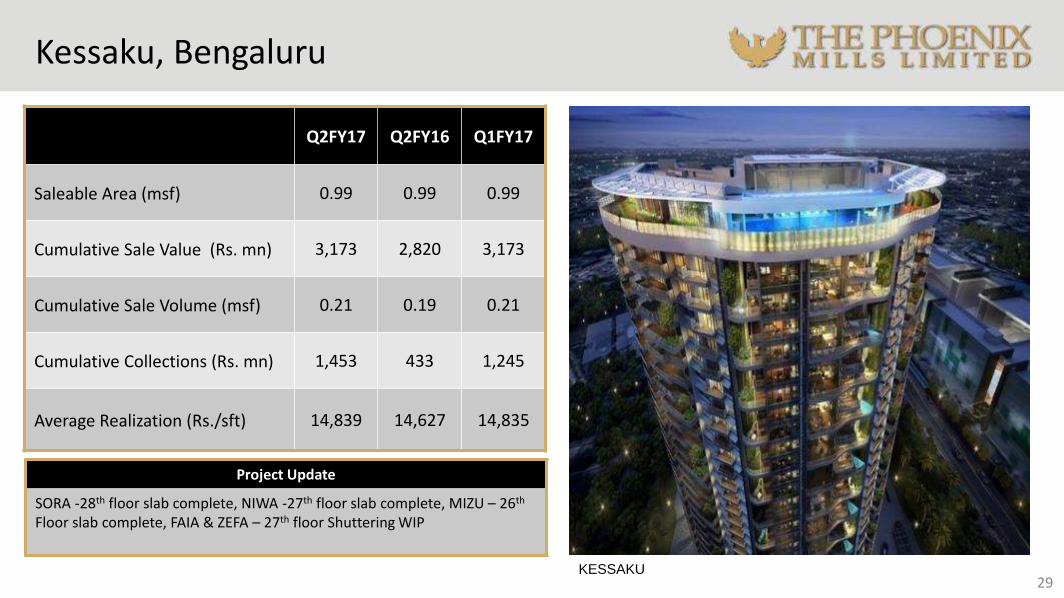
Kessaku, Bengaluru
29KESSAKU
Q2FY17 Q2FY16 Q1FY17
Saleable Area (msf) 0.99 0.99 0.99
Cumulative Sale Value (Rs. mn) 3,173 2,820 3,173
Cumulative Sale Volume (msf) 0.21 0.19 0.21
Cumulative Collections (Rs. mn) 1,453 433 1,245
Average Realization (Rs./sft) 14,839 14,627 14,835
SORA -18th floor slab complete, NIWA -17th floor shuttering WIP, MIZU – 15th
Floor concreting done, FAIA & ZEFA – 16th floor Shuttering WIP
Project Update
SORA -28th floor slab complete, NIWA -27th floor slab complete, MIZU – 26th
Floor slab complete, FAIA & ZEFA – 27th floor Shuttering WIP
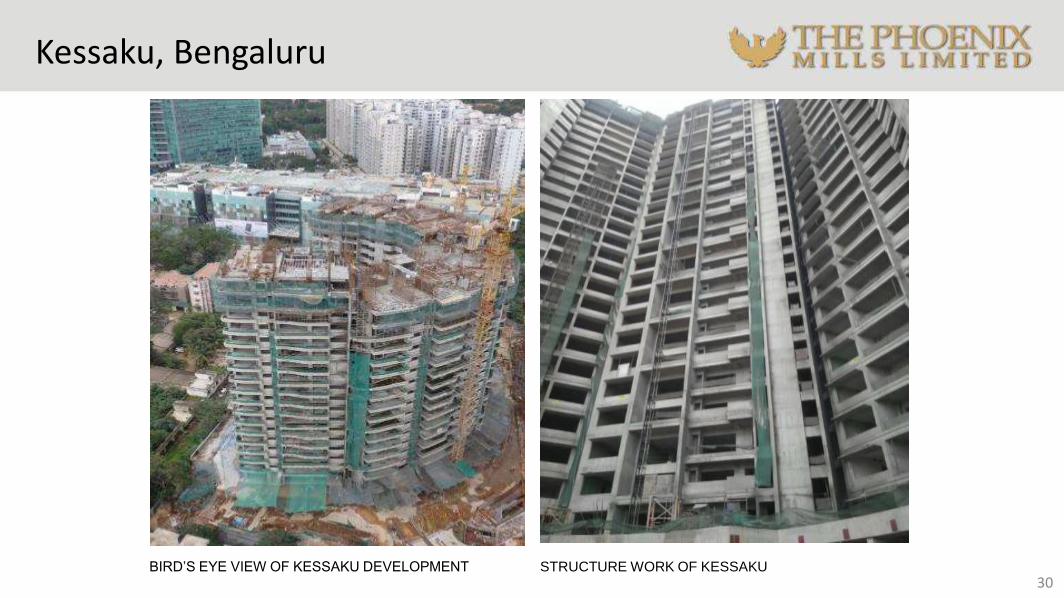
Kessaku, Bengaluru
30BIRD’S EYE VIEW OF KESSAKU DEVELOPMENT STRUCTURE WORK OF KESSAKU
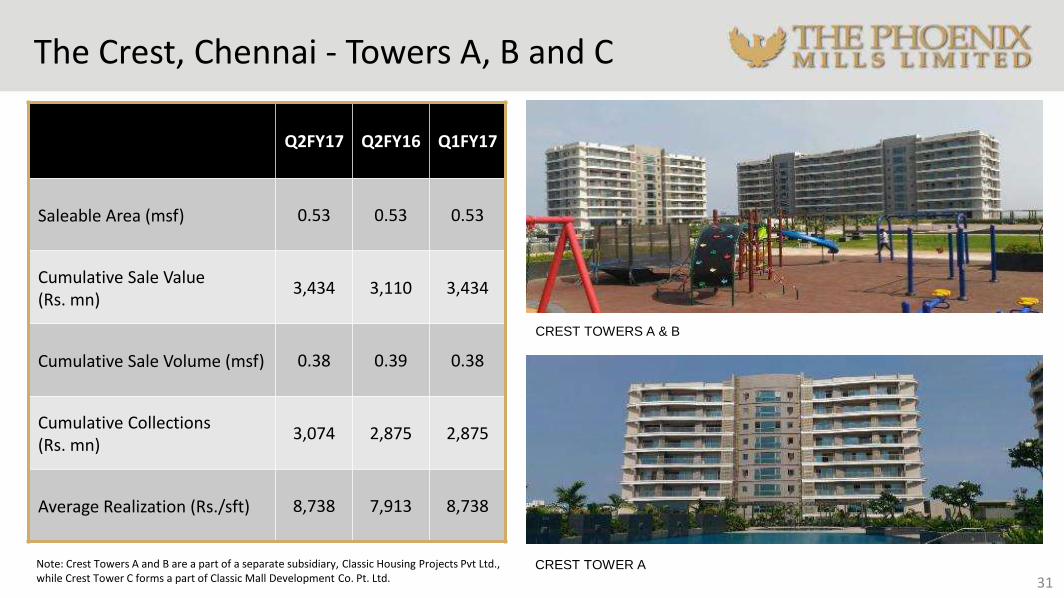
The Crest, Chennai - Towers A, B and C
Note: Crest Towers A and B are a part of a separate subsidiary, Classic Housing Projects Pvt Ltd., while Crest Tower C forms a part of Classic Mall Development Co. Pt. Ltd.
CREST TOWERS A & B
CREST TOWER A
31
Q2FY17 Q2FY16 Q1FY17
Saleable Area (msf) 0.53 0.53 0.53
Cumulative Sale Value (Rs. mn)
3,434 3,110 3,434
Cumulative Sale Volume (msf) 0.38 0.39 0.38
Cumulative Collections (Rs. mn)
3,074 2,875 2,875
Average Realization (Rs./sft) 8,738 7,913 8,738
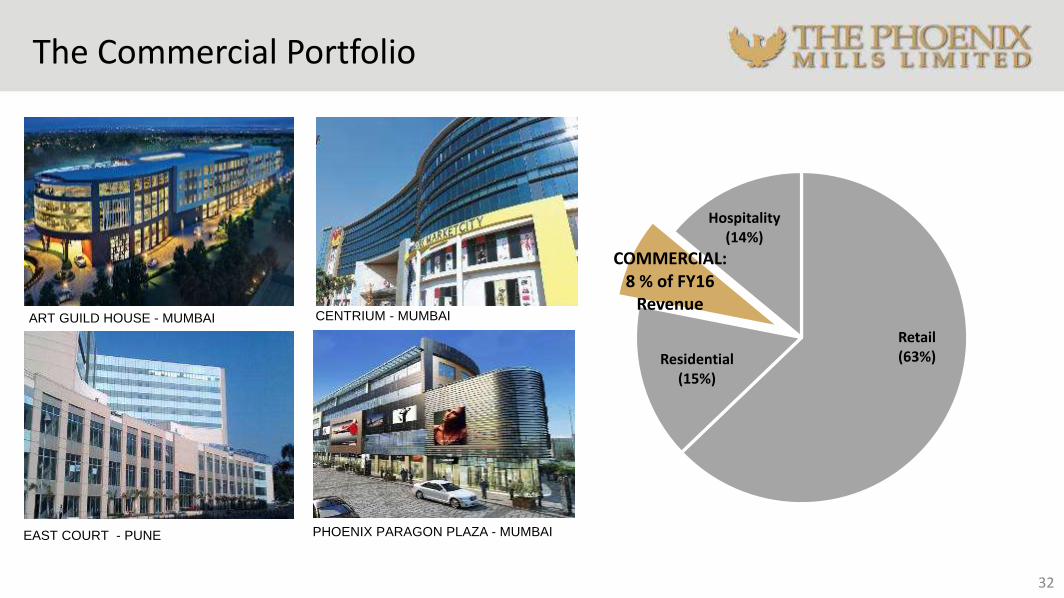
The Commercial Portfolio
ART GUILD HOUSE - MUMBAI
EAST COURT - PUNE
CENTRIUM - MUMBAI
PHOENIX PARAGON PLAZA - MUMBAI
32
Retail (63%)Residential
(15%)
COMMERCIAL: 8 % of FY16
Revenue
Hospitality (14%)
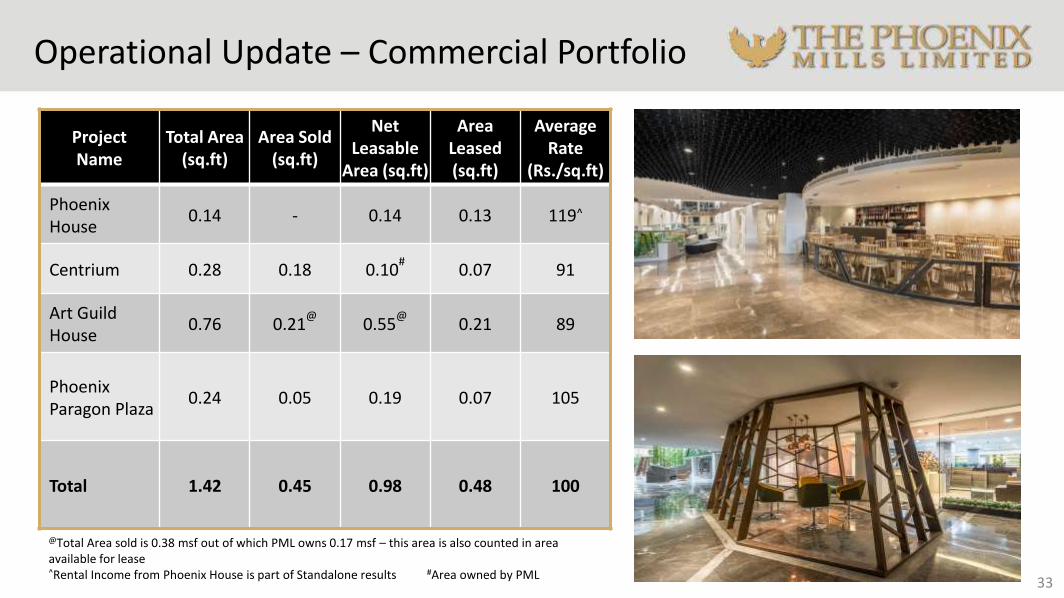
Operational Update – Commercial Portfolio
33
Project Name
Total Area (sq.ft)
Area Sold (sq.ft)
Net Leasable
Area (sq.ft)
Area Leased (sq.ft)
Average Rate
(Rs./sq.ft)
Phoenix House
0.14 - 0.14 0.13 119^
Centrium 0.28 0.18 0.10#
0.07 91
Art Guild House
0.76 0.21@
0.55@
0.21 89
Phoenix Paragon Plaza
0.24 0.05 0.19 0.07 105
Total 1.42 0.45 0.98 0.48 100
@Total Area sold is 0.38 msf out of which PML owns 0.17 msf – this area is also counted in area available for lease^Rental Income from Phoenix House is part of Standalone results #Area owned by PML
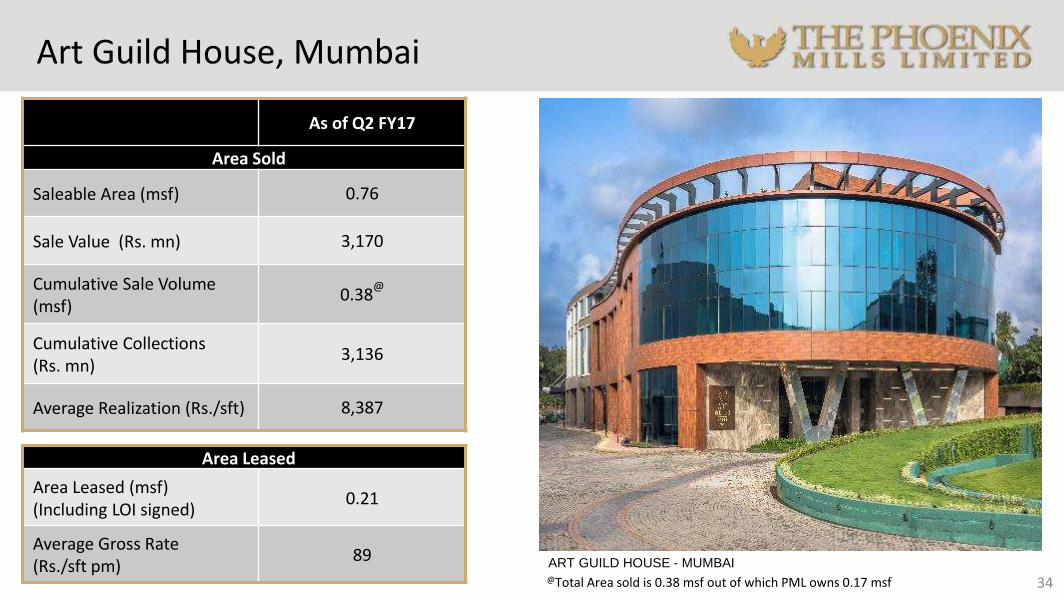
Art Guild House, Mumbai
ART GUILD HOUSE - MUMBAI
34
As of Q2 FY17
Area Sold
Saleable Area (msf) 0.76
Sale Value (Rs. mn) 3,170
Cumulative Sale Volume (msf)
0.38@
Cumulative Collections (Rs. mn)
3,136
Average Realization (Rs./sft) 8,387
Area Leased
Area Leased (msf) (Including LOI signed)
0.21
Average Gross Rate (Rs./sft pm)
89@Total Area sold is 0.38 msf out of which PML owns 0.17 msf
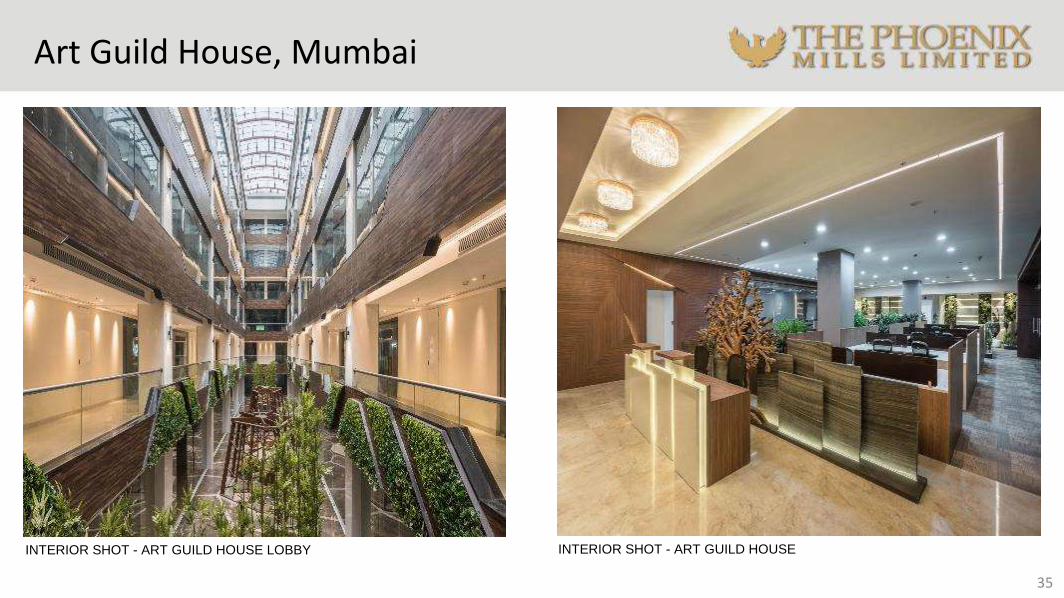
Art Guild House, Mumbai
INTERIOR SHOT - ART GUILD HOUSE LOBBY
35
INTERIOR SHOT - ART GUILD HOUSE
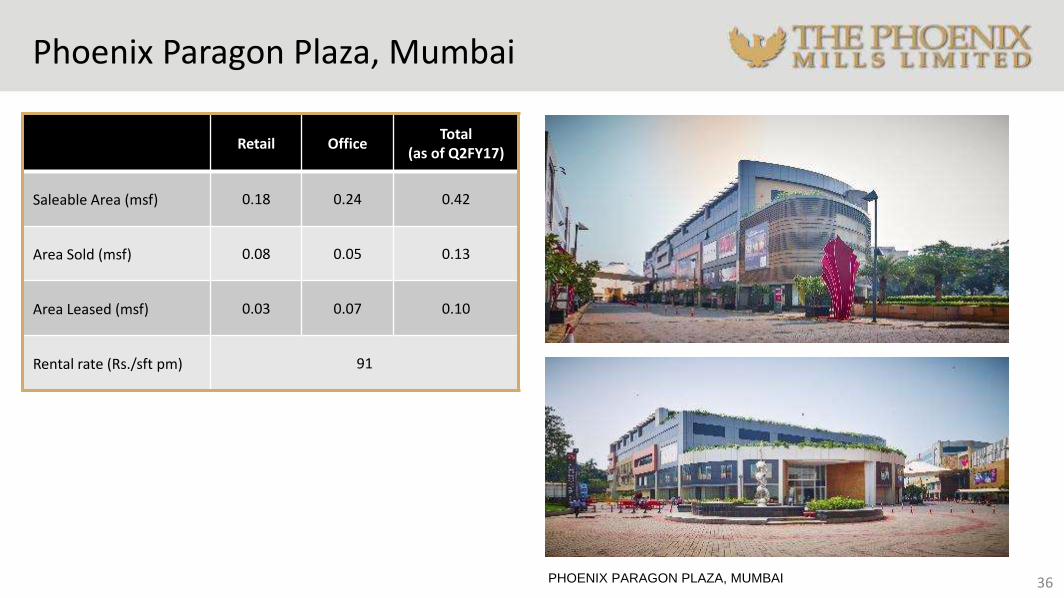
Phoenix Paragon Plaza, Mumbai
PHOENIX PARAGON PLAZA, MUMBAI 36
Retail OfficeTotal
(as of Q2FY17)
Saleable Area (msf) 0.18 0.24 0.42
Area Sold (msf) 0.08 0.05 0.13
Area Leased (msf) 0.03 0.07 0.10
Rental rate (Rs./sft pm) 91
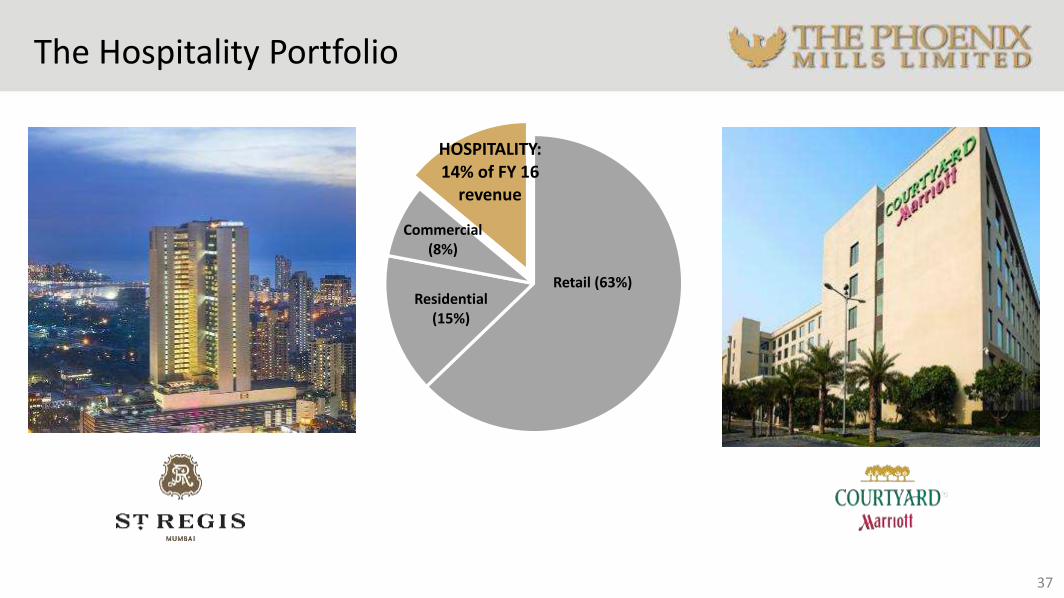
The Hospitality Portfolio
37
Retail (63%)Residential
(15%)
Commercial (8%)
HOSPITALITY: 14% of FY 16
revenue
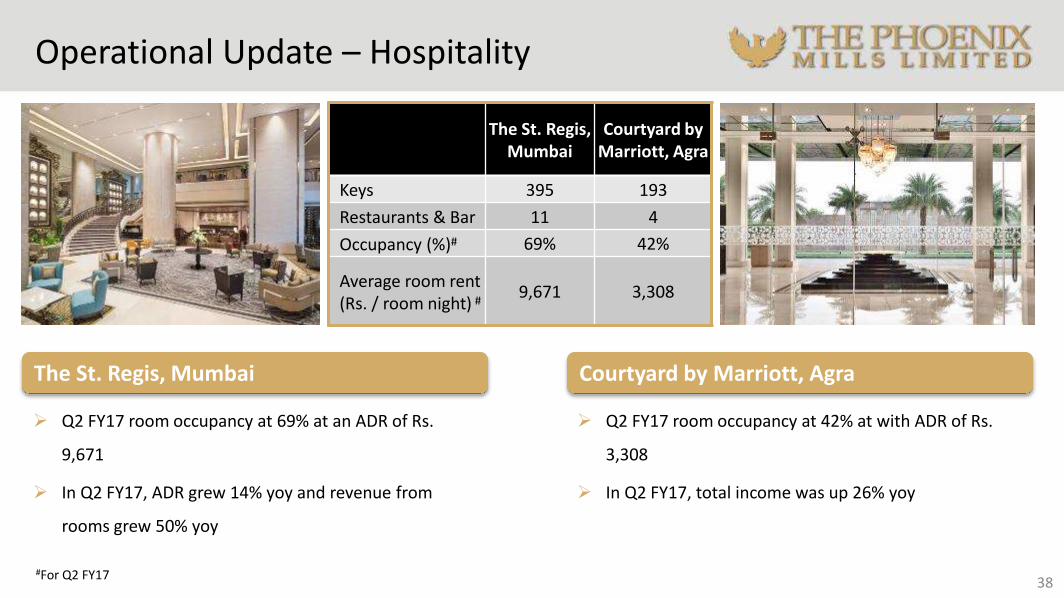
Operational Update – Hospitality
#For Q2 FY1738
The St. Regis, Mumbai
Courtyard by Marriott, Agra
Keys 395 193
Restaurants & Bar 11 4
Occupancy (%)# 69% 42%
Average room rent (Rs. / room night) #
9,671 3,308
The St. Regis, Mumbai
Q2 FY17 room occupancy at 69% at an ADR of Rs.
9,671
In Q2 FY17, ADR grew 14% yoy and revenue from
rooms grew 50% yoy
Courtyard by Marriott, Agra
Q2 FY17 room occupancy at 42% at with ADR of Rs.
3,308
In Q2 FY17, total income was up 26% yoy
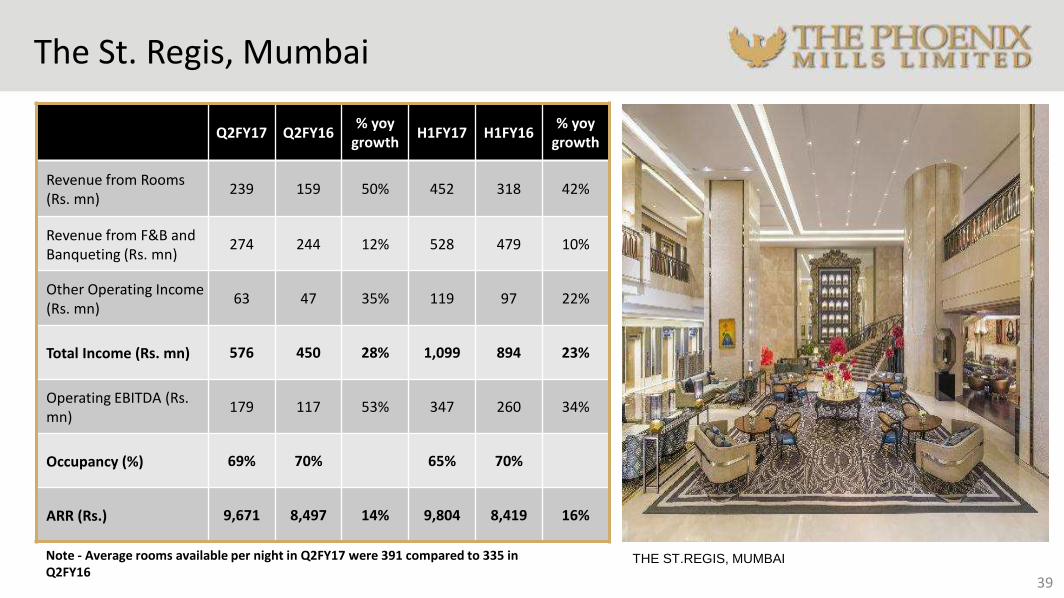
The St. Regis, Mumbai
39
THE ST.REGIS, MUMBAI
Q2FY17 Q2FY16 % yoy
growthH1FY17 H1FY16
% yoy growth
Revenue from Rooms (Rs. mn)
239 159 50% 452 318 42%
Revenue from F&B and Banqueting (Rs. mn)
274 244 12% 528 479 10%
Other Operating Income (Rs. mn)
63 47 35% 119 97 22%
Total Income (Rs. mn) 576 450 28% 1,099 894 23%
Operating EBITDA (Rs. mn)
179 117 53% 347 260 34%
Occupancy (%) 69% 70% 65% 70%
ARR (Rs.) 9,671 8,497 14% 9,804 8,419 16%
Note - Average rooms available per night in Q2FY17 were 391 compared to 335 in Q2FY16
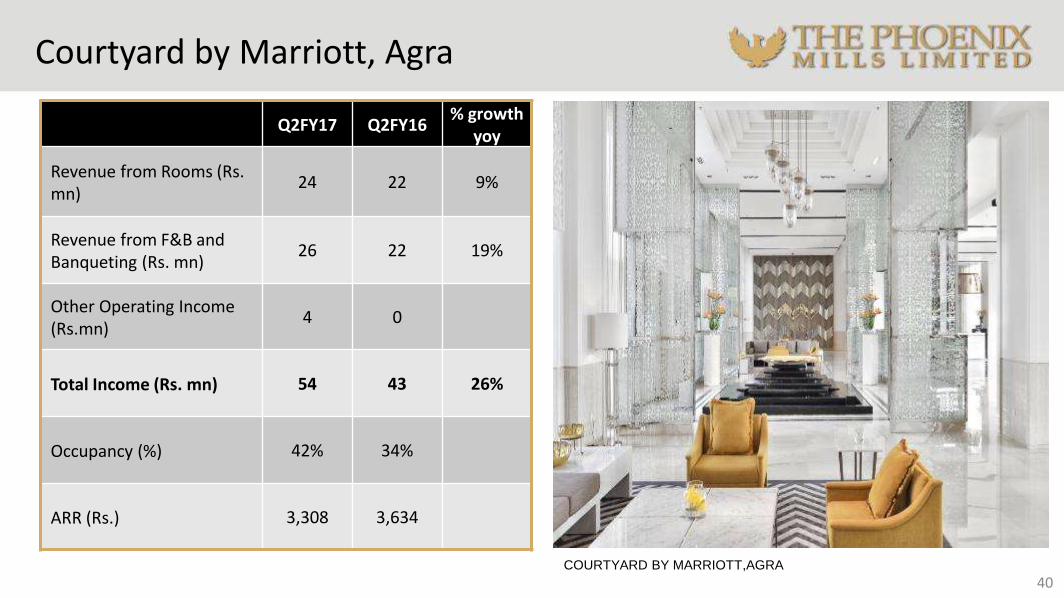
Courtyard by Marriott, Agra
40COURTYARD BY MARRIOTT,AGRA
Q2FY17 Q2FY16% growth
yoy
Revenue from Rooms (Rs. mn)
24 22 9%
Revenue from F&B and Banqueting (Rs. mn)
26 22 19%
Other Operating Income(Rs.mn)
4 0
Total Income (Rs. mn) 54 43 26%
Occupancy (%) 42% 34%
ARR (Rs.) 3,308 3,634
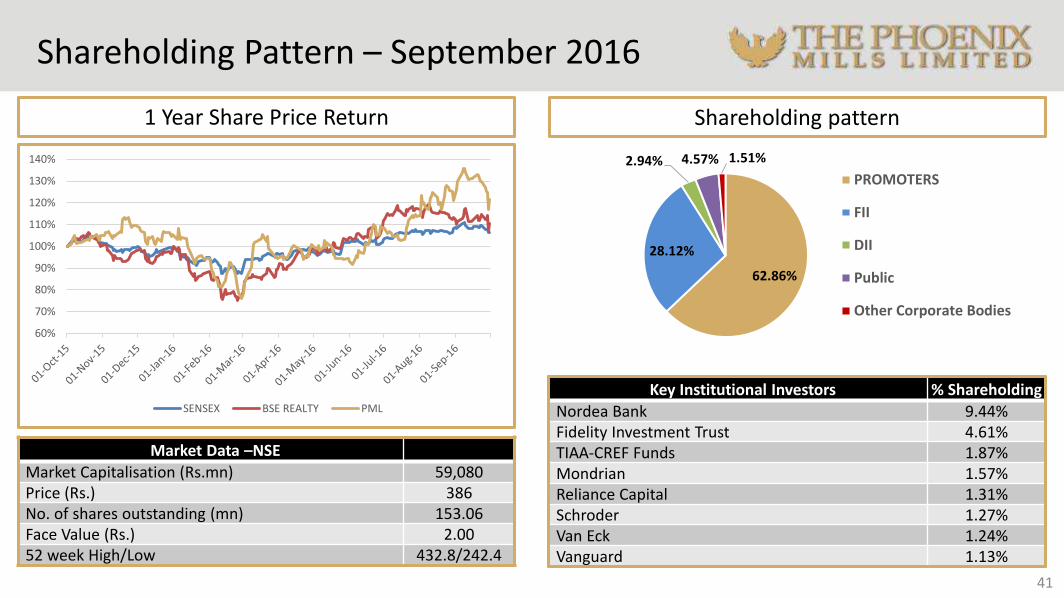
Shareholding Pattern – September 2016
Key Institutional Investors % Shareholding
Nordea Bank 9.44%Fidelity Investment Trust 4.61%TIAA-CREF Funds 1.87%Mondrian 1.57%Reliance Capital 1.31%Schroder 1.27%Van Eck 1.24%Vanguard 1.13%
Shareholding pattern
41
1 Year Share Price Return
Market Data –NSE
Market Capitalisation (Rs.mn) 59,080Price (Rs.) 386No. of shares outstanding (mn) 153.06Face Value (Rs.) 2.0052 week High/Low 432.8/242.4
60%
70%
80%
90%
100%
110%
120%
130%
140%
SENSEX BSE REALTY PML
62.86%
28.12%
2.94% 4.57% 1.51%
PROMOTERS
FII
DII
Public
Other Corporate Bodies
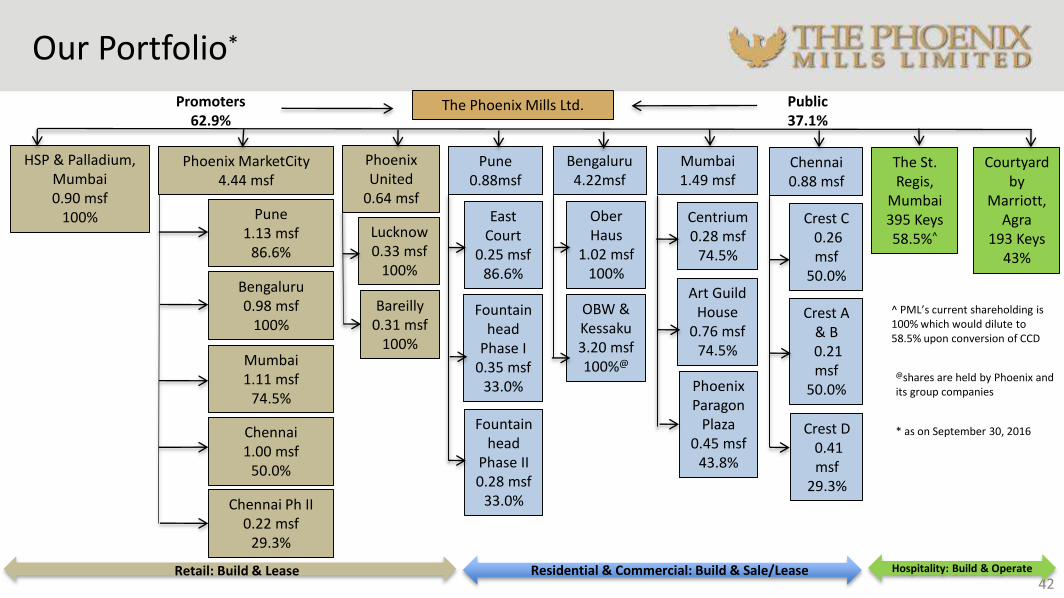
Our Portfolio*
42
The Phoenix Mills Ltd.Promoters62.9%
Public37.1%
HSP & Palladium, Mumbai0.90 msf
100%
Phoenix MarketCity4.44 msf
Pune 1.13 msf
86.6%
Bengaluru0.98 msf
100%
Mumbai1.11 msf
74.5%
Chennai 1.00 msf
50.0%
Chennai Ph II0.22 msf
29.3%
Phoenix United
0.64 msf
Lucknow0.33 msf
100%
Bareilly0.31 msf
100%
Pune0.88msf
East Court
0.25 msf86.6%
Fountainhead
Phase I0.35 msf
33.0%
Fountainhead
Phase II0.28 msf
33.0%
Bengaluru4.22msf
OberHaus
1.02 msf100%
OBW & Kessaku3.20 msf100%@
Mumbai1.49 msf
Centrium0.28 msf
74.5%
Art Guild House
0.76 msf74.5%
Phoenix Paragon
Plaza0.45 msf
43.8%
Chennai0.88 msf
Crest C0.26 msf
50.0%
Crest A & B0.21 msf
50.0%
Crest D0.41 msf
29.3%
The St. Regis,
Mumbai395 Keys58.5%^
Courtyard by
Marriott, Agra
193 Keys43%
Retail: Build & Lease Residential & Commercial: Build & Sale/Lease Hospitality: Build & Operate
^ PML’s current shareholding is 100% which would dilute to 58.5% upon conversion of CCD
* as on September 30, 2016
@shares are held by Phoenix and its group companies
Annexure
Commercial Portfolio
Hotels & Restaurants Portfolio
43
Residential Portfolio
Retail Portfolio
44
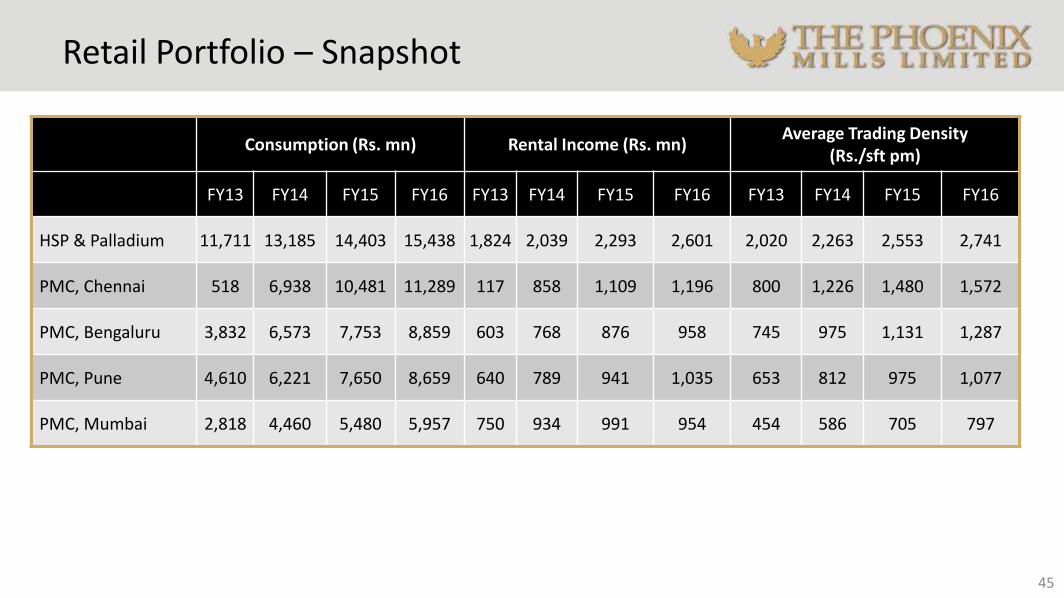
Retail Portfolio – Snapshot
45
Consumption (Rs. mn) Rental Income (Rs. mn)Average Trading Density
(Rs./sft pm)
FY13 FY14 FY15 FY16 FY13 FY14 FY15 FY16 FY13 FY14 FY15 FY16
HSP & Palladium 11,711 13,185 14,403 15,438 1,824 2,039 2,293 2,601 2,020 2,263 2,553 2,741
PMC, Chennai 518 6,938 10,481 11,289 117 858 1,109 1,196 800 1,226 1,480 1,572
PMC, Bengaluru 3,832 6,573 7,753 8,859 603 768 876 958 745 975 1,131 1,287
PMC, Pune 4,610 6,221 7,650 8,659 640 789 941 1,035 653 812 975 1,077
PMC, Mumbai 2,818 4,460 5,480 5,957 750 934 991 954 454 586 705 797
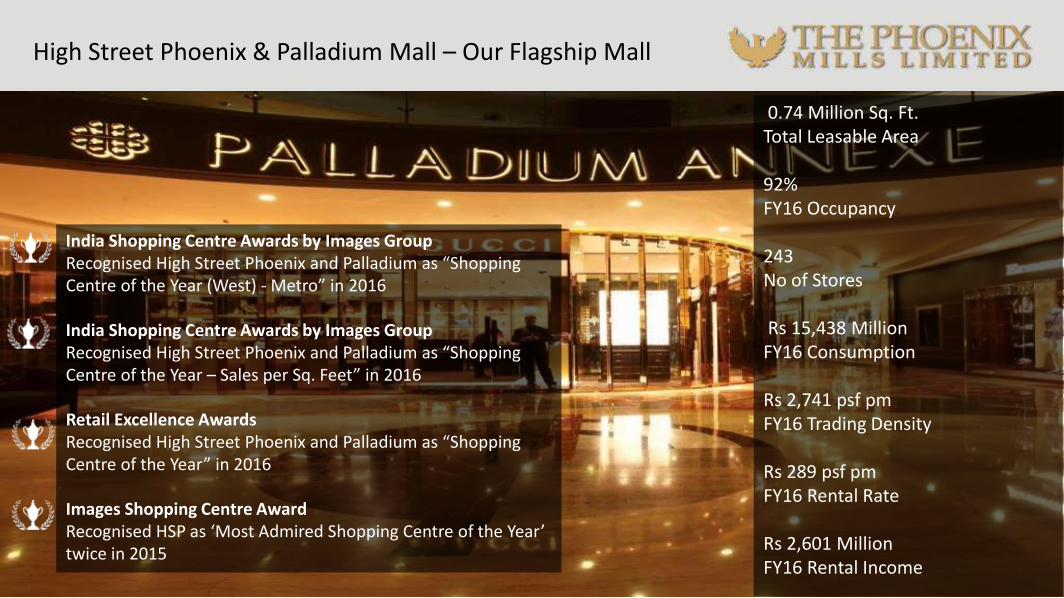
High Street Phoenix & Palladium Mall – Our Flagship Mall
46
0.74 Million Sq. Ft.Total Leasable Area
92%FY16 Occupancy
243No of Stores
Rs 15,438 MillionFY16 Consumption
Rs 2,741 psf pmFY16 Trading Density
Rs 289 psf pmFY16 Rental Rate
Rs 2,601 MillionFY16 Rental Income
India Shopping Centre Awards by Images GroupRecognised High Street Phoenix and Palladium as “Shopping Centre of the Year (West) - Metro” in 2016
India Shopping Centre Awards by Images GroupRecognised High Street Phoenix and Palladium as “Shopping Centre of the Year – Sales per Sq. Feet” in 2016
Retail Excellence Awards Recognised High Street Phoenix and Palladium as “Shopping Centre of the Year” in 2016
Images Shopping Centre AwardRecognised HSP as ‘Most Admired Shopping Centre of the Year’ twice in 2015
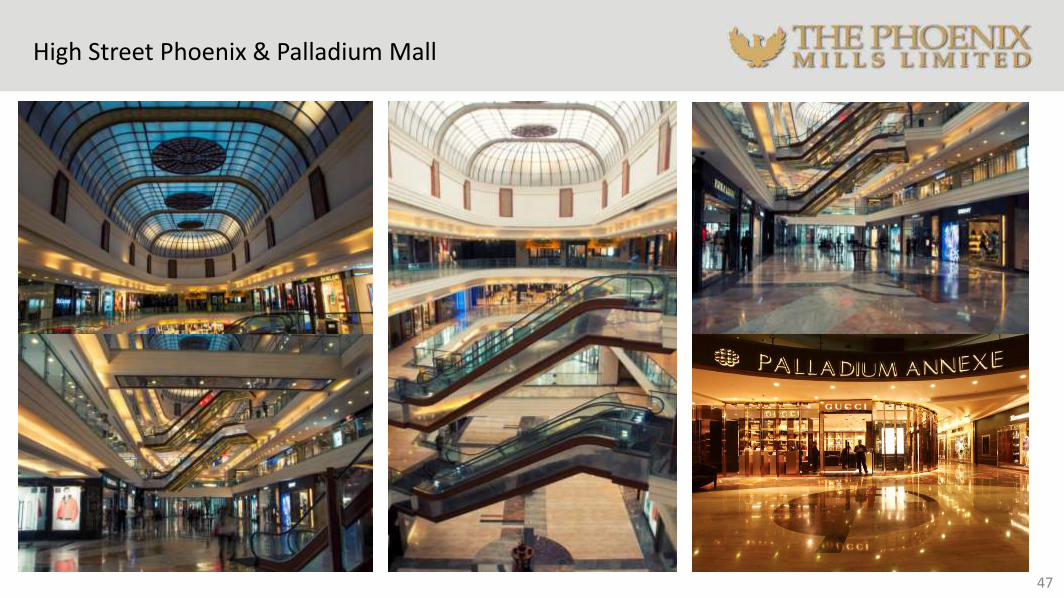
High Street Phoenix & Palladium Mall
47
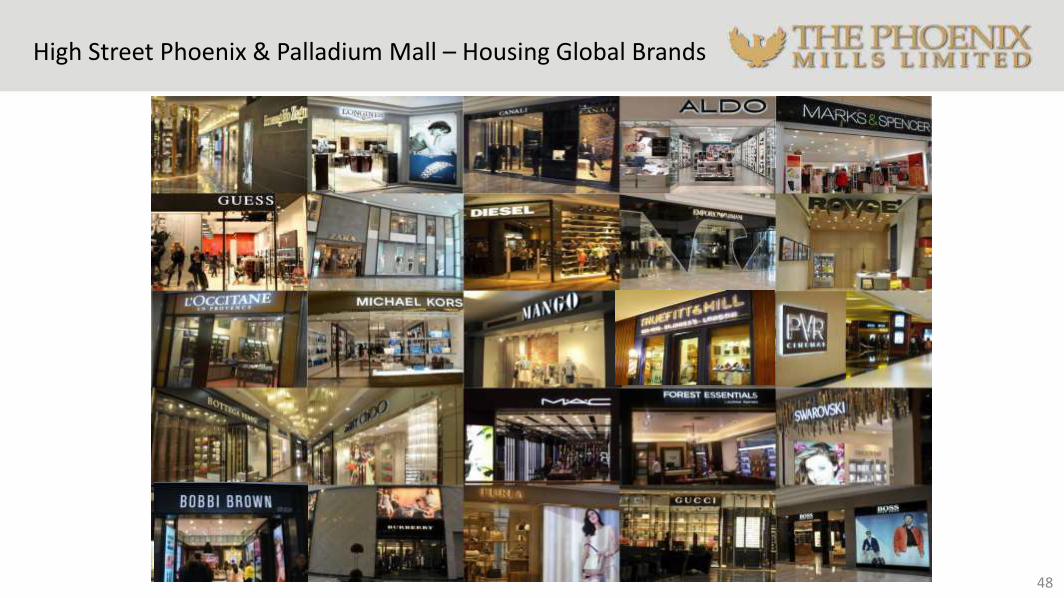
High Street Phoenix & Palladium Mall – Housing Global Brands
48
49
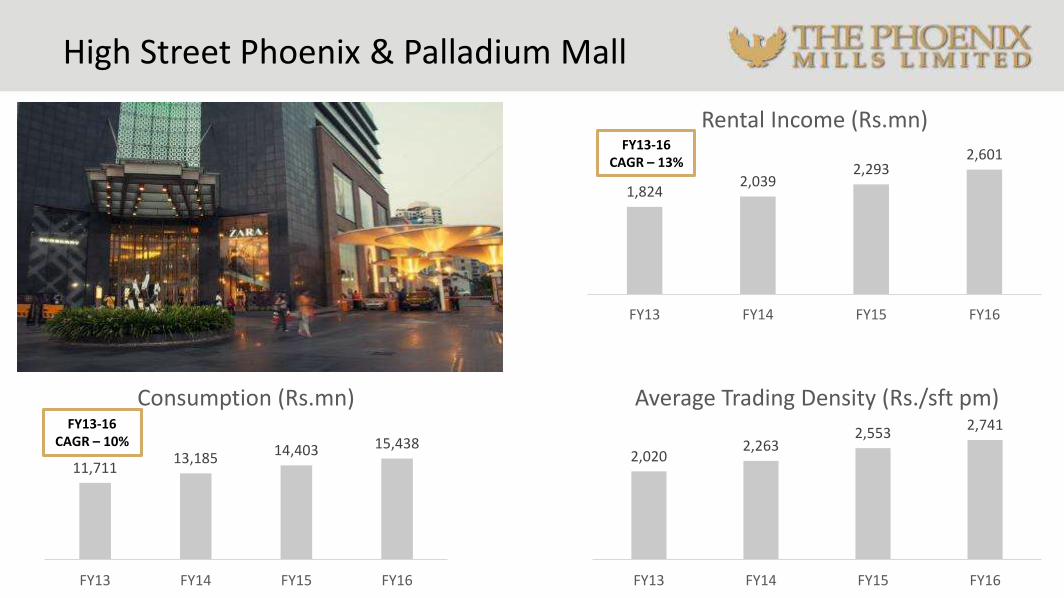
1,8242,039
2,2932,601
FY13 FY14 FY15 FY16
Rental Income (Rs.mn)
11,71113,185 14,403 15,438
FY13 FY14 FY15 FY16
Consumption (Rs.mn)
2,0202,263
2,5532,741
FY13 FY14 FY15 FY16
Average Trading Density (Rs./sft pm)FY13-16
CAGR – 10%
FY13-16 CAGR – 13%
High Street Phoenix & Palladium Mall
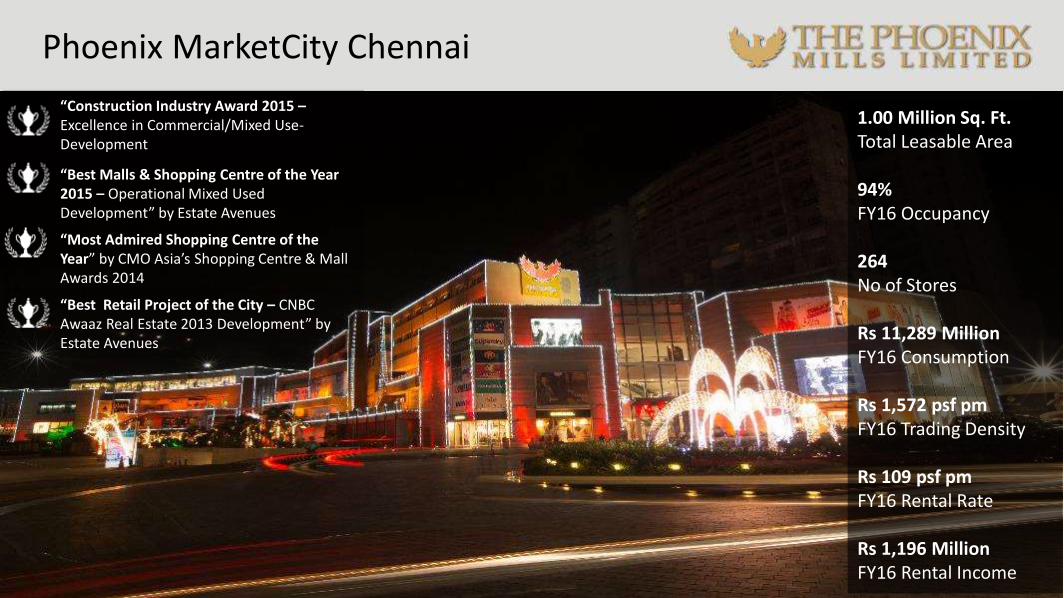
Phoenix MarketCity Chennai
50
“Best Malls & Shopping Centre of the Year 2015 – Operational Mixed Used Development” by Estate Avenues
“Most Admired Shopping Centre of the Year” by CMO Asia’s Shopping Centre & Mall Awards 2014
“Best Retail Project of the City – CNBC Awaaz Real Estate 2013 Development” by Estate Avenues
“Construction Industry Award 2015 –Excellence in Commercial/Mixed Use-Development
1.00 Million Sq. Ft.Total Leasable Area
94%FY16 Occupancy
264No of Stores
Rs 11,289 MillionFY16 Consumption
Rs 1,572 psf pmFY16 Trading Density
Rs 109 psf pmFY16 Rental Rate
Rs 1,196 MillionFY16 Rental Income
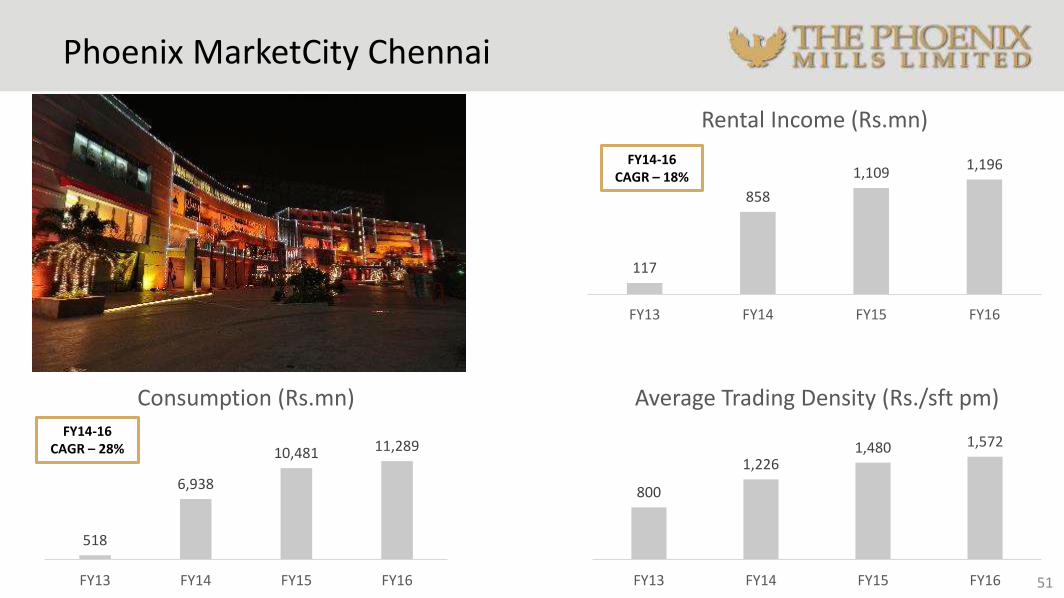
117
858
1,1091,196
FY13 FY14 FY15 FY16
Rental Income (Rs.mn)
51
518
6,938
10,481 11,289
FY13 FY14 FY15 FY16
Consumption (Rs.mn)
800
1,2261,480 1,572
FY13 FY14 FY15 FY16
Average Trading Density (Rs./sft pm)FY14-16
CAGR – 28%
FY14-16 CAGR – 18%
Phoenix MarketCity Chennai
Phoenix MarketCity Bengaluru
52
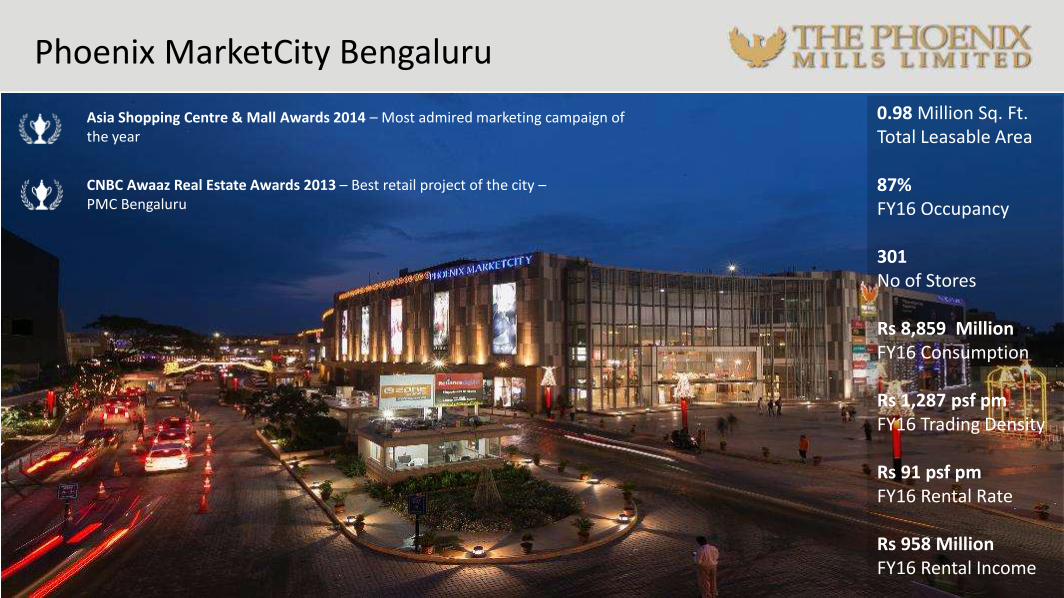
0.98 Million Sq. Ft.Total Leasable Area
87%FY16 Occupancy
301No of Stores
Rs 8,859 MillionFY16 Consumption
Rs 1,287 psf pmFY16 Trading Density
Rs 91 psf pmFY16 Rental Rate
Rs 958 MillionFY16 Rental Income
Asia Shopping Centre & Mall Awards 2014 – Most admired marketing campaign of the year
CNBC Awaaz Real Estate Awards 2013 – Best retail project of the city –PMC Bengaluru
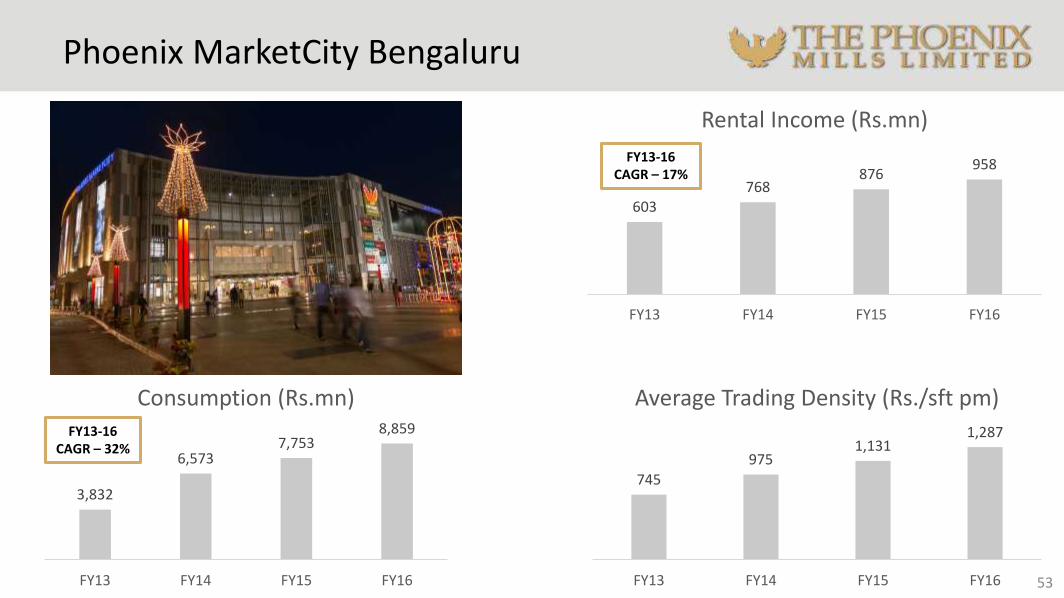
Phoenix MarketCity Bengaluru
603768
876958
FY13 FY14 FY15 FY16
Rental Income (Rs.mn)
53
3,832
6,5737,753
8,859
FY13 FY14 FY15 FY16
Consumption (Rs.mn)
745
9751,131
1,287
FY13 FY14 FY15 FY16
Average Trading Density (Rs./sft pm)
FY13-16 CAGR – 17%
FY13-16 CAGR – 32%
Phoenix MarketCity Pune
54
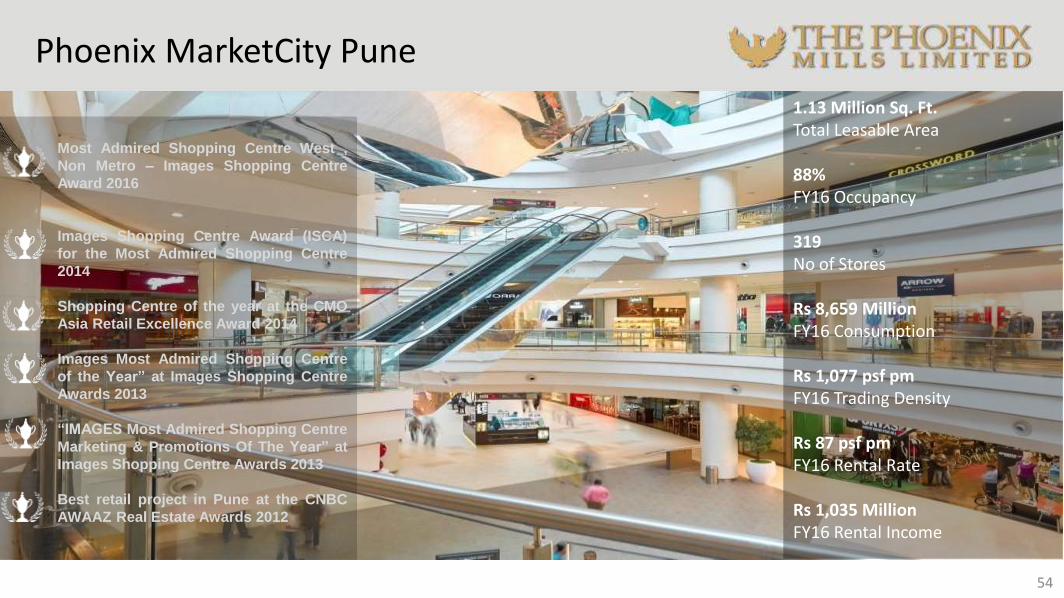
Most Admired Shopping Centre West ,
Non Metro – Images Shopping Centre
Award 2016
Images Shopping Centre Award (ISCA)
for the Most Admired Shopping Centre
2014
Shopping Centre of the year at the CMO
Asia Retail Excellence Award 2014
Images Most Admired Shopping Centre
of the Year” at Images Shopping Centre
Awards 2013
“IMAGES Most Admired Shopping Centre
Marketing & Promotions Of The Year” at
Images Shopping Centre Awards 2013
Best retail project in Pune at the CNBC
AWAAZ Real Estate Awards 2012
1.13 Million Sq. Ft.Total Leasable Area
88%FY16 Occupancy
319No of Stores
Rs 8,659 MillionFY16 Consumption
Rs 1,077 psf pmFY16 Trading Density
Rs 87 psf pmFY16 Rental Rate
Rs 1,035 MillionFY16 Rental Income
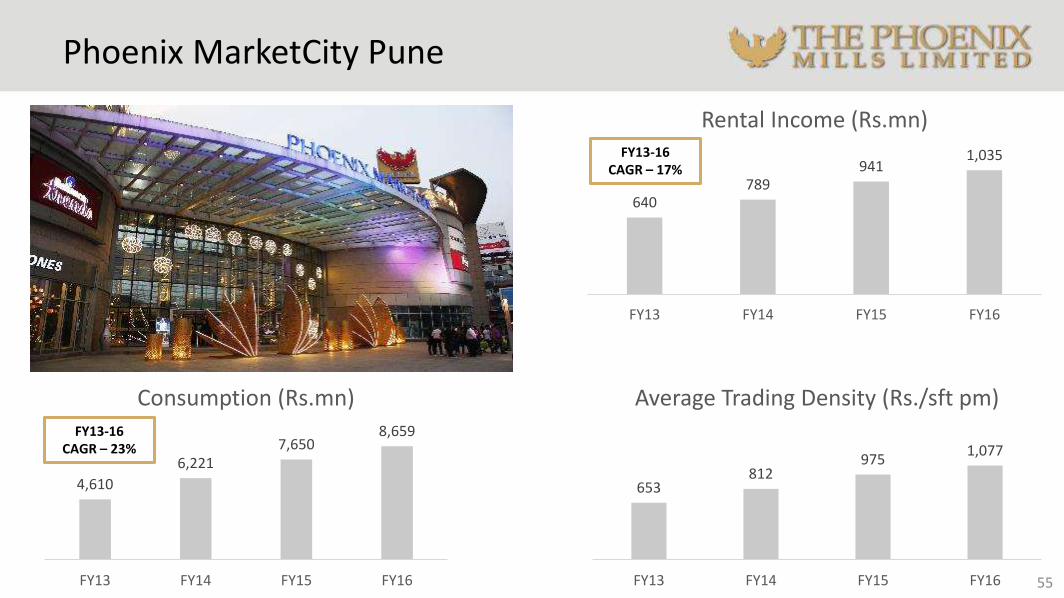
Phoenix MarketCity Pune
640789
9411,035
FY13 FY14 FY15 FY16
Rental Income (Rs.mn)
55
4,610
6,2217,650
8,659
FY13 FY14 FY15 FY16
Consumption (Rs.mn)
653812
9751,077
FY13 FY14 FY15 FY16
Average Trading Density (Rs./sft pm)
FY13-16 CAGR – 17%
FY13-16 CAGR – 23%
56
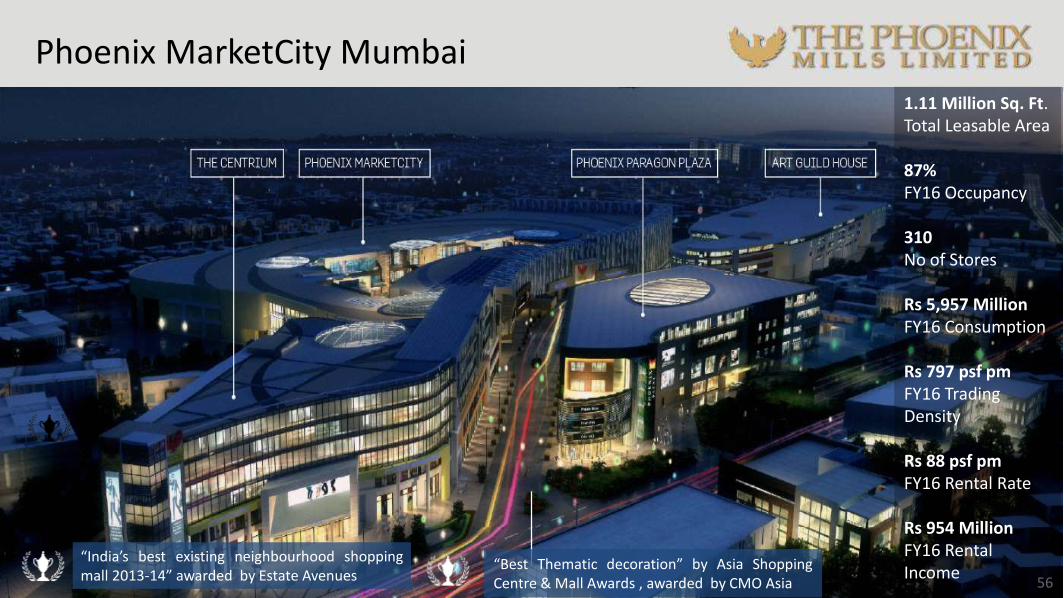
Phoenix MarketCity Mumbai
“India’s best existing neighbourhood shoppingmall 2013-14” awarded by Estate Avenues
“Best Thematic decoration” by Asia ShoppingCentre & Mall Awards , awarded by CMO Asia
1.11 Million Sq. Ft.Total Leasable Area
87%FY16 Occupancy
310No of Stores
Rs 5,957 MillionFY16 Consumption
Rs 797 psf pmFY16 Trading Density
Rs 88 psf pmFY16 Rental Rate
Rs 954 MillionFY16 Rental Income
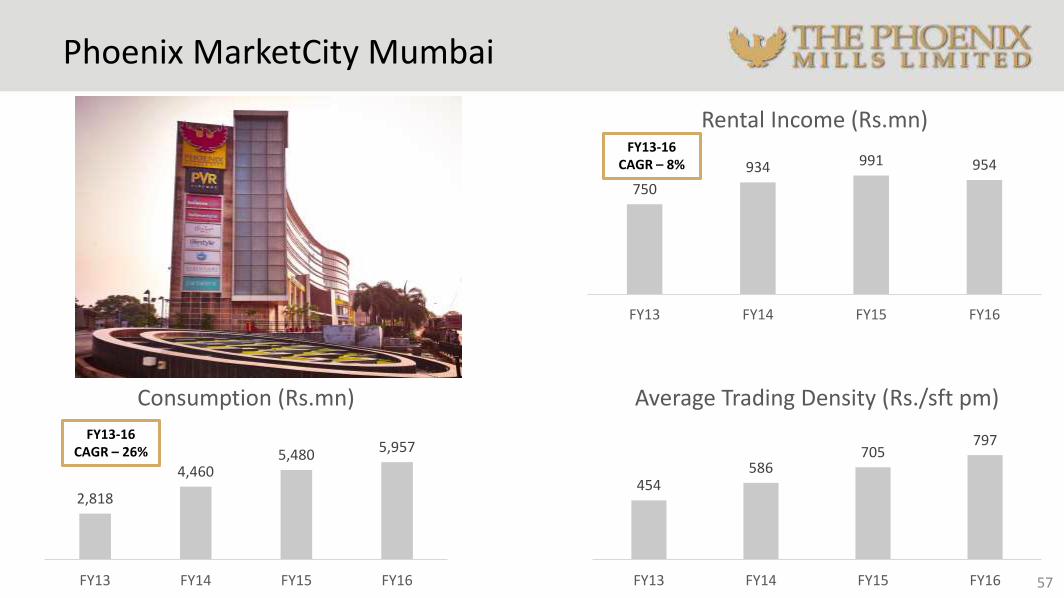
Phoenix MarketCity Mumbai
750
934 991 954
FY13 FY14 FY15 FY16
Rental Income (Rs.mn)
57
2,818
4,4605,480 5,957
FY13 FY14 FY15 FY16
Consumption (Rs.mn)
454586
705797
FY13 FY14 FY15 FY16
Average Trading Density (Rs./sft pm)
FY13-16 CAGR – 8%
FY13-16 CAGR – 26%
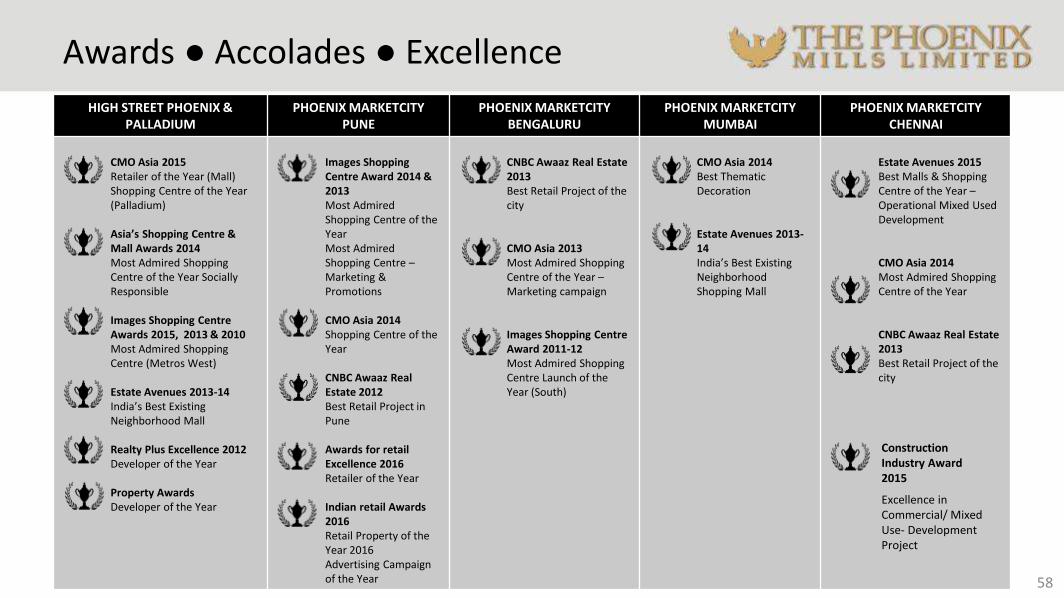
Awards ● Accolades ● Excellence
58
HIGH STREET PHOENIX & PALLADIUM
PHOENIX MARKETCITY PUNE
PHOENIX MARKETCITY BENGALURU
PHOENIX MARKETCITY MUMBAI
PHOENIX MARKETCITY CHENNAI
CMO Asia 2015Retailer of the Year (Mall)Shopping Centre of the Year (Palladium)
Asia’s Shopping Centre & Mall Awards 2014Most Admired Shopping Centre of the Year Socially Responsible
Images Shopping Centre Awards 2015, 2013 & 2010Most Admired Shopping Centre (Metros West)
Estate Avenues 2013-14India’s Best Existing Neighborhood Mall
Realty Plus Excellence 2012Developer of the Year
Property AwardsDeveloper of the Year
Images Shopping Centre Award 2014 & 2013Most Admired Shopping Centre of the YearMost Admired Shopping Centre –Marketing & Promotions
CMO Asia 2014Shopping Centre of the Year
CNBC Awaaz Real Estate 2012Best Retail Project in Pune
Awards for retail Excellence 2016Retailer of the Year
Indian retail Awards 2016Retail Property of the Year 2016Advertising Campaign of the Year
CNBC Awaaz Real Estate 2013Best Retail Project of the city
CMO Asia 2013Most Admired Shopping Centre of the Year –Marketing campaign
Images Shopping Centre Award 2011-12Most Admired Shopping Centre Launch of the Year (South)
CMO Asia 2014Best Thematic Decoration
Estate Avenues 2013-14India’s Best Existing Neighborhood Shopping Mall
Estate Avenues 2015Best Malls & Shopping Centre of the Year –Operational Mixed Used Development
CMO Asia 2014Most Admired Shopping Centre of the Year
CNBC Awaaz Real Estate 2013Best Retail Project of the city
Excellence in Commercial/ Mixed Use- Development Project
Construction Industry Award 2015

59
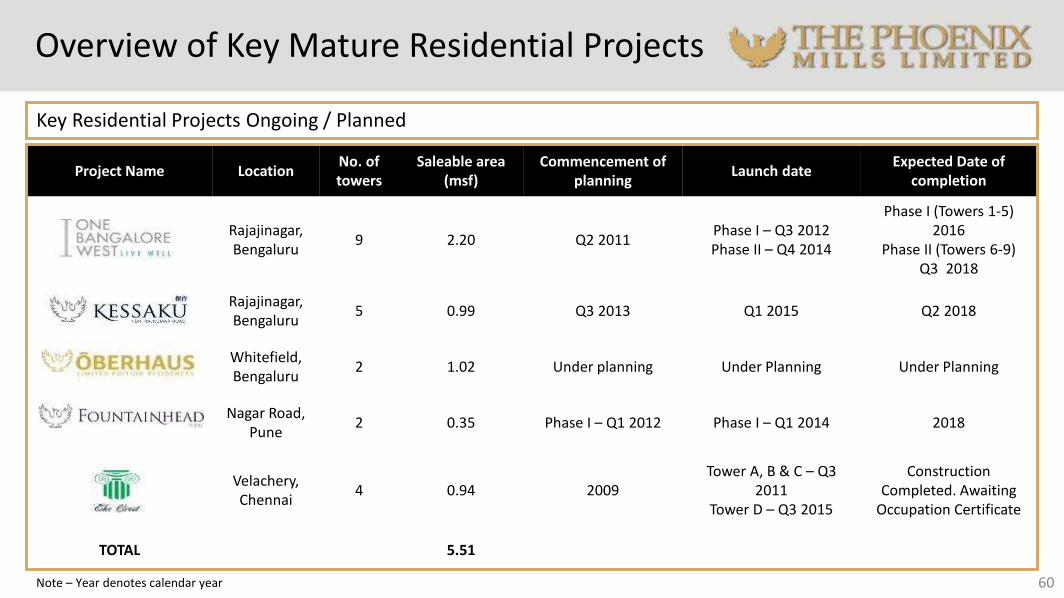
Project Name LocationNo. of towers
Saleable area (msf)
Commencement of planning
Launch dateExpected Date of
completion
Rajajinagar,Bengaluru
9 2.20 Q2 2011Phase I – Q3 2012Phase II – Q4 2014
Phase I (Towers 1-5)2016
Phase II (Towers 6-9)Q3 2018
Rajajinagar,Bengaluru
5 0.99 Q3 2013 Q1 2015 Q2 2018
Whitefield,Bengaluru
2 1.02 Under planning Under Planning Under Planning
Nagar Road, Pune
2 0.35 Phase I – Q1 2012 Phase I – Q1 2014 2018
Velachery, Chennai
4 0.94 2009Tower A, B & C – Q3
2011Tower D – Q3 2015
ConstructionCompleted. Awaiting
Occupation Certificate
TOTAL 5.51
Overview of Key Mature Residential Projects
Key Residential Projects Ongoing / Planned
60Note – Year denotes calendar year
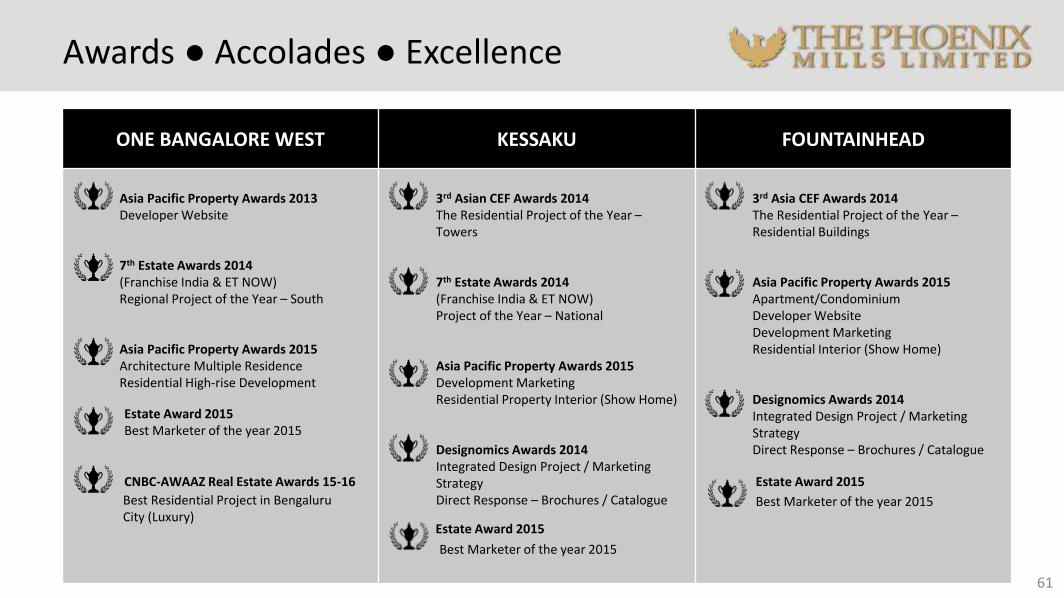
Awards ● Accolades ● Excellence
61
ONE BANGALORE WEST KESSAKU FOUNTAINHEAD
Asia Pacific Property Awards 2013Developer Website
7th Estate Awards 2014(Franchise India & ET NOW)Regional Project of the Year – South
Asia Pacific Property Awards 2015Architecture Multiple ResidenceResidential High-rise Development
3rd Asian CEF Awards 2014The Residential Project of the Year –Towers
7th Estate Awards 2014(Franchise India & ET NOW)Project of the Year – National
Asia Pacific Property Awards 2015Development MarketingResidential Property Interior (Show Home)
Designomics Awards 2014Integrated Design Project / Marketing StrategyDirect Response – Brochures / Catalogue
3rd Asia CEF Awards 2014The Residential Project of the Year –Residential Buildings
Asia Pacific Property Awards 2015Apartment/CondominiumDeveloper WebsiteDevelopment MarketingResidential Interior (Show Home)
Designomics Awards 2014Integrated Design Project / Marketing StrategyDirect Response – Brochures / Catalogue
Estate Award 2015
Best Marketer of the year 2015
Best Marketer of the year 2015
Estate Award 2015
Estate Award 2015Best Marketer of the year 2015
CNBC-AWAAZ Real Estate Awards 15-16
Best Residential Project in Bengaluru City (Luxury)

62
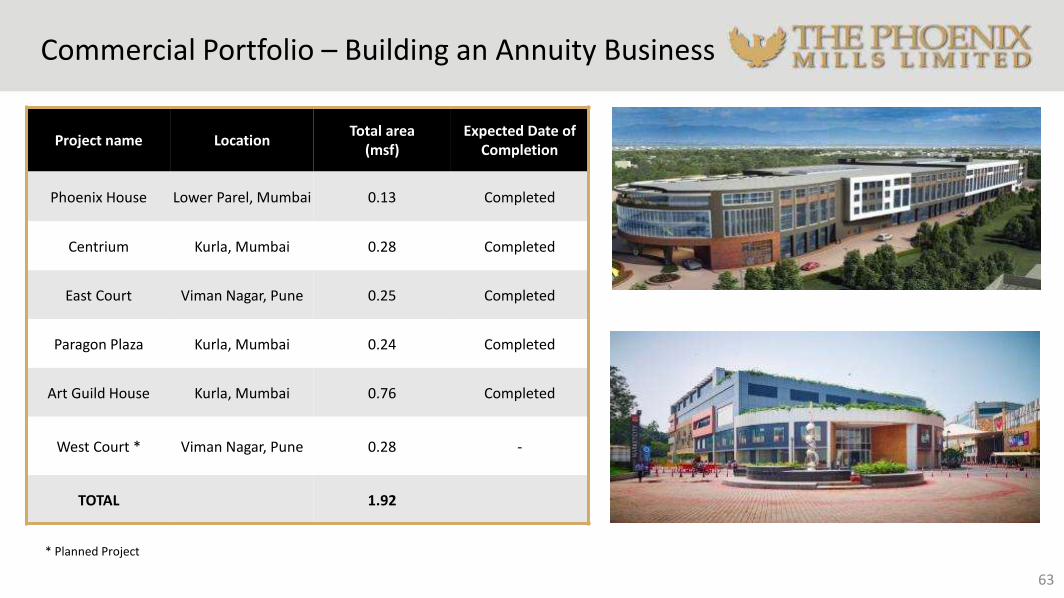
Project name Location Total area
(msf) Expected Date of
Completion
Phoenix House Lower Parel, Mumbai 0.13 Completed
Centrium Kurla, Mumbai 0.28 Completed
East Court Viman Nagar, Pune 0.25 Completed
Paragon Plaza Kurla, Mumbai 0.24 Completed
Art Guild House Kurla, Mumbai 0.76 Completed
West Court * Viman Nagar, Pune 0.28 -
TOTAL 1.92
Commercial Portfolio – Building an Annuity Business
* Planned Project
63

64
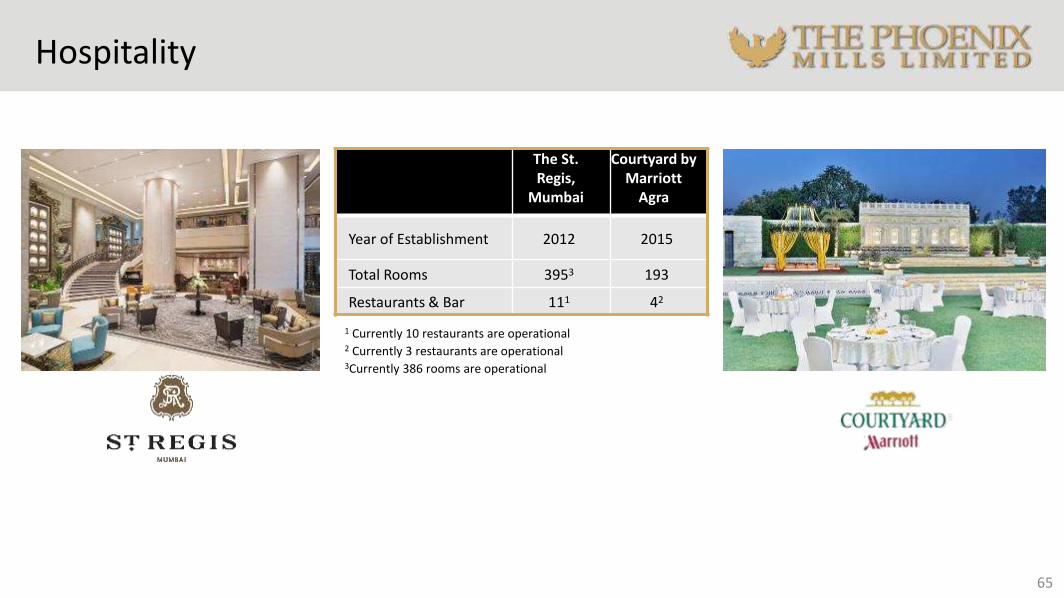
Hospitality
65
The St. Regis,
Mumbai
Courtyard by Marriott
Agra
Year of Establishment 2012 2015
Total Rooms 3953 193
Restaurants & Bar 111 42
1 Currently 10 restaurants are operational2 Currently 3 restaurants are operational3Currently 386 rooms are operational
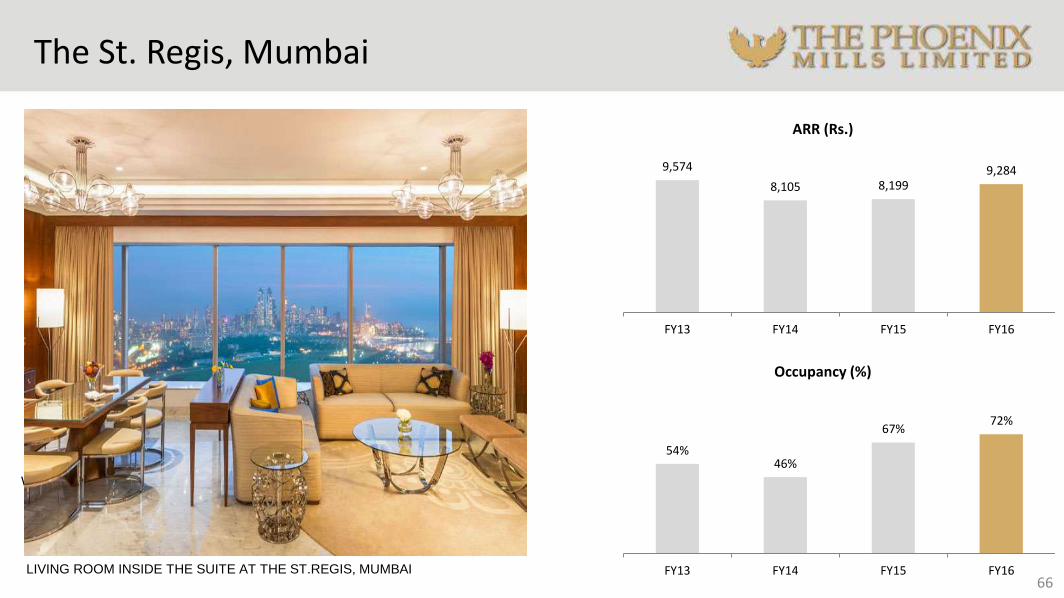
The St. Regis, Mumbai
66
9,574
8,105 8,1999,284
FY13 FY14 FY15 FY16
ARR (Rs.)
54%46%
67%72%
FY13 FY14 FY15 FY16
Occupancy (%)
WEDDING SETUP AT THE ST.REGIS, MUMBAI
LIVING ROOM INSIDE THE SUITE AT THE ST.REGIS, MUMBAI
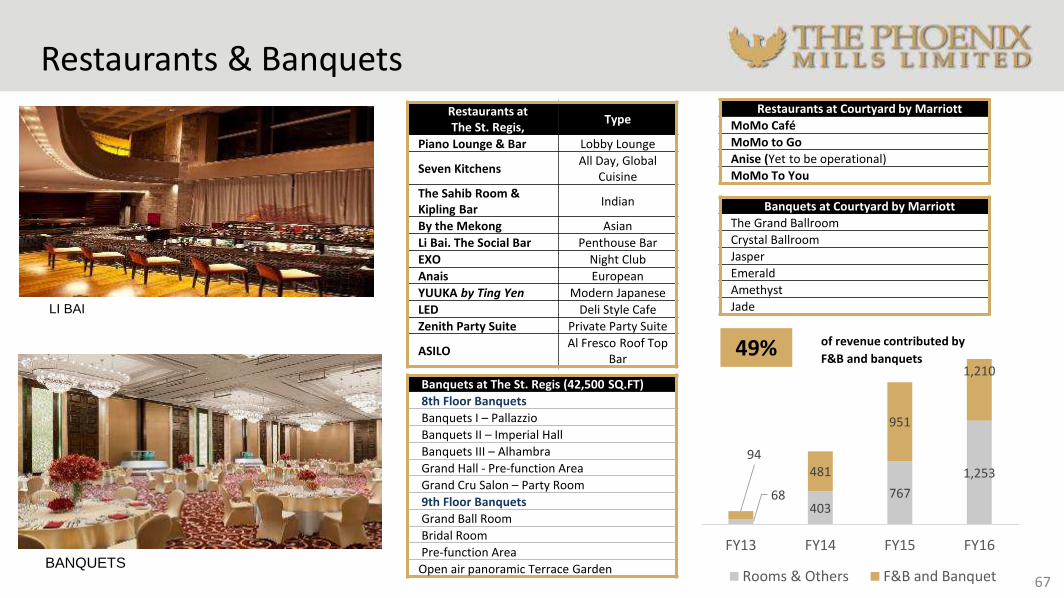
Restaurants & Banquets
LI BAI
Restaurants atThe St. Regis,
Type
Piano Lounge & Bar Lobby Lounge
Seven KitchensAll Day, Global
Cuisine
The Sahib Room & Kipling Bar
Indian
By the Mekong Asian
Li Bai. The Social Bar Penthouse Bar
EXO Night Club
Anais European
YUUKA by Ting Yen Modern Japanese
LED Deli Style Cafe
Zenith Party Suite Private Party Suite
ASILOAl Fresco Roof Top
Bar
67
Banquets at The St. Regis (42,500 SQ.FT)
8th Floor Banquets
Banquets I – Pallazzio
Banquets II – Imperial Hall
Banquets III – Alhambra
Grand Hall - Pre-function Area
Grand Cru Salon – Party Room
9th Floor Banquets
Grand Ball Room
Bridal Room
Pre-function Area
Open air panoramic Terrace GardenBANQUETS
of revenue contributed by
F&B and banquets
68403
767
1,253
94481
951
1,210
FY13 FY14 FY15 FY16
Rooms & Others F&B and Banquet
Restaurants at Courtyard by Marriott
MoMo Café
MoMo to Go
Anise (Yet to be operational)
MoMo To You
49%
Banquets at Courtyard by Marriott
The Grand Ballroom
Crystal Ballroom
Jasper
Emerald
Amethyst
Jade
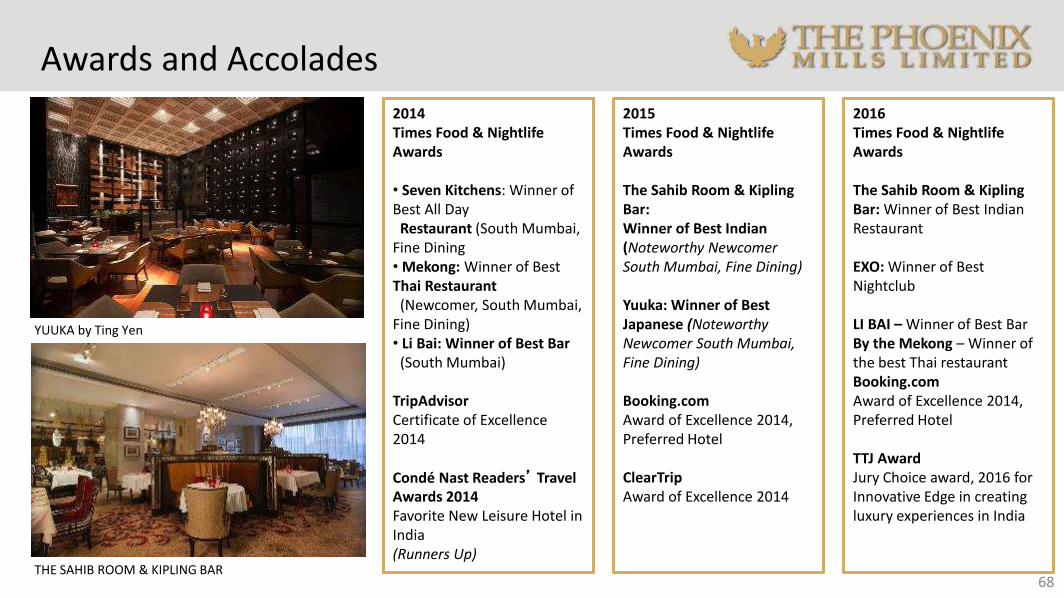
Awards and Accolades
2014Times Food & Nightlife Awards
• Seven Kitchens: Winner of Best All Day
Restaurant (South Mumbai, Fine Dining• Mekong: Winner of Best Thai Restaurant
(Newcomer, South Mumbai, Fine Dining)• Li Bai: Winner of Best Bar
(South Mumbai)
TripAdvisorCertificate of Excellence 2014
Condé Nast Readers’ Travel Awards 2014Favorite New Leisure Hotel in India(Runners Up)
YUUKA by Ting Yen
68
2015Times Food & Nightlife Awards
The Sahib Room & Kipling Bar: Winner of Best Indian (Noteworthy Newcomer South Mumbai, Fine Dining)
Yuuka: Winner of Best Japanese (Noteworthy Newcomer South Mumbai, Fine Dining)
Booking.comAward of Excellence 2014, Preferred Hotel
ClearTripAward of Excellence 2014
THE SAHIB ROOM & KIPLING BAR
2016Times Food & Nightlife Awards
The Sahib Room & Kipling Bar: Winner of Best Indian Restaurant
EXO: Winner of Best Nightclub
LI BAI – Winner of Best BarBy the Mekong – Winner of the best Thai restaurantBooking.comAward of Excellence 2014, Preferred Hotel
TTJ Award Jury Choice award, 2016 for Innovative Edge in creating luxury experiences in India
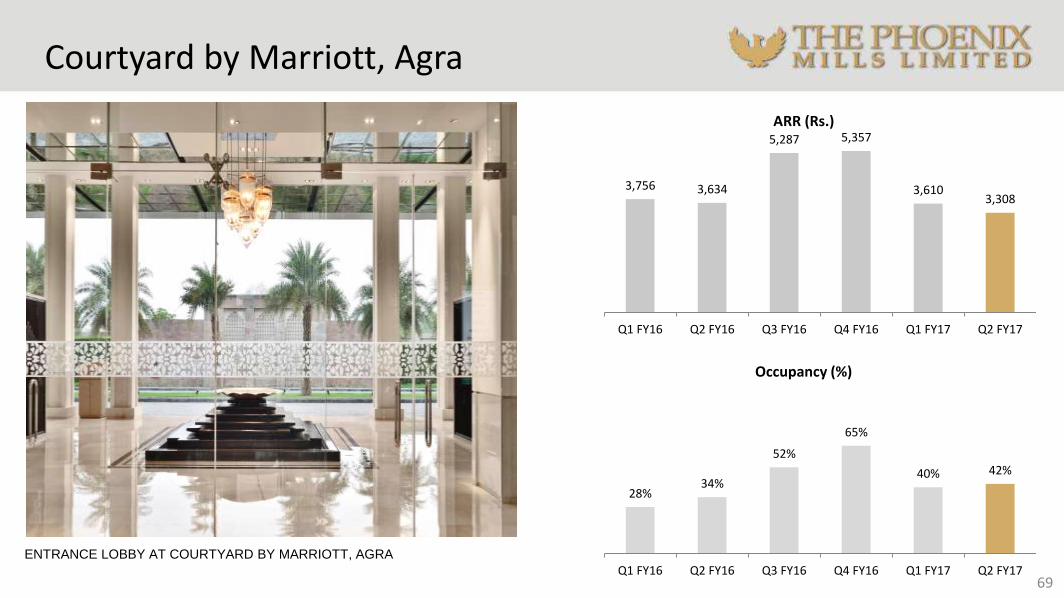
Courtyard by Marriott, Agra
69
3,756 3,634
5,287 5,357
3,6103,308
Q1 FY16 Q2 FY16 Q3 FY16 Q4 FY16 Q1 FY17 Q2 FY17
ARR (Rs.)
28%34%
52%
65%
40% 42%
Q1 FY16 Q2 FY16 Q3 FY16 Q4 FY16 Q1 FY17 Q2 FY17
Occupancy (%)
ENTRANCE LOBBY AT COURTYARD BY MARRIOTT, AGRA
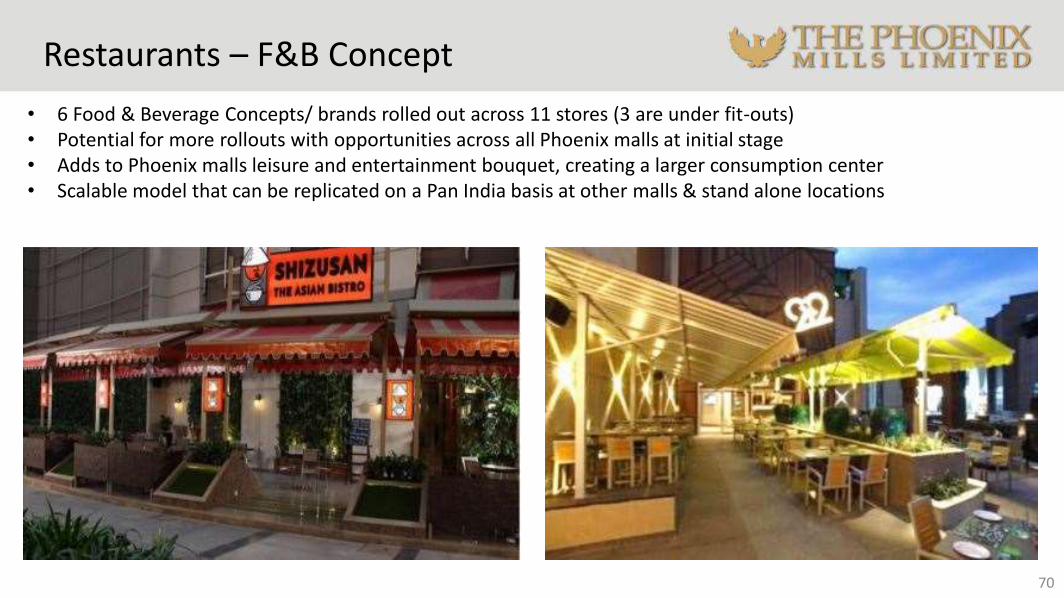
Restaurants – F&B Concept
• 6 Food & Beverage Concepts/ brands rolled out across 11 stores (3 are under fit-outs)• Potential for more rollouts with opportunities across all Phoenix malls at initial stage• Adds to Phoenix malls leisure and entertainment bouquet, creating a larger consumption center• Scalable model that can be replicated on a Pan India basis at other malls & stand alone locations
70
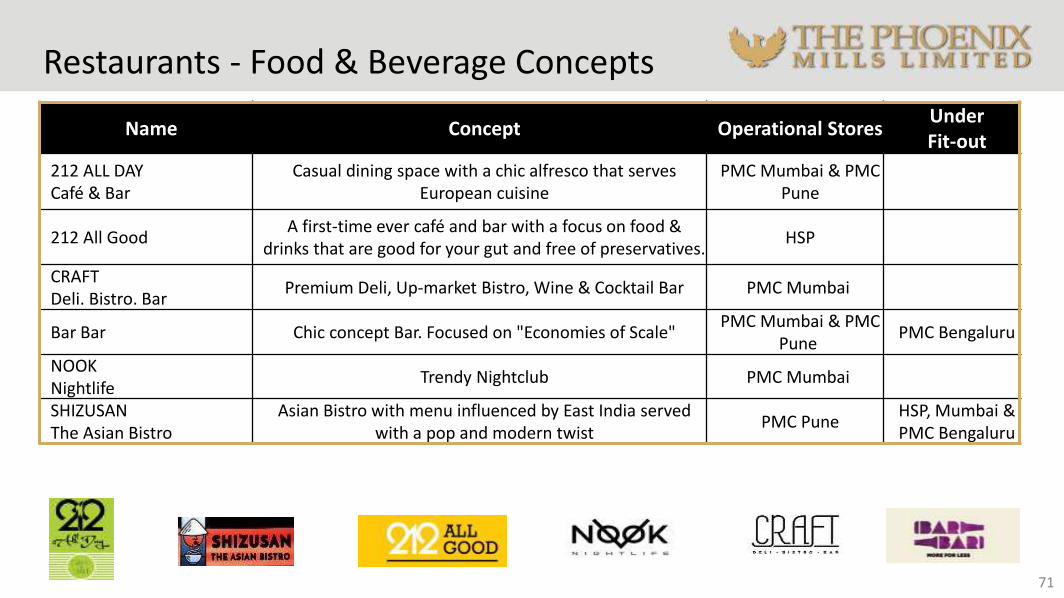
Restaurants - Food & Beverage Concepts
71
Name Concept Operational StoresUnder Fit-out
212 ALL DAYCafé & Bar
Casual dining space with a chic alfresco that serves European cuisine
PMC Mumbai & PMC Pune
212 All GoodA first-time ever café and bar with a focus on food &
drinks that are good for your gut and free of preservatives.HSP
CRAFTDeli. Bistro. Bar
Premium Deli, Up-market Bistro, Wine & Cocktail Bar PMC Mumbai
Bar Bar Chic concept Bar. Focused on "Economies of Scale"PMC Mumbai & PMC
PunePMC Bengaluru
NOOK Nightlife
Trendy Nightclub PMC Mumbai
SHIZUSANThe Asian Bistro
Asian Bistro with menu influenced by East India served with a pop and modern twist
PMC PuneHSP, Mumbai & PMC Bengaluru

Thank You!
72
For more information on the Company, its projects and services please log on to
www.thephoenixmills.comor contact:
Varun Parwal
Contact: +91 22 30016737
Email: [email protected]
Advait Phatarfod
Contact: +91 22 30016804
Email: [email protected]