Embed Size (px)
Citation preview
1 SOBI Q2 REPORT 2021
April—June
• Total revenue of SEK 3,211 M (3 070), 5 per cent growth and 14 per cent at CER
• EBITA1 was SEK 922 M (1,018), with an EBITA margin1 of 29 per cent (33)
• Earnings per share (EPS) before dilution of SEK 0.91 (0.96)
• Haematology sales were SEK 2,125 M (2,037), 12 per cent growth at CER
• Sales for Elocta® were SEK 1,005 M (1,040), 2 per cent growth at CER
• Sales for Alprolix® were SEK 438 M (363), 27 per cent growth at CER
• Doptelet® grew by 42 per cent at CER to SEK 230 M
• Immunology sales were SEK 752 M (714), Gamifant® grew by 46 per cent at CER to SEK 168 M (132)
• Cash flow from operating activities of SEK 1,393 M (1,942)
January—June
• Total revenue of SEK 6,872 M (7,709), -11 per cent and -2 per cent at CER
• EBITA1 was SEK 2,406 M (3,191), with an EBITA margin1 of 35 per cent (41)
• EPS before dilution of SEK 3.27 (4.98)
• Haematology sales were SEK 4,003 M (4,431), -3 per cent at CER
• Sales for Elocta were SEK 1,861 M (2,399), -18 per cent at CER
• Sales for Alprolix were SEK 851 M (851), 6 per cent growth at CER
• Doptelet grew by 88 per cent at CER to SEK 411 M
• Immunology sales were SEK 2,305 M (2,514), Gamifant grew by 47 per cent at CER to SEK 301 M (236)
• Cash flow from operating activities of SEK 3,092 (3,828)
Significant events after the reporting period
• In July, Kineret® was submitted to EMA with a proposed indication for the treatment of coronavirus disease 2019 (COVID-19) in adult patients with pneumonia who are at risk of developing severe respiratory failure
Outlook 2021—unchanged
• Revenue for the full-year 2021 is expected to be in the range of SEK 14,000-15,000 M
• EBITA margin is expected to be in the range of 30-35 per cent of revenue
Financial summary
Total revenue Q2, SEK M
14% EBITA margin1 Q2
Q2 2021 report
3,211
Progressing our pipeline
Q2 Q2 H1 H1 Full-year SEK M 2021 2020 Change 2021 2020 Change 2020
Total revenue 3,211 3,070 5% 6,872 7,709 -11% 15,261
Gross profit 2,428 2,381 2% 5,363 5,979 -10% 12,036
Gross margin1 76% 78% 78% 78% 79%
EBITA1 922 1,018 -9% 2,406 3,191 -25% 6,700
EBITA adjusted1,2 922 1,018 -9% 2,406 3,191 -25% 6,301
EBITA margin1 29% 33% 35% 41% 44%
EBITA margin adjusted1,2 29% 33% 35% 41% 41%
Profit for the period 268 283 -5% 964 1,465 -34% 3,245
Earnings per share, before dilution, SEK 0.91 0.96 -5% 3.27 4.98 -34% 11.01
Earnings per share, before dilution, SEK adjusted1,2,3 0.91 0.96 -5% 3.27 4.98 -34% 9.66 1Alternative Performance Measures (APMs), see page 19 for further information. 2 EBITA 2020 excluding non-recurring items; other operating income related to the reversal of the CVR liability of SEK 399 M.
3EPS full-year 2020 excluding the reversal of the CVR liability of SEK 399 M.
29%
Revenue growth at CER, Q2
2 SOBI Q2 REPORT 2021
CEO statement C E O S TAT E M E N T
We ended the second quarter on a positive note and are back to double-digit growth.
Our figures are still impacted by the COVID-19 pandemic and its related restrictions
and lockdowns, but as restrictions have eased, we have started to see improved mar-
ket conditions. The quarter closed with revenue of SEK 3,211 M with growth at CER
of 14 per cent. EBITA was SEK 922 M, with a margin of 29 per cent.
As stated previously, 2021 is a year of investment in our pipeline: we continue to
advance our R&D portfolio and explore new indications for our products.
During the quarter, we advanced key products in our R&D portfolio such as
pegcetacoplan and efanesoctocog alfa, as well as anakinra (Kineret) for the treatment
of hyperinflammation related to COVID-19. The SAVE-MORE trial showed strong re-
sults and in July we submitted anakinra for the treatment of COVID-19 pneumonia in
Europe. In April, the first patient was dosed in the phase 3 paediatric trial of
efanesoctocog alfa (BIVV001). I am confident that efanesoctocog alfa has the poten-
tial to significantly improve treatment for people with haemophilia A.
Together with Apellis, we reported positive top-line results from the phase 3 PRINCE
study evaluating the efficacy and safety of pegcetacoplan in treatment-naïve adults
with paroxysmal nocturnal haemoglobinuria (PNH). In May, pegcetacoplan was ap-
proved as EMPAVELITM in the US for the treatment of adults with PNH. The marketing authorisation application for pegcetacoplan for PNH
is currently under review by the European Medicines Agency (EMA).
We were happy to receive good news on nirsevimab, our collaboration with AstraZeneca, as the MELODY phase 3 trial met its primary
endpoint, and the MEDLEY phase 2/3 trial showed positive topline results.
Within business area Haematology, Doptelet product sales grew by 167 per cent at CER. Elocta and Alprolix showed steady patient growth
– up 3 per cent for Elocta and 16 per cent for Alprolix compared with the same period last year, and 1 per cent and 4 per cent compared
with Q1 2021. Sales were impacted by decreased consumption as a consequence of lockdowns and reduced activity among patients, and
by mandatory price reduction in Germany. However, the continued patient gain underscores the competitiveness of our products. Reve-
nue for Haematology reached SEK 2,125 M (2,037) for the second quarter, with growth at CER of 12 per cent. As previously communicat-
ed, we foresee double-digit price erosion for Elocta for full-year 2021, driven primarily by mandated pricing changes.
Doptelet has shown progress since its US launch, with new prescribed patients as the main growth driver. Our key focus for Doptelet now
is the launch in primary chronic immune thrombocytopenia (ITP) and chronic liver disease (CLD) indications throughout Europe.
Within business area Immunology, Kineret continues to show solid growth of 14 per cent at CER. We were pleased that we were able,
within a very short timeframe, to submit anakinra in July for treatment of treatment of COVID-19 pneumonia. Gamifant sales reached SEK
168 M (132), an increase of 46 per cent at CER. The number of patients treated continued to increase in the quarter, but sales fluctuate
depending on weight and the treatment period for patients. Awareness and knowledge are main drivers of sales and we continue to gain
traction with our education and awareness programmes about haemophagocytic lymphohistiocytosis (HLH) in the US.
We have continued to invest in the expansion of our international footprint, as well as ongoing and upcoming launches. The rollout of
Doptelet for the ITP indication in Europe is ongoing and countries have been added in the second quarter; we are also well underway in
preparation for the potential launch of pegcetacoplan in PNH and the COVID-19 indication for anakinra.
As we accelerate our pipeline, step up our international launches of Doptelet and Gamifant, and prepare for the commercialisation of
pegcetacoplan, we are laying the foundation for future double-digit growth and securing Sobi’s long-term interests.
I am proud of the Sobi team, of how we are able to manage the ambiguities and challenges of the present and hold course to
systematically strengthen our company for the future.
Solna, Sweden, 21 July 2021
Guido Oelkers, President & CEO
3 SOBI Q2 REPORT 2021
Financial performance Total revenue Total revenue for the quarter amounted to SEK 3,211 M (3,070), an increase of 5 per cent compared with the same period last year and 14 per cent at CER. Growth was mainly driven by Alprolix, Doptelet and Gamifant and the recently in-licensed products Tegsedi and Waylivra under the agreement with Akcea.
Half-year revenue was SEK 6,872 M (7,709), a decrease of 11 per cent and -2 per cent at CER.
Gross profit Gross profit for the quarter was SEK 2,428 M (2,381), representing a gross margin of 76 per cent (78). The margin decrease
was driven by unfavourable currency effects, mandatory price reduction for Elocta in Germany, and by unfavourable prod-
uct and country mix relating to Tegsedi and Waylivra sales and to sales of Doptelet to partner in China.
Half-year gross profit was SEK 5,363 M (5,979) representing a gross margin of 78 per cent (78).
Operating expenses Sales and administrative expenses, excluding amortisation and write-downs, amounted to SEK 1,014 M (1,000) for the
quarter and SEK 1,994 M (2,061) for the half year. For the quarter expenses increased by 11 per cent at CER, reflecting
launch preparations for pegcetacoplan, activities related to Doptelet and haemophilia products. Expenses related to the
new partner products Tegsedi and Waylivra are also reflected.
Research and development expenses amounted to SEK 484 M (345) for the quarter and to SEK 954 M (703) for the half
year. The increase reflects mainly spending related to the programmes for emapalumab, pegcetacoplan and SEL-212.
F I N A N C I A L P E R F O RM A N C E
Operating profit
Q2 Q2 H1 H1 Full-year
SEK M 2021 2020 2021 2020 2020
Total revenue 3,211 3,070 6,872 7,709 15,261
Cost of goods sold -783 -689 -1,509 -1,730 -3,225
Gross profit 2,428 2,381 5,363 5,979 12,036
Gross margin 76% 78% 78% 78% 79% Selling and administrative expenses before amortisation and write-downs -1,014 -1,000 -1,994 -2,061 -4,099
Research and development expenses -484 -345 -954 -703 -1,594
Total opex less amortisation and write-downs -1,497 -1,344 -2,949 -2,764 -5,693
Other operating income/expenses -9 -19 -9 -24 357
EBITA 922 1,018 2,406 3,191 6,700
Non-recurring items – – – – -399
EBITA adjusted1 922 1,018 2,406 3,191 6,301
Amortisation and write-downs related to Sales and administrative expenses -455 -477 -905 -953 -1,882
EBIT (Operating profit) 467 541 1,500 2,238 4,818
This is non-IFRS financial information. For an IFRS income statement, please refer to the Consolidated statement of comprehensive income.
1EBITA full-year 2020 excluding non-recurring items; other operating income related to the reversal of the CVR liability of SEK 399 M.
Q2 Q2 Change H1 H1 Change Full-year
SEK M 2021 2020 Change at CER1 2021 2020 Change at CER1 2020
Haematology 2,125 2,037 4% 12% 4,003 4,431 -10% -3% 8,660
Immunology 752 714 5% 17% 2,305 2,514 -8% 3% 5,415
Specialty Care 334 319 5% 14% 564 764 -26% -20% 1,186
Total 3,211 3,070 5% 14% 6,872 7,709 -11% -2% 15,261
1Constant exchange rates.
4 SOBI Q2 REPORT 2021
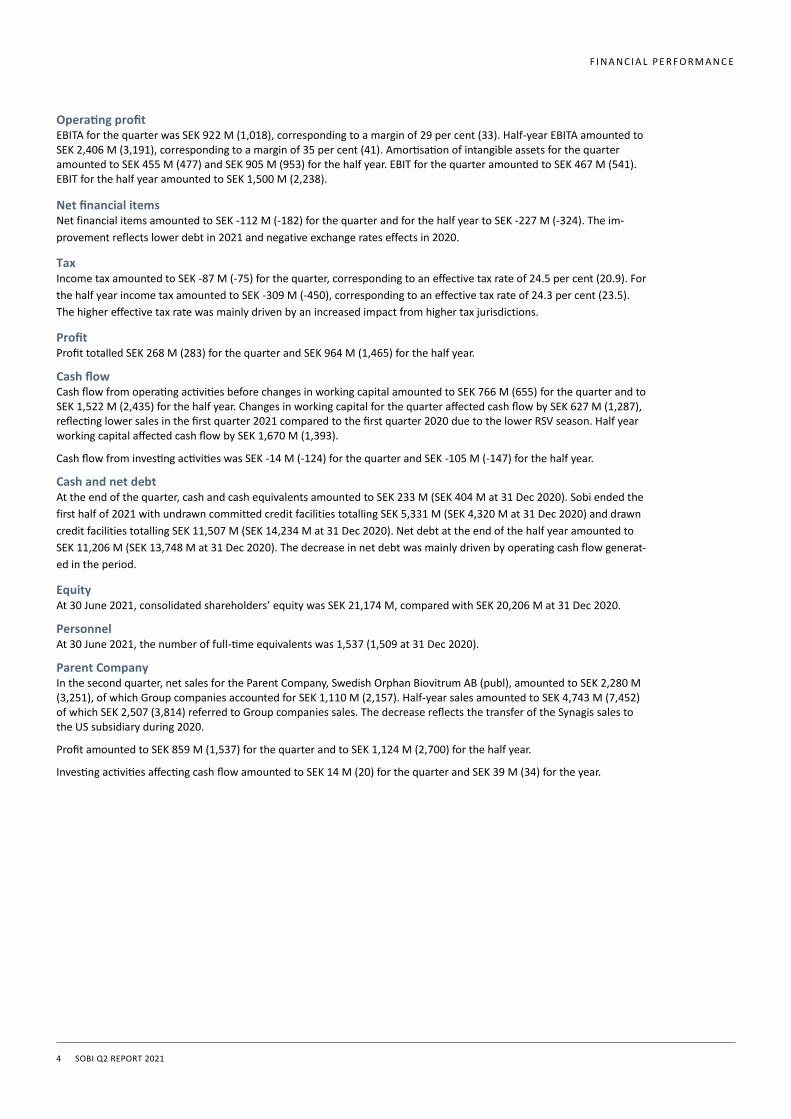
Operating profit EBITA for the quarter was SEK 922 M (1,018), corresponding to a margin of 29 per cent (33). Half-year EBITA amounted to SEK 2,406 M (3,191), corresponding to a margin of 35 per cent (41). Amortisation of intangible assets for the quarter amounted to SEK 455 M (477) and SEK 905 M (953) for the half year. EBIT for the quarter amounted to SEK 467 M (541). EBIT for the half year amounted to SEK 1,500 M (2,238).
Net financial items Net financial items amounted to SEK -112 M (-182) for the quarter and for the half year to SEK -227 M (-324). The im-
provement reflects lower debt in 2021 and negative exchange rates effects in 2020.
Tax Income tax amounted to SEK -87 M (-75) for the quarter, corresponding to an effective tax rate of 24.5 per cent (20.9). For
the half year income tax amounted to SEK -309 M (-450), corresponding to an effective tax rate of 24.3 per cent (23.5).
The higher effective tax rate was mainly driven by an increased impact from higher tax jurisdictions.
Profit Profit totalled SEK 268 M (283) for the quarter and SEK 964 M (1,465) for the half year.
Cash flow Cash flow from operating activities before changes in working capital amounted to SEK 766 M (655) for the quarter and to SEK 1,522 M (2,435) for the half year. Changes in working capital for the quarter affected cash flow by SEK 627 M (1,287), reflecting lower sales in the first quarter 2021 compared to the first quarter 2020 due to the lower RSV season. Half year working capital affected cash flow by SEK 1,670 M (1,393).
Cash flow from investing activities was SEK -14 M (-124) for the quarter and SEK -105 M (-147) for the half year.
Cash and net debt At the end of the quarter, cash and cash equivalents amounted to SEK 233 M (SEK 404 M at 31 Dec 2020). Sobi ended the
first half of 2021 with undrawn committed credit facilities totalling SEK 5,331 M (SEK 4,320 M at 31 Dec 2020) and drawn
credit facilities totalling SEK 11,507 M (SEK 14,234 M at 31 Dec 2020). Net debt at the end of the half year amounted to
SEK 11,206 M (SEK 13,748 M at 31 Dec 2020). The decrease in net debt was mainly driven by operating cash flow generat-
ed in the period.
Equity At 30 June 2021, consolidated shareholders’ equity was SEK 21,174 M, compared with SEK 20,206 M at 31 Dec 2020.
Personnel At 30 June 2021, the number of full-time equivalents was 1,537 (1,509 at 31 Dec 2020).
Parent Company In the second quarter, net sales for the Parent Company, Swedish Orphan Biovitrum AB (publ), amounted to SEK 2,280 M (3,251), of which Group companies accounted for SEK 1,110 M (2,157). Half-year sales amounted to SEK 4,743 M (7,452) of which SEK 2,507 (3,814) referred to Group companies sales. The decrease reflects the transfer of the Synagis sales to the US subsidiary during 2020.
Profit amounted to SEK 859 M (1,537) for the quarter and to SEK 1,124 M (2,700) for the half year.
Investing activities affecting cash flow amounted to SEK 14 M (20) for the quarter and SEK 39 M (34) for the year.
F I N A N C I A L P E R F O RM A N C E
5 SOBI Q2 REPORT 2021
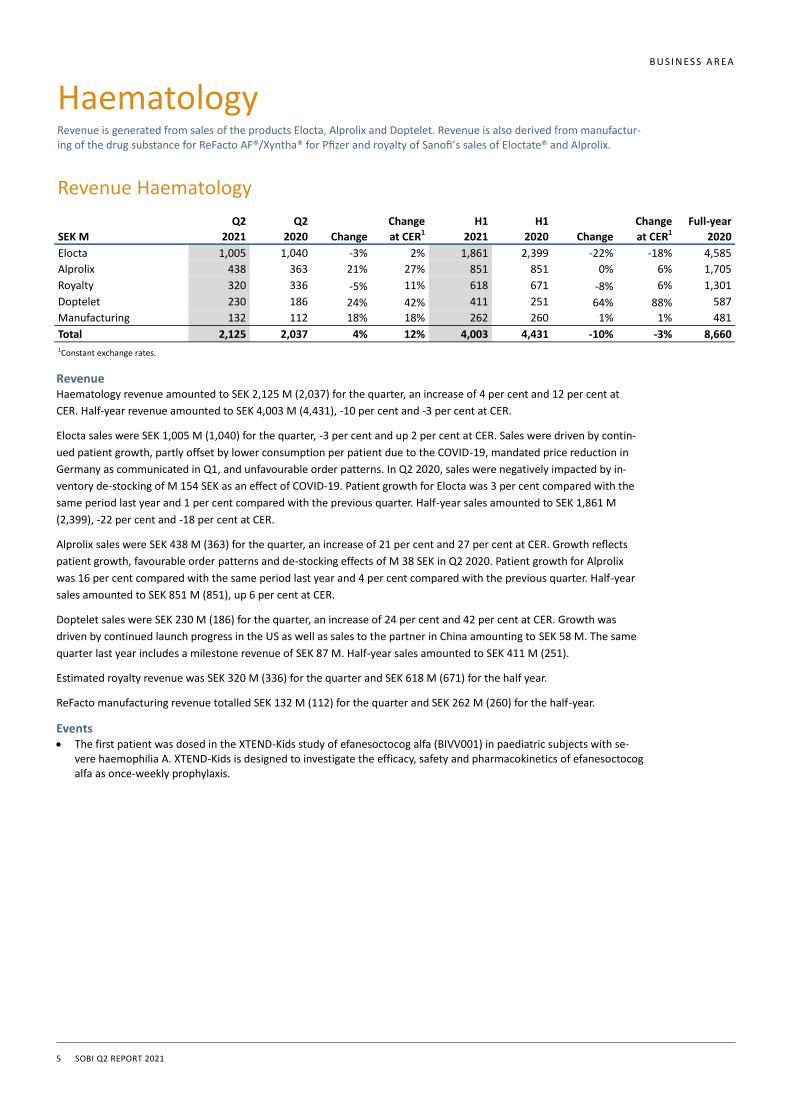
Haematology
Revenue Haematology revenue amounted to SEK 2,125 M (2,037) for the quarter, an increase of 4 per cent and 12 per cent at
CER. Half-year revenue amounted to SEK 4,003 M (4,431), -10 per cent and -3 per cent at CER.
Elocta sales were SEK 1,005 M (1,040) for the quarter, -3 per cent and up 2 per cent at CER. Sales were driven by contin-
ued patient growth, partly offset by lower consumption per patient due to the COVID-19, mandated price reduction in
Germany as communicated in Q1, and unfavourable order patterns. In Q2 2020, sales were negatively impacted by in-
ventory de-stocking of M 154 SEK as an effect of COVID-19. Patient growth for Elocta was 3 per cent compared with the
same period last year and 1 per cent compared with the previous quarter. Half-year sales amounted to SEK 1,861 M
(2,399), -22 per cent and -18 per cent at CER.
Alprolix sales were SEK 438 M (363) for the quarter, an increase of 21 per cent and 27 per cent at CER. Growth reflects
patient growth, favourable order patterns and de-stocking effects of M 38 SEK in Q2 2020. Patient growth for Alprolix
was 16 per cent compared with the same period last year and 4 per cent compared with the previous quarter. Half-year
sales amounted to SEK 851 M (851), up 6 per cent at CER.
Doptelet sales were SEK 230 M (186) for the quarter, an increase of 24 per cent and 42 per cent at CER. Growth was
driven by continued launch progress in the US as well as sales to the partner in China amounting to SEK 58 M. The same
quarter last year includes a milestone revenue of SEK 87 M. Half-year sales amounted to SEK 411 M (251).
Estimated royalty revenue was SEK 320 M (336) for the quarter and SEK 618 M (671) for the half year.
ReFacto manufacturing revenue totalled SEK 132 M (112) for the quarter and SEK 262 M (260) for the half-year.
Events • The first patient was dosed in the XTEND-Kids study of efanesoctocog alfa (BIVV001) in paediatric subjects with se-
vere haemophilia A. XTEND-Kids is designed to investigate the efficacy, safety and pharmacokinetics of efanesoctocog alfa as once-weekly prophylaxis.
B U S I N ES S A R EA
Revenue is generated from sales of the products Elocta, Alprolix and Doptelet. Revenue is also derived from manufactur-ing of the drug substance for ReFacto AF®/Xyntha® for Pfizer and royalty of Sanofi’s sales of Eloctate® and Alprolix.
Revenue Haematology
Q2 Q2 Change H1 H1 Change Full-year
SEK M 2021 2020 Change at CER1 2021 2020 Change at CER1 2020
Elocta 1,005 1,040 -3% 2% 1,861 2,399 -22% -18% 4,585
Alprolix 438 363 21% 27% 851 851 0% 6% 1,705
Royalty 320 336 -5% 11% 618 671 -8% 6% 1,301
Doptelet 230 186 24% 42% 411 251 64% 88% 587
Manufacturing 132 112 18% 18% 262 260 1% 1% 481
Total 2,125 2,037 4% 12% 4,003 4,431 -10% -3% 8,660 1Constant exchange rates.
6 SOBI Q2 REPORT 2021
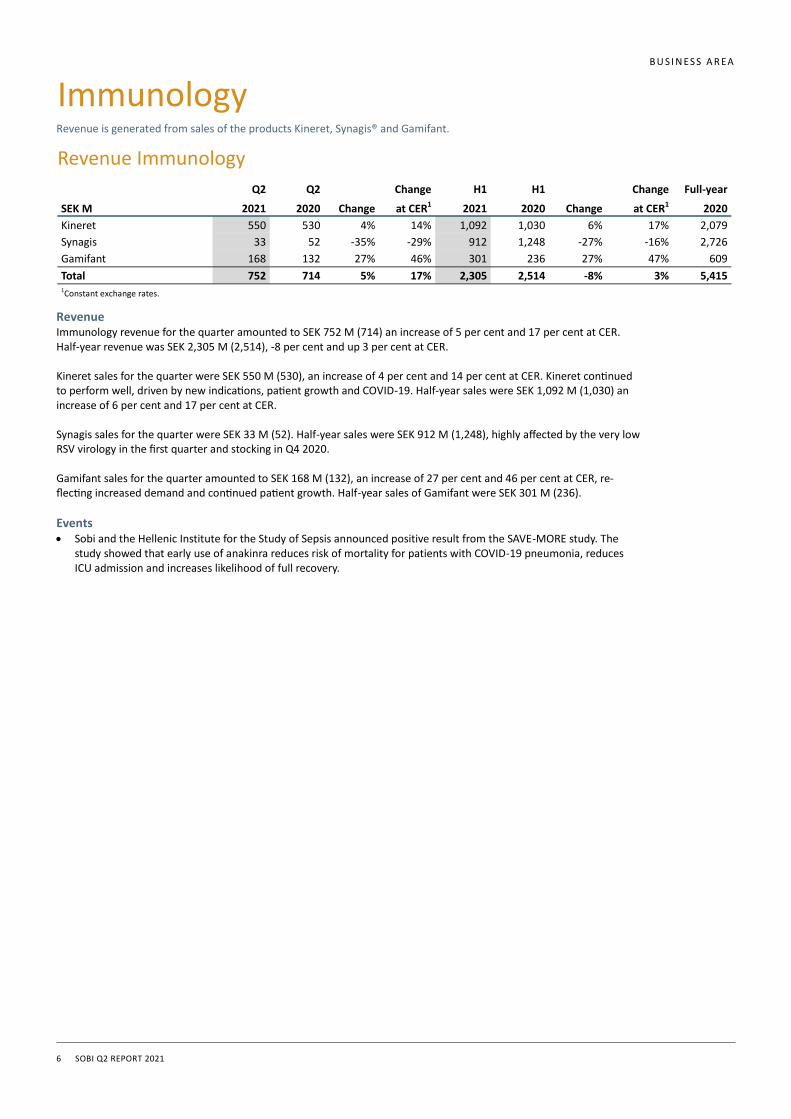
Revenue
Immunology revenue for the quarter amounted to SEK 752 M (714) an increase of 5 per cent and 17 per cent at CER. Half-year revenue was SEK 2,305 M (2,514), -8 per cent and up 3 per cent at CER. Kineret sales for the quarter were SEK 550 M (530), an increase of 4 per cent and 14 per cent at CER. Kineret continued to perform well, driven by new indications, patient growth and COVID-19. Half-year sales were SEK 1,092 M (1,030) an increase of 6 per cent and 17 per cent at CER. Synagis sales for the quarter were SEK 33 M (52). Half-year sales were SEK 912 M (1,248), highly affected by the very low RSV virology in the first quarter and stocking in Q4 2020. Gamifant sales for the quarter amounted to SEK 168 M (132), an increase of 27 per cent and 46 per cent at CER, re-flecting increased demand and continued patient growth. Half-year sales of Gamifant were SEK 301 M (236).
Events
• Sobi and the Hellenic Institute for the Study of Sepsis announced positive result from the SAVE-MORE study. The study showed that early use of anakinra reduces risk of mortality for patients with COVID-19 pneumonia, reduces ICU admission and increases likelihood of full recovery.
B U S I N ES S A R EA
Revenue is generated from sales of the products Kineret, Synagis® and Gamifant. Immunology
Revenue Immunology
Q2 Q2 Change H1 H1 Change Full-year
SEK M 2021 2020 Change at CER1 2021 2020 Change at CER1 2020
Kineret 550 530 4% 14% 1,092 1,030 6% 17% 2,079
Synagis 33 52 -35% -29% 912 1,248 -27% -16% 2,726
Gamifant 168 132 27% 46% 301 236 27% 47% 609
Total 752 714 5% 17% 2,305 2,514 -8% 3% 5,415 1Constant exchange rates.
7 SOBI Q2 REPORT 2021
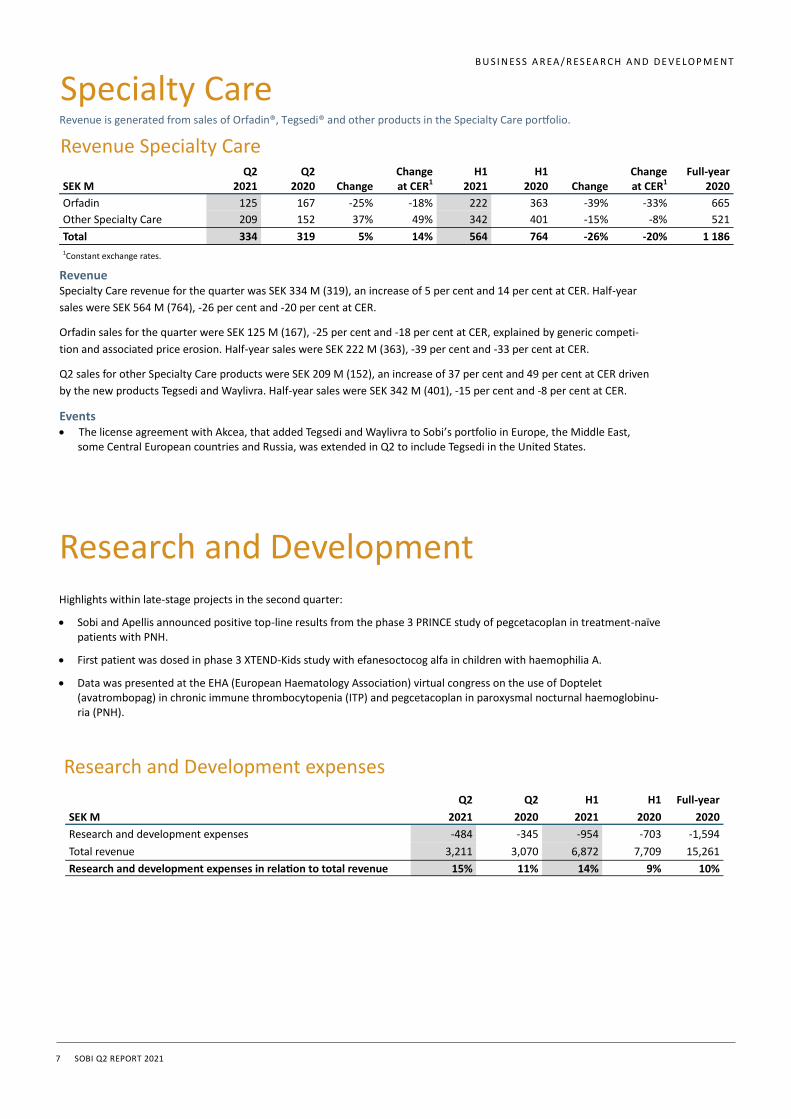
Research and Development Highlights within late-stage projects in the second quarter:
• Sobi and Apellis announced positive top-line results from the phase 3 PRINCE study of pegcetacoplan in treatment-naïve patients with PNH.
• First patient was dosed in phase 3 XTEND-Kids study with efanesoctocog alfa in children with haemophilia A.
• Data was presented at the EHA (European Haematology Association) virtual congress on the use of Doptelet (avatrombopag) in chronic immune thrombocytopenia (ITP) and pegcetacoplan in paroxysmal nocturnal haemoglobinu-ria (PNH).
Research and Development expenses
Q2 Q2 H1 H1 Full-year
SEK M 2021 2020 2021 2020 2020
Research and development expenses -484 -345 -954 -703 -1,594
Total revenue 3,211 3,070 6,872 7,709 15,261
Research and development expenses in relation to total revenue 15% 11% 14% 9% 10%
Revenue Specialty Care revenue for the quarter was SEK 334 M (319), an increase of 5 per cent and 14 per cent at CER. Half-year
sales were SEK 564 M (764), -26 per cent and -20 per cent at CER.
Orfadin sales for the quarter were SEK 125 M (167), -25 per cent and -18 per cent at CER, explained by generic competi-
tion and associated price erosion. Half-year sales were SEK 222 M (363), -39 per cent and -33 per cent at CER.
Q2 sales for other Specialty Care products were SEK 209 M (152), an increase of 37 per cent and 49 per cent at CER driven
by the new products Tegsedi and Waylivra. Half-year sales were SEK 342 M (401), -15 per cent and -8 per cent at CER.
Events • The license agreement with Akcea, that added Tegsedi and Waylivra to Sobi’s portfolio in Europe, the Middle East,
some Central European countries and Russia, was extended in Q2 to include Tegsedi in the United States.
Revenue is generated from sales of Orfadin®, Tegsedi® and other products in the Specialty Care portfolio. Specialty Care
Revenue Specialty Care Q2 Q2 Change H1 H1 Change Full-year SEK M 2021 2020 Change at CER1 2021 2020 Change at CER1 2020
Orfadin 125 167 -25% -18% 222 363 -39% -33% 665
Other Specialty Care 209 152 37% 49% 342 401 -15% -8% 521
Total 334 319 5% 14% 564 764 -26% -20% 1 186 1Constant exchange rates.
B U S I N ES S A R EA / R ES EA R C H A N D D E V E L OP M E N T
8 SOBI Q2 REPORT 2021
Other information Significant events after the reporting period In July, Kineret was submitted to EMA with a proposed indication for the treatment of coronavirus disease 2019 (COVID-19) in adult patients with pneumonia who are at risk of developing severe respiratory failure. The submission was primarily based on the investigator sponsored SAVE-MORE study. In addition, the investigator sponsored SAVE study and safety data from multiple sources support the efficacy and safety of Kineret in COVID-19 patients.
Sustainability Sobi continues to deliver on its primary contribution to social sustainability—access to medicine—with expanded access to rare disease treatments. Responsible behaviour in operations and the supply chain is continuously promoted, and Sobi engages in dialogue with internal and external stakeholders on areas covering labour rights, ethics and responsible sourcing.
Outlook 2021—unchanged The outlook for 2021 is expressed at January 2021 closing exchange rates. The negative currency impact on 2021 performance is expected to be 5-7 per cent on revenues and 6-8 per cent on EBITA compared with average full-year 2020 exchange rates.
Revenue for the full-year 2021 is expected to be in the range of SEK 14,000–15,000 M. At constant exchange rates this range corresponds to a revenue growth between -2.5 and 4.5 per cent.
EBITA margin is expected to be in the range of 30–35 per cent of revenue.
R&D expenses as a share of revenue are expected to grow to 13–15 per cent reflecting increased investments in SEL-212 and pegcetacoplan, and support for our late-stage programmes.
Forward-looking statements This report includes forward-looking statements. Actual results may differ from those stated. Internal factors such as the successful management of research programmes and intellectual property rights may affect future results. There are also external conditions such as the economic climate, political changes and competing research programmes that may affect Sobi’s results.
Financial calendar Q3 2021 28 October 2021 Q4 2021 10 February 2022
This report has not been reviewed by the Company’s auditors.
OT H E R I N F O R M AT I O N
9 SOBI Q2 REPORT 2021
Annette Clancy
Board Member
Matthew Gantz
Board Member
Staffan Schüberg
Board Member
The Board of Directors and the CEO of Swedish Orphan Biovitrum AB (publ) provide their assurance that the interim report provides a fair
and true overview of the Parent Company’s and the Group’s operations, financial position and results, and describes material risks and
uncertainties faced by the Parent Company and the companies in the Group.
Stockholm, 21 July 2021
Filippa Stenberg
Board Member
Håkan Björklund
Chairman
Helena Saxon
Board Member
Elisabeth Svanberg
Board Member
Anders Ullman
Board Member
Pia Axelson
Employee Representative
Guido Oelkers
CEO and President
Erika Husing
Employee Representative
10 SOBI Q2 REPORT 2021
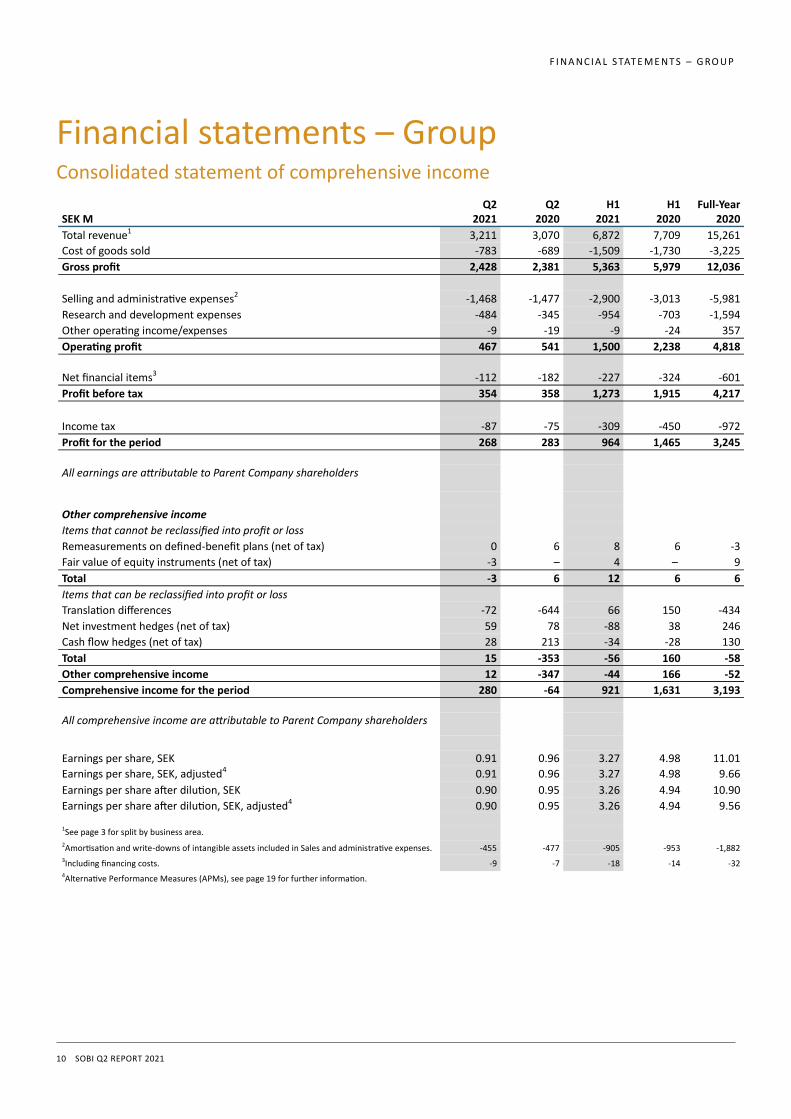
Financial statements – Group Consolidated statement of comprehensive income
F I N A N C I A L S TAT E M E N T S – G RO U P
Q2 Q2 H1 H1 Full-Year SEK M 2021 2020 2021 2020 2020
Total revenue1 3,211 3,070 6,872 7,709 15,261
Cost of goods sold -783 -689 -1,509 -1,730 -3,225
Gross profit 2,428 2,381 5,363 5,979 12,036
Selling and administrative expenses2 -1,468 -1,477 -2,900 -3,013 -5,981
Research and development expenses -484 -345 -954 -703 -1,594
Other operating income/expenses -9 -19 -9 -24 357
Operating profit 467 541 1,500 2,238 4,818
Net financial items3 -112 -182 -227 -324 -601
Profit before tax 354 358 1,273 1,915 4,217
Income tax -87 -75 -309 -450 -972
Profit for the period 268 283 964 1,465 3,245
All earnings are attributable to Parent Company shareholders
Other comprehensive income
Items that cannot be reclassified into profit or loss
Remeasurements on defined-benefit plans (net of tax) 0 6 8 6 -3
Fair value of equity instruments (net of tax) -3 – 4 – 9
Total -3 6 12 6 6
Items that can be reclassified into profit or loss
Translation differences -72 -644 66 150 -434
Net investment hedges (net of tax) 59 78 -88 38 246
Cash flow hedges (net of tax) 28 213 -34 -28 130
Total 15 -353 -56 160 -58
Other comprehensive income 12 -347 -44 166 -52
Comprehensive income for the period 280 -64 921 1,631 3,193
All comprehensive income are attributable to Parent Company shareholders
Earnings per share, SEK 0.91 0.96 3.27 4.98 11.01
Earnings per share, SEK, adjusted4 0.91 0.96 3.27 4.98 9.66
Earnings per share after dilution, SEK 0.90 0.95 3.26 4.94 10.90
Earnings per share after dilution, SEK, adjusted4 0.90 0.95 3.26 4.94 9.56 1See page 3 for split by business area. 2Amortisation and write-downs of intangible assets included in Sales and administrative expenses. -455 -477 -905 -953 -1,882 3Including financing costs. -9 -7 -18 -14 -32 4Alternative Performance Measures (APMs), see page 19 for further information.
11 SOBI Q2 REPORT 2021
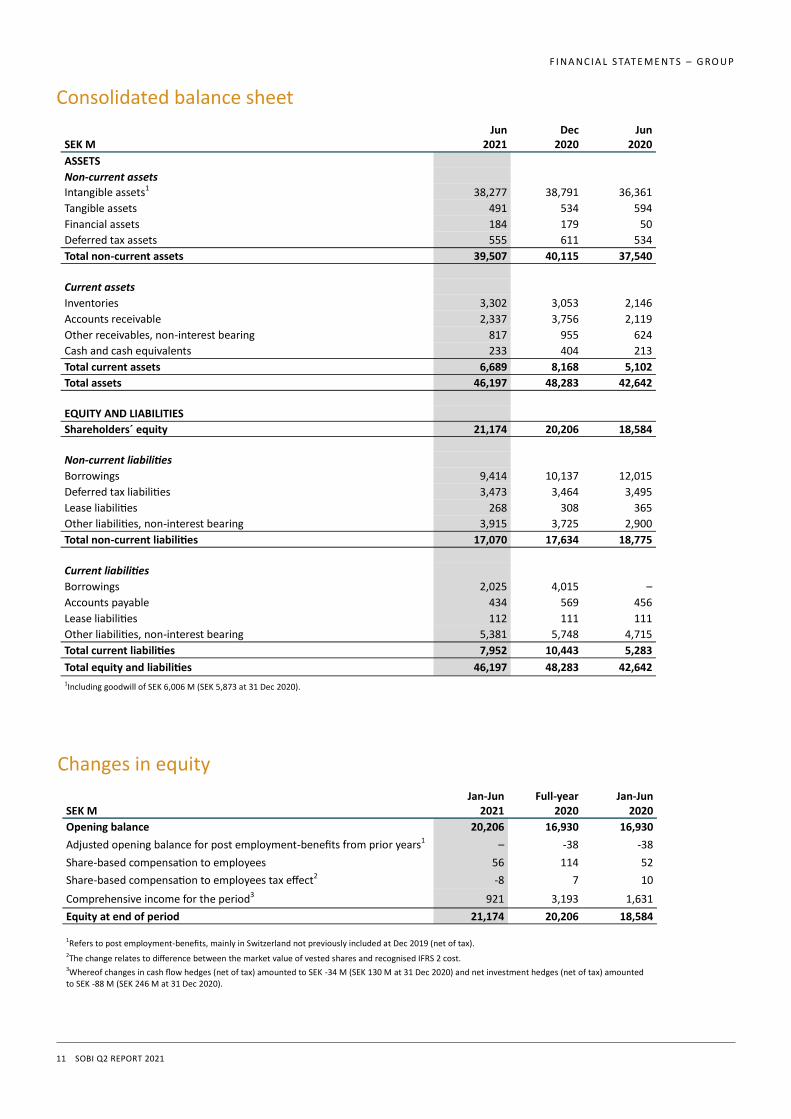
Consolidated balance sheet
F I N A N C I A L S TAT E M E N T S – G RO U P
Changes in equity
Jun Dec Jun SEK M 2021 2020 2020
ASSETS
Non-current assets
Intangible assets1 38,277 38,791 36,361
Tangible assets 491 534 594
Financial assets 184 179 50
Deferred tax assets 555 611 534
Total non-current assets 39,507 40,115 37,540
Current assets
Inventories 3,302 3,053 2,146
Accounts receivable 2,337 3,756 2,119
Other receivables, non-interest bearing 817 955 624
Cash and cash equivalents 233 404 213
Total current assets 6,689 8,168 5,102
Total assets 46,197 48,283 42,642
EQUITY AND LIABILITIES
Shareholders´ equity 21,174 20,206 18,584
Non-current liabilities
Borrowings 9,414 10,137 12,015
Deferred tax liabilities 3,473 3,464 3,495
Lease liabilities 268 308 365
Other liabilities, non-interest bearing 3,915 3,725 2,900
Total non-current liabilities 17,070 17,634 18,775
Current liabilities
Borrowings 2,025 4,015 –
Accounts payable 434 569 456
Lease liabilities 112 111 111
Other liabilities, non-interest bearing 5,381 5,748 4,715
Total current liabilities 7,952 10,443 5,283
Total equity and liabilities 46,197 48,283 42,642 1Including goodwill of SEK 6,006 M (SEK 5,873 at 31 Dec 2020).
Jan-Jun Full-year Jan-Jun SEK M 2021 2020 2020
Opening balance 20,206 16,930 16,930
Adjusted opening balance for post employment-benefits from prior years1 – -38 -38
Share-based compensation to employees 56 114 52
Share-based compensation to employees tax effect2 -8 7 10
Comprehensive income for the period3 921 3,193 1,631
Equity at end of period 21,174 20,206 18,584 1Refers to post employment-benefits, mainly in Switzerland not previously included at Dec 2019 (net of tax). 2The change relates to difference between the market value of vested shares and recognised IFRS 2 cost. 3Whereof changes in cash flow hedges (net of tax) amounted to SEK -34 M (SEK 130 M at 31 Dec 2020) and net investment hedges (net of tax) amounted to SEK -88 M (SEK 246 M at 31 Dec 2020).
12 SOBI Q2 REPORT 2021
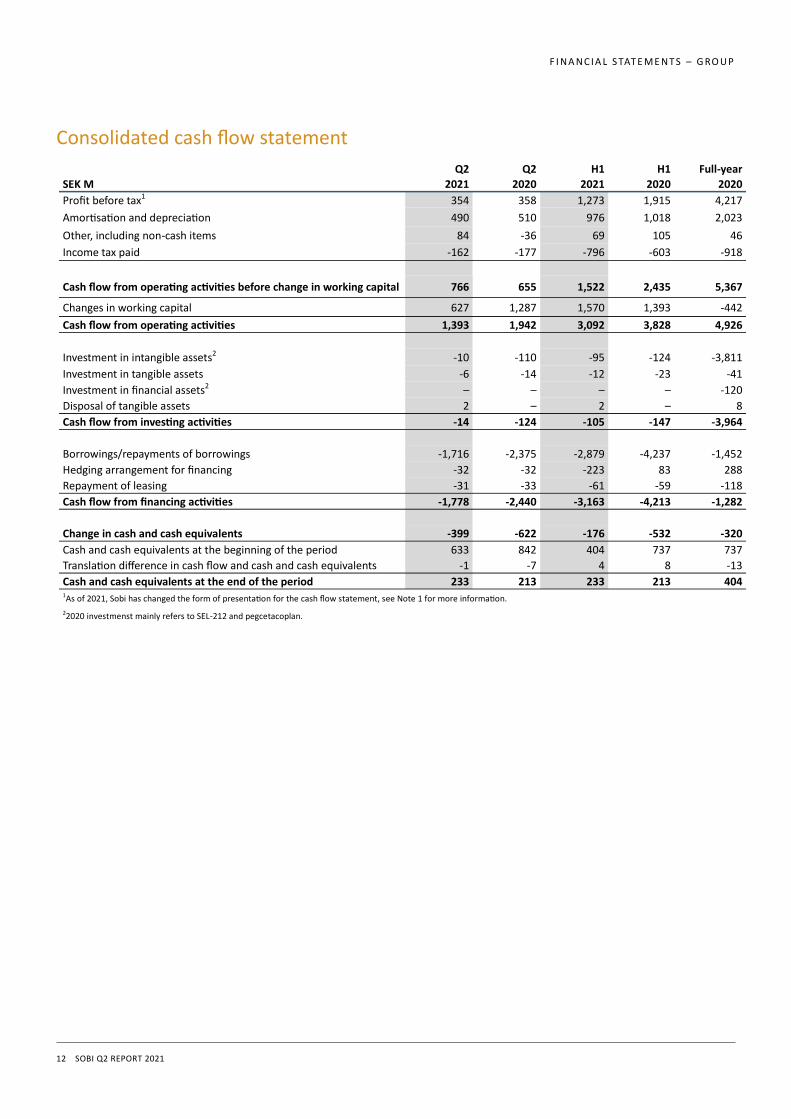
Consolidated cash flow statement
F I N A N C I A L S TAT E M E N T S – G RO U P
Q2 Q2 H1 H1 Full-year
SEK M 2021 2020 2021 2020 2020
Profit before tax1 354 358 1,273 1,915 4,217
Amortisation and depreciation 490 510 976 1,018 2,023
Other, including non-cash items 84 -36 69 105 46
Income tax paid -162 -177 -796 -603 -918
Cash flow from operating activities before change in working capital 766 655 1,522 2,435 5,367
Changes in working capital 627 1,287 1,570 1,393 -442
Cash flow from operating activities 1,393 1,942 3,092 3,828 4,926
Investment in intangible assets2 -10 -110 -95 -124 -3,811
Investment in tangible assets -6 -14 -12 -23 -41
Investment in financial assets2 – – – – -120
Disposal of tangible assets 2 – 2 – 8
Cash flow from investing activities -14 -124 -105 -147 -3,964
Borrowings/repayments of borrowings -1,716 -2,375 -2,879 -4,237 -1,452
Hedging arrangement for financing -32 -32 -223 83 288
Repayment of leasing -31 -33 -61 -59 -118
Cash flow from financing activities -1,778 -2,440 -3,163 -4,213 -1,282
Change in cash and cash equivalents -399 -622 -176 -532 -320
Cash and cash equivalents at the beginning of the period 633 842 404 737 737
Translation difference in cash flow and cash and cash equivalents -1 -7 4 8 -13
Cash and cash equivalents at the end of the period 233 213 233 213 404 1As of 2021, Sobi has changed the form of presentation for the cash flow statement, see Note 1 for more information.
22020 investmenst mainly refers to SEL-212 and pegcetacoplan.
13 SOBI Q2 REPORT 2021
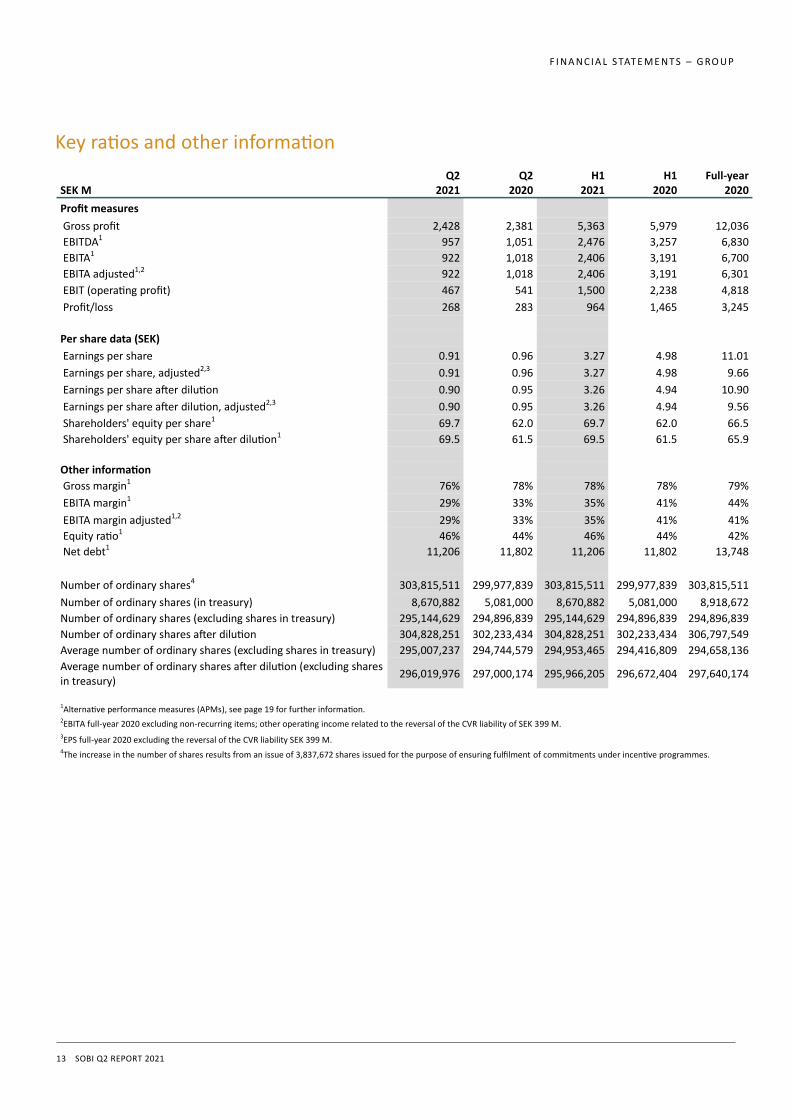
Key ratios and other information
F I N A N C I A L S TAT E M E N T S – G RO U P
Q2 Q2 H1 H1 Full-year SEK M 2021 2020 2021 2020 2020
Profit measures
Gross profit 2,428 2,381 5,363 5,979 12,036
EBITDA1 957 1,051 2,476 3,257 6,830
EBITA1 922 1,018 2,406 3,191 6,700
EBITA adjusted1,2 922 1,018 2,406 3,191 6,301
EBIT (operating profit) 467 541 1,500 2,238 4,818
Profit/loss 268 283 964 1,465 3,245
Per share data (SEK)
Earnings per share 0.91 0.96 3.27 4.98 11.01
Earnings per share, adjusted2,3 0.91 0.96 3.27 4.98 9.66
Earnings per share after dilution 0.90 0.95 3.26 4.94 10.90
Earnings per share after dilution, adjusted2,3 0.90 0.95 3.26 4.94 9.56
Shareholders' equity per share1 69.7 62.0 69.7 62.0 66.5
Shareholders' equity per share after dilution1 69.5 61.5 69.5 61.5 65.9
Other information
Gross margin1 76% 78% 78% 78% 79%
EBITA margin1 29% 33% 35% 41% 44%
EBITA margin adjusted1,2 29% 33% 35% 41% 41%
Equity ratio1 46% 44% 46% 44% 42%
Net debt1 11,206 11,802 11,206 11,802 13,748
Number of ordinary shares4 303,815,511 299,977,839 303,815,511 299,977,839 303,815,511
Number of ordinary shares (in treasury) 8,670,882 5,081,000 8,670,882 5,081,000 8,918,672
Number of ordinary shares (excluding shares in treasury) 295,144,629 294,896,839 295,144,629 294,896,839 294,896,839
Number of ordinary shares after dilution 304,828,251 302,233,434 304,828,251 302,233,434 306,797,549
Average number of ordinary shares (excluding shares in treasury) 295,007,237 294,744,579 294,953,465 294,416,809 294,658,136
Average number of ordinary shares after dilution (excluding shares in treasury)
296,019,976 297,000,174 295,966,205 296,672,404 297,640,174
1Alternative performance measures (APMs), see page 19 for further information. 2EBITA full-year 2020 excluding non-recurring items; other operating income related to the reversal of the CVR liability of SEK 399 M.
3EPS full-year 2020 excluding the reversal of the CVR liability SEK 399 M. 4The increase in the number of shares results from an issue of 3,837,672 shares issued for the purpose of ensuring fulfilment of commitments under incentive programmes.
14 SOBI Q2 REPORT 2021
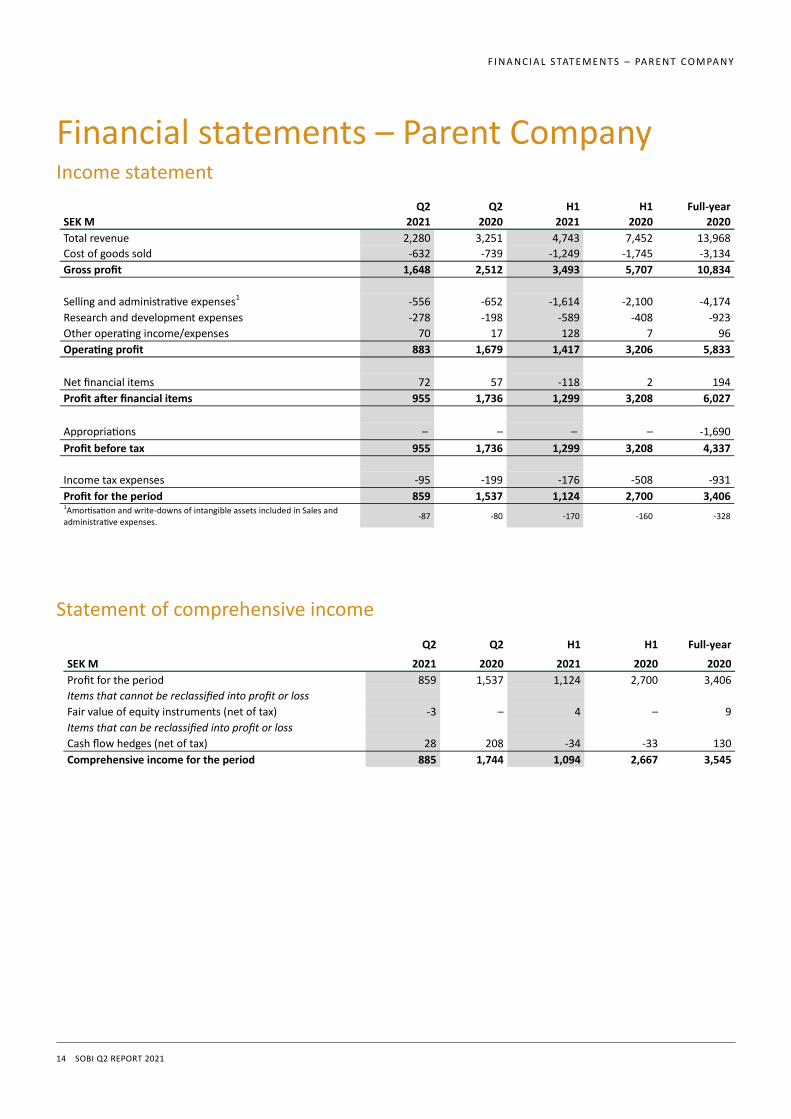
Financial statements – Parent Company Income statement
F I N A N C I A L S TAT E M E N T S – PA R E N T C O M PA N Y
Statement of comprehensive income
Q2 Q2 H1 H1 Full-year
SEK M 2021 2020 2021 2020 2020
Total revenue 2,280 3,251 4,743 7,452 13,968
Cost of goods sold -632 -739 -1,249 -1,745 -3,134
Gross profit 1,648 2,512 3,493 5,707 10,834
Selling and administrative expenses1 -556 -652 -1,614 -2,100 -4,174
Research and development expenses -278 -198 -589 -408 -923
Other operating income/expenses 70 17 128 7 96
Operating profit 883 1,679 1,417 3,206 5,833
Net financial items 72 57 -118 2 194
Profit after financial items 955 1,736 1,299 3,208 6,027
Appropriations – – – – -1,690
Profit before tax 955 1,736 1,299 3,208 4,337
Income tax expenses -95 -199 -176 -508 -931
Profit for the period 859 1,537 1,124 2,700 3,406 1Amortisation and write-downs of intangible assets included in Sales and administrative expenses.
-87 -80 -170 -160 -328
Q2 Q2 H1 H1 Full-year
SEK M 2021 2020 2021 2020 2020
Profit for the period 859 1,537 1,124 2,700 3,406
Items that cannot be reclassified into profit or loss
Fair value of equity instruments (net of tax) -3 – 4 – 9
Items that can be reclassified into profit or loss
Cash flow hedges (net of tax) 28 208 -34 -33 130
Comprehensive income for the period 885 1,744 1,094 2,667 3,545
15 SOBI Q2 REPORT 2021
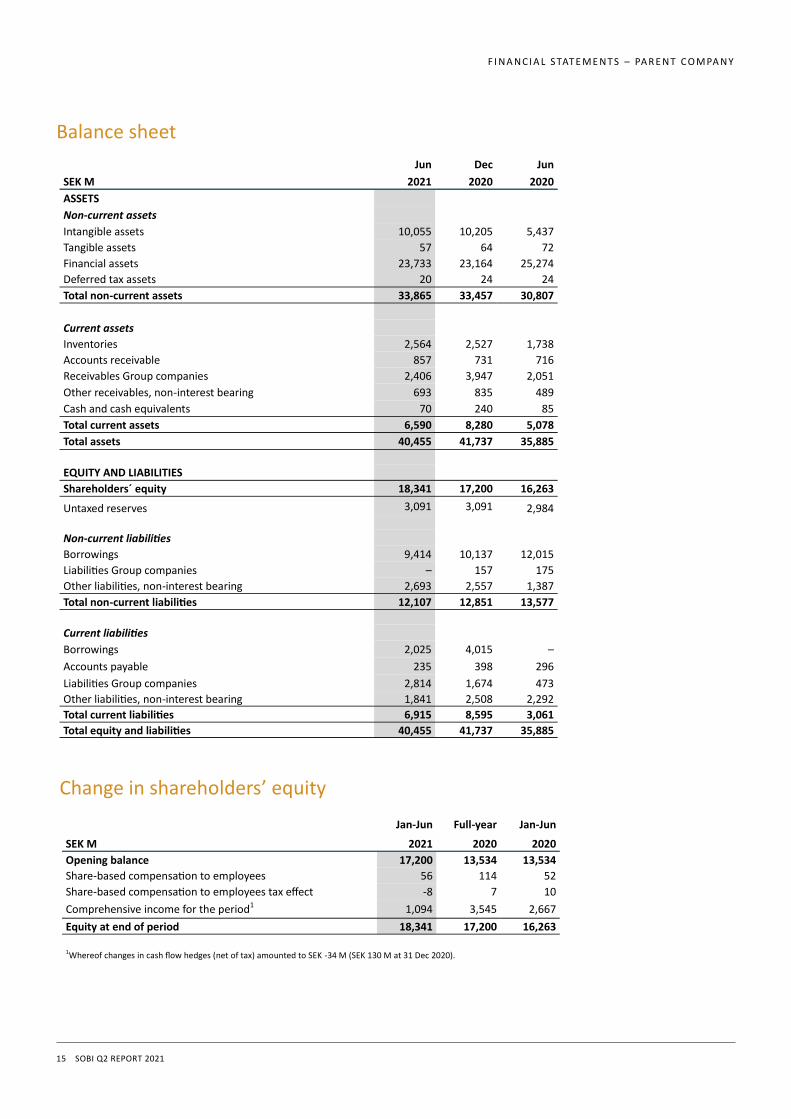
Balance sheet
F I N A N C I A L S TAT E M E N T S – PA R E N T C O M PA N Y
Change in shareholders’ equity
Jun Dec Jun
SEK M 2021 2020 2020
ASSETS
Non-current assets
Intangible assets 10,055 10,205 5,437
Tangible assets 57 64 72
Financial assets 23,733 23,164 25,274
Deferred tax assets 20 24 24
Total non-current assets 33,865 33,457 30,807
Current assets
Inventories 2,564 2,527 1,738
Accounts receivable 857 731 716
Receivables Group companies 2,406 3,947 2,051
Other receivables, non-interest bearing 693 835 489
Cash and cash equivalents 70 240 85
Total current assets 6,590 8,280 5,078
Total assets 40,455 41,737 35,885
EQUITY AND LIABILITIES
Shareholders´ equity 18,341 17,200 16,263
Untaxed reserves 3,091 3,091 2,984
Non-current liabilities
Borrowings 9,414 10,137 12,015
Liabilities Group companies – 157 175
Other liabilities, non-interest bearing 2,693 2,557 1,387
Total non-current liabilities 12,107 12,851 13,577
Current liabilities
Borrowings 2,025 4,015 –
Accounts payable 235 398 296
Liabilities Group companies 2,814 1,674 473
Other liabilities, non-interest bearing 1,841 2,508 2,292
Total current liabilities 6,915 8,595 3,061
Total equity and liabilities 40,455 41,737 35,885
Jan-Jun Full-year Jan-Jun
SEK M 2021 2020 2020
Opening balance 17,200 13,534 13,534
Share-based compensation to employees 56 114 52
Share-based compensation to employees tax effect -8 7 10
Comprehensive income for the period1 1,094 3,545 2,667
Equity at end of period 18,341 17,200 16,263
1Whereof changes in cash flow hedges (net of tax) amounted to SEK -34 M (SEK 130 M at 31 Dec 2020).
16 SOBI Q2 REPORT 2021
Notes Note 1 Accounting policies and measurement bases and other information
Accounting policies This interim report has been prepared in accordance with IAS 34 and the Swedish Annual Accounts Act. The consolidated financial statements have been prepared in accordance with International Financial Reporting Standards (IFRS) and the International Financial Reporting Interpretations Committee (IFRIC) as adopted by the EU. The Parent Company applies the Annual Accounts Act and the Swedish Financial Reporting Board’s Recommendation RFR 2 Accounting for Legal Entities. The accounting policies apply with those described in the 2020 Annual and Sustainability Report. IASB has published amendments of standards that are effective as of 1 January 2021 or later. The standards have not had any material impact on the consolidated financial statements.
More detailed information about the Group’s accounting policies and measurement bases can be found in the 2020 Annual and Sustainability Report, available at www.sobi.com.
Cash flow statement As of 2021, Sobi has changed the form of presentation for the cash flow statement and reclassified hedging arrangements for financing from cash flow from operating activities to cash flow from financing activities. Comparative figures for 2020 have been recalculated, whereby the cash flow from operating activities for the period April-June 2020 has been adjusted from SEK 1,911 M to SEK 1,942 M, period January-June 2020 has been adjusted from SEK 3,912 M to SEK 3,828 M and for the full-year 2020 from SEK 5,214 M to SEK 4,926 M. Cash-flow from financing activities has been adjusted for the corresponding periods from SEK -2,409 M to SEK -2,440 M, SEK -4,297 M to SEK -4,213 M and from SEK -1,570 M to -1,282, respectively.
Risks and uncertainties Sobi is exposed to a number of risks in its operations. Effective risk management aligns Sobi’s business opportunities and profit with shareholders’ and other stakeholders’ demands for stable, long-term value growth and control. Key risk areas are summarised below:
• Pandemics and other external events
• Strategic and operational risk
• Commercialisation and business environment
• Financial and reporting risk
• Compliance risk More information about risk exposure and risk management is included in Sobi’s 2020 Annual and Sustainability Report.
N OT ES
17 SOBI Q2 REPORT 2021
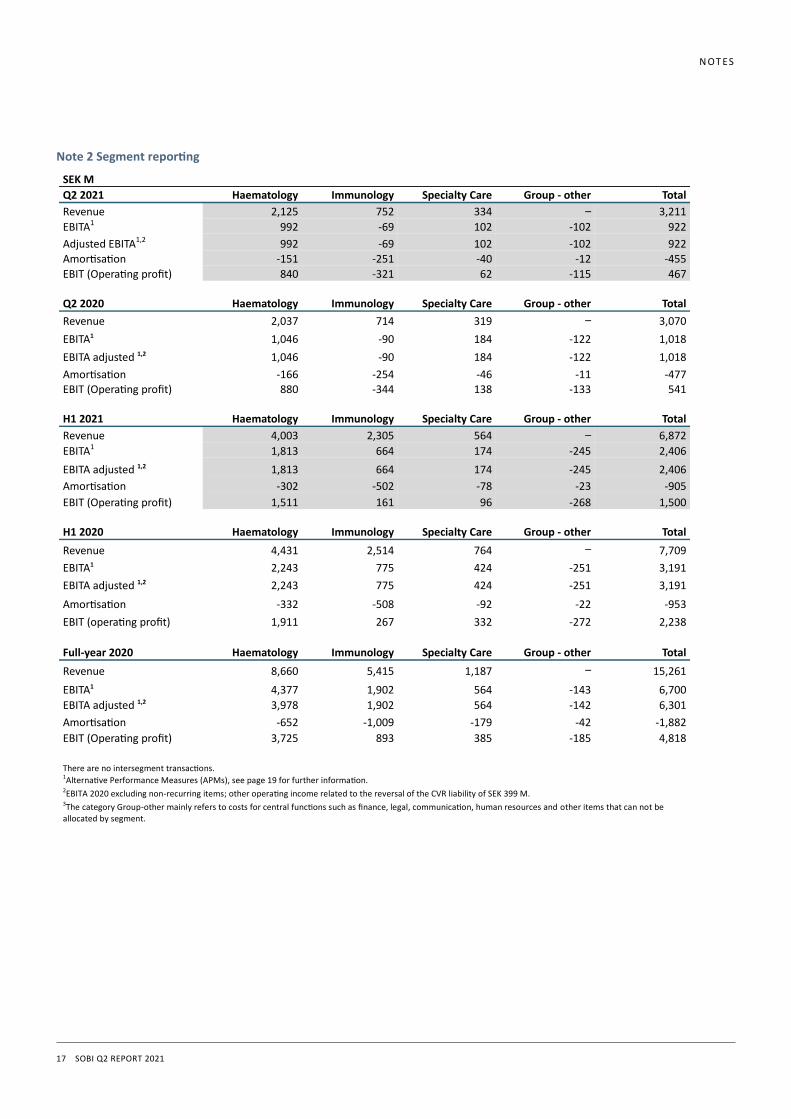
Note 2 Segment reporting
N OT ES
SEK M
Q2 2021 Haematology Immunology Specialty Care Group - other Total
Revenue 2,125 752 334 – 3,211
EBITA1 992 -69 102 -102 922
Adjusted EBITA1,2 992 -69 102 -102 922
Amortisation -151 -251 -40 -12 -455
EBIT (Operating profit) 840 -321 62 -115 467
Q2 2020 Haematology Immunology Specialty Care Group - other Total
Revenue 2,037 714 319 – 3,070
EBITA1 1,046 -90 184 -122 1,018
EBITA adjusted 1,2 1,046 -90 184 -122 1,018
Amortisation -166 -254 -46 -11 -477 EBIT (Operating profit) 880 -344 138 -133 541
H1 2021 Haematology Immunology Specialty Care Group - other Total
Revenue 4,003 2,305 564 – 6,872
EBITA1 1,813 664 174 -245 2,406
EBITA adjusted 1,2 1,813 664 174 -245 2,406
Amortisation -302 -502 -78 -23 -905
EBIT (Operating profit) 1,511 161 96 -268 1,500
H1 2020 Haematology Immunology Specialty Care Group - other Total
Revenue 4,431 2,514 764 – 7,709
EBITA1 2,243 775 424 -251 3,191
EBITA adjusted 1,2 2,243 775 424 -251 3,191
Amortisation -332 -508 -92 -22 -953
EBIT (operating profit) 1,911 267 332 -272 2,238
Full-year 2020 Haematology Immunology Specialty Care Group - other Total
Revenue 8,660 5,415 1,187 – 15,261
EBITA1 4,377 1,902 564 -143 6,700
EBITA adjusted 1,2 3,978 1,902 564 -142 6,301
Amortisation -652 -1,009 -179 -42 -1,882
EBIT (Operating profit) 3,725 893 385 -185 4,818
There are no intersegment transactions. 1Alternative Performance Measures (APMs), see page 19 for further information. 2EBITA 2020 excluding non-recurring items; other operating income related to the reversal of the CVR liability of SEK 399 M. 3The category Group-other mainly refers to costs for central functions such as finance, legal, communication, human resources and other items that can not be allocated by segment.
18 SOBI Q2 REPORT 2021
N OT E S
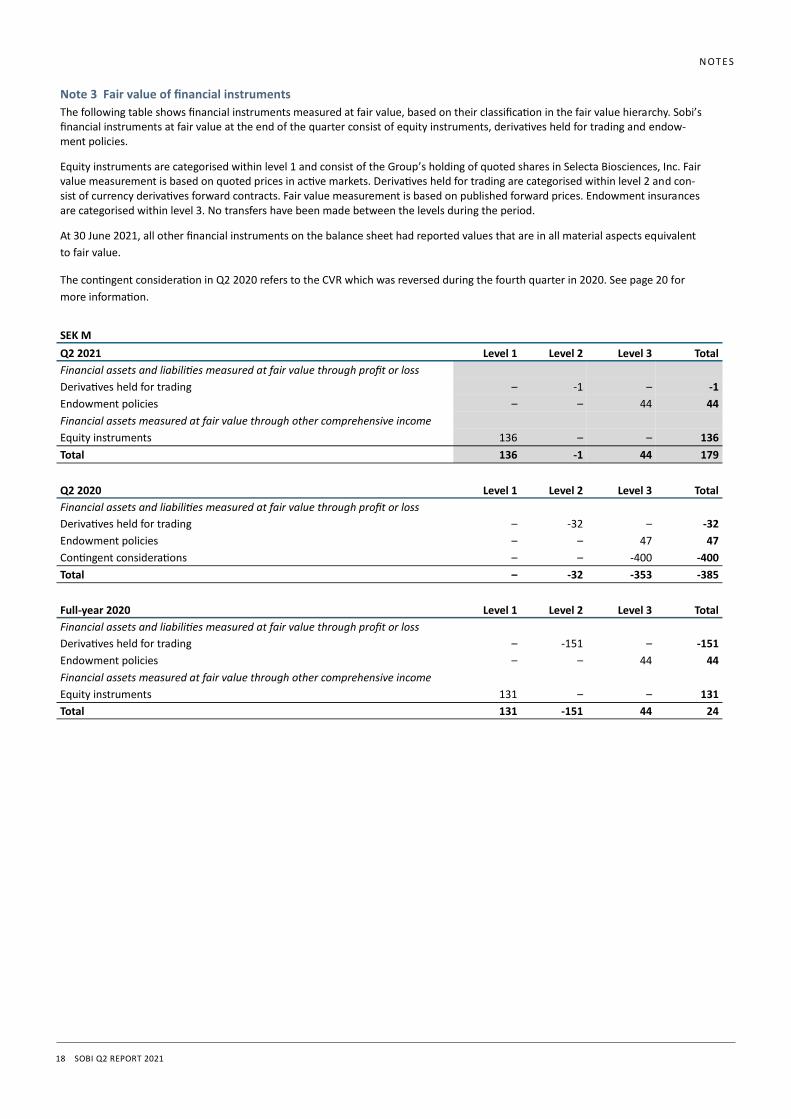
Note 3 Fair value of financial instruments
The following table shows financial instruments measured at fair value, based on their classification in the fair value hierarchy. Sobi’s financial instruments at fair value at the end of the quarter consist of equity instruments, derivatives held for trading and endow-ment policies.
Equity instruments are categorised within level 1 and consist of the Group’s holding of quoted shares in Selecta Biosciences, Inc. Fair value measurement is based on quoted prices in active markets. Derivatives held for trading are categorised within level 2 and con-sist of currency derivatives forward contracts. Fair value measurement is based on published forward prices. Endowment insurances are categorised within level 3. No transfers have been made between the levels during the period.
At 30 June 2021, all other financial instruments on the balance sheet had reported values that are in all material aspects equivalent
to fair value.
The contingent consideration in Q2 2020 refers to the CVR which was reversed during the fourth quarter in 2020. See page 20 for
more information.
SEK M
Q2 2021 Level 1 Level 2 Level 3 Total
Financial assets and liabilities measured at fair value through profit or loss
Derivatives held for trading – -1 – -1
Endowment policies – – 44 44
Financial assets measured at fair value through other comprehensive income
Equity instruments 136 – – 136
Total 136 -1 44 179
Q2 2020 Level 1 Level 2 Level 3 Total
Financial assets and liabilities measured at fair value through profit or loss
Derivatives held for trading – -32 – -32
Endowment policies – – 47 47
Contingent considerations – – -400 -400
Total – -32 -353 -385
Full-year 2020 Level 1 Level 2 Level 3 Total
Financial assets and liabilities measured at fair value through profit or loss
Derivatives held for trading – -151 – -151
Endowment policies – – 44 44
Financial assets measured at fair value through other comprehensive income
Equity instruments 131 – – 131
Total 131 -151 44 24
19 SOBI Q2 REPORT 2021
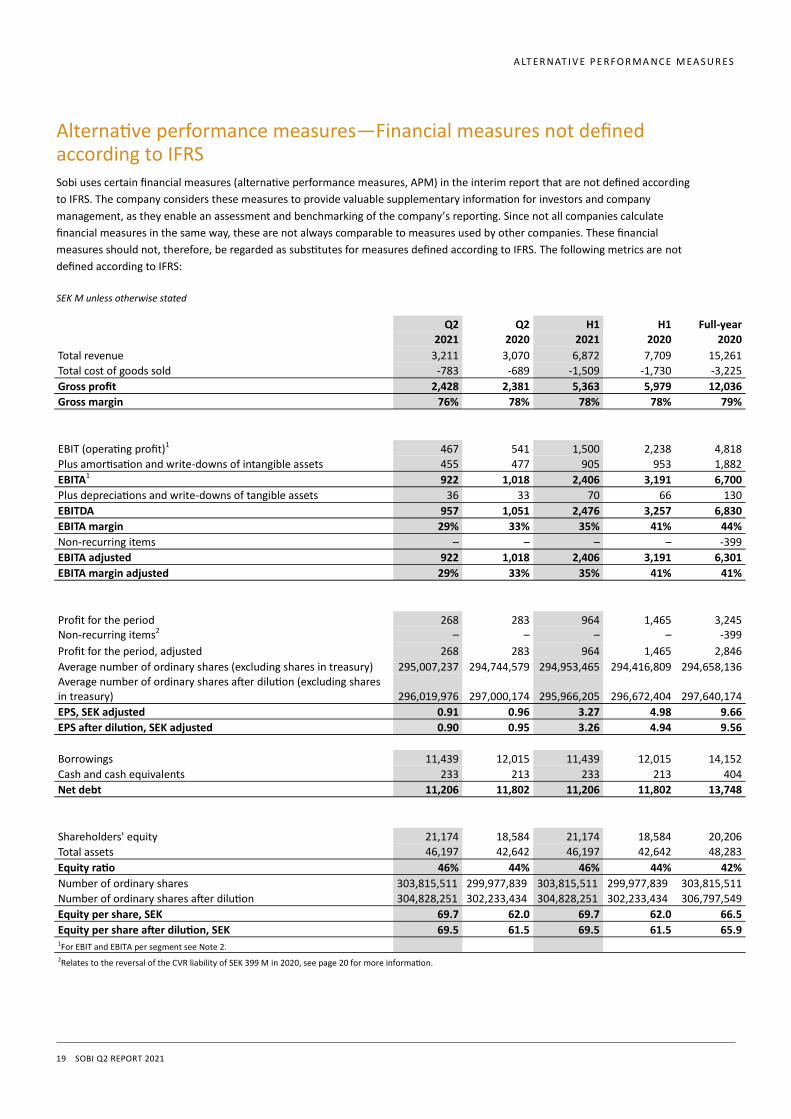
Alternative performance measures—Financial measures not defined according to IFRS Sobi uses certain financial measures (alternative performance measures, APM) in the interim report that are not defined according
to IFRS. The company considers these measures to provide valuable supplementary information for investors and company
management, as they enable an assessment and benchmarking of the company’s reporting. Since not all companies calculate
financial measures in the same way, these are not always comparable to measures used by other companies. These financial
measures should not, therefore, be regarded as substitutes for measures defined according to IFRS. The following metrics are not
defined according to IFRS:
A LT E R N AT I V E P E RF O R M A N C E M EA S U R ES
SEK M unless otherwise stated
Q2 Q2 H1 H1 Full-year
2021 2020 2021 2020 2020
Total revenue 3,211 3,070 6,872 7,709 15,261
Total cost of goods sold -783 -689 -1,509 -1,730 -3,225
Gross profit 2,428 2,381 5,363 5,979 12,036
Gross margin 76% 78% 78% 78% 79%
EBIT (operating profit)1 467 541 1,500 2,238 4,818
Plus amortisation and write-downs of intangible assets 455 477 905 953 1,882
EBITA1 922 1,018 2,406 3,191 6,700
Plus depreciations and write-downs of tangible assets 36 33 70 66 130
EBITDA 957 1,051 2,476 3,257 6,830
EBITA margin 29% 33% 35% 41% 44%
Non-recurring items – – – – -399
EBITA adjusted 922 1,018 2,406 3,191 6,301
EBITA margin adjusted 29% 33% 35% 41% 41%
Profit for the period 268 283 964 1,465 3,245 Non-recurring items2 – – – – -399
Profit for the period, adjusted 268 283 964 1,465 2,846
Average number of ordinary shares (excluding shares in treasury) 295,007,237 294,744,579 294,953,465 294,416,809 294,658,136 Average number of ordinary shares after dilution (excluding shares in treasury) 296,019,976 297,000,174 295,966,205 296,672,404 297,640,174
EPS, SEK adjusted 0.91 0.96 3.27 4.98 9.66
EPS after dilution, SEK adjusted 0.90 0.95 3.26 4.94 9.56
Borrowings 11,439 12,015 11,439 12,015 14,152
Cash and cash equivalents 233 213 233 213 404
Net debt 11,206 11,802 11,206 11,802 13,748
Shareholders' equity 21,174 18,584 21,174 18,584 20,206
Total assets 46,197 42,642 46,197 42,642 48,283
Equity ratio 46% 44% 46% 44% 42%
Number of ordinary shares 303,815,511 299,977,839 303,815,511 299,977,839 303,815,511
Number of ordinary shares after dilution 304,828,251 302,233,434 304,828,251 302,233,434 306,797,549
Equity per share, SEK 69.7 62.0 69.7 62.0 66.5
Equity per share after dilution, SEK 69.5 61.5 69.5 61.5 65.9 1For EBIT and EBITA per segment see Note 2. 2Relates to the reversal of the CVR liability of SEK 399 M in 2020, see page 20 for more information.
20 SOBI Q2 REPORT 2021
Definitions—financial terms
D E F I N I T I O N S A N D G LO S S A RY
CER Constant exchange rates
CVR Following the completion of Sobi’s acquisition of Dova Pharmaceuticals, Inc. (Dova) on 12
November 2019, Dova shareholders were provided one non-transferrable Contingent Value Right
(CVR) to an additional USD 1.50 per share to be paid upon approval of Doptelet for use in
chemotherapy-induced thrombocytopenia (CIT) by the FDA. On 9 October 2020, Sobi announced
topline results for phase 3 CIT study of avatrombopag. The primary endpoints were not met and
Sobi estimates that the conditions of the CVR will not be met. Consequently, the corresponding
liability on the balance sheet was reversed, positively impacting other operating income by SEK
399 M.
Earnings per share The portion of a company’s profit allocated to each outstanding share of common stock
EBIT (Operating profit) Earnings before interest and tax
EBITA Earnings before interest, tax and amortisation
EBITA margin, % EBITA as a percentage of total revenue
EBITA adjusted EBITA less non-recurring items
EBITA margin adjusted, % EBITA adjusted as a percentage of total revenue
EBITDA Earnings before interest, tax, depreciation, amortisation and write-downs
EPS, adjusted Profit for the period, adjusted, divided by average number of ordinary shares
EPS after dilution, adjusted Profit for the period, adjusted, divided by average number of ordinary shares after dilution
Equity ratio Shareholders’ equity as a proportion of total assets
Equity per share Equity divided by the number of ordinary shares
Equity per share after dilution Equity divided by the number of ordinary shares after dilution
Full-time equivalents Unit that indicates the workload of an employed person in a way that makes workloads
comparable
Gross profit Total revenue less cost of goods sold
Gross margin Gross profit as a percentage of total revenue
IFRS International Financial Reporting Standards
Net debt Borrowings less Cash and cash equivalents
Non-recurring items Refers to items that have no clear connection with the ordinary operations and are of such a type
that it cannot be expected to occur often or regularly and that it is an item of significant value. This
may, for example, refer to capital gains/losses from divestments, restructuring initiatives,
impairments and other unusual one-time income and expenses.
21 SOBI Q2 REPORT 2021
Glossary
D E F I N I T I O N S A N D G LO S S A RY
Alprolix (eftrenonacog alfa)
A recombinant, extended half-life (EHL) clotting factor IX therapy approved in the EU, Iceland, Kuwait, Liechtenstein, Norway, Saudi Arabia and Switzerland, as well as in Australia, Brazil, Canada, Japan, New Zealand, the United States and other countries, for the treatment of haemophilia B.
BIVV001, efanesoctocog alfa A novel, investigational factor VIII therapy designed to extend protection from bleeds with prophylactic dosing of once weekly or longer intervals for people with haemophilia A. Builds on the Fc fusion technology by adding a region of von Willebrand factor and XTEN polypeptides to potentially extend its time in circulation.
Chronic immune thrombocytopenia (ITP)
A rare autoimmune bleeding disorder characterised by a low number of platelets, affecting approximately 60,000 adults in the United States.
Chronic liver disease (CLD) Liver disease becomes chronic when it has been present for more than 6-12 months without signs of resolution. Chronic liver disease can be inherited (genetic) or caused by a variety of factors such as viruses, auto-immunity, obesity and alcohol use.
COVID-19 The infectious disease caused by a coronavirus discovered in 2019, declared a pandemic by WHO.
Doptelet (avatrombopag) A second-generation small-molecule thrombopoietin receptor (TPO) agonist used in the treatment of thrombocytopenia by increasing platelet count.
Elocta (efmoroctocog alfa)
A recombinant, EHL clotting factor VIII therapy approved in the EU, Iceland, Kuwait, Liechtenstein, Norway, Saudi Arabia and Switzerland for the treatment of haemophilia A. It is also approved in Australia, Brazil, Canada, Japan, New Zealand, the United States and other countries, where it is known as ELOCTATE.
EMA European Medicines Agency.
FDA The US Food & Drug Administration.
Gamifant (emapalumab)
An anti-interferon-gamma (IFN-γ) monoclonal antibody (mAb), approved by the FDA for the treatment of primary haemophagocytic lymphohistiocytosis (pHLH), a life-threatening syndrome of immune activation.
Gout An autoinflammatory disease that causes intensely painful flares and debilitating inflammatory arthritis due to deposition of pro-inflammatory monosodium urate (MSU) crystals in synovial fluid and other tissues.
Haemophagocytic lymphohistiocytosis (HLH)
A rare and life-threatening syndrome of extreme immune activation. The primary form of the disease (pHLH, inherited) mainly occurs in infants and young children while the secondary form of the disease (sHLH, acquired) is acquired from or associated with infection, autoimmune diseases or malignancy.
Haemophilia A rare, genetic disorder in which the ability of a person’s blood to clot is impaired. Haemophilia A occurs in about one in 5,000 male births annually, and haemophilia B occurs in about one in 25,000 male births annually. Both occur more rarely in females. People with haemophilia can experience bleeding episodes that may cause pain, limited mobility, irreversible joint damage and life-threatening haemorrhages.
Kineret (anakinra) A recombinant protein drug that blocks the biological activity of interleukin-1 α and β (IL-1α and IL -1β ) by binding to IL-1 type 1 receptors (IL-R 1), expressed in a variety of tissues and organs, thereby blocking the IL-1 signalling. IL-1 is a key mediator of inflammation and a significant contributor to autoinflammatory diseases.
Orfadin (nitisinone) A drug used to treat hereditary tyrosinaemia type 1 (HT-1). It blocks the breakdown of tyrosine, thereby reducing the amount of toxic tyrosine by-products in the body. Patients must maintain a special diet in combination with Orfadin treatment as tyrosine is not adequately broken down. Orfadin was approved in the EU in October 2020 for the treatment of adult patients with alkaptonuria (AKU).
22 SOBI Q2 REPORT 2021
D E F I N I T I O N S A N D G LO S S A RY
Paroxysmal nocturnal haemoglobinuria (PNH)
A rare, chronic, life-threatening blood disorder characterised by the destruction of oxygen-carrying red blood cells through extravascular and intravascular haemolysis. Persistently low haemoglobin can result debilitating symptoms such as severe fatigue, haemoglobinuria, and difficulty breathing (dyspnoea), and the need for frequent transfusions.
Pegcetacoplan An investigational, targeted C3 therapy designed to regulate excessive complement activation, which can lead to the onset and progression of many serious diseases. Pegcetacoplan is a synthetic cyclic peptide conjugated to a polyethylene glycol polymer that binds specifically to C3 and C3b.
RSV Respiratory syncytial virus. A common virus and the most common cause of lower respiratory tract infections (LRTI) in young children.
SEL-212 SEL-212 is a novel combination product candidate designed to sustain control of serum uric acid levels in patients with chronic refractory gout. SEL-212 consists of pegadricase, co-administered with ImmTOR, designed to mitigate the formation of anti-drug antibodies.
Synagis (palivizumab)
Indicated for the prevention of serious lower respiratory tract infection (LRTI) caused by RSV in infants and young children at high risk of RSV disease. RSV is the most prevalent cause of LRTI among infants and young children. Synagis is a RSV F protein inhibitor monoclonal antibody that acts as a prophylaxis against serious RSV disease.
Tegsedi (inotersen) Tegsedi (inotersen) is a self-administered subcutaneous treatment for the polyneuropathy of hATTR amyloidosis in adults.
Waylivra (volanesorsen) Waylivra (volanesorsen) is a treatment for genetically confirmed familial chylomicronaemia syndrome (FCS).
Sobi is a specialised international biopharmaceutical company transforming the lives of people with
rare diseases. Sobi is providing sustainable access to innovative therapies in the areas of
haematology, immunology and specialty indications. Today, Sobi employs approximately 1,500 people
across Europe, North America, the Middle East, Russia and Asia. In 2020, Sobi’s revenue amounted to
SEK 15.3 billion.
Sobi’s share (STO:SOBI) is listed on Nasdaq Stockholm.
You can find more information about Sobi at sobi.com
Swedish Orphan Biovitrum AB (publ)
SE-112 76 Stockholm, Sweden | Street address: Tomtebodavägen 23 A
Telephone: +46 8-697 20 00 | Fax: +46 8-697 23 30
www.sobi.com