Embed Size (px)
Citation preview

Q2 2020Earnings
JULY 27, 2020
Safe HarborCertain statements in this presentation contain "forward-looking statements" within the meaning of the Private Securities Litigation Reform Act of 1995. These statements, which may be identified by the use of forward-looking words or phrases, include statements relating to: the impact of, and actions and initiatives taken and planned to be taken to, try and manage the negative impact of the global coronavirus outbreak on our business, including on the negative impact on supply of products and production of entertainment content, demand for our products and entertainment, our liquidity and our community; the expected adequacy of supply and operation of our manufacturing facilities; our outlook on and the ability to achieve our financial and business goals; expected benefits of our investments in ecommerce, entertainment and digital gaming; expected synergies by 2022 in connection with our acquisition of eOne; and our working capital and liquidity. Our actual actions or results may differ materially from those expected or anticipated in the forward-looking statements due to both known and unknown risks and uncertainties. For example, the global coronavirus outbreak has resulted, and may continue to result, in significant disruptions in the markets in which we and our employees, consumers, customers, licensors, licensees, partners, suppliers and manufacturers operate. We have experienced, and expect to continue to experience, disruptions in supply of products and production of entertainment content, negative impact on sales due to changes in consumer purchasing behavior and availability of product to consumers, including due to retail store closures or limited re-openings and limitations on the capacity of e-commerce, such as in Latin America; delays or postponements of productions and releases of entertainment content both internally and by our partners; and challenges of working remotely. Our efforts to develop and execute plans to help mitigate the negative impact of the coronavirus to our business will not prevent our business from being adversely affected. The longer the outbreak continues, or continues to surge or reemerge in markets in which we operate, the more negative the impact will be on our business, revenues, earnings and liquidity, and the more limited our ability will be to try and make up for delayed or lost product development, production and sales. Other factors that might cause such a difference include, but are not limited to:•our ability to design, develop, produce, manufacture, source and ship products on a timely and cost-effective and profitable basis;
• rapidly changing consumer interests in the types of products and entertainment we offer;• the challenge of developing and offering products and storytelling experiences that are sought after by children, families and audiences given increasing technology and entertainment offerings available;• our ability to develop and distribute engaging storytelling across media to drive brand awareness;• our dependence on third party relationships, including with third party manufacturers, licensors of brands, studios, content producers and entertainment distribution channels;• our ability to successfully compete in the global play and entertainment industry, including with manufacturers, marketers, and sellers of toys and games, digital gaming products and digital media, as well as with film studios, television production companies and independent distributors and content producers;• our ability to successfully evolve and transform our business and capabilities to address a changing global consumer landscape and retail environment, including changing inventories policies and practices of our customers;• our ability to develop new and expanded areas of our business, such as through eOne, Wizards of the Coast, and our other entertainment, digital gaming and esports initiatives;• risks associated with international operations, such as currency conversion, currency fluctuations, the imposition of tariffs, quotas, border adjustment taxes or other protectionist measures, and other challenges in the territories in which we operate;• our ability to successfully implement actions to lessen the impact of potential and enacted tariffs imposed on our products, including any changes to our supply chain, inventory management, sales policies or pricing of our products;• downturns in global and regional economic conditions impacting one or more of the markets in which we sell products, which can negatively impact our retail customers and consumers, result in lower employment levels, consumer disposable income, retailer inventories and spending, including lower spending on purchases of our products;• other economic and public health conditions or regulatory changes in the markets in which we and our customers, suppliers and manufacturers operate, such as higher commodity prices, labor costs or transportation costs, or outbreaks of disease, such as the coronavirus, the occurrence of which could create work slowdowns, delays or shortages in production or shipment of products, increases in costs or delays in revenue; 2

Safe Harbor continued
•the success of our key partner brands, including the ability to secure, maintain and extend agreements with our key partners or the risk of delays, increased costs or difficulties associated with any of our or our partners’ planned digital applications or media initiatives;• fluctuations in our business due to seasonality;• the concentration of our customers, potentially increasing the negative impact to our business of difficulties experienced by any of our customers or changes in their purchasing or selling patterns;• the bankruptcy or other lack of success of one of our significant retailers, such as the bankruptcy of Toys“R”Us in the United States and Canada;• the bankruptcy or other lack of success of one or more of our licensees and other business partners;• risks relating to the use of third-party manufacturers for the manufacturing of our products, including the concentration of manufacturing for many of our products in the People’s Republic of China and our ability to successfully diversify sourcing of our products to reduce reliance on sources of supply in China;• our ability to attract and retain talented employees;• our ability to realize the benefits of cost-savings and efficiency and/or revenue efficiency enhancing initiatives including initiatives to integrate eOne into our business;• our ability to protect our assets and intellectual property, including as a result of infringement, theft, misappropriation, cyber-attacks or other acts compromising the integrity of our assets or intellectual property;• risks relating to the impairment and/or write-offs of acquired products and films and television programs we acquire and produce;• risks relating to investments and acquisitions, such as our acquisition of eOne, which risk include: integration difficulties; inability to retain key personnel; diversion of management time and resources; failure to achieve anticipated benefits or synergies of acquisitions or investments; and risks relating to the additional indebtedness incurred in connection with a transaction;• the risk of product recalls or product liability suits and costs associated with product safety regulations;• changes in tax laws or regulations, or the interpretation and application of such laws and regulations, which may cause us to alter tax reserves or make other changes which significantly impact our reported financial results;• the impact of litigation or arbitration decisions or settlement actions; and• other risks and uncertainties as may be detailed from time to time in our public announcements and U.S. Securities and Exchange Commission (“SEC”) filings.The statements contained herein are based on our current beliefs and expectations. We undertake no obligation to make any revisions to the forward-looking statements contained in this presentation or to update them to reflect events or circumstances occurring after the date of this presentation.
3
Supplemental Financial DataUse of Non-GAAP Financial Measures
4
The financial tables accompanying this presentation include non-GAAP financial measures as defined under SEC rules, specificallyAdjusted operating profit, Adjusted net earnings and Adjusted earnings per diluted share, which exclude, where applicable, the 2020 impact of eOne acquisition-related expenses, purchased intangible amortization and other severance costs. For 2019, Pro Forma Adjusted operating profit, Pro Forma Adjusted net earnings and Pro Forma Adjusted earnings per diluted share exclude the impact of charges associated with the settlement of the Company’s U.S. pension plan, purchased intangible amortization and certain charges incurred by eOne related to prior restructuring programs and acquisition-related charges. Also included in the financial tables are the non-GAAP financial measures of EBITDA, Adjusted EBITDA and Pro Forma Adjusted EBITDA. EBITDA represents net earnings attributable to Hasbro, Inc. excluding interest expense, income taxes, depreciation and amortization. Adjusted EBITDA also excludes the impact of the charges/gains noted above. As required by SEC rules, we have provided reconciliations on the attachedschedules of these measures to the most directly comparable GAAP measure. Management believes that Adjusted net earnings, Adjusted earnings per diluted share and Adjusted operating profit provides investors with an understanding of the underlying performance of our business absent unusual events. Management believes that EBITDA and Adjusted EBITDA are appropriate measures for evaluating the operating performance of our business because they reflect the resources available for strategic opportunities including, among others, to invest in the business, strengthen the balance sheet and make strategic acquisitions. These non-GAAP measures should be considered in addition to, not as a substitute for, or superior to, net earnings or other measures of financial performance prepared in accordance with GAAP as more fully discussed in our consolidated financial statements and filings with the SEC. As used herein, "GAAP" refers to accounting principles generally accepted in the United States of America.

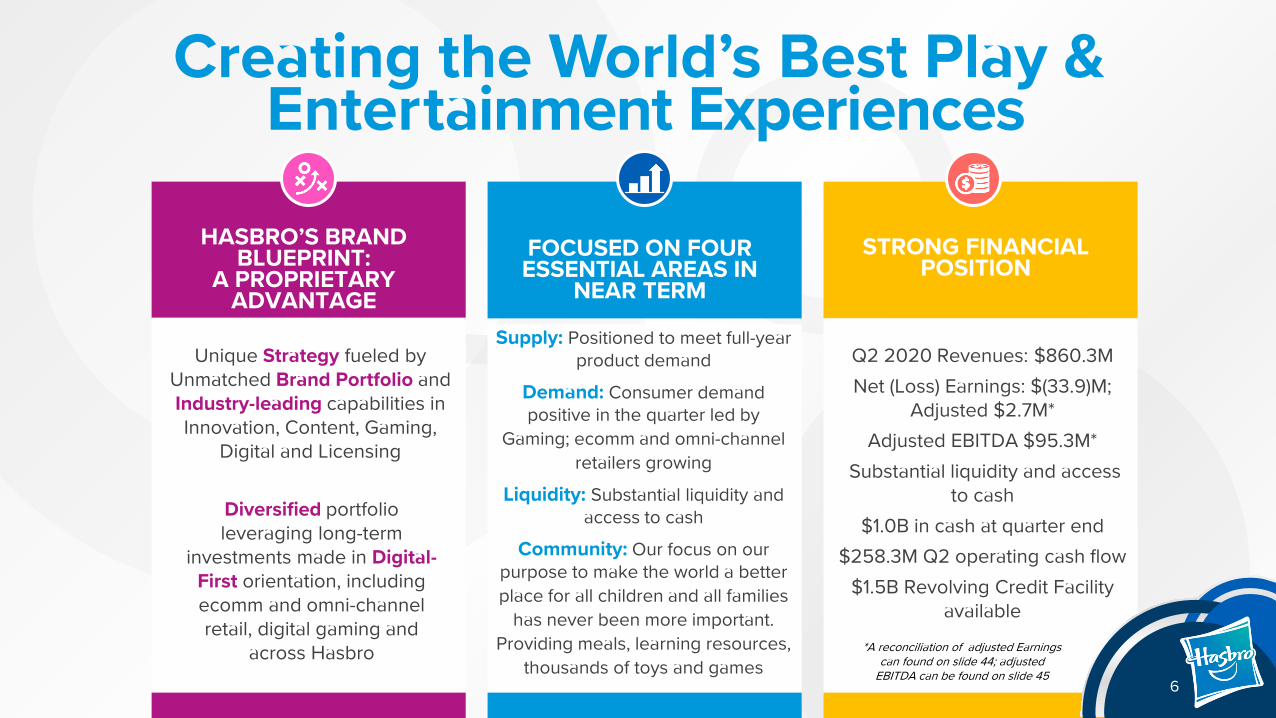
Hasbro’s Brand Blueprint
5
Strong
STRONG FINANCIAL POSITION
HASBRO’S BRAND BLUEPRINT:
A PROPRIETARY ADVANTAGE
FOCUSED ON FOUR ESSENTIAL AREAS IN
NEAR TERM
Q2 2020 Revenues: $860.3MNet (Loss) Earnings: $(33.9)M;
Adjusted $2.7M*Adjusted EBITDA $95.3M*
Substantial liquidity and access to cash
$1.0B in cash at quarter end$258.3M Q2 operating cash flow
$1.5B Revolving Credit Facility available
Unique Strategy fueled by Unmatched Brand Portfolio and Industry-leading capabilities in Innovation, Content, Gaming,
Digital and Licensing
Creating the World’s Best Play &Entertainment Experiences
Diversified portfolio leveraging long-term
investments made in Digital-First orientation, including ecomm and omni-channel retail, digital gaming and
across Hasbro
Supply: Positioned to meet full-year product demand
Demand: Consumer demand positive in the quarter led by
Gaming; ecomm and omni-channel retailers growing
Liquidity: Substantial liquidity and access to cash
Community: Our focus on our purpose to make the world a better place for all children and all families
has never been more important. Providing meals, learning resources,
thousands of toys and games*A reconciliation of adjusted Earnings
can found on slide 44; adjusted EBITDA can be found on slide 45
6
7
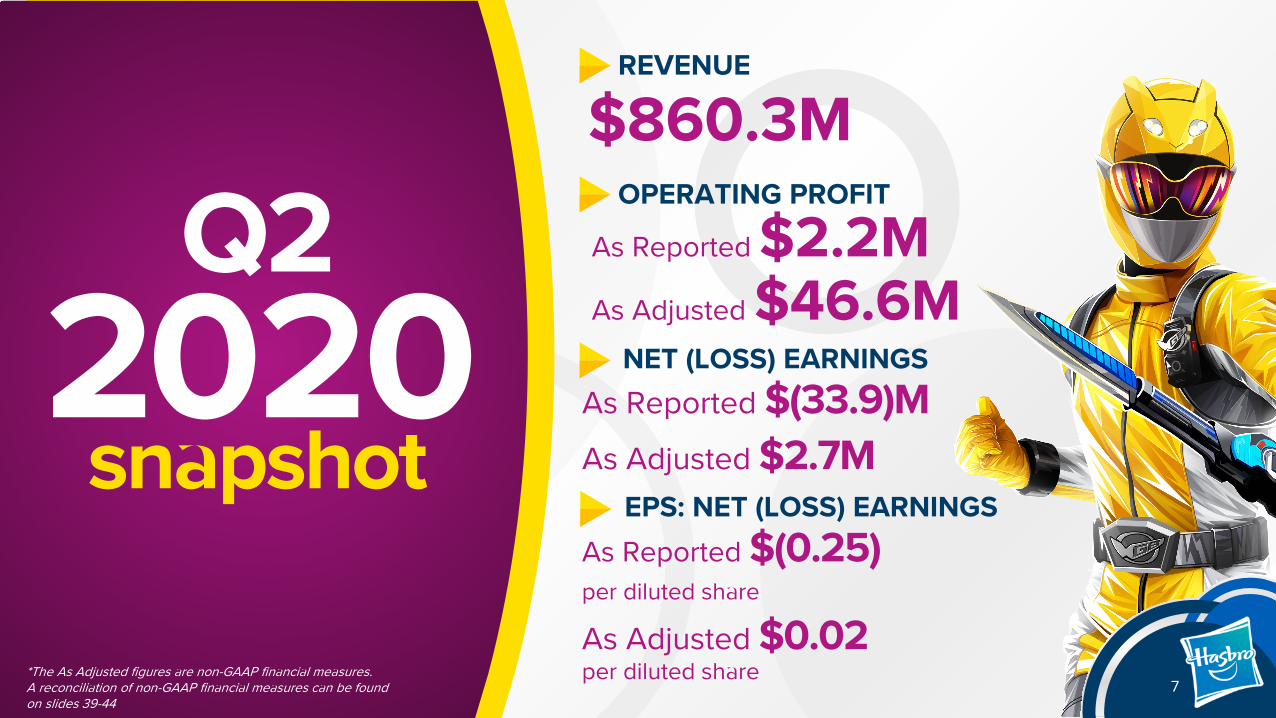
2020snapshot
Q2
REVENUE
OPERATING PROFIT
NET (LOSS) EARNINGS
EPS: NET (LOSS) EARNINGS
$860.3M
As Reported $2.2MAs Adjusted $46.6M
As Reported $(33.9)MAs Adjusted $2.7M
As Reported $(0.25)per diluted share
As Adjusted $0.02per diluted share*The As Adjusted figures are non-GAAP financial measures.
A reconciliation of non-GAAP financial measures can be found on slides 39-44
7


China• Third-party factories in China represent approximately 55% of the Company’s manufacturing production• Operating at normal capacity since the beginning of the second quarter• China factories are making product across the business, including games • Made up lost production in early second quarter and picked up capacity from other closed locations in the quarter
• Manufacturing and warehouse partners outside of China (U.S., Ireland, India) were shut down from mid-March through mid-May• Today, these locations are operating at normal levels of productivity and anticipate making up lost production by the latter half of
Q3 2020, assuming no additional shutdowns • Facilities in India are operating but lockdowns continue within the country
Outside China
Factories and warehouses are open and operating in nearly all markets Well positioned to meet full year product demand
COVID-19 UPDATE: Supply Chain
Hasbro’s global team continues to utilize its diverse global supply chain to meet demand from open facilities and to rapidly make up lost production • The COVID-19 situation is very fluid but we expect facilities to remain open• Using our full complement of sourcing partners globally to ensure a quick recapture of lost production
9
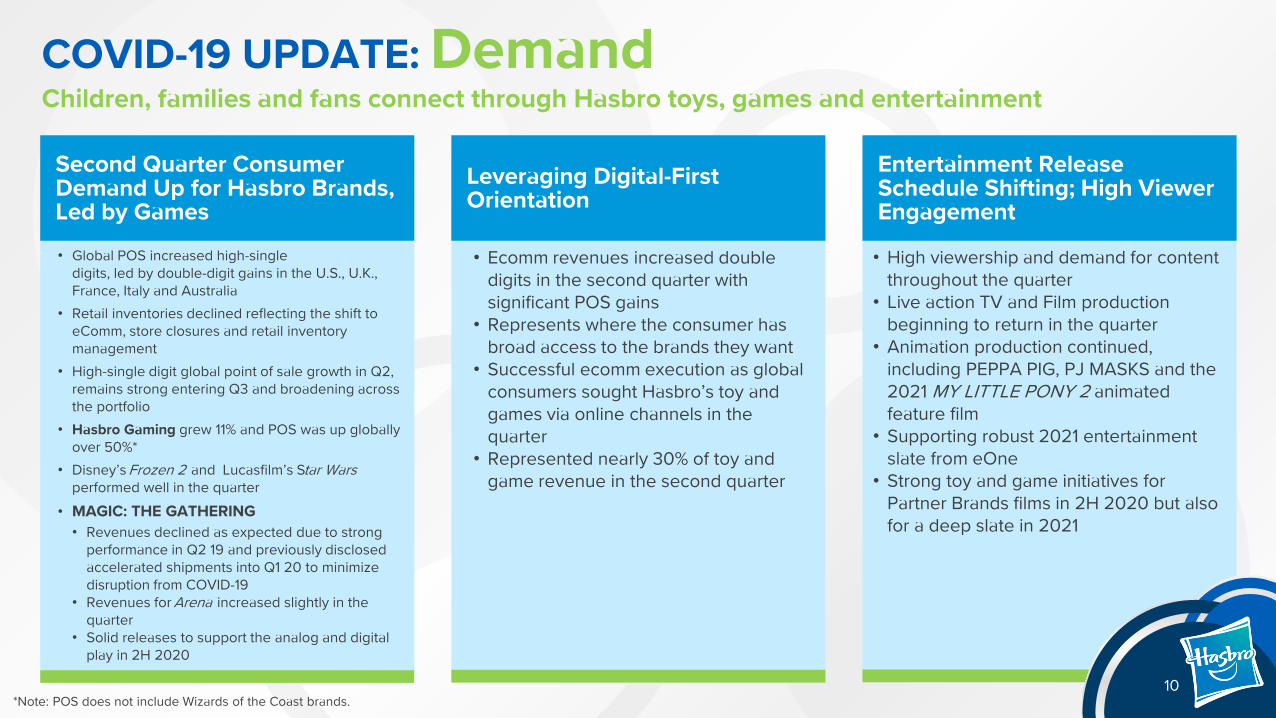
Entertainment Release Schedule Shifting; High Viewer Engagement
Children, families and fans connect through Hasbro toys, games and entertainmentCOVID-19 UPDATE: Demand
Second Quarter Consumer Demand Up for Hasbro Brands, Led by Games
Leveraging Digital-First Orientation
• Global POS increased high-singledigits, led by double-digit gains in the U.S., U.K., France, Italy and Australia
• Retail inventories declined reflecting the shift to eComm, store closures and retail inventory management
• High-single digit global point of sale growth in Q2, remains strong entering Q3 and broadening across the portfolio
• Hasbro Gaming grew 11% and POS was up globally over 50%*
• Disney’s Frozen 2 and Lucasfilm’s Star Wars performed well in the quarter
• MAGIC: THE GATHERING• Revenues declined as expected due to strong
performance in Q2 19 and previously disclosed accelerated shipments into Q1 20 to minimize disruption from COVID-19
• Revenues for Arena increased slightly in the quarter
• Solid releases to support the analog and digital play in 2H 2020
• Ecomm revenues increased double digits in the second quarter with significant POS gains
• Represents where the consumer has broad access to the brands they want
• Successful ecomm execution as global consumers sought Hasbro’s toy and games via online channels in the quarter
• Represented nearly 30% of toy and game revenue in the second quarter
*Note: POS does not include Wizards of the Coast brands.10
• High viewership and demand for contentthroughout the quarter
• Live action TV and Film productionbeginning to return in the quarter
• Animation production continued,including PEPPA PIG, PJ MASKS and the2021 MY LITTLE PONY 2 animatedfeature film
• Supporting robust 2021 entertainmentslate from eOne
• Strong toy and game initiatives forPartner Brands films in 2H 2020 but alsofor a deep slate in 2021

Hasbro is operating from a solid financial positionCOVID-19 UPDATE: Liquidity
Hasbro is in a good financial position and ended the second quarter with $1.0 billion in cash• The Company's $1.5 billion revolving credit facility is also available• The Company remains well within its financial covenants for its $1 billion term loan and revolving credit facility• The next major debt repayment is $300 million in May 2021• The Board remains committed to the dividend
• Paid $93.1 million in cash dividends to shareholders during the second quarter 2020• The next quarterly cash dividend payment of $0.68 per common share is scheduled for August 17, 2020• The Company had previously suspended its share repurchase program as it prioritizes deleveraging
We are closely monitoring credit for our customers; Three largest customers remain Walmart, Target and Amazon• In certain markets and channels, our customers remained closed throughout the second quarter and cash collections have been
extended• Improvement as stores reopen• Working closely with our customers to successfully navigate this period
The Company has reduced expenses and taken steps to preserve cash in the near term• Managing variable costs• Taken cost out of the business in areas where we cannot currently operate, including making difficult decisions to furlough
some employees and to simplify our commercial organization• Lower content production cash spend, which is now expected in the range of approximately $450-$550 million,
due to production shutdowns• The Company spent $220.4 million in 1H 2020 on content 11
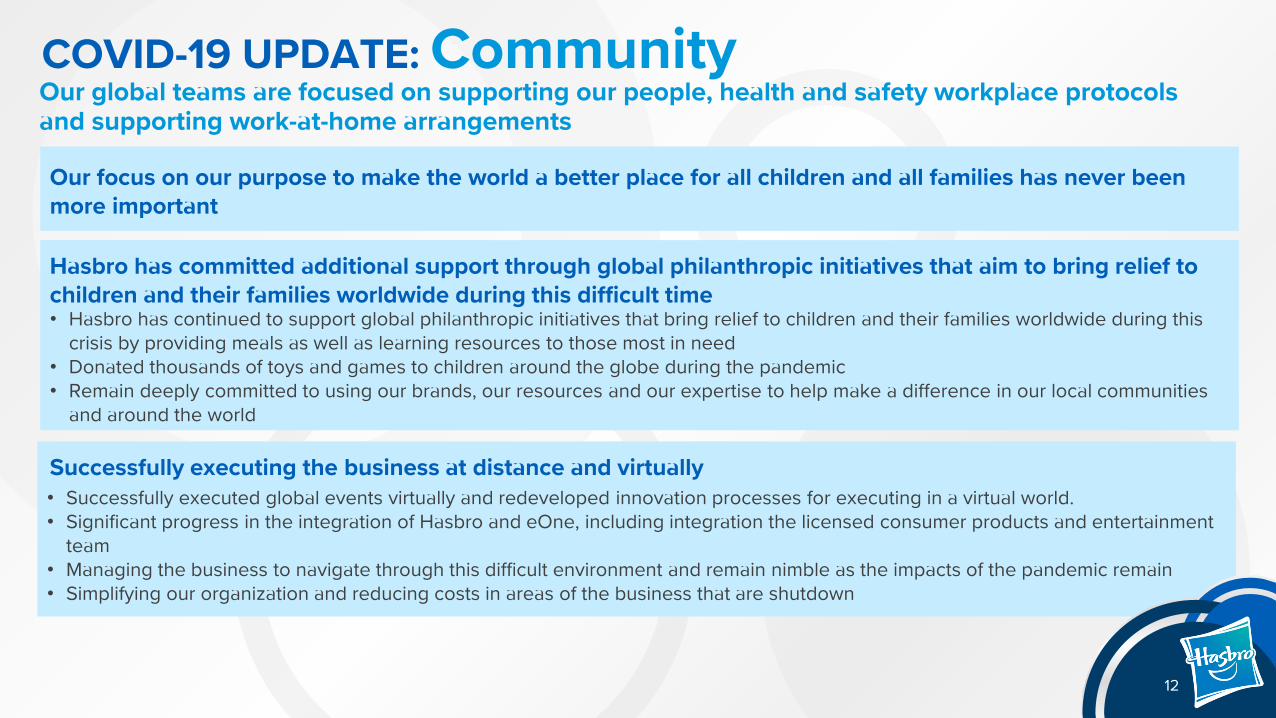
Our focus on our purpose to make the world a better place for all children and all families has never been more important
Hasbro has committed additional support through global philanthropic initiatives that aim to bring relief to children and their families worldwide during this difficult time• Hasbro has continued to support global philanthropic initiatives that bring relief to children and their families worldwide during this
crisis by providing meals as well as learning resources to those most in need• Donated thousands of toys and games to children around the globe during the pandemic• Remain deeply committed to using our brands, our resources and our expertise to help make a difference in our local communities
and around the world
Successfully executing the business at distance and virtually • Successfully executed global events virtually and redeveloped innovation processes for executing in a virtual world.• Significant progress in the integration of Hasbro and eOne, including integration the licensed consumer products and entertainment
team• Managing the business to navigate through this difficult environment and remain nimble as the impacts of the pandemic remain• Simplifying our organization and reducing costs in areas of the business that are shutdown
Our global teams are focused on supporting our people, health and safety workplace protocols and supporting work-at-home arrangements
COVID-19 UPDATE: Community
12
$-
$500
$1,000
$1,500
2019 2020
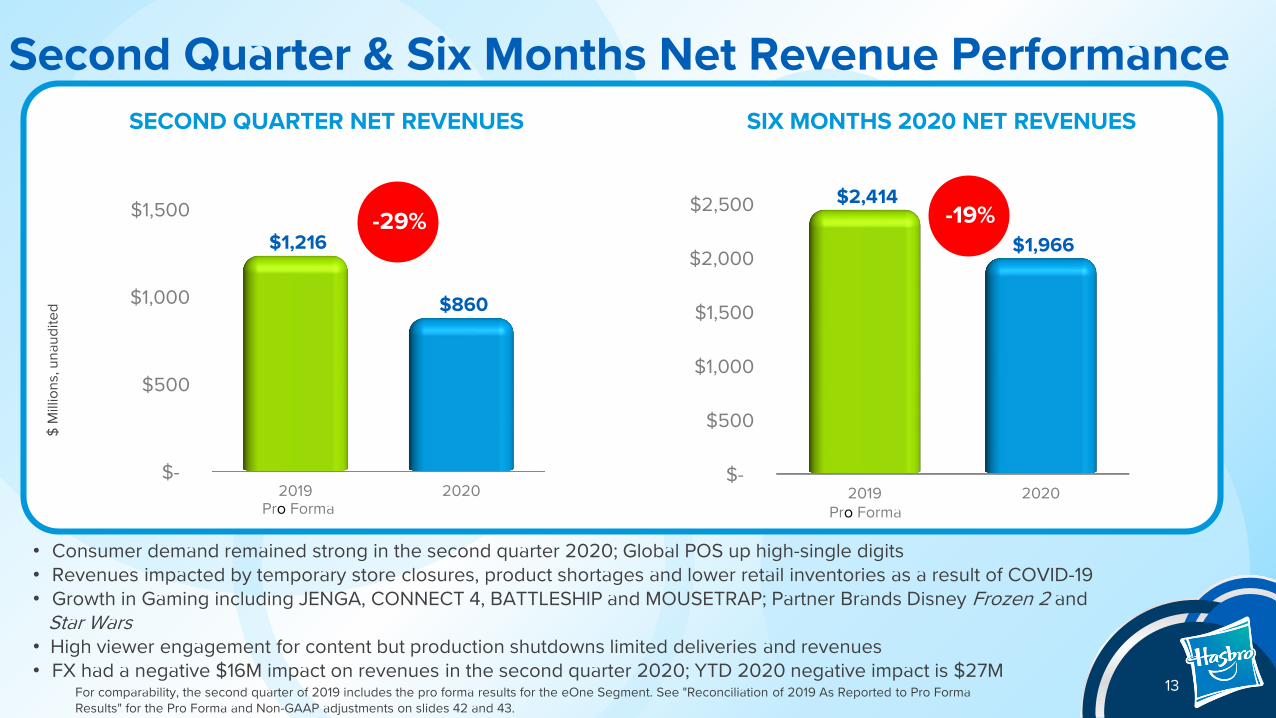
$1,216
$860
Second Quarter & Six Months Net Revenue Performance
• Consumer demand remained strong in the second quarter 2020; Global POS up high-single digits• Revenues impacted by temporary store closures, product shortages and lower retail inventories as a result of COVID-19• Growth in Gaming including JENGA, CONNECT 4, BATTLESHIP and MOUSETRAP; Partner Brands Disney Frozen 2 and
Star Wars• High viewer engagement for content but production shutdowns limited deliveries and revenues• FX had a negative $16M impact on revenues in the second quarter 2020; YTD 2020 negative impact is $27M
For comparability, the second quarter of 2019 includes the pro forma results for the eOne Segment. See "Reconciliation of 2019 As Reported to Pro Forma Results" for the Pro Forma and Non-GAAP adjustments on slides 42 and 43.
-29%
$ M
illio
ns, u
naud
ited
SECOND QUARTER NET REVENUES
13
Pro Forma
$-
$500
$1,000
$1,500
$2,000
$2,500
2019 2020
$2,414
$1,966
Pro Forma
SIX MONTHS 2020 NET REVENUES
-19%
Q2 2020 Q2 2019 % CHANGESix Months
2020Six Months
2019%
CHANGE
FRANCHISE BRANDS $377 $577 -35% $773 $970 -20%
PARTNER BRANDS $138 $213 -35% $321 $385 -17%
HASBRO GAMING1 $137 $123 +11% $277 $231 +20%
EMERGING BRANDS2 $76 $107 -29% $170 $223 -24%
TV/FILM/ENTERTAINMENT3 $132 $195 -32% $425 $605 -30%
TOTAL $860 $1,216 -29% $1,966 $2,414 -19%
Second Quarter & Six Months Brand Portfolio Performance
1Hasbro’s total gaming category, including all gaming revenue, most notably MAGIC: THE GATHERING and MONOPOLY which are included in Franchise Brands in the table above, was $319M for Q2 2020, down 19% vs. $393M for Q2 2019. YTD 2020 Hasbro’s total gaming was $659M, up 4% versus $637M YTD 2019. Hasbro believes its gaming portfolio is a competitive differentiator and views it in its entirety.2 Emerging Brands portfolio includes the preschool brands, PEPPA PIG, PJ MASKS and RICKY ZOOM, acquired as part of the eOne acquisition. For comparability, the quarter and six months ended June 30, 2019 includes the pro forma net revenues of $36M and $92M, respectively, for those brands. 3TV/Film/Entertainment represents eOne net revenues not allocated to the Emerging Brands portfolio.
2nd QUARTER 2020• Strong consumer demand for
Hasbro brands and stories, but revenues impacted by temporary store closures, product shortages, lower retail inventories and disruption and production shutdowns in entertainment.
• All FRANCHISE BRANDS revenues declined in the quarter.
• PARTNER BRANDS growth in Disney’s Frozen 2, Lucasfilm’s Star Wars and Universal’sTrolls offset by declines in rest of the portfolio, including Hasbro’s Marvel products.
• Growth in HASBRO GAMING led by Classic Games including JENGA, CONNECT 4, BATTLESHIP and MOUSETRAP
• EMERGING BRANDS revenues declined on pro forma basis.
• TV/FILM/ENTERTAINMENT disruption and production shutdowns due to COVID-19
14
Pro FormaPro Forma

Second Quarter & Six Months Operating Profit (Loss)
$-
$50
$100
$150
2019 2019 Adj* 2020 2020 Adj*
$101
$141
$2
$47
The Adjusted figures are non-GAAP financial measures. See “Reconciliation of As Reported to Pro Forma Adjusted Operating Results” on slides 40-41. For comparability, the second quarter of 2019 includes the pro forma results for the eOne Segment. See "Reconciliation of 2019 As Reported to Pro Forma Results" for the Pro Forma and Non-GAAP adjustments on slides 42-43.
$ M
illio
ns, u
naud
ited
SECOND QUARTER 2020
*Q2 2020 Adjusted Operating Profit excludes $44M in One acquisition-related expenses, acquired intangible amortization and other severance charges.Q2 2019 Adjusted Operating Profit excludes costs related to eOne acquired intangible amortization, as well as eOne prior restructuring programs and acquisition-related expenses.
Operating Profit Margin Q2 2020Favorable• Content Amortization• Cost Savings
Pro Forma
15
$(25)
$100
$225
$350
2019 2019 Adj* 2020 2020 Adj*
$240
$317
$(21)
$198
Pro Forma
SIX MONTHS 2020
Unfavorable• Lower Revenues and
Expense Leverage• Product Mix
Operating Profit Margin Six Months 2020Unfavorable• Lower Revenues• Stock Compensation• Shipping & Warehousing
Favorable• Cost Savings• Advertising• Royalties• Content Amortization

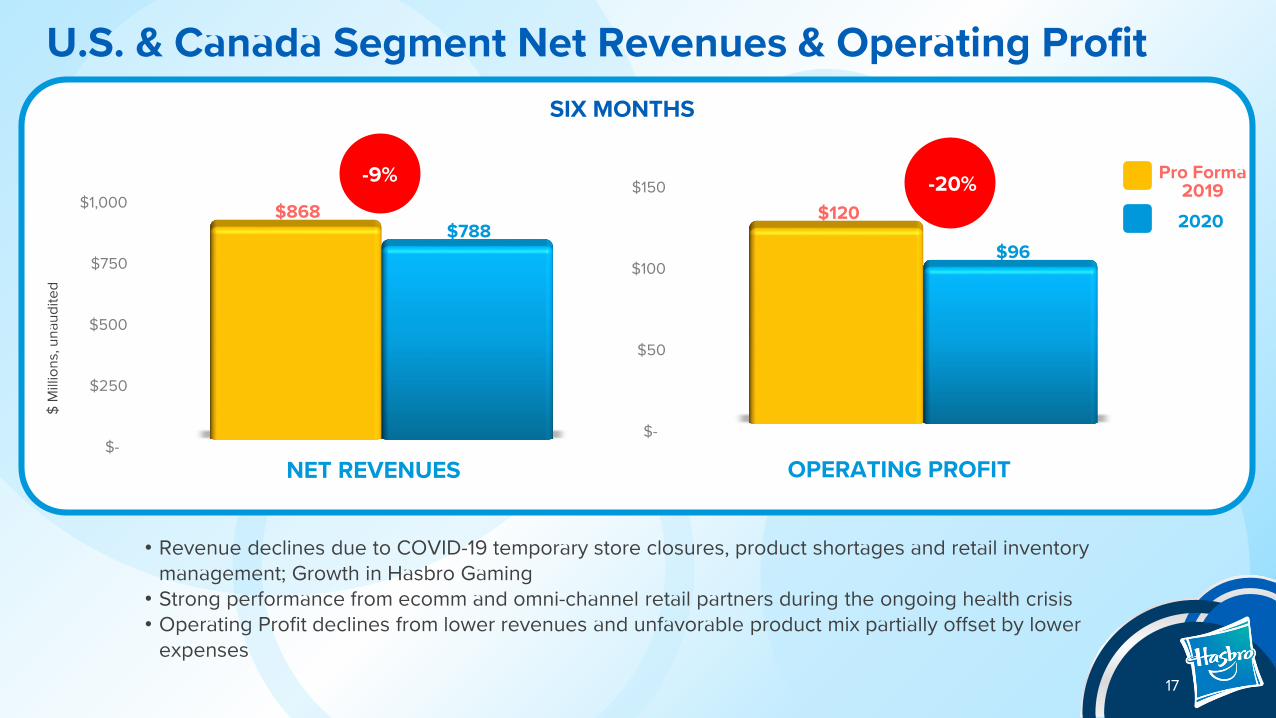
U.S. & Canada Segment Net Revenues & Operating Profit
$-
$100
$200
$300
$400
$500
$600$511
$360
$ M
illio
ns, u
naud
ited
2020
-9%
• Revenue declines except Hasbro Gaming due to COVID-19 related store closures, product shortages andlower retail inventories; Lower revenues as forecasted in MAGIC: THE GATHERING
• Operating Profit decline driven primarily by decreased revenues, including MAGIC: THE GATHERINGrevenues, partially offset by reduced expenses
$-
$50
$100
$150
$107
$24
NET REVENUES OPERATING PROFIT
SECOND QUARTER-30%
-77%
16
Pro Forma 2019
U.S. & Canada Segment Net Revenues & Operating Profit
$-
$250
$500
$750
$1,000 $868 $788
$ M
illio
ns, u
naud
ited
Pro Forma 20192020
-9%
• Revenue declines due to COVID-19 temporary store closures, product shortages and retail inventorymanagement; Growth in Hasbro Gaming
• Strong performance from ecomm and omni-channel retail partners during the ongoing health crisis• Operating Profit declines from lower revenues and unfavorable product mix partially offset by lower
expenses
$-
$50
$100
$150$120
$96
NET REVENUES OPERATING PROFIT
SIX MONTHS
-9% -20%
17

International Segment Net Revenues & Operating Profit (Loss)
$-
$100
$200
$300
$400 $377
$250
$ M
illio
ns, u
naud
ited
2020
-9%
• Revenue declines in all regions (Latin America most meaningful) due to COVID-19 temporary store closures,product shortages and lower retail inventories
• Strong growth in ecomm channels; Latin America ecomm grew but is a small percentage of the total• International segment revenues had a negative $12M impact from foreign exchange in the quarter• Operating Loss as a result of lower revenues partially offset by lower expenses
$15 $(25)
NET REVENUES OPERATING PROFIT (LOSS)
SECOND QUARTER -34%
>12%
18
Pro Forma 2019
>-100%
$-

$-
International Segment Net Revenues & Operating Loss
$-
$250
$500
$750 $660
$500
$ M
illio
ns, u
naud
ited
2020
-9%
• Revenue declines in all regions (Latin America most meaningful) due to COVID-19 temporarystore closures, product shortages and lower retail inventories
• YTD 2020 International segment revenues negatively impacted by $22M due to foreignexchange
• Operating loss as a result of lower revenues partially offset by lower expenses
$(16) $(52)
NET REVENUES OPERATING LOSS
SIX MONTHS
-24%
19
Pro Forma 2019
>-100%
$-

Q2 2020AS
REPORTEDQ2 2020
ABSENT FX
Six Months 2020
AS REPORTED
Six Months 2020
ABSENT FX
EUROPE -22% -20% -10% -8%
LATIN AMERICA -64% -57% -57% -50%
ASIA PACIFIC -31% -28% -25% -23%
TOTAL INTERNATIONAL -34% -31% -24% -21%
International Segment Net Revenues
20
Foreign Exchange had a negative $12M impact on International segment revenues in the second quarter 2020 and a negative $22M impact YTD 2020

Entertainment, Licensing & Digital Segment Net Revenues & Operating Profit
$-
$75
$150
$97 $90
$ M
illio
ns, u
naud
ited
2020
-9%
• EL&D revenues declined due to lower revenues from consumer products as well as lower digital gaming revenues from the closure of Backflip Studios in late 2019
• Second quarter consumer products revenues primarily reflect first quarter retail sales; second quarter 2020 retail sales will be reflected in third quarter 2020 revenues
• Operating Profit increased in the quarter due to lower program productions amortization as well as lower advertising and development expenses due to the closure of Backflip Studios
$-
$25
$50
$8
$28
NET REVENUES OPERATING PROFIT
SECOND QUARTER
-7%>100%
21
Pro Forma 2019
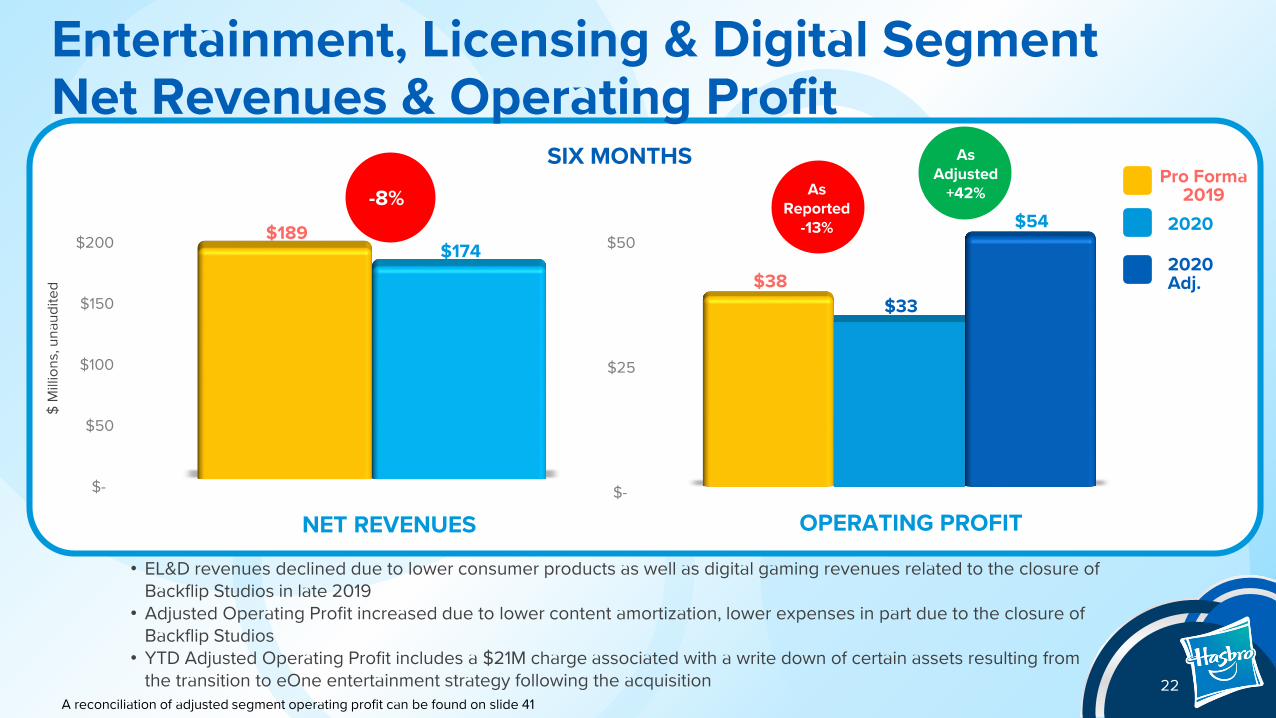
Entertainment, Licensing & Digital Segment Net Revenues & Operating Profit
$-
$50
$100
$150
$200 $189 $174
$ M
illio
ns, u
naud
ited
2020
-9%
• EL&D revenues declined due to lower consumer products as well as digital gaming revenues related to the closure ofBackflip Studios in late 2019
• Adjusted Operating Profit increased due to lower content amortization, lower expenses in part due to the closure ofBackflip Studios
• YTD Adjusted Operating Profit includes a $21M charge associated with a write down of certain assets resulting fromthe transition to eOne entertainment strategy following the acquisition
$-
$25
$50
$38 $33
$54
NET REVENUES OPERATING PROFIT
SIX MONTHS
-8% As Reported
-13%
A reconciliation of adjusted segment operating profit can be found on slide 4122
Pro Forma 2019
2020 Adj.
As Adjusted
+42%
$(50)
$-
$50
$(28)
$13
$(6)
$17
eOne Segment Net Revenues & Operating Profit (Loss)
$-
$100
$200
$300
$400
$500
$600
$231 $161
$ M
illio
ns, u
naud
ited
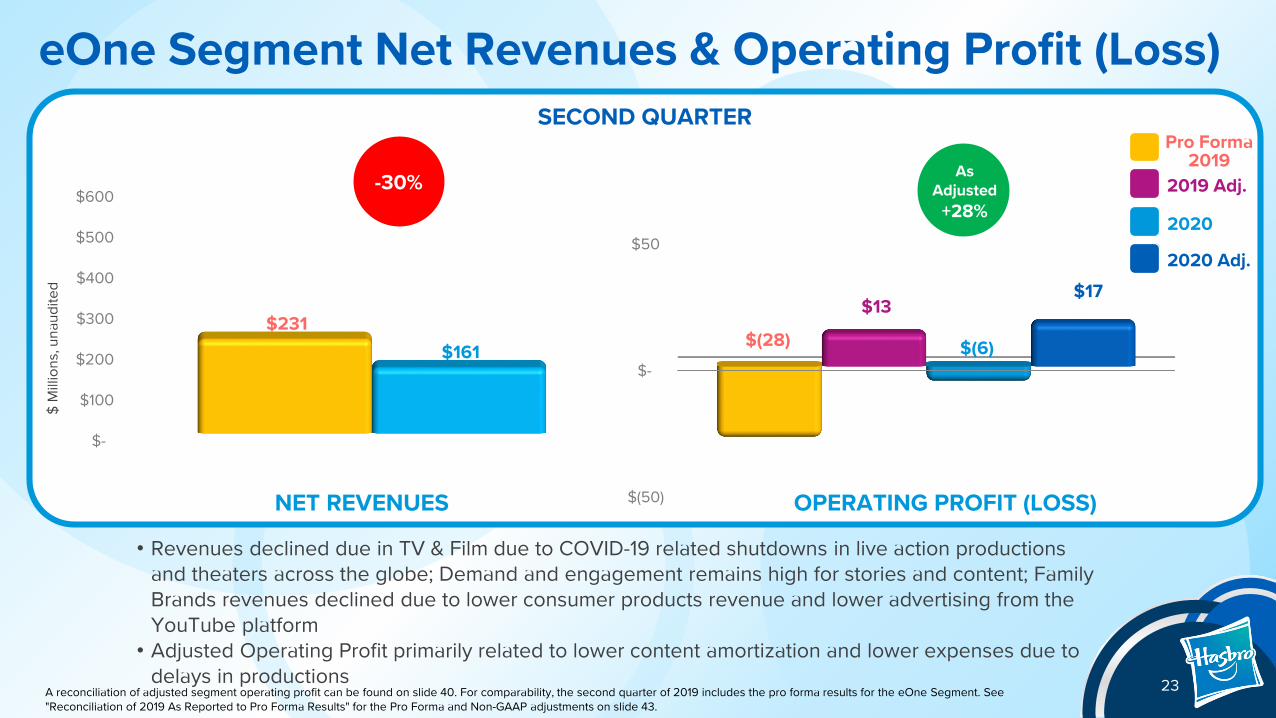
• Revenues declined due in TV & Film due to COVID-19 related shutdowns in live action productionsand theaters across the globe; Demand and engagement remains high for stories and content; FamilyBrands revenues declined due to lower consumer products revenue and lower advertising from theYouTube platform
• Adjusted Operating Profit primarily related to lower content amortization and lower expenses due todelays in productions
A reconciliation of adjusted segment operating profit can be found on slide 40. For comparability, the second quarter of 2019 includes the pro forma results for the eOne Segment. See "Reconciliation of 2019 As Reported to Pro Forma Results" for the Pro Forma and Non-GAAP adjustments on slide 43.
NET REVENUES OPERATING PROFIT (LOSS)
SECOND QUARTER
2019 Adj.
2020
2020 Adj.
-30%
23
Pro Forma 2019As
Adjusted+28%
$(50)
$-
$50
$100
$150
$200
$76
$153
$(39)
$86
eOne Segment Net Revenues & Operating Profit (Loss)
$-
$100
$200
$300
$400
$500
$600$697
$503
$ M
illio
ns, u
naud
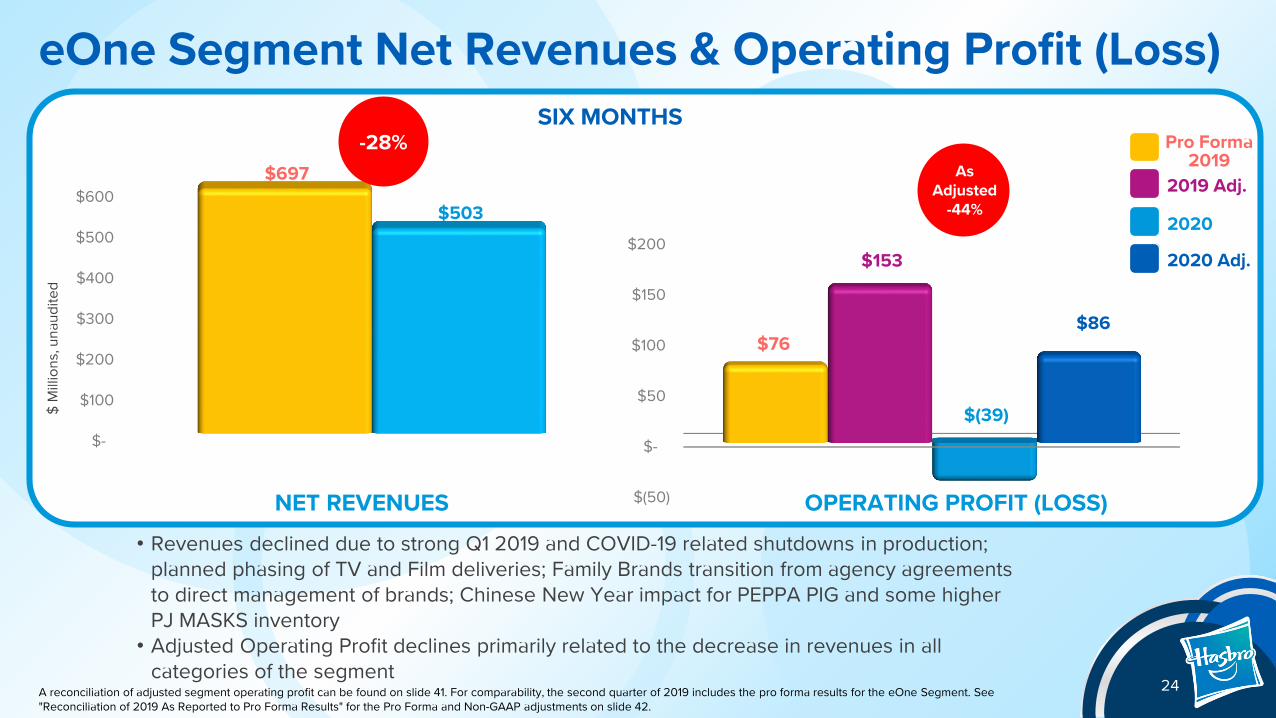
ited
• Revenues declined due to strong Q1 2019 and COVID-19 related shutdowns in production;planned phasing of TV and Film deliveries; Family Brands transition from agency agreementsto direct management of brands; Chinese New Year impact for PEPPA PIG and some higherPJ MASKS inventory
• Adjusted Operating Profit declines primarily related to the decrease in revenues in allcategories of the segment
A reconciliation of adjusted segment operating profit can be found on slide 41. For comparability, the second quarter of 2019 includes the pro forma results for the eOne Segment. See "Reconciliation of 2019 As Reported to Pro Forma Results" for the Pro Forma and Non-GAAP adjustments on slide 42.
NET REVENUES OPERATING PROFIT (LOSS)
SIX MONTHS
2019 Adj.
2020
2020 Adj.
-28%
24
Pro Forma 2019As
Adjusted-44%
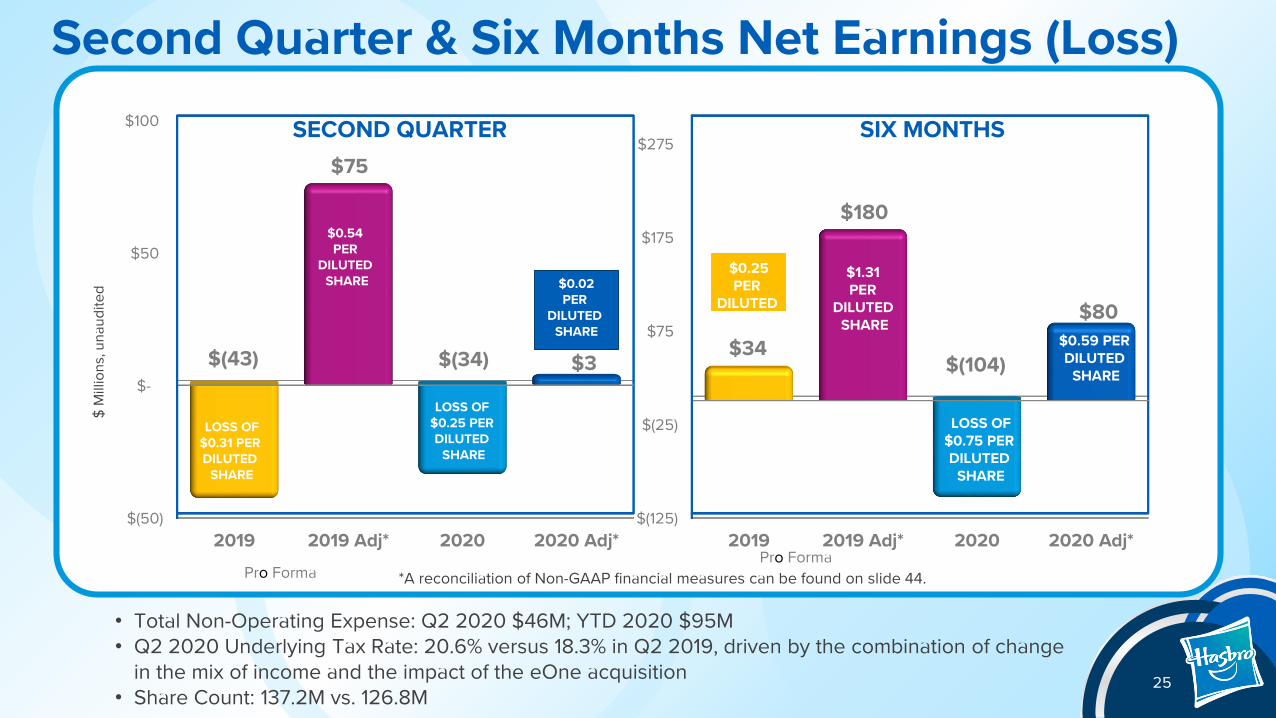
Second Quarter & Six Months Net Earnings (Loss)
• Total Non-Operating Expense: Q2 2020 $46M; YTD 2020 $95M• Q2 2020 Underlying Tax Rate: 20.6% versus 18.3% in Q2 2019, driven by the combination of change
in the mix of income and the impact of the eOne acquisition• Share Count: 137.2M vs. 126.8M
$(50)
$-
$50
$100
2019 2019 Adj* 2020 2020 Adj*
$(43)
$75
$(34) $3
$ M
illio
ns, u
naud
ited
$0.54 PER
DILUTED SHARE $0.02
PER DILUTED
SHARE
LOSS OF$0.31 PER DILUTED
SHARE
LOSS OF $0.25 PER DILUTED
SHARE
*A reconciliation of Non-GAAP financial measures can be found on slide 44.
25
Pro Forma
25
$(125)
$(25)
$75
$175
$275
2019 2019 Adj* 2020 2020 Adj*
$34
$180
$(104)
$80
Pro Forma
$1.31 PER
DILUTED SHARE
LOSS OF$0.75 PER DILUTED
SHARE
$0.59 PER DILUTED
SHARE
$0.25PER
DILUTED SHARE
SECOND QUARTER SIX MONTHS

Q2 2020 Performance• Q2 2020 Revenue: $29M versus $41M in Q2 2019• Strong demand for animated content across all platforms
• Renewals of Peppa Pig series on Chinese SVOD platforms• Production continues on animated content, including 2021 MY LITTLE PONY 2 feature film
• Lower Consumer Products licensed revenue, due to first quarter China lockdown and global impact late in the first quarter
• CP revenue was impacted by lower than anticipated first quarter retail sales; expected third quarter revenues will reflect the continued impact of shutdowns
• Lower YouTube revenues with advertising spend on the platform declining significantlydue to Covid-19
• Delivery of first batch of the new comedy, ALIEN TV, to Netflix• Integration remains on track for content development and in sourcing• Key opportunities
• RICKY ZOOM brand rollout continues, although impacted near term by COVID-19• The World of Peppa Pig digital gaming revenues up year over year• New PJ MASKS content available on free-to-air platforms and on Disney+
26
Family Brands: Strong Demand for Content Remains; Revenues impacted by COVID-19 Shutdowns
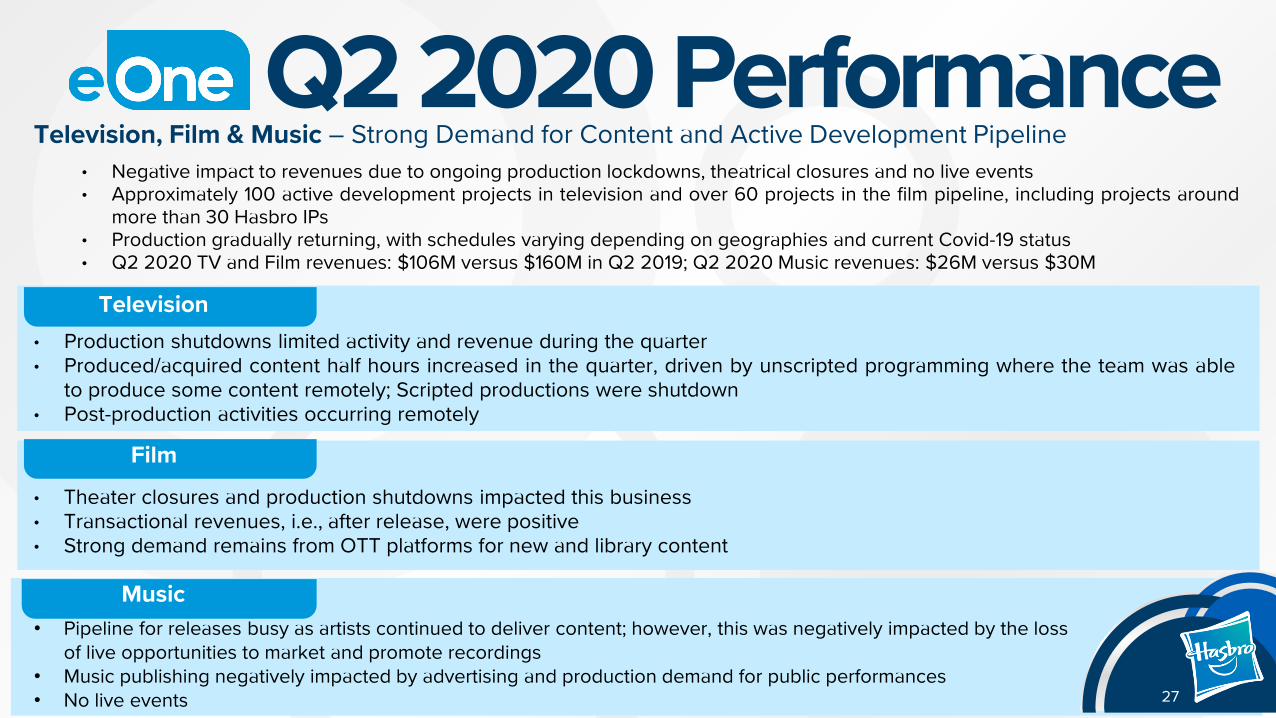
Music
Q2 2020 PerformanceTelevision, Film & Music – Strong Demand for Content and Active Development Pipeline
• Negative impact to revenues due to ongoing production lockdowns, theatrical closures and no live events• Approximately 100 active development projects in television and over 60 projects in the film pipeline, including projects around
more than 30 Hasbro IPs• Production gradually returning, with schedules varying depending on geographies and current Covid-19 status• Q2 2020 TV and Film revenues: $106M versus $160M in Q2 2019; Q2 2020 Music revenues: $26M versus $30M
27
Television
Film
• Production shutdowns limited activity and revenue during the quarter• Produced/acquired content half hours increased in the quarter, driven by unscripted programming where the team was able
to produce some content remotely; Scripted productions were shutdown• Post-production activities occurring remotely
• Theater closures and production shutdowns impacted this business• Transactional revenues, i.e., after release, were positive• Strong demand remains from OTT platforms for new and library content
• Pipeline for releases busy as artists continued to deliver content; however, this was negatively impacted by the lossof live opportunities to market and promote recordings
• Music publishing negatively impacted by advertising and production demand for public performances• No live events

Key Cash Flow & Balance Sheet DataYEAR TO DATE ENDED
JUNE 28, 2020 JUNE 30, 2019 NOTES
Cash $1,038 $1,151 Substantial cash on hand and access to cash through $1.5B revolving credit facility
Long-term Debt $4,803 $1,696 Reflects eOne acquisition financing completed in 2019
Depreciation $57 $62
Amortization of Intangibles $72 $24 Reflects eOne acquisition purchased intangibles
Program Production Costs, net $220 $59 Increase due to content spend with eOne; Updated 2020 content spend range of $450-550M
Capital Expenditures $64 $58 Full-year 2020 target of $145-$155M
Dividends Paid $186 $165 $0.68 per share quarterly dividend paid in Q2 2020
Share Repurchase $0 $59 Share repurchase suspended in 2019 as Company prioritizes deleveraging
Operating Cash Flow $258 $336 Generating strong cash flow; TTM $575M
Accounts Receivable $911 $805DSO up 12 days on pro forma basis; Some customers were closed and the collection of certain receivables was delayed
Inventory $564 $565 Up 5% Absent FX
Goodwill $3,666 $486 eOne acquisition goodwill
$ Millions, unaudited
28
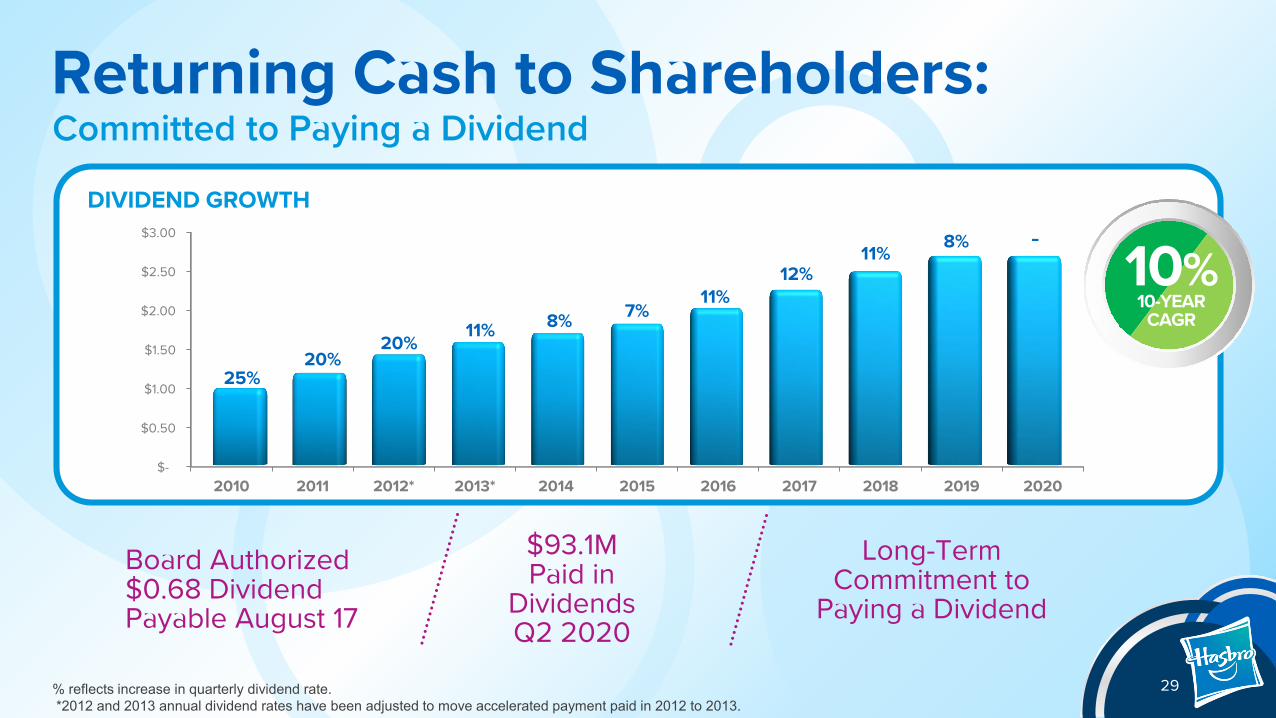
Returning Cash to Shareholders:Committed to Paying a Dividend
10%10-YEAR
CAGR
DIVIDEND GROWTH
$-
$0.50
$1.00
$1.50
$2.00
$2.50
$3.00
2010 2011 2012* 2013* 2014 2015 2016 2017 2018 2019 2020
25%20%
20%11% 8% 7%
11%12%
11% 8%
Board Authorized$0.68 Dividend Payable August 17
$93.1MPaid in
Dividends Q2 2020
Long-Term Commitment to
Paying a Dividend
-
% reflects increase in quarterly dividend rate. *2012 and 2013 annual dividend rates have been adjusted to move accelerated payment paid in 2012 to 2013.
29

Our commitment to CSR reflects our desire to help build a safer, more sustainable and inclusive company and world for all.
Product Safety Human Rights &Ethical Sourcing
Diversity &Inclusion
Environmental Sustainability
100 Most Sustainable Companies
30

products built on proprietary
consumer insights
first-to-market innovation
in play patterns across the portfolio of Hasbro owned &
partner brands
INNOVATION
31

CreativityCurious, Playful and Inventive
IntegrityResponsible, Ethical and Trustworthy
PassionDriven, Focused and Courageous
InclusionDiverse, Empowered and United
CommunityEngaging, Purposeful and Giving
Our Values
Create the World’sBest Play &EntertainmentExperiences
Our Mission
32

Supplemental FinancialInformation
33

Condensed Consolidated Balance Sheets
34
June 28, 2020 June 30, 2019 ASSETS Cash and Cash Equivalents $ 1,038,016 $ 1,151,042 Accounts Receivable, Net 911,320 805,288 Inventories 564,168 564,769 Prepaid Expenses and Other Current Assets 672,163 308,996 Total Current Assets 3,185,667 2,830,095 Property, Plant and Equipment, Net 482,215 387,372 Goodwill 3,666,045 485,765 Other Intangible Assets, Net 1,559,050 670,214 Other Assets 1,329,073 665,164 Total Assets $ 10,222,050 $ 5,038,610
LIABILITIES, NONCONTROLLING INTERESTS AND SHAREHOLDERS' EQUITY Short-term Borrowings $ 6,419 $ 12,787 Current Portion of Long-term Debt 378,558 — Accounts Payable and Accrued Liabilities 1,596,588 1,059,909 Total Current Liabilities 1,981,565 1,072,696 Long-term Debt 4,802,509 1,695,833 Other Liabilities 771,692 554,212 Total Liabilities 7,555,766 3,322,741 Redeemable Noncontrolling Interests 24,133 — Total Shareholders' Equity 2,642,151 1,715,869 Total Liabilities, Noncontrolling Interests and Shareholders' Equity $ 10,222,050 $ 5,038,610
(Tho
usan
ds o
f Dol
lars
)
35
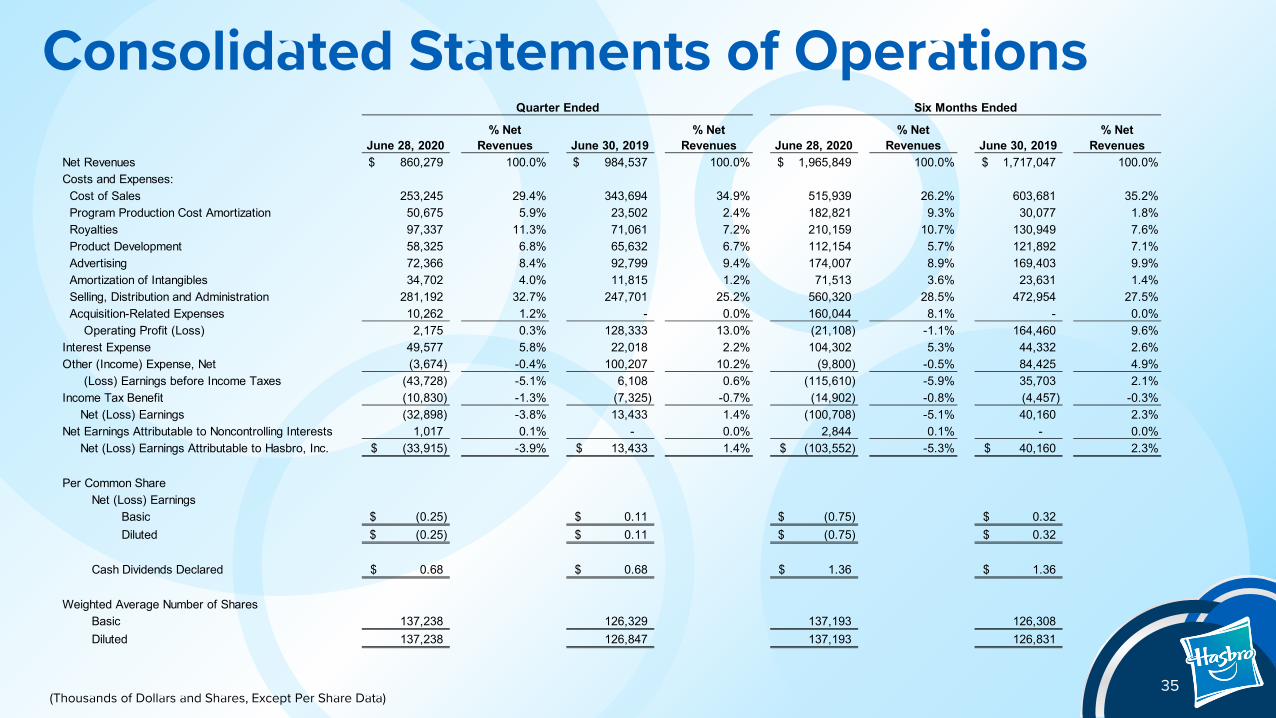
Consolidated Statements of OperationsJune 28, 2020
% Net Revenues June 30, 2019
% Net Revenues June 28, 2020
% Net Revenues June 30, 2019
% Net Revenues
Net Revenues 860,279$ 100.0% 984,537$ 100.0% 1,965,849$ 100.0% 1,717,047$ 100.0%Costs and Expenses: Cost of Sales 253,245 29.4% 343,694 34.9% 515,939 26.2% 603,681 35.2% Program Production Cost Amortization 50,675 5.9% 23,502 2.4% 182,821 9.3% 30,077 1.8% Royalties 97,337 11.3% 71,061 7.2% 210,159 10.7% 130,949 7.6% Product Development 58,325 6.8% 65,632 6.7% 112,154 5.7% 121,892 7.1% Advertising 72,366 8.4% 92,799 9.4% 174,007 8.9% 169,403 9.9% Amortization of Intangibles 34,702 4.0% 11,815 1.2% 71,513 3.6% 23,631 1.4% Selling, Distribution and Administration 281,192 32.7% 247,701 25.2% 560,320 28.5% 472,954 27.5% Acquisition-Related Expenses 10,262 1.2% - 0.0% 160,044 8.1% - 0.0% Operating Profit (Loss) 2,175 0.3% 128,333 13.0% (21,108) -1.1% 164,460 9.6%Interest Expense 49,577 5.8% 22,018 2.2% 104,302 5.3% 44,332 2.6%Other (Income) Expense, Net (3,674) -0.4% 100,207 10.2% (9,800) -0.5% 84,425 4.9% (Loss) Earnings before Income Taxes (43,728) -5.1% 6,108 0.6% (115,610) -5.9% 35,703 2.1%Income Tax Benefit (10,830) -1.3% (7,325) -0.7% (14,902) -0.8% (4,457) -0.3% Net (Loss) Earnings (32,898) -3.8% 13,433 1.4% (100,708) -5.1% 40,160 2.3%Net Earnings Attributable to Noncontrolling Interests 1,017 0.1% - 0.0% 2,844 0.1% - 0.0% Net (Loss) Earnings Attributable to Hasbro, Inc. (33,915)$ -3.9% 13,433$ 1.4% (103,552)$ -5.3% 40,160$ 2.3%
Per Common ShareNet (Loss) Earnings
Basic (0.25)$ 0.11$ (0.75)$ 0.32$ Diluted (0.25)$ 0.11$ (0.75)$ 0.32$
Cash Dividends Declared 0.68$ 0.68$ 1.36$ 1.36$
Weighted Average Number of SharesBasic 137,238 126,329 137,193 126,308Diluted 137,238 126,847 137,193 126,831
Quarter Ended Six Months Ended
(Thousands of Dollars and Shares, Except Per Share Data)

Condensed Consolidated Cash Flows
36
Six Months Ended June 28, 2020 June 30, 2019
Cash Flows from Operating Activities: Net (Loss) Earnings $ (100,708) $ 40,160 Non-Cash Pension Charge — 110,777 Other Non-Cash Adjustments 366,850 108,533 Changes in Operating Assets and Liabilities (7,803) 76,806 Net Cash Provided by Operating Activities 258,339 336,276
Cash Flows from Investing Activities: Additions to Property, Plant and Equipment (64,009) (58,195) Acquisition, Net of Cash Acquired (4,403,929) — Other 13,152 (2,281) Net Cash Utilized by Investing Activities (4,454,786) (60,476)
Cash Flows from Financing Activities: Proceeds from Long-term Debt 1,023,453 — Repayments of Long-term Debt (98,193) — Net (Repayments of) Proceeds from Short-term Borrowings (4,480) 3,095 Purchases of Common Stock — (58,633) Stock-Based Compensation Transactions 1,830 25,779 Dividends Paid (186,243) (164,908) Employee Taxes Paid for Shares Withheld (5,669) (11,889) Redemption of Equity Instruments (47,399) — Deferred Acquisition Payments — (100,000) Other (4,835) — Net Cash Provided (Utilized) by Financing Activities 678,464 (306,556)
Effect of Exchange Rate Changes on Cash (24,370) (573)
Cash and Cash Equivalents at Beginning of Year 4,580,369 1,182,371
Cash and Cash Equivalents at End of Period $ 1,038,016 $ 1,151,042
(Tho
usan
ds o
f Dol
lars
)
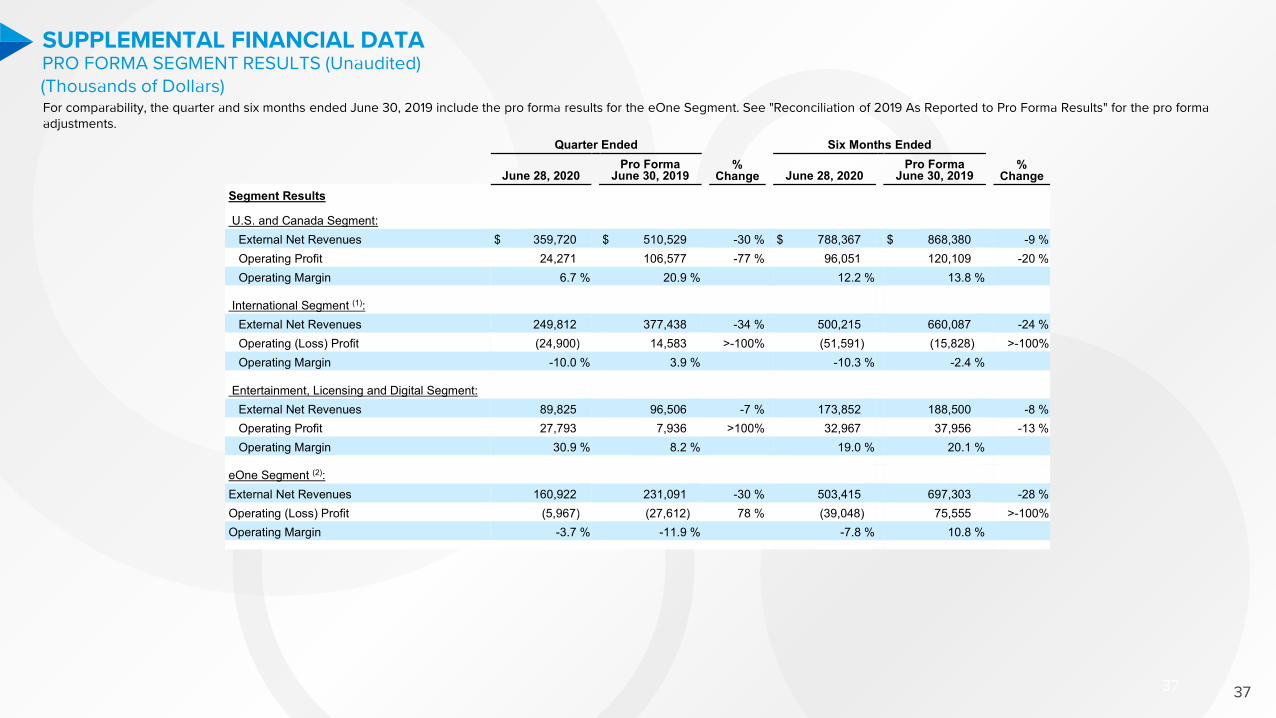
SUPPLEMENTAL FINANCIAL DATAPRO FORMA SEGMENT RESULTS (Unaudited)(Thousands of Dollars)
37 37
For comparability, the quarter and six months ended June 30, 2019 include the pro forma results for the eOne Segment. See "Reconciliation of 2019 As Reported to Pro Forma Results" for the pro forma adjustments.
Quarter Ended Six Months Ended
June 28, 2020 Pro Forma
June 30, 2019 %
Change June 28, 2020 Pro Forma
June 30, 2019 %
Change Segment Results
U.S. and Canada Segment: External Net Revenues $ 359,720 $ 510,529 -30 % $ 788,367 $ 868,380 -9 % Operating Profit 24,271 106,577 -77 % 96,051 120,109 -20 % Operating Margin 6.7 % 20.9 % 12.2 % 13.8 %
International Segment (1): External Net Revenues 249,812 377,438 -34 % 500,215 660,087 -24 % Operating (Loss) Profit (24,900) 14,583 >-100% (51,591) (15,828) >-100% Operating Margin -10.0 % 3.9 % -10.3 % -2.4 %
Entertainment, Licensing and Digital Segment: External Net Revenues 89,825 96,506 -7 % 173,852 188,500 -8 % Operating Profit 27,793 7,936 >100% 32,967 37,956 -13 % Operating Margin 30.9 % 8.2 % 19.0 % 20.1 %
eOne Segment (2): External Net Revenues 160,922 231,091 -30 % 503,415 697,303 -28 %Operating (Loss) Profit (5,967) (27,612) 78 % (39,048) 75,555 >-100% Operating Margin -3.7 % -11.9 % -7.8 % 10.8 %
SUPPLEMENTAL FINANCIAL DATA
(Thousands of Dollars)
38 38
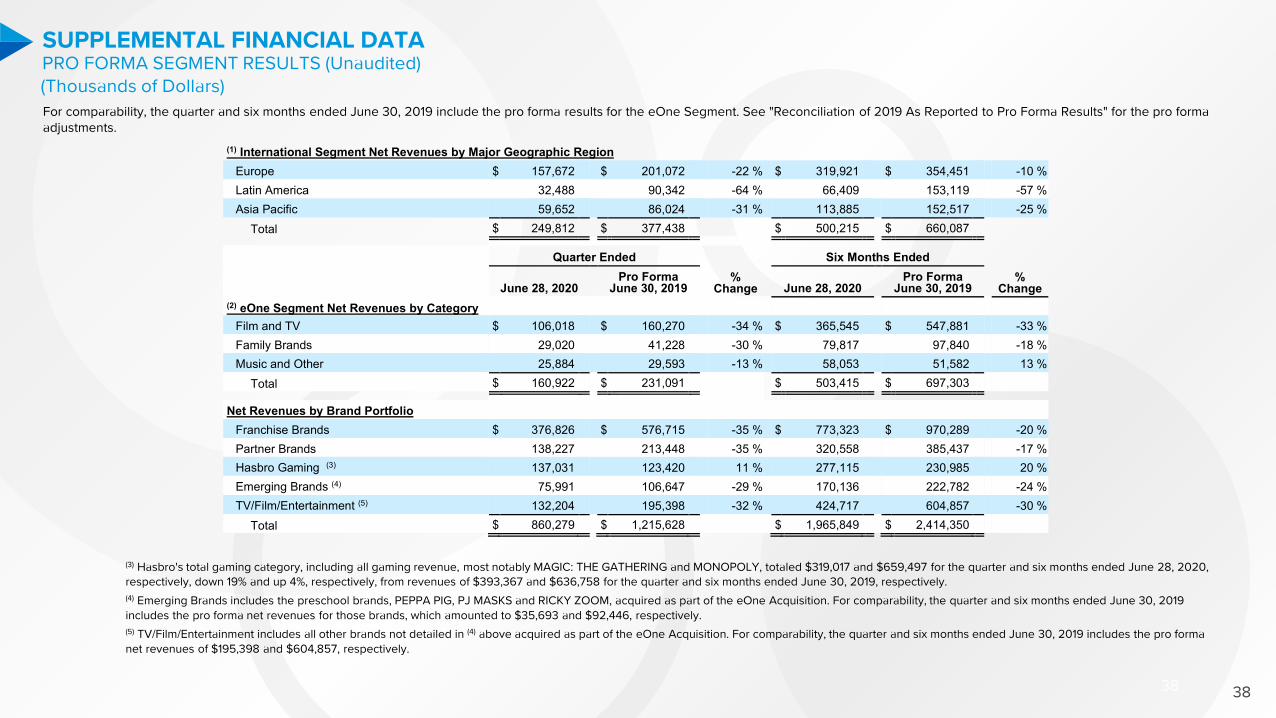
For comparability, the quarter and six months ended June 30, 2019 include the pro forma results for the eOne Segment. See "Reconciliation of 2019 As Reported to Pro Forma Results" for the pro forma adjustments.
(1) International Segment Net Revenues by Major Geographic RegionEurope $ 157,672 $ 201,072 -22 % $ 319,921 $ 354,451 -10 %Latin America 32,488 90,342 -64 % 66,409 153,119 -57 %Asia Pacific 59,652 86,024 -31 % 113,885 152,517 -25 %
Total $ 249,812 $ 377,438 $ 500,215 $ 660,087
Quarter Ended Six Months Ended
June 28, 2020 Pro Forma
June 30, 2019 %
Change June 28, 2020 Pro Forma
June 30, 2019 %
Change (2) eOne Segment Net Revenues by Category
Film and TV $ 106,018 $ 160,270 -34 % $ 365,545 $ 547,881 -33 %Family Brands 29,020 41,228 -30 % 79,817 97,840 -18 %Music and Other 25,884 29,593 -13 % 58,053 51,582 13 %
Total $ 160,922 $ 231,091 $ 503,415 $ 697,303
Net Revenues by Brand Portfolio Franchise Brands $ 376,826 $ 576,715 -35 % $ 773,323 $ 970,289 -20 %Partner Brands 138,227 213,448 -35 % 320,558 385,437 -17 %Hasbro Gaming (3) 137,031 123,420 11 % 277,115 230,985 20 %Emerging Brands (4) 75,991 106,647 -29 % 170,136 222,782 -24 %TV/Film/Entertainment (5) 132,204 195,398 -32 % 424,717 604,857 -30 %
Total $ 860,279 $ 1,215,628 $ 1,965,849 $ 2,414,350
(3) Hasbro's total gaming category, including all gaming revenue, most notably MAGIC: THE GATHERING and MONOPOLY, totaled $319,017 and $659,497 for the quarter and six months ended June 28, 2020,respectively, down 19% and up 4%, respectively, from revenues of $393,367 and $636,758 for the quarter and six months ended June 30, 2019, respectively.(4) Emerging Brands includes the preschool brands, PEPPA PIG, PJ MASKS and RICKY ZOOM, acquired as part of the eOne Acquisition. For comparability, the quarter and six months ended June 30, 2019includes the pro forma net revenues for those brands, which amounted to $35,693 and $92,446, respectively.(5) TV/Film/Entertainment includes all other brands not detailed in (4) above acquired as part of the eOne Acquisition. For comparability, the quarter and six months ended June 30, 2019 includes the pro formanet revenues of $195,398 and $604,857, respectively.
PRO FORMA SEGMENT RESULTS (Unaudited)
SUPPLEMENTAL FINANCIAL DATA RECONCILIATION OF AS REPORTED TO PRO FORMA ADJUSTED OPERATING RESULTS (Unaudited)(Thousands of Dollars)
39 39
For comparability, the quarter and six months ended June 30, 2019 include the pro forma results for the eOne Segment. See "Reconciliation of 2019 As Reported to Pro Forma Results“ on slide 42 for the pro forma and non-GAAP adjustments.
Non-GAAP Adjustments Impacting Operating Profit (Loss) Quarter Ended
June 28, 2020 Pro Forma
June 30, 2019
Pre-tax
Adjustments Post-tax
Adjustments Pre-tax
Adjustments Post-tax
Adjustments Acquisition-Related Expenses (1) $ 10,262 $ 8,514 $ — $ — Severance (2) 11,554 10,125 — — Acquired Intangible Amortization (3) 22,592 17,949 24,597 19,063 Pro Forma eOne Adjustments — — 16,037 12,429 Total $ 44,408 $ 36,588 $ 40,634 $ 31,492 Six Months Ended
June 28, 2020 Pro Forma
June 30, 2019
Pre-tax Adjustments
Post-tax Adjustments Pre-tax
Adjustments Post-tax
Adjustments Acquisition-Related Expenses (1) $ 160,044 $ 135,965 $ — $ — Severance (2) 11,554 10,125 — — Acquired Intangible Amortization (3) 47,620 37,834 49,194 38,125 Pro Forma eOne Adjustments — — 28,041 21,732 Total $ 219,218 $ 183,924 $ 77,235 $ 59,857
(1) In association with the Company's acquisition of eOne, the Company incurred related expenses of $10,262 and $160,044, respectively, in the quarter and six months ended June 28, 2020, comprised of the following:
(i) Acquisition and integration costs of $3,966 and $99,684, respectively, for the quarter and six months ended June 28, 2020, including expense associated with the acceleration of eOne stock-based compensation and advisor fees settled at the closing of the acquisition, as well as integration costs; and
(ii) Restructuring and related costs of $6,296 and $60,360, respectively, for the quarter and six months ended June 28, 2020, including severance and retention costs, as well as impairment charges in the first quarter of 2020 for certain definite-lived intangible and production assets.
(2) In the second quarter of 2020, the Company incurred $11,554 of severance charges, associated with cost-savings initiatives within the Company's commercial and Film and TV businesses. These charges were included in Corporate and Eliminations.
(3) The Company incurred incremental intangible amortization costs related to the intangible assets acquired in the eOne Acquisition.

SUPPLEMENTAL FINANCIAL DATA RECONCILIATION OF AS REPORTED TO PRO FORMA ADJUSTED OPERATING RESULTS (Unaudited)(Thousands of Dollars)
40 40
For comparability, the quarter and six months ended June 30, 2019 include the pro forma results for the eOne Segment. See "Reconciliation of 2019 As Reported to Pro Forma Results“ on slide 42 for the pro forma and non-GAAP adjustments.
Reconciliation of Operating Profit (Loss) Results
Quarter Ended June 28, 2020 Pro Forma
Quarter Ended June 30, 2019
As Reported Non-GAAP
Adjustments Adjusted As Reported Non-GAAP
Adjustments Adjusted % Change Adjusted Company Results External Net Revenues $ 860,279 $ — $ 860,279 $ 1,215,628 $ — $ 1,215,628 -29% Operating Profit 2,175 44,408 46,583 100,721 40,634 141,355 -67% Operating Margin 0.3 % 5.2 % 5.4 % 8.3 % 3.3 % 11.6 %
Adjusted Segment Results U.S. and Canada Segment: External Net Revenues $ 359,720 $ — $ 359,720 $ 510,529 $ — $ 510,529 -30% Operating Profit 24,271 — 24,271 106,577 — 106,577 -77% Operating Margin 6.7 % — 6.7 % 20.9 % — 20.9 %
International Segment: External Net Revenues 249,812 — 249,812 377,438 — 377,438 -34% Operating (Loss) Profit (24,900) — (24,900) 14,583 — 14,583 >-100% Operating Margin -10.0 % — -10.0 % 3.9 % — 3.9 %
Entertainment, Licensing and Digital Segment: External Net Revenues 89,825 — 89,825 96,506 — 96,506 -7% Operating Profit 27,793 — 27,793 7,936 — 7,936 >100% Operating Margin 30.9 % — 30.9 % 8.2 % — 8.2 %
eOne Segment: External Net Revenues 160,922 — 160,922 231,091 — 231,091 -30% Operating (Loss) Profit (5,967) 22,592 16,625 (27,612) 40,634 13,022 28% Operating Margin -3.7 % 14.0 % 10.3 % -11.9 % 17.6 % 5.6 %
Corporate and Eliminations:The Corporate and Eliminations segment included non-GAAP adjustments of $21,816 for the quarter ended June 28, 2020, consisting of eOneacquisition-related expenses and other severance expenses.

SUPPLEMENTAL FINANCIAL DATARECONCILIATION OF AS REPORTED TO PRO FORMA ADJUSTED OPERATING RESULTS (Unaudited)(Thousands of Dollars)
41 41
For comparability, the quarter and six months ended June 30, 2019 include the pro forma results for the eOne Segment. See "Reconciliation of 2019 As Reported to Pro Forma Results“ on slide 42 for the pro forma and non-GAAP adjustments.
Six Months Ended June 28, 2020 Pro Forma
Six Months Ended June 30, 2019
As Reported Non-GAAP
Adjustments Adjusted As Reported Non-GAAP
Adjustments Adjusted % Change Adjusted Company Results External Net Revenues $ 1,965,849 $ — $ 1,965,849 $ 2,414,350 $ — $ 2,414,350 -19% Operating (Loss) Profit (21,108) 219,218 198,110 240,015 77,235 317,250 -38% Operating Margin -1.1 % 11.2 % 10.1 % 9.9 % 3.2 % 13.1 %
Adjusted Segment Results U.S. and Canada Segment: External Net Revenues $ 788,367 $ — $ 788,367 $ 868,380 $ — $ 868,380 -9% Operating Profit 96,051 — 96,051 120,109 — 120,109 -20% Operating Margin 12.2 % — 12.2 % 13.8 % — 13.8 %
International Segment: External Net Revenues 500,215 — 500,215 660,087 — 660,087 -24% Operating Loss (51,591) — (51,591) (15,828) — (15,828) >-100% Operating Margin -10.3 % — -10.3 % -2.4 % — -2.4 %
Entertainment, Licensing and Digital Segment: External Net Revenues 173,852 — 173,852 188,500 — 188,500 -8% Operating Profit 32,967 20,831 53,798 37,956 — 37,956 42% Operating Margin 19.0 % 12.0 % 30.9 % 20.1 % — 20.1 %
eOne Segment: External Net Revenues 503,415 — 503,415 697,303 — 697,303 -28% Operating (Loss) Profit (39,048) 125,349 86,301 75,555 77,235 152,790 -44% Operating Margin -7.8 % 24.9 % 17.1 % 10.8 % 11.1 % 21.9 %
SUPPLEMENTAL FINANCIAL DATA RECONCILIATION OF 2019 AS REPORTED TO PRO FORMA RESULTS (Unaudited)
42
(Thousands of Dollars)Pro forma results were prepared by combining the results of Hasbro and eOne for the quarter ended June 30, 2019, after giving effect to the eOne Acquisition as if it had been consummated on December 31, 2018.
These pro forma results do not represent financial results that would have been realized had the acquisition actually occurred on December 31, 2018, nor are they intended to be a projection of future results. The pro forma financial information is presented for illustrative purposes only and does not reflect the costs of any integration activities or cost savings or synergies that may be achieved as a result of the acquisition.
Quarter Ended June 30, 2019
HasbroAs Reported
eOne (under U.S.
GAAP) Pro Forma
Adjustments (1)
Pro Forma Combined
Net Revenues $ 984,537 $ 231,091 $ — $ 1,215,628
Operating Profit (Loss) $ 128,333 $ (19,040) $ (8,572) $ 100,721 Non-GAAP Adjustments — 32,062 8,572 40,634 Adjusted Operating Profit * $ 128,333 $ 13,022 $ — $ 141,355
* Reconciliation to Pro Forma Adjusted results is as follows:Net Earnings (Loss) $ 13,433 $ (49,532) $ (6,522) $ (42,621) Interest Expense 22,018 12,208 19,106 53,332 Other Expense (Income), Net 100,207 21,236 (19,812) 101,631 Income Tax Benefit (7,325) (3,354) (1,344) (12,023) Net Earnings Attributable to Noncontrolling Interests — 402 — 402 Operating Profit (Loss) 128,333 (19,040) (8,572) 100,721
Non-GAAP Adjustments eOne: Restructuring and Related Charges — 7,373 — 7,373 Acquisition Costs - eOne Deals — 8,664 — 8,664 Acquired Intangible Amortization — 16,025 8,572 24,597
— 32,062 8,572 40,634
Adjusted Operating Profit $ 128,333 $ 13,022 $ — $ 141,355
(1) The pro forma results include certain pro forma adjustments to net earnings that were directly attributable to the acquisition, as if the acquisition had occurred on December 31, 2018, including the following:1. additional amortization expense of $8,572 that would have been recognized as a result of the allocation of purchase consideration to definite-lived intangible assets subject to amortization;2. estimated differences in interest expense of $19,106 as a result of incurring new debt and extinguishing historical eOne debt;3. reduction in other expense of $19,812 related to premiums paid by eOne in connection with the early redemption of its senior secured notes, and the related write-off of unamortized deferred finance charges associated
with the senior secured notes; and4. the income tax effect of the pro forma adjustments in the amount of $1,344, calculated using a blended statutory income tax rate of 22.5% for the eOne adjustments and 21% for the Hasbro interest adjustments.
SUPPLEMENTAL FINANCIAL DATA RECONCILIATION OF 2019 AS REPORTED TO PRO FORMA RESULTS (Unaudited)
43
(Thousands of Dollars)Pro forma results were prepared by combining the results of Hasbro and eOne for the six months ended June 30, 2019, after giving effect to the eOne Acquisition as if it had been consummated on December 31, 2018. These pro forma results do not represent financial results that would have been realized had the acquisition actually occurred on December 31, 2018, nor are they intended to be a projection of future results. The pro forma financial information is presented for illustrative purposes only and does not reflect the costs of any integration activities or cost savings or synergies that may be achieved as a result of the acquisition.
Six Months Ended June 30, 2019
Hasbro As Reported
eOne (under U.S.
GAAP) Pro Forma
Adjustments (2)
Pro Forma Combined
Net Revenues $ 1,717,047 $ 697,303 $ — $ 2,414,350
Operating Profit $ 164,460 $ 96,607 $ (21,052) $ 240,015 Non-GAAP Adjustments — 56,183 21,052 77,235 Adjusted Operating Profit * $ 164,460 $ 152,790 $ — $ 317,250
* Reconciliation to Pro Forma Adjusted results is as follows:Net Earnings (Loss) $ 40,160 $ 25,174 $ (31,427) $ 33,907 Interest Expense 44,332 24,771 38,211 107,314 Other Expense (Income), Net 84,425 25,792 (19,812) 90,405 Income Tax (Benefit) Expense (4,457) 18,278 (8,024) 5,797 Net Earnings Attributable to Noncontrolling Interests — 2,592 — 2,592 Operating Profit (Loss) 164,460 96,607 (21,052) 240,015
Non-GAAP Adjustments eOne: Restructuring and Related Charges — 18,648 — 18,648 Acquisition Costs - eOne Deals — 9,393 — 9,393 Acquired Intangible Amortization — 28,142 21,052 49,194
— 56,183 21,052 77,235
Adjusted Operating Profit $ 164,460 $ 152,790 $ — $ 317,250
(2) The pro forma results include certain pro forma adjustments to net earnings that were directly attributable to the acquisition, as if the acquisition had occurred on December 31, 2018, including the following:1. additional amortization expense of $21,052 that would have been recognized as a result of the allocation of purchase consideration to definite-lived intangible assets subject to amortization;2. estimated differences in interest expense of $38,211 as a result of incurring new debt and extinguishing historical eOne debt;3. reduction in other expense of $19,812 related to premiums paid by eOne in connection with the early redemption of its senior secured notes, and the related write-off of unamortized deferred finance
charges associated with the senior secured notes; and4. the income tax effect of the pro forma adjustments in the amount of $8,024, calculated using a blended statutory income tax rate of 22.5% for the eOne adjustments and 21% for the Hasbro interest
adjustments.

SUPPLEMENTAL FINANCIAL DATARECONCILIATION OF NON-GAAP FINANCIAL MEASURES (Unaudited)Thousands of Dollars & Shares, Except Per Share Data
44
For comparability, the first quarter of 2019 includes the pro forma results for the eOne Segment. See "Reconciliation of 2019 As Reported to Pro Forma Results" for the pro forma and non-GAAP adjustments.
Reconciliation of Net Earnings and Earnings per Share Quarter Ended
(all adjustments reported after-tax) June 28, 2020 Diluted Per
Share Amount Pro Forma
June 30, 2019 Pro Forma
Diluted Per Share Amount (1)
Net Loss Attributable to Hasbro, Inc. $ (33,915) $ (0.25) $ (42,621) $ (0.31) Acquisition-Related Expenses 8,514 0.06 — — Severance 10,125 0.07 — — Acquired Intangible Amortization 17,949 0.13 19,063 0.14 Pro Forma eOne Adjustments — — 12,429 0.09 Pension (2) — — 85,852 0.62 Net Earnings Attributable to Hasbro, Inc., as Adjusted $ 2,673 $ 0.02 $ 74,723 $ 0.54
Six Months Ended
(all adjustments reported after-tax) June 28, 2020 Diluted Per
Share Amount Pro Forma
June 30, 2019 Pro Forma
Diluted Per Share Amount (1)
Net (Loss) Earnings Attributable to Hasbro, Inc. $ (103,552) $ (0.75) $ 33,907 $ 0.25 Acquisition-Related Expenses 135,965 0.99 — — Severance 10,125 0.07 — — Acquired Intangible Amortization 37,834 0.28 38,125 0.28 Pro Forma eOne Adjustments — — 21,732 0.16 Pension (2) $ — — 85,852 0.62 Net Earnings Attributable to Hasbro, Inc., as Adjusted $ 80,372 $ 0.59 $ 179,616 $ 1.31
(1) 2019 Pro Forma Diluted Per Share Amount is calculated using weighted average shares outstanding of 137,586 for the quarter and six months ended June 30, 2019, whichincludes the pro forma impact of issuing shares associated with the financing of the eOne Acquisition.
(2) In the second quarter of 2019, the Company recognized a non-cash charge of $110,777 ($85,852 after-tax) related to the settlement of its U.S. defined benefit pension plan.
SUPPLEMENTAL FINANCIAL DATARECONCILIATION OF NON-GAAP FINANCIAL MEASURES (Unaudited)Thousands of Dollars & Shares, Except Per Share Data
45
For comparability, the first quarter of 2019 includes the pro forma results for the eOne Segment. See "Reconciliation of 2019 As Reported to Pro Forma Results" for the pro forma and non-GAAP adjustments. Reconciliation of EBITDA
Quarter Ended Quarter Ended June 30, 2019
June 28, 2020 Hasbro
As Reported eOne
(under U.S. GAAP)
Pro Forma Adjustments (3)
Pro Forma Combined
Net (Loss) Earnings Attributable to Hasbro, Inc. $ (33,915) $ 13,433 $ (49,532) $ (6,522) $ (42,621) Interest Expense 49,577 22,018 12,208 19,106 53,332 Income Tax Benefit (10,830) (7,325) (3,354) (1,344) (12,023) Net Earnings Attributable to Noncontrolling Interests 1,017 — 402 — 402 Depreciation 32,921 35,380 1,247 — 36,627 Amortization of Intangibles 34,702 11,815 16,025 8,572 36,412 EBITDA $ 73,472 $ 75,321 $ (23,004) $ 19,812 $ 72,129
Non-GAAP Adjustments (see above) 21,816 110,777 35,849 (19,812) 126,814 Adjusted EBITDA $ 95,288 $ 186,098 $ 12,845 $ — $ 198,943
Six Months Ended Six Months Ended June 30, 2019
June 28, 2020 Hasbro
As Reported eOne
(under U.S. GAAP)
Pro Forma Adjustments (3)
Pro Forma Combined
Net (Loss) Earnings Attributable to Hasbro, Inc. $ (103,552) $ 40,160 $ 25,174 $ (31,427) $ 33,907 Interest Expense 104,302 44,332 24,771 38,211 107,314 Income Tax (Benefit) Expense (14,902) (4,457) 18,278 (8,024) 5,797 Net Earnings Attributable to Noncontrolling Interests 2,844 — 2,592 — 2,592 Depreciation 56,587 62,408 3,103 — 65,511 Amortization of Intangibles 71,513 23,631 28,142 21,052 72,825 EBITDA $ 116,792 $ 166,074 $ 102,060 $ 19,812 $ 287,946
Non-GAAP Adjustments (see above) 171,598 110,777 47,853 (19,812) 138,818 Adjusted EBITDA $ 288,390 $ 276,851 $ 149,913 $ — $ 426,764
(3) Pro Forma Adjustments include debt refinancing costs of $19,812, which are excluded from pro forma results, and also shown as a Non-GAAP Adjustment in the reported eOnefinancial statements. The net impact to Pro Forma Adjusted EBITDA is zero.
SUPPLEMENTAL FINANCIAL DATAeOne - FY2019 RESULTS OF OPERATIONS (AS REPORTED UNDER US GAAP) (Unaudited) (Thousands of Dollars)
46 46
Quarter Ended Year Ended
March 2019 June 2019 September
2019 December 2019 December 2019 Net Revenues (1) $ 466,212 $ 231,091 $ 283,310 $ 235,160 $ 1,215,773 Costs and Expenses: Cost of Sales 14,141 17,053 11,497 24,878 67,569 Program Production Cost Amortization 160,857 64,527 92,662 90,414 408,460 Royalties 81,147 55,865 49,533 39,659 226,204 Advertising 21,173 32,870 30,593 37,241 121,877 Amortization of Intangibles 12,117 16,025 14,871 16,552 59,565 Selling, Distribution and Administration 61,130 63,791 61,860 92,996 279,777 Operating Profit (Loss) 115,647 (19,040) 22,294 (66,580) 52,321 Interest Expense 12,563 12,208 10,302 10,772 45,845 Other Expense (Income), Net 4,556 21,236 2,687 (759) 27,720 Earnings (Loss) before Income Taxes 98,528 (52,484) 9,305 (76,593) (21,244) Income Tax Expense (Benefit) 21,632 (3,354) 4,025 (26,815) (4,512) Net Earnings (Loss) 76,896 (49,130) 5,280 (49,778) (16,732) Net Income Attributable to Noncontrolling Interests 2,190 402 2,322 488 5,402 Net Earnings (Loss) Attributable to eOne $ 74,706 $ (49,532) $ 2,958 $ (50,266) $ (22,134)
The eOne financial results above include certain charges that would have been excluded to calculate Adjusted results, as historically reported by eOne. Those charges are outlined below for each quarter in fiscal year 2019.

SUPPLEMENTAL FINANCIAL DATAeOne - FY2019 RESULTS OF OPERATIONS (AS REPORTED UNDER US GAAP) (Unaudited)(Thousands of Dollars)
47 47
Non-GAAP Adjustments Quarter Ended Year Ended
March 2019 June 2019 September
2019 December
2019 December
2019 Restructuring and Related Charges $ 11,275 $ 7,373 $ 3,234 $ 11,526 $ 33,408 Acquisition Costs - eOne Deals 729 8,664 1,324 458 11,175 Hasbro Transaction Costs — — 3,244 3,245 6,489 Selling, Distribution and Administration 12,004 16,037 7,802 15,229 51,072
Debt Refinancing Costs — 19,812 — 19,812 Other Expense (Income), Net — 19,812 — — 19,812
Total $ 12,004 $ 35,849 $ 7,802 $ 15,229 $ 70,884
(1) eOne Net Revenues by category are as follows:Quarter Ended Year Ended
March 2019 June 2019 September
2019 December
2019 December
2019 Film and TV $ 387,611 $ 160,270 $ 199,949 $ 140,581 $ 888,411 Family Brands 56,612 41,228 53,828 58,677 210,345 Music and Other 21,989 29,593 29,533 35,902 117,017 Total $ 466,212 $ 231,091 $ 283,310 $ 235,160 $ 1,215,773
48
SUPPLEMENTAL FINANCIAL DATA(Thousands of Dollars)FY2019 PRO FORMA AND AS REPORTED NET REVENUES BY BRAND PORTFOLIO (Unaudited)
48
The following unaudited quarterly pro forma brand portfolio net revenue information presents the combination of the historical quarterly brand portfolio revenue of Hasbro and eOne for FY2019 and is intended to provide information about how the eOne acquisition might have affected the Company’s historical quarterly revenue. Hasbro’s standalone, as reported quarterly brand portfolio net revenue for FY2019 is also presented below. The pro forma net revenue information is not necessarily indicative of what the combined company’s revenue actually would have been had the acquisition been completed as of the dates indicated, nor does it purport to project the future revenue of the combined company.
Pro Forma 2019
Q1 % of Total Q2
% of Total Q3
% of Total Q4
% of Total Full Year
% of Total
Franchise Brands $ 393,574 33% $ 576,715 47% $ 779,659 42% $ 661,899 40% $ 2,411,847 41% Partner Brands 171,989 14% 213,448 18% 427,029 23% 408,516 24% 1,220,982 20%Hasbro Gaming 107,565 9% 123,420 10% 232,287 13% 246,478 15% 709,750 12%Emerging Brands (1) 116,135 10% 106,647 9% 188,589 10% 167,376 10% 578,747 10%TV/Film/Entertainment (2) 409,459 34% 195,398 16% 230,919 12% 178,898 11% 1,014,674 17%
Total $ 1,198,722 $ 1,215,628 $ 1,858,483 $ 1,663,167 $ 5,936,000
(1) Emerging Brands includes the preschool brands, PEPPA PIG, PJ MASKS and RICKY ZOOM, acquired as part of the eOne acquisition.(2) TV/Film/Entertainment includes all other brands not detailed in (1) above acquired as part of the eOne acquisition.
As Reported 2019
Q1 % of Total Q2
% of Total Q3
% of Total Q4
% of Total Full Year
% of Total
Franchise Brands $ 393,574 54% $ 576,715 59% $ 779,659 49% $ 661,899 46% $ 2,411,847 51% Partner Brands 171,989 23% 213,448 22% 427,029 27% 408,516 29% 1,220,982 26%Hasbro Gaming 107,565 15% 123,420 12% 232,287 15% 246,478 17% 709,750 15%Emerging Brands 59,382 8% 70,954 7% 136,198 9% 111,114 8% 377,648 8% TV/Film/Entertainment — — — — — — — — — —
Total $ 732,510 $ 984,537 $ 1,575,173 $ 1,428,007 $ 4,720,227