Embed Size (px)
Citation preview

April 16, 2019
Fellow shareholders,
Revenue surpassed $4.5 billion in Q1 and we recorded the highest quarterly paid net adds in our history
(9.6m, up 16% year over year). For 20 years, we’ve had the same strategy: when we please our
members, they watch more and we grow more.
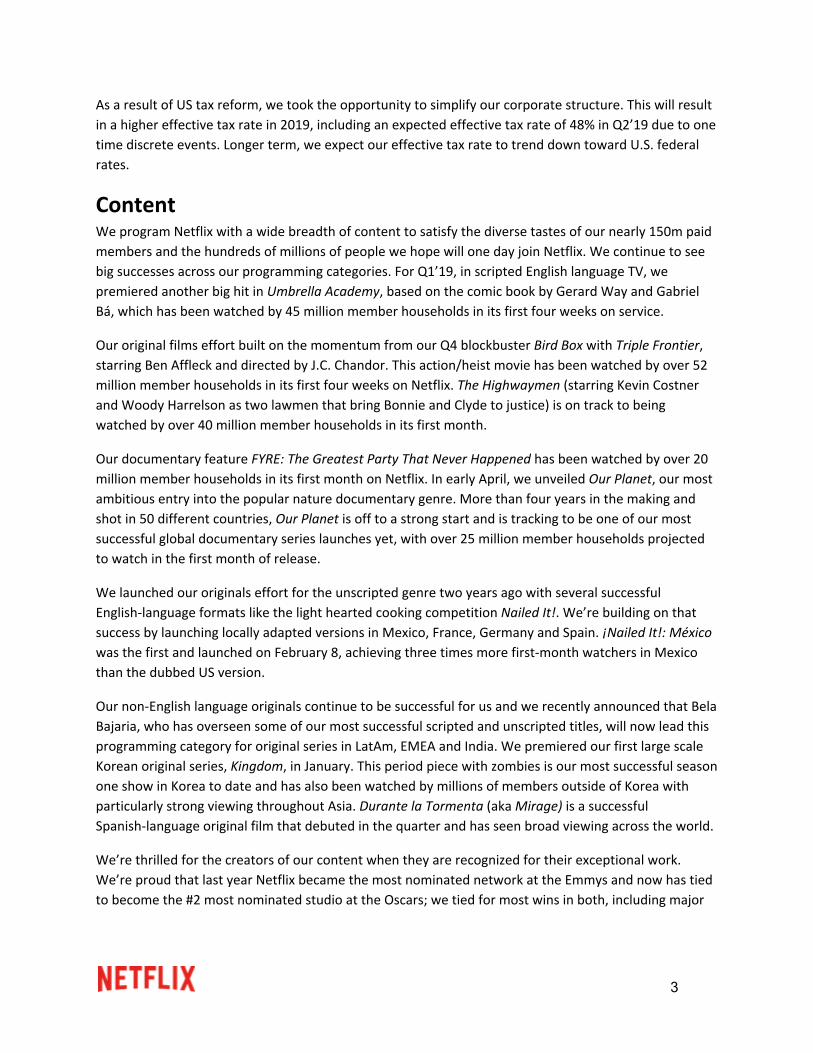
Q1 Results and Q2 Forecast In Q1’19, average streaming paid memberships increased 26% year over year, while ARPU decreased 2%
year over year due to currency headwinds. Excluding F/X, global streaming ARPU improved 3% year over
year and 2% sequentially. Year over year total revenue growth of 22% compares against 40% in Q1’18,
which benefited from several price changes that took place in Q4’17 as well as F/X. On a F/X-neutral
basis, Q1’19 revenue grew 28% year over year.
Operating margin of 10.2% exceeded our beginning-of-quarter expectation as some spending was
shifted from Q1 to later in the year. EPS of $0.76, vs. $0.64 in the prior year period, included a $58
million non-cash unrealized gain from F/X remeasurement on our Euro denominated debt. Streaming
content obligations dipped sequentially in Q1 due in part to the timing of run-of-series commitments. In
addition, as we shift to more original content, there will be greater variability in content obligations
1
quarter-to-quarter due to the timing of when productions start. We early-adopted the new content
accounting standard (ASU 2019-2) in Q1’19. There is no material impact as our content accounting
policies are already consistent with the new rules.
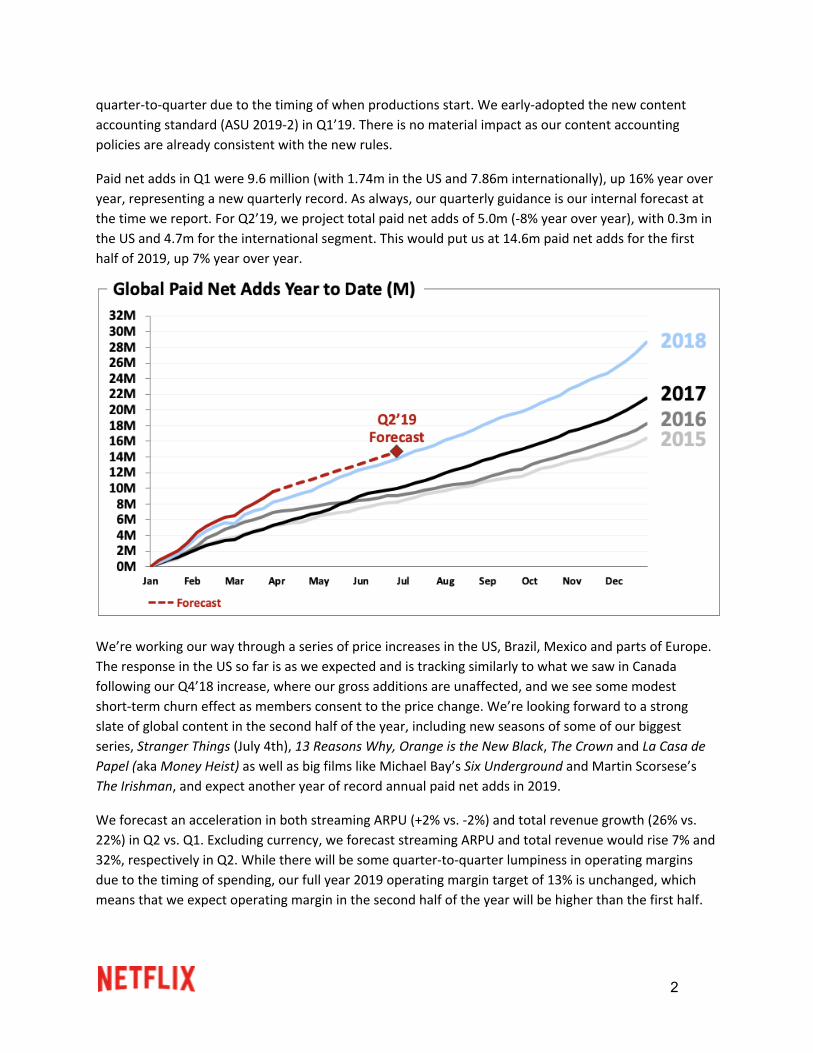
Paid net adds in Q1 were 9.6 million (with 1.74m in the US and 7.86m internationally), up 16% year over
year, representing a new quarterly record. As always, our quarterly guidance is our internal forecast at
the time we report. For Q2’19, we project total paid net adds of 5.0m (-8% year over year), with 0.3m in
the US and 4.7m for the international segment. This would put us at 14.6m paid net adds for the first
half of 2019, up 7% year over year.
We’re working our way through a series of price increases in the US, Brazil, Mexico and parts of Europe.
The response in the US so far is as we expected and is tracking similarly to what we saw in Canada
following our Q4’18 increase, where our gross additions are unaffected, and we see some modest
short-term churn effect as members consent to the price change. We’re looking forward to a strong
slate of global content in the second half of the year, including new seasons of some of our biggest
series, Stranger Things (July 4th), 13 Reasons Why, Orange is the New Black, The Crown and La Casa de
Papel (aka Money Heist) as well as big films like Michael Bay’s Six Underground and Martin Scorsese’s
The Irishman, and expect another year of record annual paid net adds in 2019.
We forecast an acceleration in both streaming ARPU (+2% vs. -2%) and total revenue growth (26% vs.
22%) in Q2 vs. Q1. Excluding currency, we forecast streaming ARPU and total revenue would rise 7% and
32%, respectively in Q2. While there will be some quarter-to-quarter lumpiness in operating margins
due to the timing of spending, our full year 2019 operating margin target of 13% is unchanged, which
means that we expect operating margin in the second half of the year will be higher than the first half.
2
As a result of US tax reform, we took the opportunity to simplify our corporate structure. This will result
in a higher effective tax rate in 2019, including an expected effective tax rate of 48% in Q2’19 due to one
time discrete events. Longer term, we expect our effective tax rate to trend down toward U.S. federal
rates.
Content
We program Netflix with a wide breadth of content to satisfy the diverse tastes of our nearly 150m paid
members and the hundreds of millions of people we hope will one day join Netflix. We continue to see
big successes across our programming categories. For Q1’19, in scripted English language TV, we
premiered another big hit in Umbrella Academy, based on the comic book by Gerard Way and Gabriel
Bá, which has been watched by 45 million member households in its first four weeks on service.
Our original films effort built on the momentum from our Q4 blockbuster Bird Box with Triple Frontier, starring Ben Affleck and directed by J.C. Chandor. This action/heist movie has been watched by over 52
million member households in its first four weeks on Netflix. The Highwaymen (starring Kevin Costner
and Woody Harrelson as two lawmen that bring Bonnie and Clyde to justice) is on track to being
watched by over 40 million member households in its first month.
Our documentary feature FYRE: The Greatest Party That Never Happened has been watched by over 20
million member households in its first month on Netflix. In early April, we unveiled Our Planet, our most
ambitious entry into the popular nature documentary genre. More than four years in the making and
shot in 50 different countries, Our Planet is off to a strong start and is tracking to be one of our most
successful global documentary series launches yet, with over 25 million member households projected
to watch in the first month of release.
We launched our originals effort for the unscripted genre two years ago with several successful
English-language formats like the light hearted cooking competition Nailed It!. We’re building on that
success by launching locally adapted versions in Mexico, France, Germany and Spain. ¡Nailed It!: México
was the first and launched on February 8, achieving three times more first-month watchers in Mexico
than the dubbed US version.
Our non-English language originals continue to be successful for us and we recently announced that Bela
Bajaria, who has overseen some of our most successful scripted and unscripted titles, will now lead this
programming category for original series in LatAm, EMEA and India. We premiered our first large scale
Korean original series, Kingdom, in January. This period piece with zombies is our most successful season
one show in Korea to date and has also been watched by millions of members outside of Korea with
particularly strong viewing throughout Asia. Durante la Tormenta (aka Mirage) is a successful
Spanish-language original film that debuted in the quarter and has seen broad viewing across the world.
We’re thrilled for the creators of our content when they are recognized for their exceptional work.
We’re proud that last year Netflix became the most nominated network at the Emmys and now has tied
to become the #2 most nominated studio at the Oscars; we tied for most wins in both, including major
3

Oscar wins for Alfonso Cuarón for Best Director and Best Cinematographer for Roma, which also won for
Best Foreign Language Feature.
Marketing
Our CMO, Kelly Bennett, will be retiring this year after an amazing seven year run. During this time, Kelly
was a key contributor to the transformation of Netflix from a primarily domestic service with only 2nd
run content to a global service launching an unprecedented amount of original programming and we
thank Kelly for his hard work. Ted Sarandos has led content for nearly 20 years here, and is ready to run
both content and marketing, so he is leading the search for the new CMO, who will report to him.
Product and Partnerships We’ve been expanding our bundling initiative and we are now distributing Netflix through ten different
operator bundles across the globe. To date, these bundles have had a positive effect on our business,
driving incremental acquisition at similar economics to other partnerships where Netflix is offered ȧ la
carte.
Later in Q2 we’ll be running a test to improve our UK member experience by releasing weekly top 10
lists of the most popular content on our UK service across various programming categories. For those
who want to watch what others are watching, this may make choosing titles even easier. After a few
months we’ll decide whether to end or expand the test.
Competition
Recently, Apple and Disney each unveiled their direct-to-consumer subscription video services. Both
companies are world class consumer brands and we’re excited to compete; the clear beneficiaries will
be content creators and consumers who will reap the rewards of many companies vying to provide a
great video experience for audiences.
We don’t anticipate that these new entrants will materially affect our growth because the transition
from linear to on demand entertainment is so massive and because of the differing nature of our
content offerings. We believe we’ll all continue to grow as we each invest more in content and improve
our service and as consumers continue to migrate away from linear viewing (similar to how US cable
networks collectively grew for years as viewing shifted from broadcast networks during the 1980s and
1990s).
We believe there is vast demand for watching great TV and movies and Netflix only satisfies a small
portion of that demand. Last quarter, we talked about how our streaming hours in the US (our most
mature market) on TV still only represents roughly 10% of total TV usage. We are much smaller and have
even more room to grow in other countries and on other devices like mobile. For instance, Sandvine
estimates our share of global downstream mobile internet traffic is about 2%. 1
1 The Sandvine data does not include significant data from either China or India.
4

Source: Sandvine, The Mobile Internet Phenomena Report (February 2019)
Cash Flow and Capital Structure Net cash used in operating activities in Q1’19 was -$380 million vs. -$237 million in the prior year period.
Free cash flow totaled -$460 million vs. -$287 million in the year ago quarter. As a reminder, the gap 2
between net income and free cash flow is primarily driven by our investment in originals and self
produced content where the cash spending is more front end loaded than for second run licensed
programming (where cash payments are generally spread over the term of the license).
We now expect 2019 free cash flow deficit to be modestly higher at approximately -$3.5 billion due to
higher cash taxes related to the change in our corporate structure and additional investments in real
estate and other infrastructure. We’re still expecting free cash flow to improve in 2020 and each year
thereafter, driven by our growing member base, revenues, and operating margins.
There’s no change to our plan to use the high yield market to finance our cash needs. We recently
upsized our revolving credit facility from $500 million to $750 million (which remains undrawn) at the
same cost and extended the term from 2022 to 2024.
Reference For quick reference, our eight most recent investor letters are: January 2019, October 2018, July 2018, April 2018, January 2018, October 2017, July 2017, April 2017.
2 For a reconciliation of free cash flow to net cash (used in) operating activities, please refer to the reconciliation in tabular form on the attached unaudited financial statements and the footnotes thereto.
5
Appendix
April 16, 2019 Earnings Interview, 3pm PST Our video interview with Eric Sheridan of UBS will be on youtube/netflixir at 3pm PST today. Questions
that investors would like to see asked should be sent to [email protected]. Reed Hastings, CEO,
Spence Neumann, CFO, Ted Sarandos, Chief Content Officer, Greg Peters, Chief Product Officer and
Spencer Wang, VP of IR/Corporate Development will all be on the video to answer Eric’s questions.
IR Contact:
Spencer Wang
VP, Finance/IR & Corporate Development
408 809-5360
PR Contact:
Richard Siklos
VP, Corporate Communications
408 540-2629
Use of Non-GAAP Measures
This shareholder letter and its attachments include reference to the non-GAAP financial measure of free
cash flow and adjusted EBITDA. Management believes that free cash flow and adjusted EBITDA are
important liquidity metrics because they measure, during a given period, the amount of cash generated
that is available to repay debt obligations, make investments and for certain other activities or the
amount of cash used in operations, including investments in global streaming content. However, these
non-GAAP measures should be considered in addition to, not as a substitute for or superior to, net
income, operating income, diluted earnings per share and net cash provided by operating activities, or
other financial measures prepared in accordance with GAAP. Reconciliation to the GAAP equivalent of
6
these non-GAAP measures are contained in tabular form on the attached unaudited financial
statements.
Forward-Looking Statements
This shareholder letter contains certain forward-looking statements within the meaning of the federal
securities laws, including statements regarding future content offerings; variability of content
obligations; product tests; impact of competition; future capital raises; ARPU; global streaming
membership growth; tax rate; impact of the change in corporate structure; U.S. and international
streaming paid memberships, paid net additions, revenue, contribution profit (loss) and contribution
margin; consolidated revenue, revenue growth, operating income, operating margin, net income, and
earnings per share; and free cash flow. The forward-looking statements in this letter are subject to risks
and uncertainties that could cause actual results and events to differ, including, without limitation: our
ability to attract new members and retain existing members; our ability to compete effectively;
maintenance and expansion of device platforms for streaming; fluctuations in consumer usage of our
service; service disruptions; production risks; actions of Internet Service Providers; and, competition,
including consumer adoption of different modes of viewing in-home filmed entertainment. A detailed
discussion of these and other risks and uncertainties that could cause actual results and events to differ
materially from such forward-looking statements is included in our filings with the Securities and
Exchange Commission, including our Annual Report on Form 10-K, filed with the Securities and Exchange
Commission (“SEC”) on January 29, 2019, as amended by Form 10-K/A, filed with the SEC on February 8,
2019. The Company provides internal forecast numbers. Investors should anticipate that actual
performance will vary from these forecast numbers based on risks and uncertainties discussed above
and in our Annual Report on Form 10-K, as amended by Form 10-K/A. We undertake no obligation to
update forward-looking statements to reflect events or circumstances occurring after the date of this
shareholder letter.
7

8
Netflix, Inc.
Consolidated Statements of Operations (unaudited) (in thousands, except per share data)
Three Months Ended
March 31,2019
December 31,2018
March 31,2018
Revenues $ 4,520,992 $ 4,186,841 $ 3,700,856
Cost of revenues 2,870,614 2,733,400 2,300,579
Marketing 616,578 730,355 536,777
Technology and development 372,764 331,789 282,310
General and administrative 201,952 175,530 134,612
Operating income 459,084 215,767 446,578
Other income (expense):
Interest expense (135,529) (128,807) (81,219)
Interest and other income (expense) 76,104 32,436 (65,743)
Income before income taxes 399,659 119,396 299,616
Provision for (benefit from) income taxes 55,607 (14,538) 9,492
Net income $ 344,052 $ 133,934 $ 290,124
Earnings per share:
Basic $ 0.79 $ 0.31 $ 0.67
Diluted $ 0.76 $ 0.30 $ 0.64
Weighted-average common shares outstanding:
Basic 436,947 436,385 434,174
Diluted 451,922 451,116 450,359

9
Netflix, Inc.
Consolidated Balance Sheets (unaudited) (in thousands)
As of
March 31,2019
December 31,2018
Assets
Current assets:
Cash and cash equivalents $ 3,348,557 $ 3,794,483
Current content assets, net — 5,151,186
Other current assets 820,350 748,466
Total current assets 4,168,907 9,694,135
Non-current content assets, net 20,888,785 14,960,954
Property and equipment, net 434,372 418,281
Other non-current assets 1,726,568 901,030
Total assets $ 27,218,632 $ 25,974,400
Liabilities and Stockholders' Equity
Current liabilities:
Current content liabilities $ 4,863,351 $ 4,686,019
Accounts payable 439,496 562,985
Accrued expenses and other liabilities 746,268 477,417
Deferred revenue 808,692 760,899
Total current liabilities 6,857,807 6,487,320
Non-current content liabilities 3,560,364 3,759,026
Long-term debt 10,305,023 10,360,058
Other non-current liabilities 792,380 129,231
Total liabilities 21,515,574 20,735,635
Stockholders' equity:
Common stock 2,439,773 2,315,988
Accumulated other comprehensive loss (25,600) (19,582)
Retained earnings 3,288,885 2,942,359
Total stockholders' equity 5,703,058 5,238,765
Total liabilities and stockholders' equity $ 27,218,632 $ 25,974,400

10
Netflix, Inc.
Consolidated Statements of Cash Flows (unaudited) (in thousands)
Three Months EndedMarch 31,
2019December 31,
2018March 31,
2018
Cash flows from operating activities:
Net income $ 344,052 $ 133,934 $ 290,124
Adjustments to reconcile net income to net cash used in operating activities:
Additions to streaming content assets (2,997,746) (3,784,252) (2,986,747)
Change in streaming content liabilities (14,698) 266,653 378,885
Amortization of streaming content assets 2,124,686 2,053,660 1,748,844
Amortization of DVD content assets 8,509 8,965 11,134
Depreciation and amortization of property, equipment and intangibles 23,561 23,219 19,041
Stock-based compensation expense 101,200 88,714 68,395
Other non-cash items 37,199 9,336 8,209
Foreign currency remeasurement loss (gain) on long-term debt (57,600) (21,953) 41,080
Deferred taxes 6,627 (14,479) (22,049)
Changes in operating assets and liabilities:
Other current assets (32,076) (88,359) (55,905)
Accounts payable (124,467) 121,831 74,083
Accrued expenses and other liabilities 157,647 (49,776) 119,049
Deferred revenue 47,793 44,176 55,270
Other non-current assets and liabilities (4,486) (26,741) 13,830
Net cash used in operating activities (379,799) (1,235,072) (236,757)
Cash flows from investing activities:
Acquisition of DVD content assets (9,170) (7,507) (10,796)
Purchases of property and equipment (60,381) (70,120) (37,170)
Change in other assets (10,552) (2,731) (1,786)
Net cash used in investing activities (80,103) (80,358) (49,752)
Cash flows from financing activities:
Proceeds from issuance of debt — 2,061,852 —
Debt issuance costs — (18,879) —
Proceeds from issuance of common stock 22,972 11,450 56,335
Other financing activities — (559) (321)
Net cash provided by financing activities 22,972 2,053,864 56,014
Effect of exchange rate changes on cash, cash equivalents, and restricted cash(5,014) (4,957) 7,177
Net increase (decrease) in cash, cash equivalents, and restricted cash (441,944) 733,477 (223,318)
Cash, cash equivalents and restricted cash at beginning of period 3,812,041 3,078,564 2,822,795
Cash, cash equivalents and restricted cash at end of period $ 3,370,097 $ 3,812,041 $ 2,599,477
Three Months EndedMarch 31,
2019December 31,
2018March 31,
2018
Non-GAAP free cash flow reconciliation:Net cash used in operating activities $ (379,799) $ (1,235,072) $ (236,757)
Acquisition of DVD content assets (9,170) (7,507) (10,796)
Purchases of property and equipment (60,381) (70,120) (37,170)
Change in other assets (10,552) (2,731) (1,786)
Non-GAAP free cash flow $ (459,902) $ (1,315,430) $ (286,509)

11
Netflix, Inc.
Segment Information (unaudited) (in thousands)
As of / Three Months Ended
March 31,2019
December 31,2019
March 31,2018
Domestic Streaming
Paid memberships at end of period 60,229 58,486 55,087
Paid net membership additions 1,743 1,529 2,277
Free trials 1,563 2,065 1,618
Revenues $ 2,073,555 $ 1,996,092 $ 1,820,019
Cost of revenues 1,139,535 1,093,446 936,480
Marketing 221,046 312,739 250,719
Contribution profit 712,974 589,907 632,820
International Streaming
Paid memberships at end of period 88,634 80,773 63,815
Paid net membership additions 7,861 7,308 5,981
Free trials 5,003 7,131 4,475
Revenues $ 2,366,749 $ 2,105,592 $ 1,782,086
Cost of revenues 1,697,121 1,606,275 1,321,706
Marketing 395,532 417,616 286,058
Contribution profit 274,096 81,701 174,322
Domestic DVD
Paid memberships at end of period 2,565 2,706 3,138
Free trials 22 25 29
Revenues $ 80,688 $ 85,157 $ 98,751
Cost of revenues 33,958 33,679 42,393
Contribution profit 46,730 51,478 56,358
Consolidated
Revenues $ 4,520,992 $ 4,186,841 $ 3,700,856
Cost of revenues 2,870,614 2,733,400 2,300,579
Marketing 616,578 730,355 536,777
Contribution profit 1,033,800 723,086 863,500
Other operating expenses 574,716 507,319 416,922
Operating income 459,084 215,767 446,578
Other expense (59,425) (96,371) (146,962)
Provision for (benefit from) income taxes 55,607 (14,538) 9,492
Net income $ 344,052 $ 133,934 $ 290,124

12
Netflix, Inc.
Non-GAAP Information(unaudited) (in thousands)
March 31,2018
June 30,2018
September 30,2018
December 31,2018
March 31,2019
Non-GAAP Adjusted EBITDA reconciliation:
GAAP net income $ 290,124 $ 384,349 $ 402,835 $ 133,934 $ 344,052
Add:
Other expense 146,962 33,577 101,858 96,371 59,425
Provision for (benefit from) income taxes 9,492 44,287 (24,025) (14,538) 55,607
Depreciation and amortization of property,equipment and intangibles 19,041 19,736 21,161 23,219 23,561
Stock-based compensation expense 68,395 81,232 82,316 88,714 101,200
Adjusted EBITDA $ 534,014 $ 563,181 $ 584,145 $ 327,700 $ 583,845


![Digital Booklet - The Heist [Deluxe]](https://img.pdfslide.us/doc/110x75/55cf9de0550346d033afa680/digital-booklet-the-heist-deluxe.jpg)