Embed Size (px)
Citation preview

ASSA ABLOY is the global leader in door opening solutions, dedicated to satisfying end-user needs for security, safety and convenience
© ASSA ABLOY. All rights reserved
Q1 Report 2017

© ASSA ABLOY. All rights reserved
41% 39% 12%
3% 1% 4%
ASSA ABLOY overview Jan-Mar 2017
Net sales 18.1
EBIT 2.8
Op cash flow 0.8
Net debt 23.3
Market cap* 216
Electro-mechanical
locks27%
Entrance Automation
27%
Mechanical locks28%
Doors18%
Financials (SEK bn) Sales by product group Mar 2017
Sales by region Mar 2017 Leading market position
1.1
2.1
2.5*
7.7
0.0 2.0 4.0 6.0 8.0
Estimated annual sales 2016, EUR Billions
* Dormakaba, including Stanley Mechanical Security, pro forma
2
* April 25, 2017

© ASSA ABLOY. All rights reserved
Q1 2017 in brief
Strong start of 2017
• Organic growth in all divisions
• Strong growth in electro-
mechanical solutions
• Good development in many mature
markets, with strong growth in key
markets like USA, Scandinavia, UK
and Germany
• Stabilization of demand in China
• Positive Easter effect
3
© ASSA ABLOY. All rights reserved
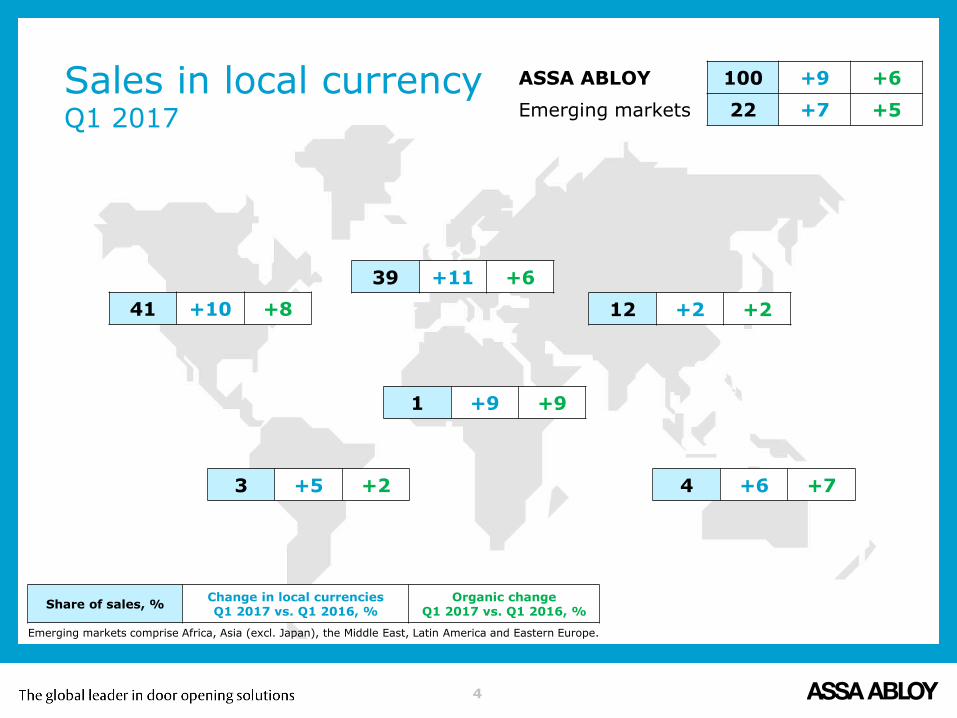
Sales in local currencyQ1 2017
4
Emerging markets comprise Africa, Asia (excl. Japan), the Middle East, Latin America and Eastern Europe.
41 +10 +8
3 +5 +2
39 +11 +6
1 +9 +9
12 +2 +2
4 +6 +7
ASSA ABLOY 100 +9 +6
Emerging markets 22 +7 +5
Share of sales, %Change in local currencies Q1 2017 vs. Q1 2016, %
Organic change Q1 2017 vs. Q1 2016, %
© ASSA ABLOY. All rights reserved
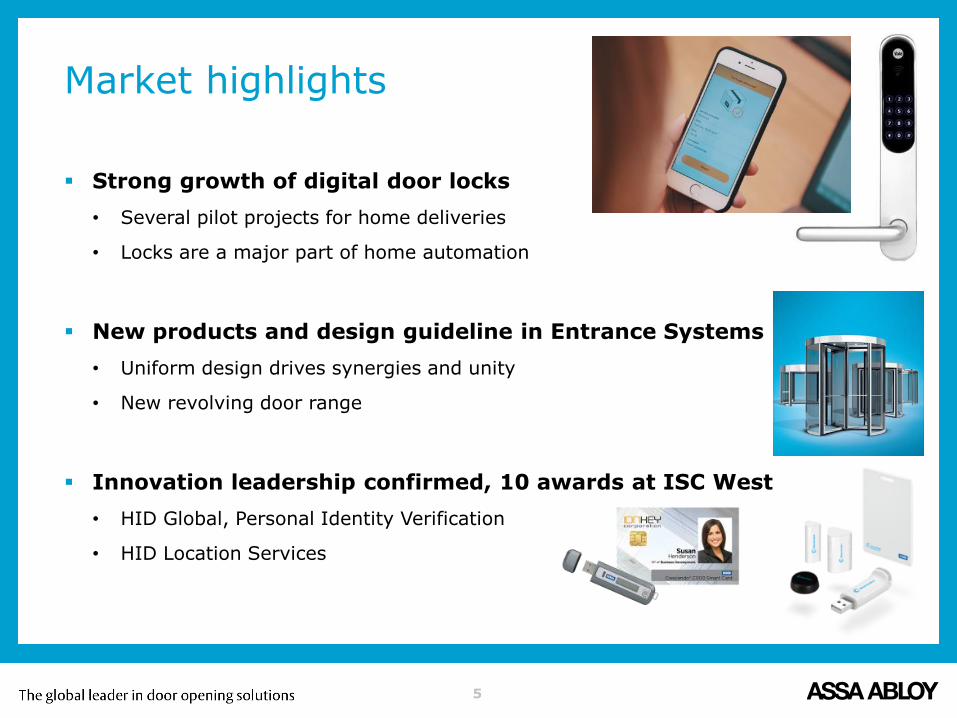
Market highlights
Strong growth of digital door locks
• Several pilot projects for home deliveries
• Locks are a major part of home automation
New products and design guideline in Entrance Systems
• Uniform design drives synergies and unity
• New revolving door range
Innovation leadership confirmed, 10 awards at ISC West
• HID Global, Personal Identity Verification
• HID Location Services
5

© ASSA ABLOY. All rights reserved
HES 1500/1600 IN220 Lock
HID Location Services
Medeco XT Dual-Tech Cylinder
Attack Resistant Door Opening
HID PIV Enterprise and HID PIV Express
IN220 Power over Ethernet Lock
Adams Rite 8800 Series Narrow Stile Rim Exit Device
Medeco XT Slim Line B Key with XT Air App
HES 1500/1600
10 ISC West Awards for ASSA ABLOY

© ASSA ABLOY. All rights reserved
Q1 2017 figures in summary
Sales SEK 18,142 M +14%
• 6% organic (2% price, 4% volume)
• 3% acquired, 5% currency
EBIT SEK 2,787 M +16%
• Currency effect SEK 133 M
Margin 15.4% (15.2)
EPS SEK 1.73 +17%
2 411
2 787
0
500
1 000
1 500
2 000
2 500
3 000
3 500
4 000
4 500
5 000
0
2 000
4 000
6 000
8 000
10 000
12 000
14 000
16 000
18 000
20 000
Q1 16 Q1 17
Sales, SEK M EBIT, SEK M
Sales EBITSales +14%
7

© ASSA ABLOY. All rights reserved
Sales growth, currency adjusted
45 000
50 000
55 000
60 000
65 000
70 000
75 000
80 000
-10
-5
0
5
10
15
20
25
2012 2013 2014 2015 2016 2017
Organic growth, % Acquired growth, % Sales in fixed currencies, SEK M
8
SEK M%
2017 QTD
Organic +6%
Acquired +3%
+9%

© ASSA ABLOY. All rights reserved
Operating margin, %
13
14
15
16
17
18
13
14
15
16
17
18
2012 2013 2014 2015 2016 2017
Quarter Rolling 12-months
9
Long term target range (average)
Dilution from 2017 acquisitions currencyQ1 -0.2% 0.1%
*) Excluding China write down SEK 300 M in Q4 and full year 2016 and restructuring items.
Run rate 16.2%* (16.2) %
© ASSA ABLOY. All rights reserved
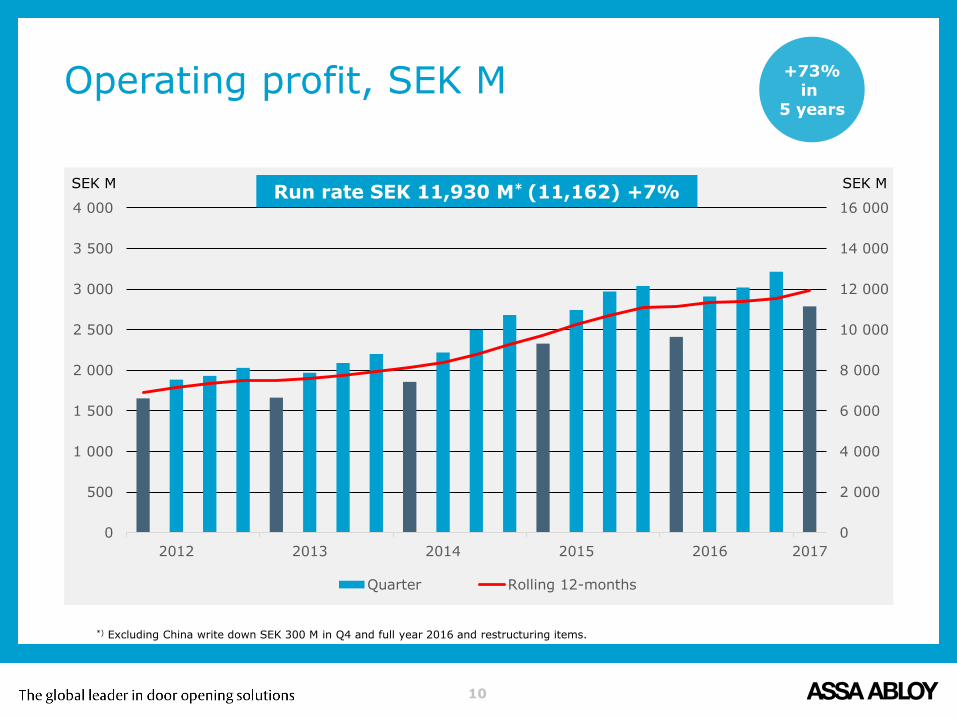
Operating profit, SEK M
0
2 000
4 000
6 000
8 000
10 000
12 000
14 000
16 000
0
500
1 000
1 500
2 000
2 500
3 000
3 500
4 000
2012 2013 2014 2015 2016 2017
Quarter Rolling 12-months
10
SEK M SEK MRun rate SEK 11,930 M* (11,162) +7%
*) Excluding China write down SEK 300 M in Q4 and full year 2016 and restructuring items.
+73%in
5 years

© ASSA ABLOY. All rights reserved
Manufacturing footprint
Status of programs launched 2006-2016
• 76 factories closed to date, 12 to go
• 111 factories converted to assembly, 35 to go
Total personnel reduction
• 12,319 FTE in total since 2006
• 157 FTE in recent quarter
• 1,965 FTE to go for all programs
11
SEK 1,484 M provisions remain for all programs

© ASSA ABLOY. All rights reserved
Acquisitions
Fully active pipeline
15 acquisitions consolidated last 12 months
7 acquisitions in 2017
Acquired annualized sales in 2017 SEK 700 M, +1%
12

© ASSA ABLOY. All rights reserved
Jerith, USA
Turnover of SEK 200 M with
75 employees
Leading supplier of aluminum
fencing in the US
Complementary to the
perimeter security business
Accretive to EPS
13

© ASSA ABLOY. All rights reserved
Reco Port, Sweden
Turnover of SEK 90 M with
40 employees
Develops, manufactures and
installs folding doors and
sectional overhead doors
Strong position within the folding
door segment in Sweden
Accretive to EPS
14

© ASSA ABLOY. All rights reserved
Division – EMEA
Organic growth of 5%
• Strong growth in Scandinavia, Finland, UK, Germany, and Southern Europe
• Good growth in France and Eastern Europe
• Flat in Benelux and negative in the Middle East
• Electromechanical products lead the growth
Operating margin 16.3% (15.8)
• Organic growth leverage +0.3%
+ Leverage
- Material cost
+ Footprint savings
• Acquisitions +0.1% and currency +0.1%
10%
12%
14%
16%
18%
20%
22%
2 000
2 500
3 000
3 500
4 000
4 500
5 000
Q1
15
Q2
15
Q3
15
Q4
15
Q1
16
Q2
16
Q3
16
Q4
16
Q1
17
Sales, SEK M Operating margin, %
15
24% of Group sales
Excluding restructuring items.

© ASSA ABLOY. All rights reserved
EMEA Financial Review
* Excluding restructuring items.
SEK M Q1 2016 Organic Currency Acq/Div Q1 2017
Growth 5% 2% 3% 10%
Sales 4,004 195 85 120 4,404
Operating income (EBIT) 634 44 18 23 718
Operating margin, % 15.8% 22.4% 21.2% 18.9% 16.3%
Dilution/accretion 0.3% 0.1% 0.1%
12 months figures*
EBIT 2,628 2,806
Operating cash flow before paid interest
2,593 2,776
Cash flow/EBIT 99% 99%
16

© ASSA ABLOY. All rights reserved
Americas
Organic growth of 7%
• Strong growth in Electromechanical,
Security doors, Perimeter protection,
Residential, Mexico and South America
(ex Brazil).
• Good growth in Architectural Hardware,
High security and Canada
• Negative in Brazil
Operating margin 21.0% (20.8)
• Organic growth leverage +0.3%
+ Good leverage
- Material cost
- Brazil
• Currency -0.1%
18%
19%
20%
21%
22%
23%
2 500
3 000
3 500
4 000
4 500
5 000
Q1
15
Q2
15
Q3
15
Q4
15
Q1
16
Q2
16
Q3
16
Q4
16
Q1
17
Sales, SEK M Operating margin, %
17
25% of Group sales
Excluding restructuring items.

© ASSA ABLOY. All rights reserved
Americas Financial Review
SEK M Q1 2016 Organic Currency Acq/Div Q1 2017
Growth 7% 8% 0% 15%
Sales 3,969 282 313 2 4,566
Operating profit 824 74 62 0 961
Operating margin, % 20.8% 26.3% 19.8% 16.0% 21.0%
Dilution/accretion 0.3% -0.1% 0.0%
12 months figures*
EBIT 3,415 3,777
Operating cash flow before paid interest
3,332 3,373
Cash flow/EBIT 98% 89%
* Excluding restructuring items.
18

© ASSA ABLOY. All rights reserved
Asia Pacific
Organic growth of 3%
• Strong growth in Pacific, South Korea,
South Asia and Japan
• Strong growth in Digital Door Locks
• Flat sales in China
• Personnel adjustment in China YoY -12%
Operating margin 7.9% (9.9)
• Organic growth leverage -2.0%
- Material cost
- Redundancy cost
+ Savings
• Currency +/- 0 0%
5%
10%
15%
0
500
1 000
1 500
2 000
2 500
3 000
3 500
Q1
15
Q2
15
Q3
15
Q4
15
Q1
16
Q2
16
Q3
16
Q4
16
Q1
17
Sales, SEK M Operating margin, %
19
10% of Group sales
Excluding write down in China in Q4 2016 and restructuring items.

© ASSA ABLOY. All rights reserved
* Excluding write down in China in Q4 2016 and restructuring items.
Asia Pacific Financial Review
SEK M Q1 2016 Organic Currency Acq/Div Q1 2017
Growth 3% 6% 0% 9%
Sales 1,758 63 100 -3 1,917
Operating profit 174 -32 10 0 151
Operating margin, % 9.9% -50.5% 9.6% 14.7% 7.9%
Dilution/accretion -2.0% 0.0% 0.0%
12 months figures*
EBIT 1,421 1,064
Operating cash flow before paid interest
1,226 1,631
Cash flow/EBIT 86% 153%
20
© ASSA ABLOY. All rights reserved
14%
16%
18%
20%
22%
1 000
1 500
2 000
2 500
3 000
Q1
15
Q2
15
Q3
15
Q4
15
Q1
16
Q2
16
Q3
16
Q4
16
Q1
17
Sales, SEK M Operating margin, %
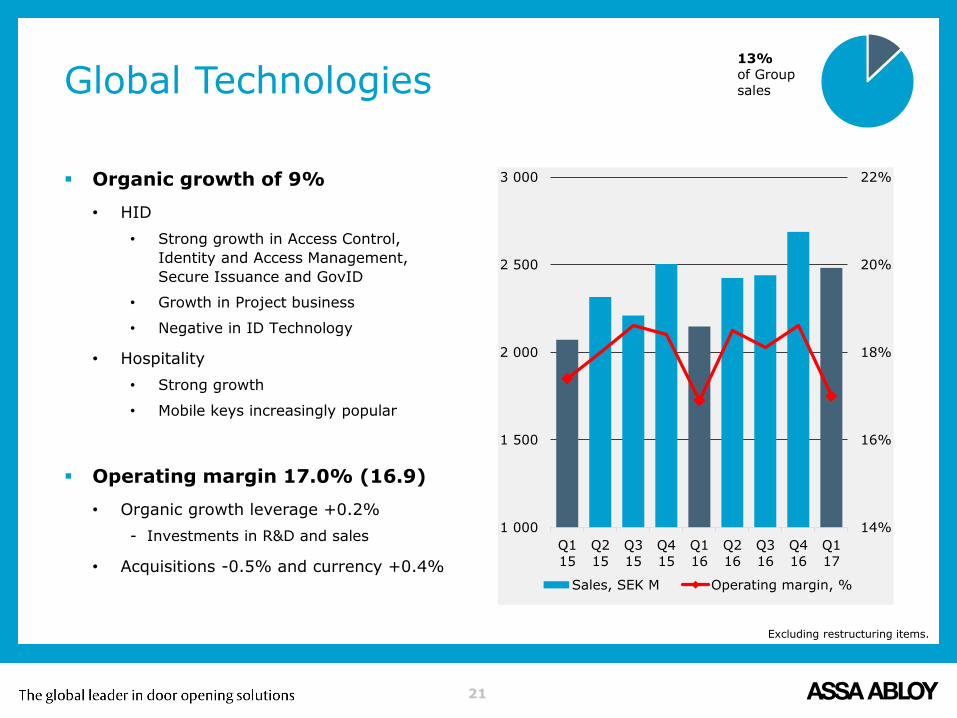
Global Technologies
Organic growth of 9%
• HID
• Strong growth in Access Control,
Identity and Access Management,
Secure Issuance and GovID
• Growth in Project business
• Negative in ID Technology
• Hospitality
• Strong growth
• Mobile keys increasingly popular
Operating margin 17.0% (16.9)
• Organic growth leverage +0.2%
- Investments in R&D and sales
• Acquisitions -0.5% and currency +0.4%
21
13% of Group sales
Excluding restructuring items.

© ASSA ABLOY. All rights reserved
Global Technologies Financial Review
SEK M Q1 2016 Organic Currency Acq/Div Q1 2017
Growth 9% 6% 1% 16%
Sales 2,147 213 100 22 2,481
Operating profit 363 41 27 -8 422
Operating margin, % 16.9% 19.2% 27.0% -39.2% 17.0%
Dilution/accretion 0.2% 0.4% -0.5%
12 months figures*
EBIT 1,650 1,811
Operating cash flow before paid interest
1,537 1,671
Cash flow/EBIT 93% 92%
* Excluding restructuring items.
22

© ASSA ABLOY. All rights reserved
Entrance Systems
Organic growth of 7%
• Strong growth in Door automatics, High
speed doors, Door components, US
Industrial and US Residential
• Good growth in EU industrial doors
Operating margin 12.5% (12.3)
• Organic growth leverage +0.8%
+ Good leverage from growth
and consolidation
- Direct material
• Acquisitions –0.5% and currency -0.1% 10%
11%
12%
13%
14%
15%
16%
17%
18%
2 000
2 500
3 000
3 500
4 000
4 500
5 000
5 500
6 000
Q1
15
Q2
15
Q3
15
Q4
15
Q1
16
Q2
16
Q3
16
Q4
16
Q1
17
Sales, SEK M Operating margin, %
23
28% of Group sales
Excluding restructuring items.

© ASSA ABLOY. All rights reserved
Entrance Systems Financial Review
SEK M Q1 2016 Organic Currency Acq/Div Q1 2017
Growth 7% 5% 7% 19%
Sales 4,291 296 192 308 5,087
Operating profit 529 76 17 17 638
Operating margin, % 12.3% 25.8% 8.7% 5.4% 12.5%
Dilution/accretion 0.8% -0.1% -0.5%
12 months figures*
EBIT 2,479 2,862
Operating cash flow before paid interest
2,578 2,970
Cash flow/EBIT 104% 104%
* Excluding restructuring items.
24

© ASSA ABLOY. All rights reserved
Financial highlights Q1 2017
25
January - March
SEK M 2016 2017 Change
Sales 15,891 18,142 14%
- Organic growth* 400 1,022 6%
- Acquired growth 490 448 3%
- FX-differences* -251 780 5%
Operating income (EBIT) 2,411 2,787 16%
EBIT-margin 15.2% 15.4%
Income before tax 2,209 2,593 17%
Net income 1,638 1,918 17%
EPS, SEK 1.47 1.73 17%
Operating cash flow 498 824 65%
* The sales components Organic growth and FX-differences has been restated for the first quarter 2016. No effect on sales numbers.

© ASSA ABLOY. All rights reserved
Bridge Analysis – Q1 2017
Good leverage, except APAC
Small positive currency effect
Dilution from acquisitions in Entrance Systems
26
SEK M Q1 2016 Organic Currency Acq/Div Q1 2017
6% 5% 3% 14%
Sales 15,891 1,022 780 448 18,142
Operating profit 2,411 213 133 31 2,787
Operating margin, % 15.2% 20.8% 17.1% 6.8% 15.4%
Dilution/accretion 0.3% 0.1% -0.2%

© ASSA ABLOY. All rights reserved
P&L components as % of salesQ1 2017
Higher material cost
Organic growth leverage
• Conversion costs -0.9%, also improved by manufacturing footprint
• Lower S, G & A with 0.1% vs. previous year,
affected by investments in R&D and sales
27
% Q1 2016Q1 2017
excl. acquisitions Δ Q1 2017
Direct material 34.5% 35.1% +0.6% 35.2%
Conversion costs 25.9% 25.0% -0.9% 25.2%
Gross margin 39.6% 39.9% +0.3% 39.6%
S, G & A 24.4% 24.3% -0.1% 24.2%
EBIT 15.2% 15.6% +0.4% 15.4%

© ASSA ABLOY. All rights reserved
Operating cash flow, SEK M
0
2 000
4 000
6 000
8 000
10 000
12 000
14 000
16 000
18 000
20 000
0
500
1 000
1 500
2 000
2 500
3 000
3 500
4 000
4 500
5 000
2012 2013 2014 2015 2016 2017
Quarter, SEK M Cash rolling 12 months, SEK M EBT rolling 12 months, SEK M
28
Quarter 12 months12 months cash / EBT = 99%*
*) Excluding China write down SEK 300 M in Q4 and full year 2016 and restructuring items.

© ASSA ABLOY. All rights reserved
Gearing % and net debt, SEK M
0
15
30
45
60
75
90
0
5 000
10 000
15 000
20 000
25 000
30 000
2012 2013 2014 2015 2016 2017
Net debt, SEK M Gearing, %
29
Net debt GearingDebt/Equity 48% (58)
Net debt/EBITDA1.8 (2.0)

© ASSA ABLOY. All rights reserved
2,00
3,00
4,00
5,00
6,00
7,00
8,00
0,50
0,75
1,00
1,25
1,50
1,75
2,00
2012 2013 2014 2015 2016 2017
Quarter, SEK Rolling 12-months, SEK
Quarter
Earnings per share, SEK
30
12 monthsQ1 EPS 1.73 +17%
*) Excluding restructuring items of SEK 1,597 M for Q4 and full year 2016.Chart is restated for Stock split 3:1 2015 and excludes cost for restructuring programs in 2013 and 2016.
+71%in
5 years

© ASSA ABLOY. All rights reserved
Conclusions Q1 2017
+14% sales growth, whereof
9% excluding currency
Strong growth in all divisions,
but APAC
Growth in APAC
Technology leadership
EBIT +16% and EPS +17%
31

© ASSA ABLOY. All rights reserved
www.assaabloy.com