Embed Size (px)
Citation preview

Q1-Q2 Customer Satisfaction
Survey Results
September 5, 2017
Arthur Borkwood, Head - ̶ Customer Development
Background
• One of the critical measures of perceptions about the TTC
• Measures the overall level of customer satisfaction with key aspects of
service provided by the TTC
Objectives
• Tracking customer satisfaction over time
• Identifying and understanding key drivers of customer satisfaction and
customer loyalty
• Identifying and prioritizing critical areas for improvement
• Use insights to develop action plans and improve customer satisfaction
2
Objectives of CSS
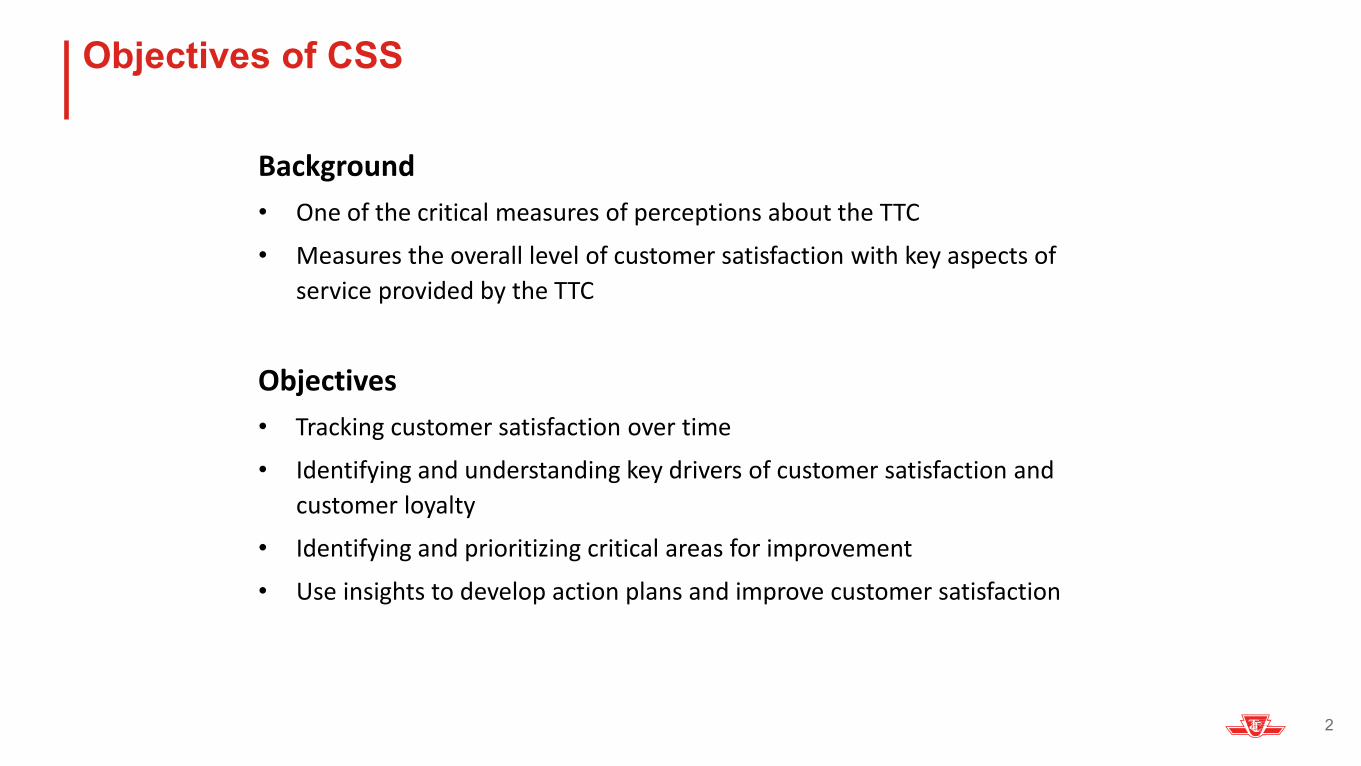
Methodology
Method 10-minute telephone survey
Respondents
City of Toronto residents 13 - 70 years of age Frequent users (once every few weeks or more) Standard industry exclusions
Timing April 2017 - June 2017
Sample Size n=1,001
3
4
Top line results
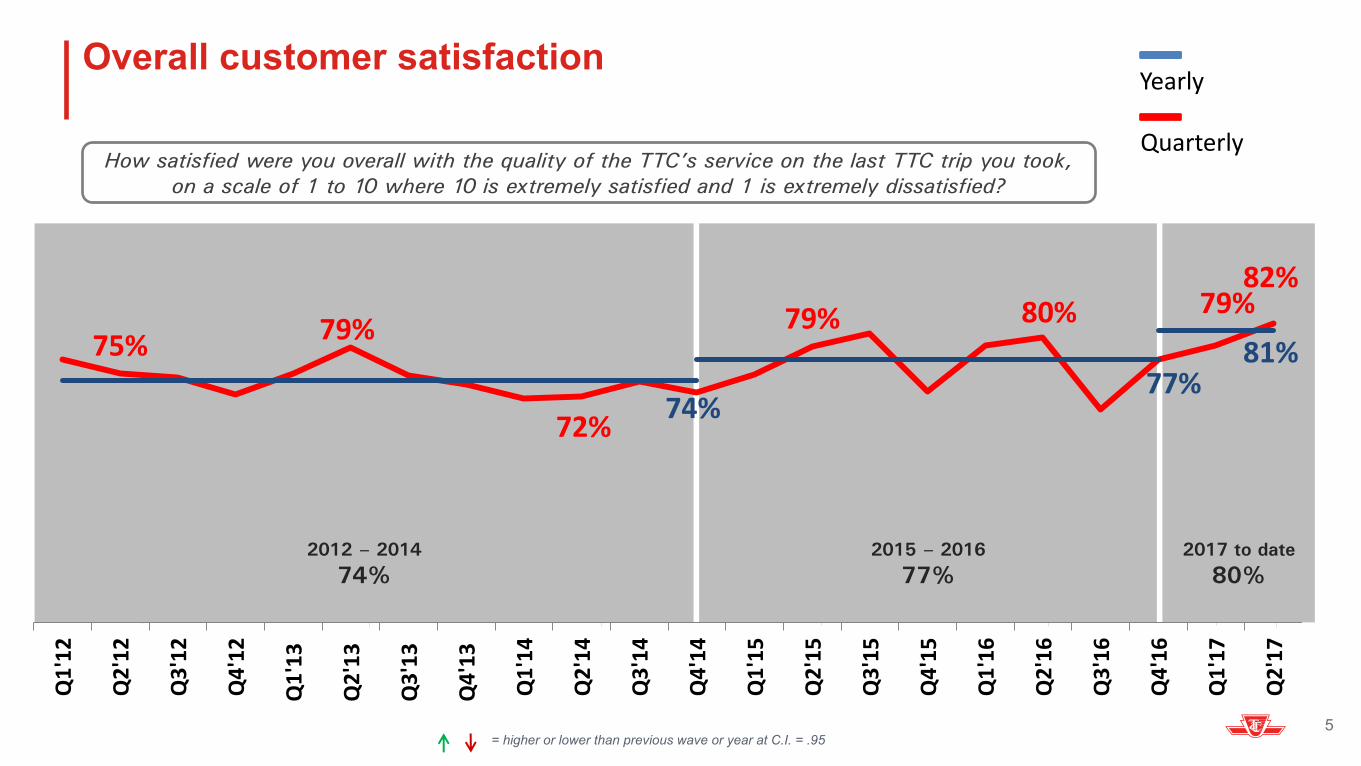
Overall customer satisfaction
2012 – 2014
74%
2015 – 2016
77%
2017 to date
80%
75% 79%
72%
79% 80% 79% 82%
74% 77%
81%
Q1
'12
Q2
'12
Q3
'12
Q4
'12
Q1
'13
Q2
'13
Q3
'13
Q4
'13
Q1
'14
Q2
'14
Q3
'14
Q4
'14
Q1
'15
Q2
'15
Q3
'15
Q4
'15
Q1
'16
Q2
'16
Q3
'16
Q4
'16
Q1
'17
Q2
'17
How satisfied were you overall with the quality of the TTC’s service on the last TTC trip you took,
on a scale of 1 to 10 where 10 is extremely satisfied and 1 is extremely dissatisfied?
= higher or lower than previous wave or year at C.I. = .95 5
Quarterly
Yearly
81% 83% 73%
82% 85% 81% 85%
73% 77% 71%
77% 78% 78% 81%
Q1
'12
Q2
'12
Q3
'12
Q4
'12
Q1
'13
Q2
'13
Q3
'13
Q4
'13
Q1
'14
Q2
'14
Q3
'14
Q4
'14
Q1
'15
Q2
'15
Q3
'15
Q4
'15
Q1
'16
Q2
'16
Q3
'16
Q4
'16
Q1
'17
Q2
'17
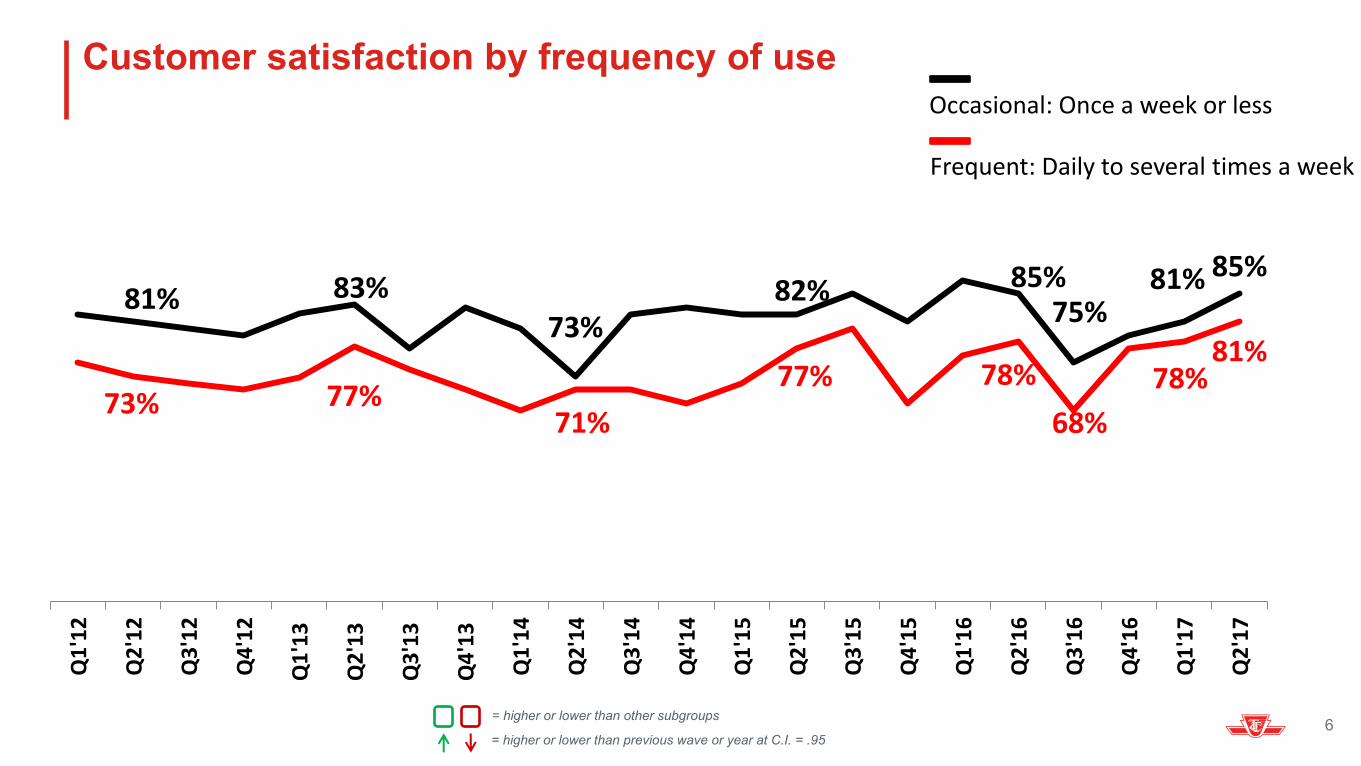
Customer satisfaction by frequency of use
= higher or lower than previous wave or year at C.I. = .95
= higher or lower than other subgroups 6
68%
75%
Frequent: Daily to several times a week
Occasional: Once a week or less
75% 73%
80%
77%
81%
73%
78%
71%
78% 80%
81%
76%
77%
63%
76%
81%
79%
Q1
'12
Q2
'12
Q3
'12
Q4
'12
Q1
'13
Q2
'13
Q3
'13
Q4
'13
Q1
'14
Q2
'14
Q3
'14
Q4
'14
Q1
'15
Q2
'15
Q3
'15
Q4
'15
Q1
'16
Q2
'16
Q3
'16
Q4
'16
Q1
'17
Q2
'17
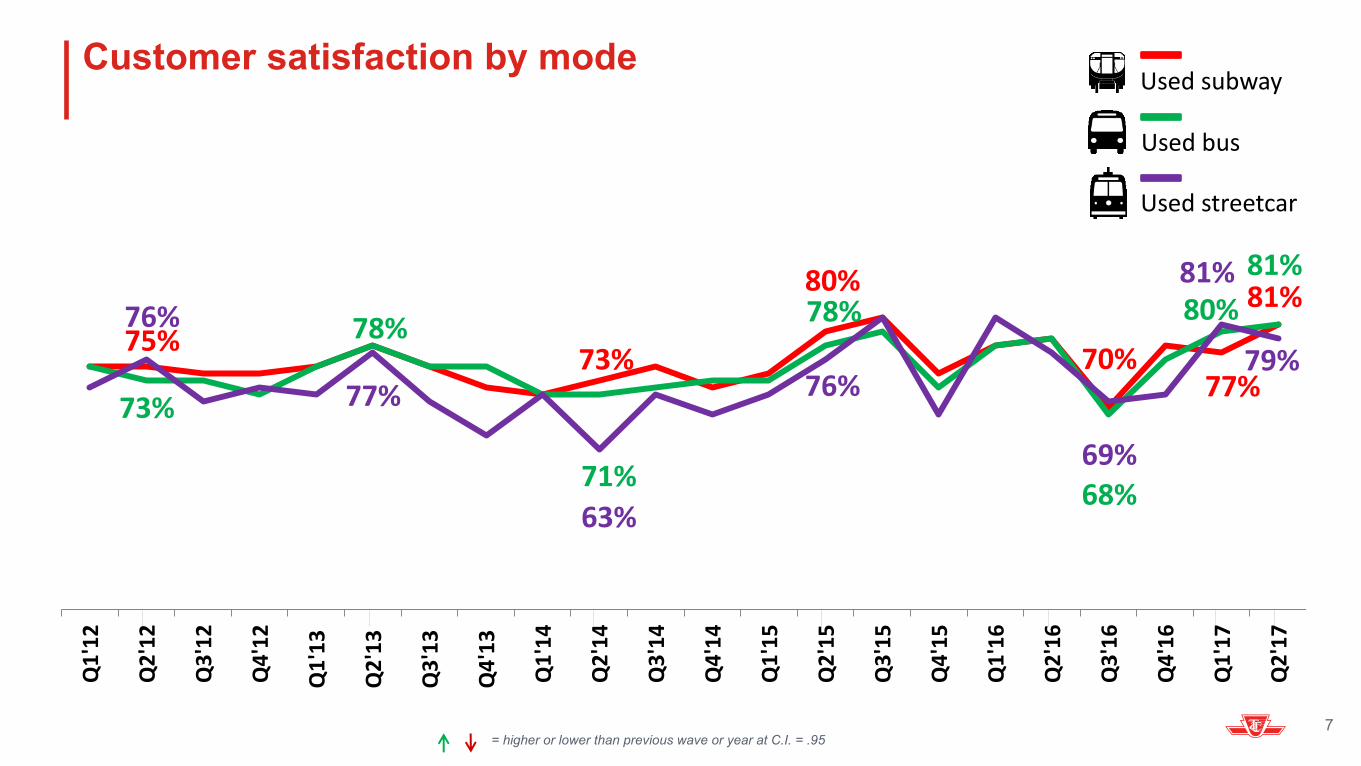
Customer satisfaction by mode
= higher or lower than previous wave or year at C.I. = .95 7
69% 68%
70%
Used bus
Used subway
Used streetcar
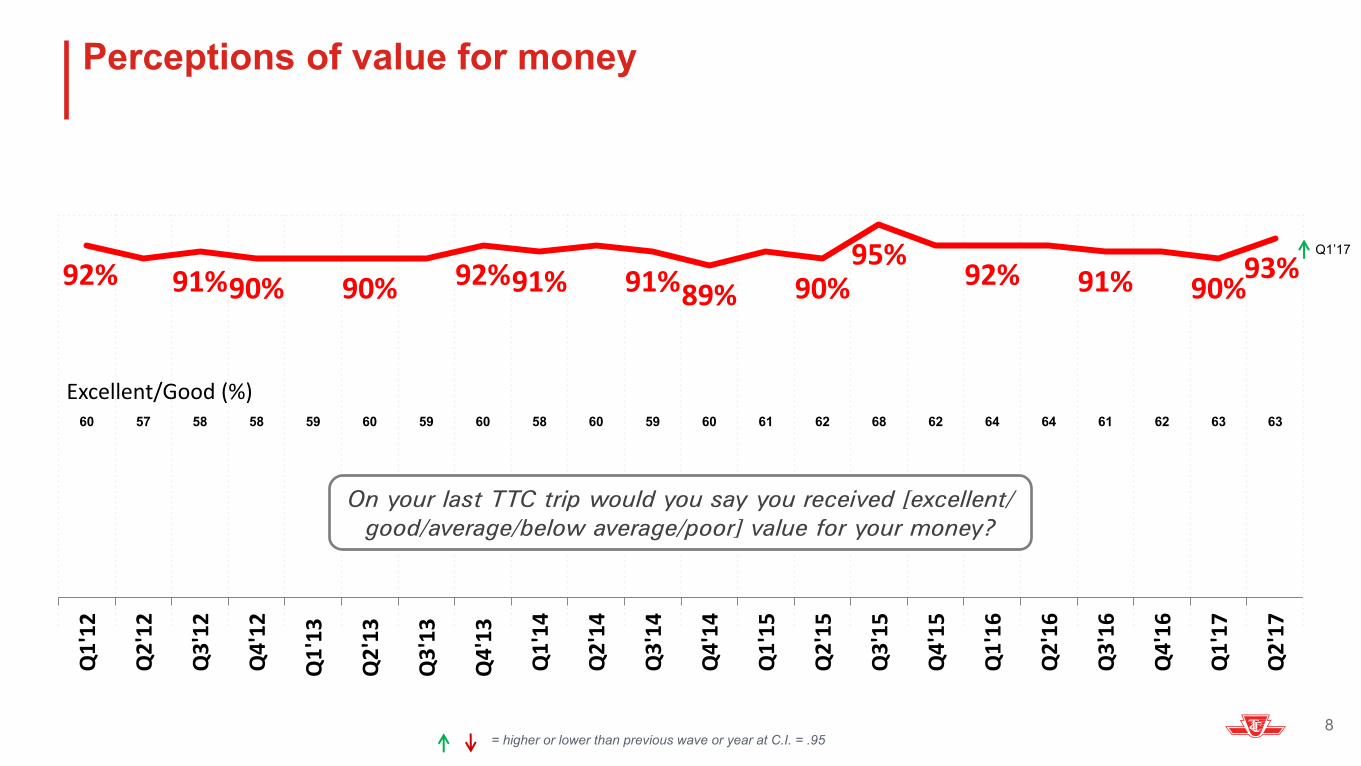
60 57 58 58 59 60 59 60 58 60 59 60 61 62 68 62 64 64 61 62 63 63
92% 91% 90% 90% 92% 91% 91% 89% 90% 95%
92% 91% 90% 93%
Q1
'12
Q2
'12
Q3
'12
Q4
'12
Q1
'13
Q2
'13
Q3
'13
Q4
'13
Q1
'14
Q2
'14
Q3
'14
Q4
'14
Q1
'15
Q2
'15
Q3
'15
Q4
'15
Q1
'16
Q2
'16
Q3
'16
Q4
'16
Q1
'17
Q2
'17
Perceptions of value for money
Excellent/Good (%)
= higher or lower than previous wave or year at C.I. = .95 8
On your last TTC trip would you say you received [excellent/
good/average/below average/poor] value for your money?
Q1’17
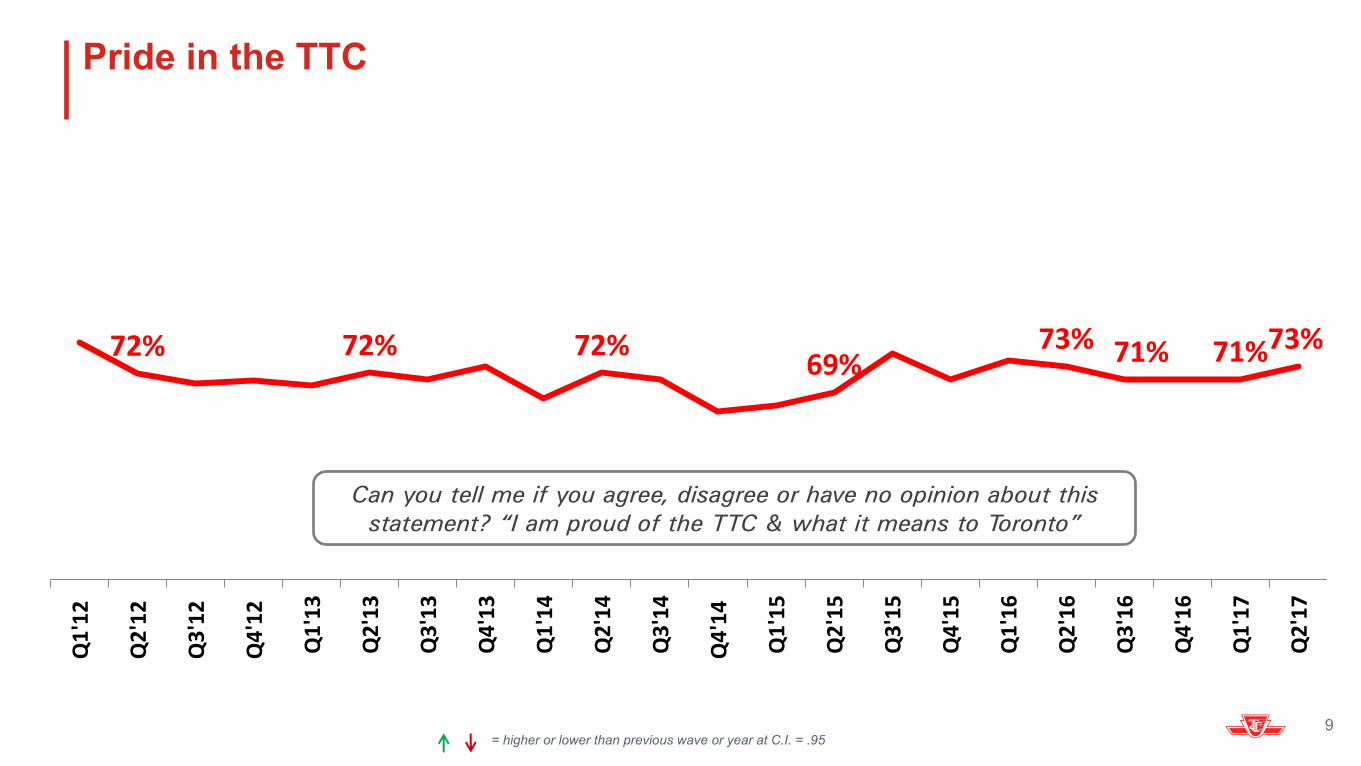
Pride in the TTC
= higher or lower than previous wave or year at C.I. = .95 9
72% 72% 72% 69%
73% 71% 73%
Q1
'12
Q2
'12
Q3
'12
Q4
'12
Q1
'13
Q2
'13
Q3
'13
Q4
'13
Q1
'14
Q2
'14
Q3
'14
Q4
'14
Q1
'15
Q2
'15
Q3
'15
Q4
'15
Q1
'16
Q2
'16
Q3
'16
Q4
'16
Q1
'17
Q2
'17
71%
Can you tell me if you agree, disagree or have no opinion about this
statement? “I am proud of the TTC & what it means to Toronto”
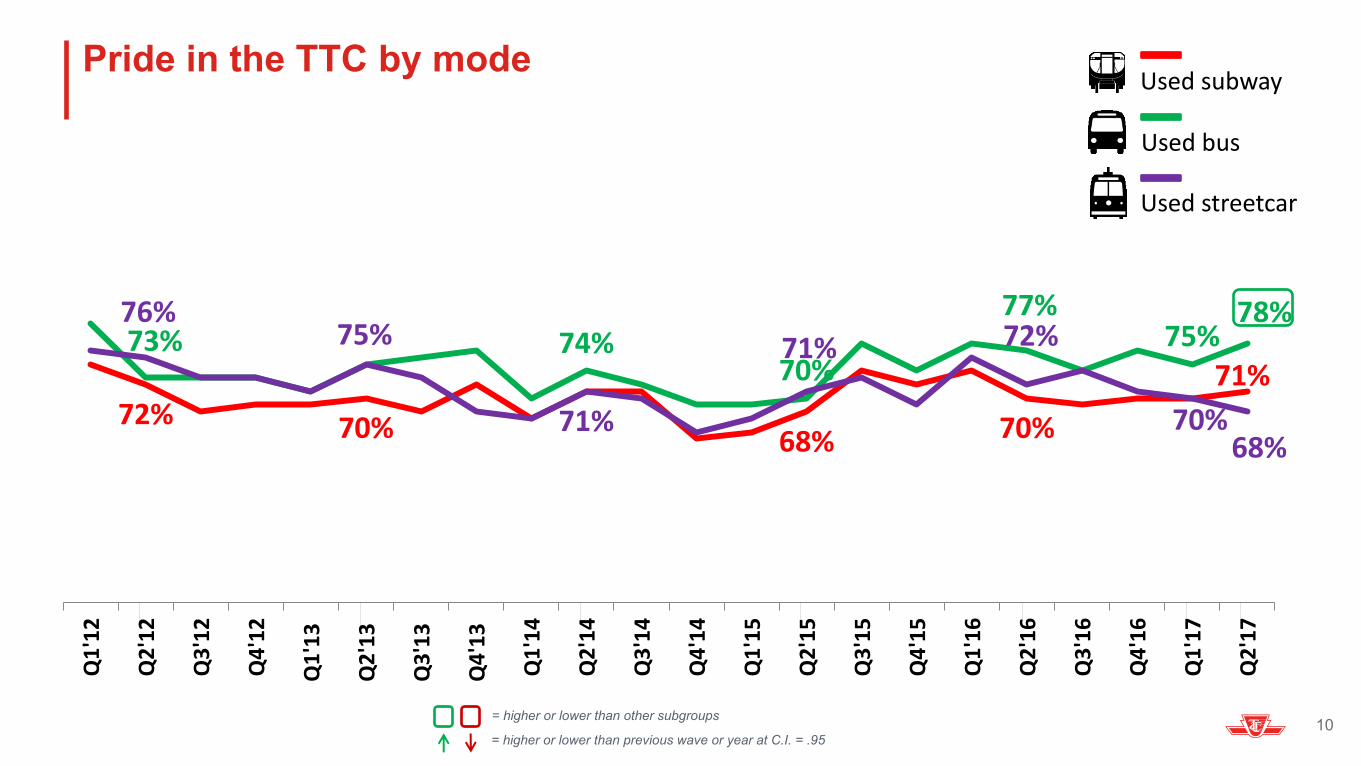
Pride in the TTC by mode
72% 70% 68% 70%
71% 73% 74%
70%
77% 75%
78% 76% 75%
71%
71% 72%
70% 68%
Q1
'12
Q2
'12
Q3
'12
Q4
'12
Q1
'13
Q2
'13
Q3
'13
Q4
'13
Q1
'14
Q2
'14
Q3
'14
Q4
'14
Q1
'15
Q2
'15
Q3
'15
Q4
'15
Q1
'16
Q2
'16
Q3
'16
Q4
'16
Q1
'17
Q2
'17
= higher or lower than previous wave or year at C.I. = .95
= higher or lower than other subgroups 10
Used bus
Used subway
Used streetcar
Key Drivers
11
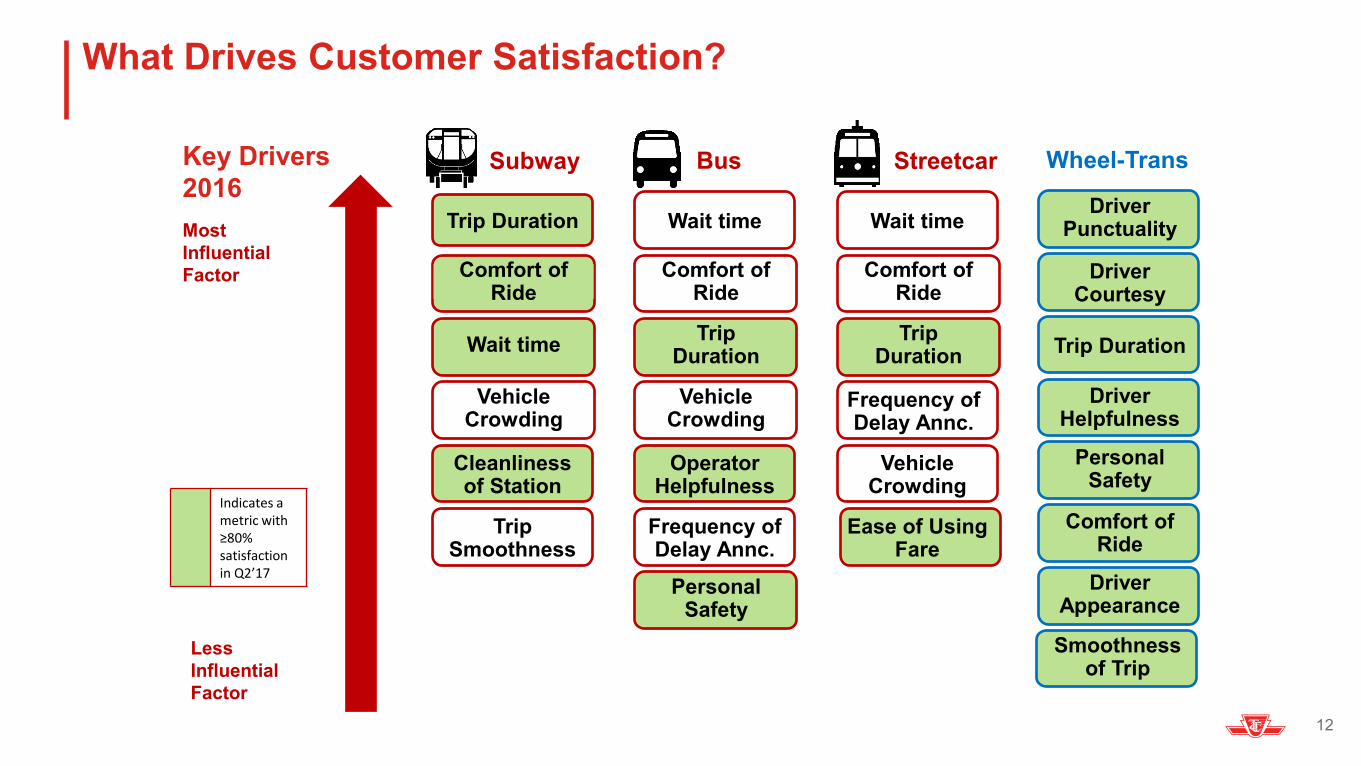
What Drives Customer Satisfaction?
Key Drivers
2016
Most
Influential
Factor
Less
Influential
Factor
Subway Bus Streetcar
Trip Duration
Wait time
Cleanliness of Station
Vehicle Crowding
Trip Smoothness
Comfort of Ride
Wait time
Trip Duration
Operator Helpfulness
Vehicle Crowding
Personal Safety
Comfort of Ride
Frequency of Delay Annc.
Wait time
Trip Duration
Vehicle Crowding
Ease of Using Fare
Comfort of Ride
Frequency of Delay Annc.
Indicates a metric with ≥80% satisfaction in Q2’17
Wheel-Trans
Driver Punctuality
Driver Courtesy
Trip Duration
Driver Helpfulness
Personal Safety
Comfort of Ride
Driver Appearance
Smoothness of Trip
12
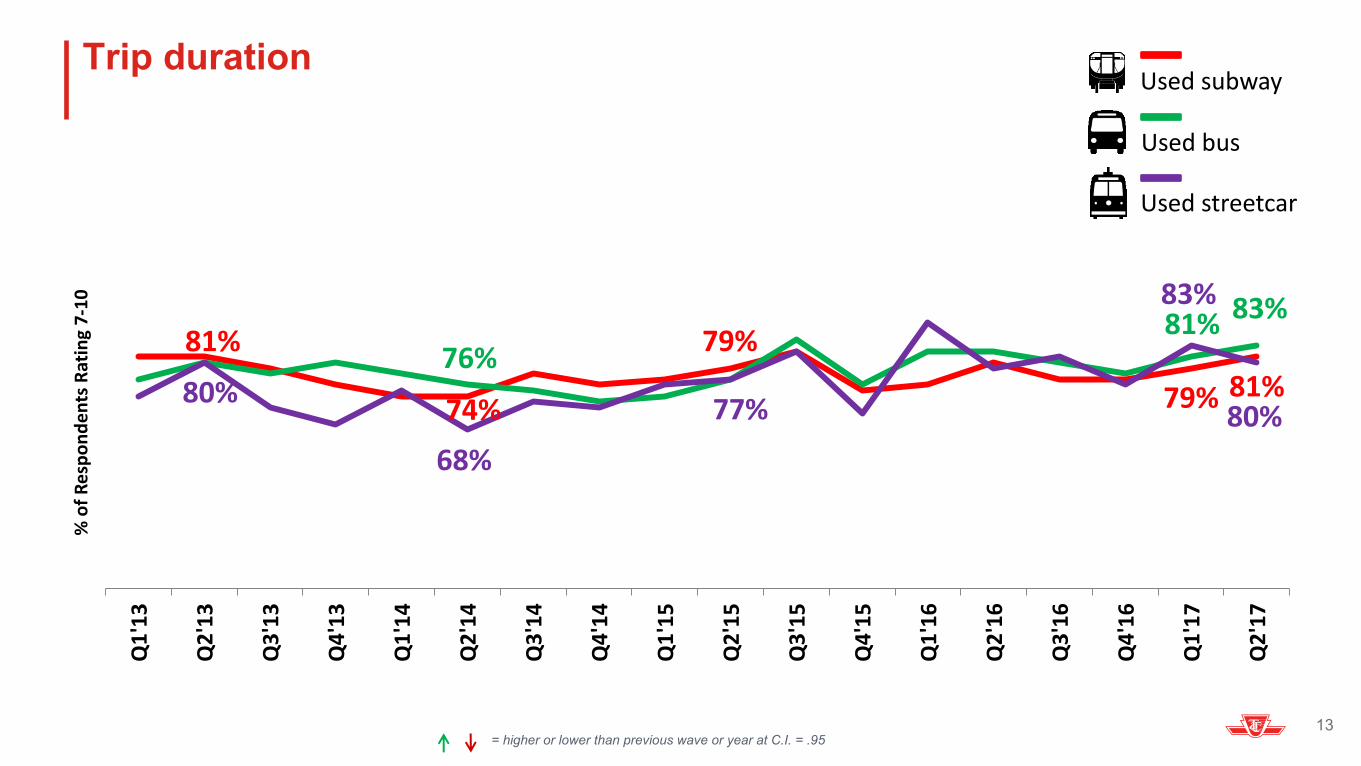
Trip duration
81%
74%
79%
79% 81% 76%
81% 83%
80%
68%
77%
83%
80%
Q1
'13
Q2
'13
Q3
'13
Q4
'13
Q1
'14
Q2
'14
Q3
'14
Q4
'14
Q1
'15
Q2
'15
Q3
'15
Q4
'15
Q1
'16
Q2
'16
Q3
'16
Q4
'16
Q1
'17
Q2
'17
% o
f R
esp
on
de
nts
Rat
ing
7-1
0
= higher or lower than previous wave or year at C.I. = .95 13
Used bus
Used subway
Used streetcar
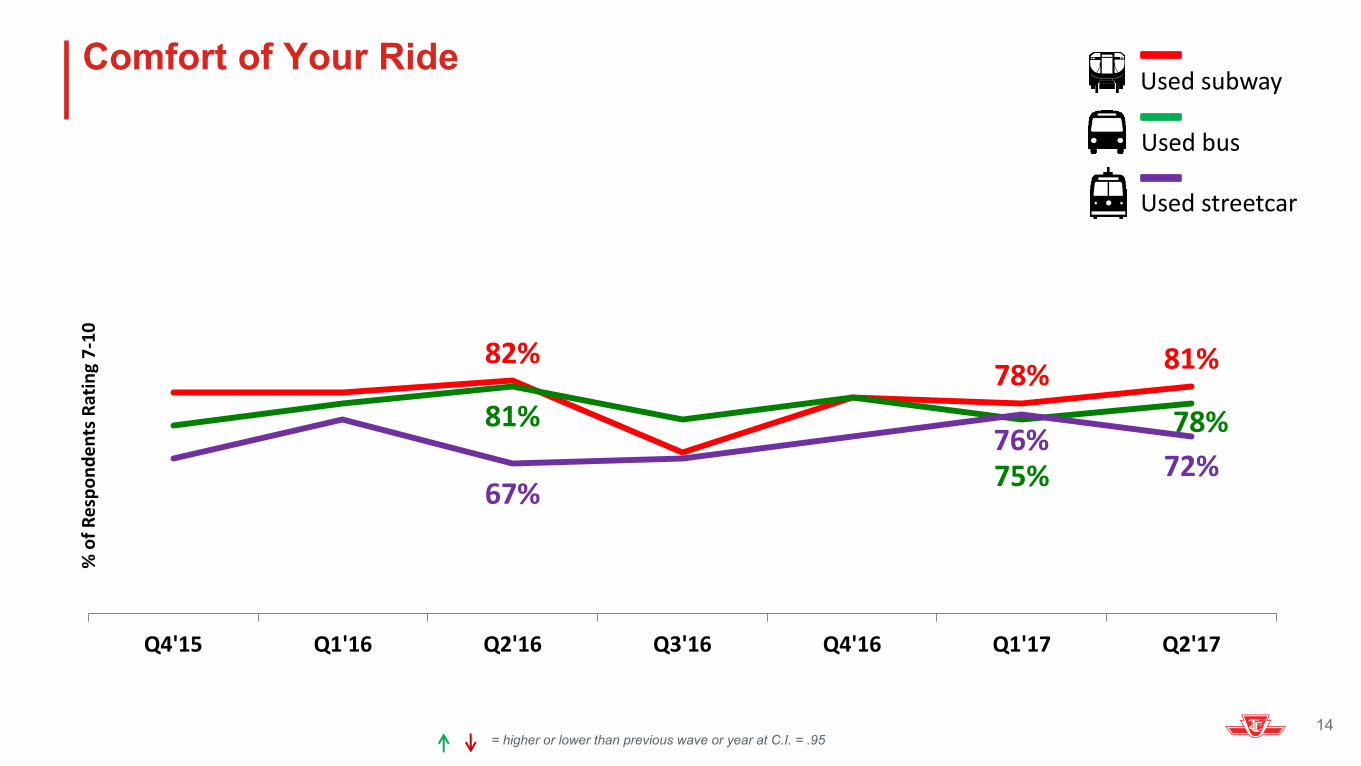
Comfort of Your Ride
82% 78%
81%
81%
75%
78%
67%
76% 72%
Q4'15 Q1'16 Q2'16 Q3'16 Q4'16 Q1'17 Q2'17
% o
f R
esp
on
de
nts
Rat
ing
7-1
0
= higher or lower than previous wave or year at C.I. = .95 14
Used bus
Used subway
Used streetcar
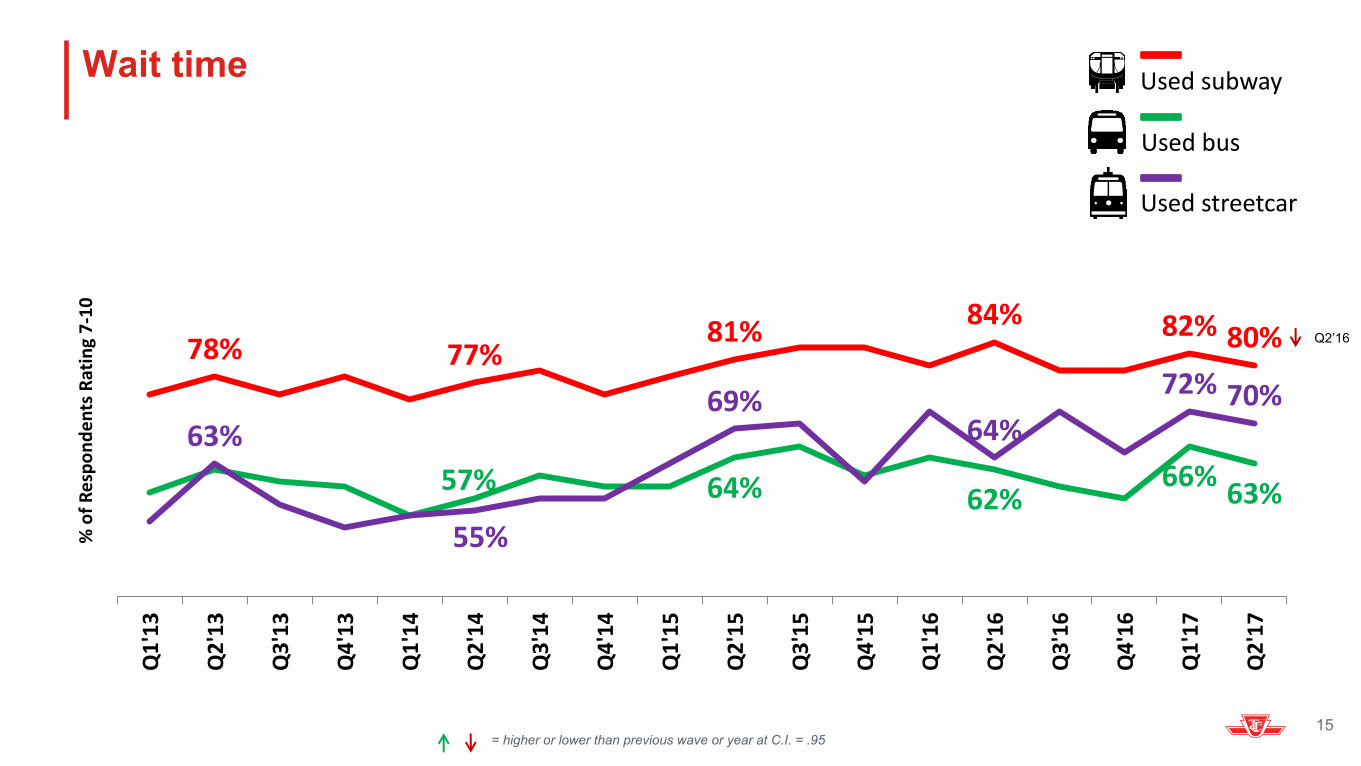
Wait time
78% 77% 81%
84% 82% 80%
57% 64% 62% 66%
63%
63%
55%
69% 64%
72% 70%
Q1
'13
Q2
'13
Q3
'13
Q4
'13
Q1
'14
Q2
'14
Q3
'14
Q4
'14
Q1
'15
Q2
'15
Q3
'15
Q4
'15
Q1
'16
Q2
'16
Q3
'16
Q4
'16
Q1
'17
Q2
'17
% o
f R
esp
on
de
nts
Rat
ing
7-1
0
= higher or lower than previous wave or year at C.I. = .95 15
Q2’16
Used bus
Used subway
Used streetcar
Continuing our focus on understanding key drivers of customer satisfaction and leveraging insights to deliver a service that meets
and exceeds expectations
16
Going forward