Embed Size (px)
Citation preview
Neogen Chemicals Ltd.Q1 FY20 Earnings Presentation
August 2019
Safe Harbour
Certain statements in this document may be forward-looking statements. Such forward looking statements are subject to certain
risks and uncertainties like regulatory changes, local political or economic developments, and many other factors that could cause
our actual results to differ materially from those contemplated by the relevant forward-looking statements. Neogen Chemicals
Limited will not be in any way responsible for any action taken based on such statements and undertakes no obligation to publicly
update these forward-looking statements to reflect subsequent events or circumstances.
2
Table of Contents3
Introduction to Neogen Chemicals
Competitive Advantages
Q1 FY20Financial
Performance
Management Commentary
Historical Financial Trends
Way Forward
Contact Us
15 3014137 1264
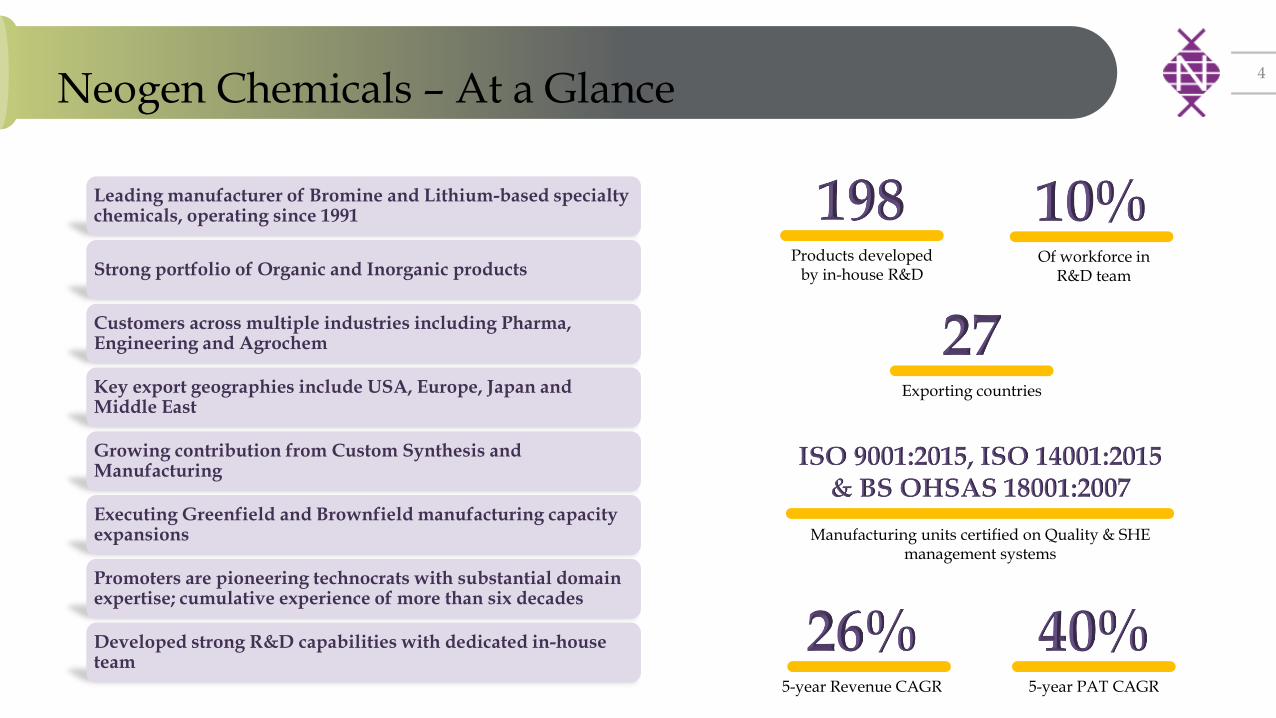
Neogen Chemicals – At a Glance4
Products developed by in-house R&D
5-year Revenue CAGR 5-year PAT CAGR
Leading manufacturer of Bromine and Lithium-based specialty chemicals, operating since 1991
Strong portfolio of Organic and Inorganic products
Customers across multiple industries including Pharma, Engineering and Agrochem
Key export geographies include USA, Europe, Japan and Middle East
Growing contribution from Custom Synthesis and Manufacturing
Executing Greenfield and Brownfield manufacturing capacity expansions
Promoters are pioneering technocrats with substantial domain expertise; cumulative experience of more than six decades
Developed strong R&D capabilities with dedicated in-house team
Manufacturing units certified on Quality & SHE management systems
Exporting countries
Of workforce in R&D team
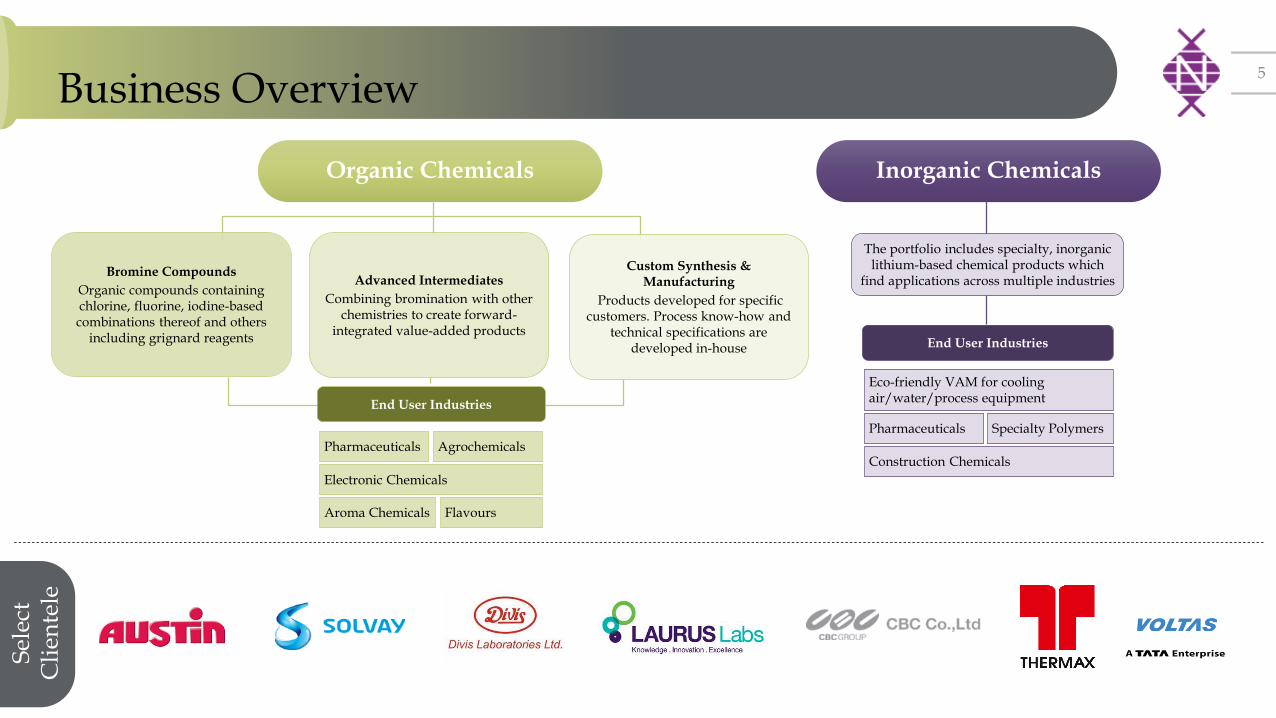
Business Overview5
Organic Chemicals
Bromine Compounds
Organic compounds containing chlorine, fluorine, iodine-based combinations thereof and others
including grignard reagents
Inorganic Chemicals
Sel
ect
Cli
ente
le
End User Industries
Pharmaceuticals Agrochemicals
Aroma Chemicals
Electronic Chemicals
Eco-friendly VAM for cooling air/water/process equipment
Construction Chemicals
Pharmaceuticals Specialty Polymers
The portfolio includes specialty, inorganic lithium-based chemical products which
find applications across multiple industries
End User Industries
Flavours
Custom Synthesis & Manufacturing
Products developed for specific customers. Process know-how and
technical specifications are developed in-house
Advanced Intermediates
Combining bromination with other chemistries to create forward-
integrated value-added products
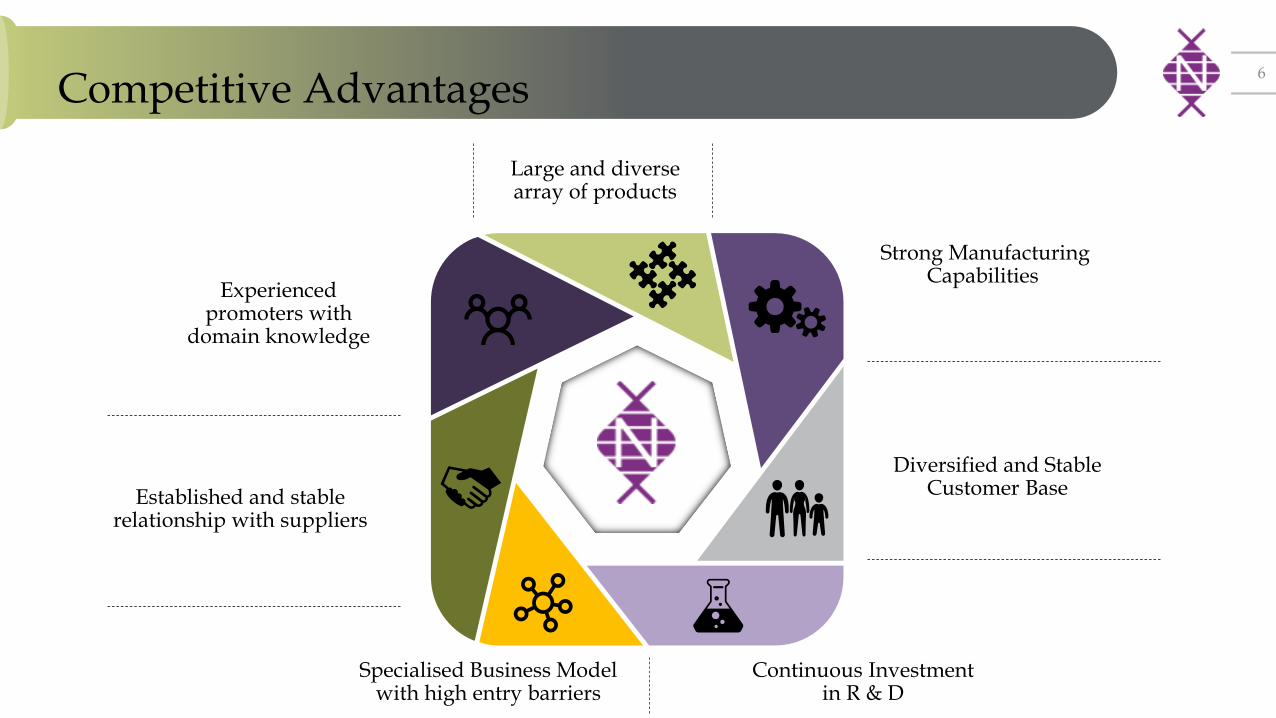
Competitive Advantages
Experienced promoters with
domain knowledge
Large and diverse array of products
Strong Manufacturing Capabilities
Diversified and Stable Customer Base
Continuous Investment in R & D
Specialised Business Model with high entry barriers
Established and stable relationship with suppliers
6
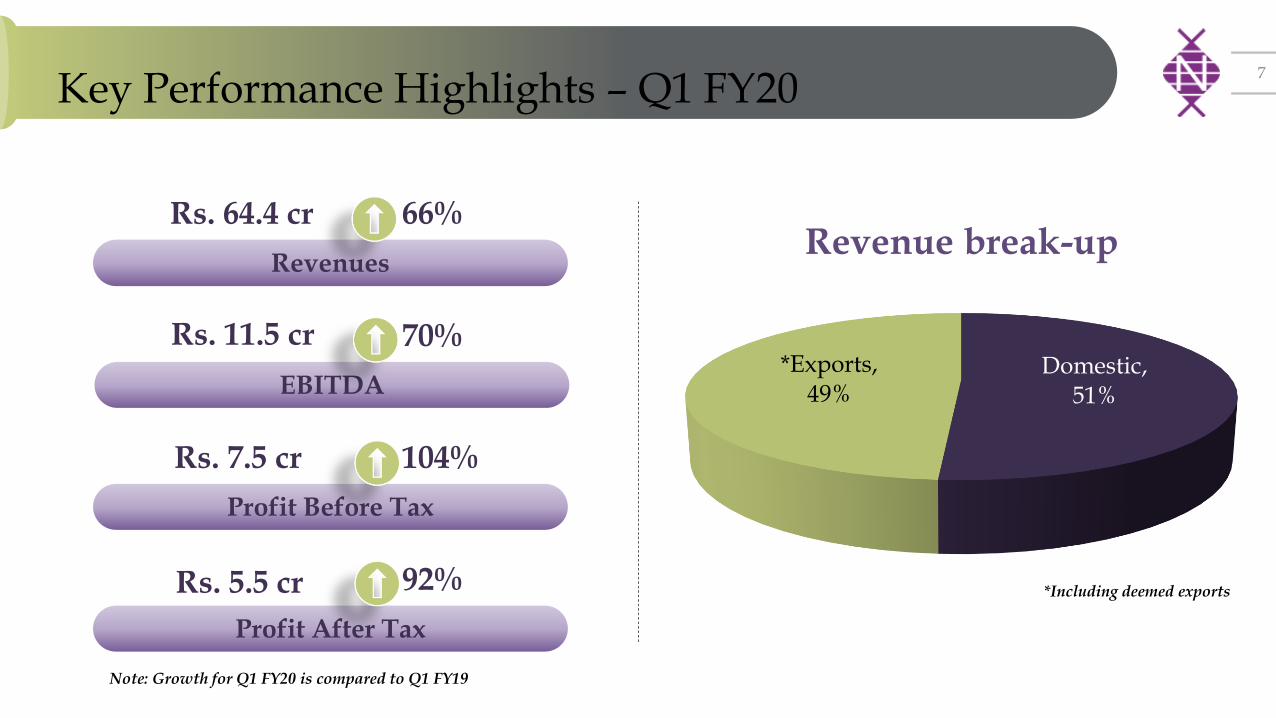
Key Performance Highlights – Q1 FY207
Revenues
Rs. 64.4 cr 66%
EBITDA
Rs. 11.5 cr 70%
Profit Before Tax
Rs. 7.5 cr 104%
Profit After Tax
92%
Revenue break-up
Domestic, 51%
*Exports, 49%
*Including deemed exports
Note: Growth for Q1 FY20 is compared to Q1 FY19
Rs. 5.5 cr
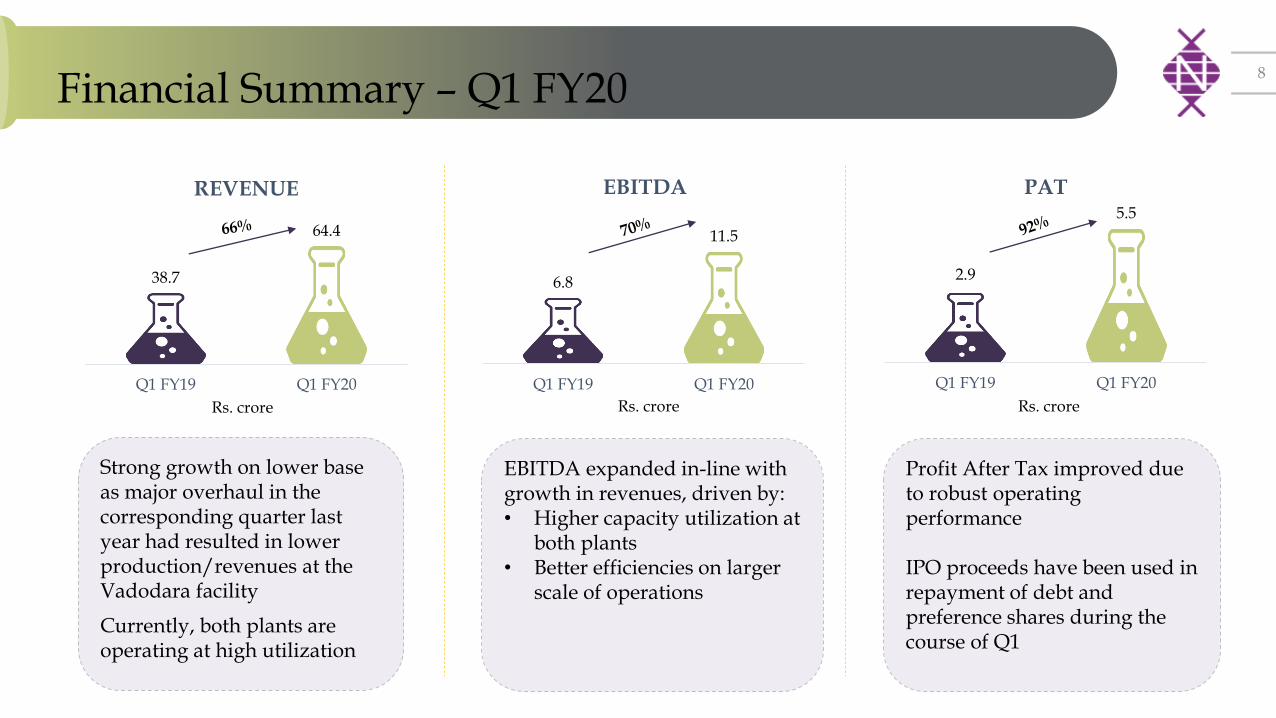
Financial Summary – Q1 FY208
38.7
64.4
Q1 FY19 Q1 FY20
REVENUE
6.8
11.5
Q1 FY19 Q1 FY20
EBITDA
2.9
5.5
Q1 FY19 Q1 FY20
PAT
Strong growth on lower base as major overhaul in the corresponding quarter last year had resulted in lower production/revenues at the Vadodara facility
Currently, both plants are operating at high utilization
EBITDA expanded in-line with growth in revenues, driven by:• Higher capacity utilization at
both plants• Better efficiencies on larger
scale of operations
Profit After Tax improved due to robust operating performance
IPO proceeds have been used in repayment of debt and preference shares during the course of Q1
Rs. crore Rs. crore Rs. crore
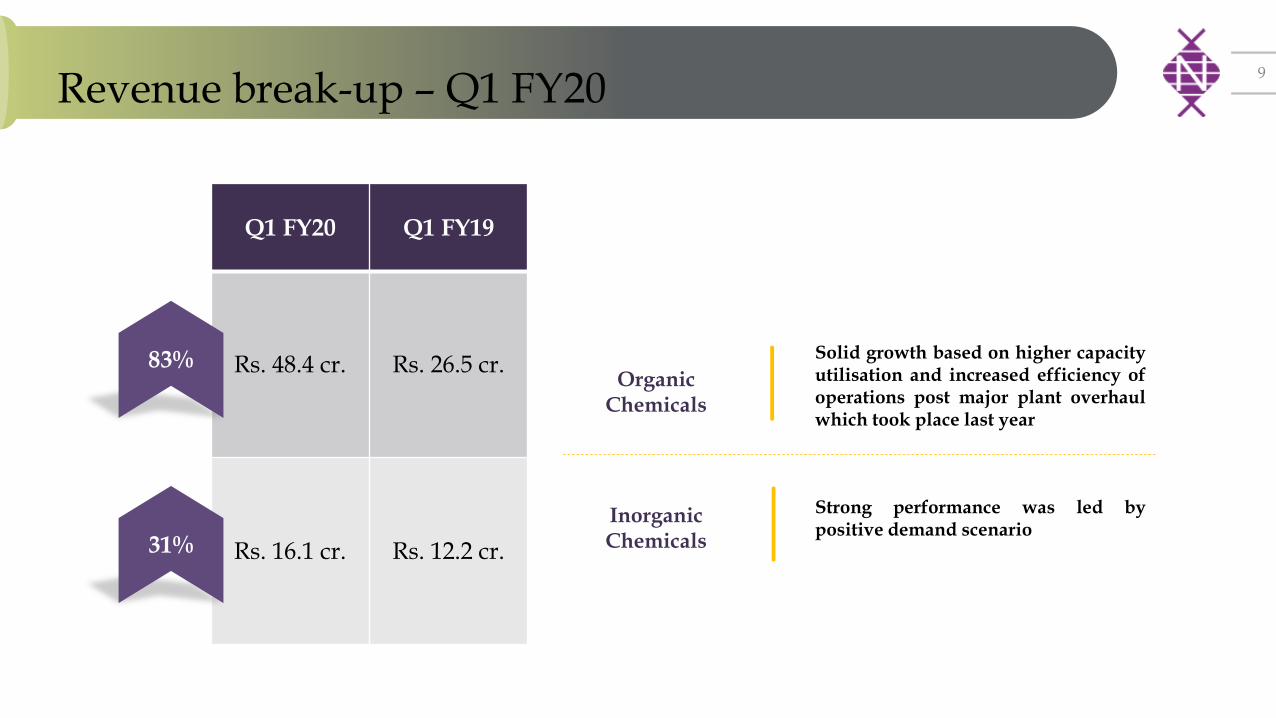
Revenue break-up – Q1 FY209
Q1 FY20 Q1 FY19
Rs. 48.4 cr. Rs. 26.5 cr.
Rs. 16.1 cr. Rs. 12.2 cr.
83%Organic
Chemicals
Inorganic Chemicals
Strong performance was led bypositive demand scenario
Solid growth based on higher capacityutilisation and increased efficiency ofoperations post major plant overhaulwhich took place last year
31%
Seasonal Variance Factors10
• Neogen’s business has some seasonal drivers, due to which the company tends to deliver strongerfinancial performance in the second half of the financial year (October to March). Seasonal variance isdriven by strong demand from Europe as orders tend to scale up in October-November and furtheraccelerate from January after the holiday season
• Lithium demand tends to be strong in Q4 as demand from HVAC segment is linked to capitalexpenditure that enjoys 100% depreciation benefits for air-conditioning/cooling machines
• Demand from the agrochemicals segment is linked to the crop cycle and is weaker during Q1
• Consequently, investors are urged to compare financial performance of each quarter only with that ofthe corresponding quarter previous year to evaluate business progress on a like-to-like basis
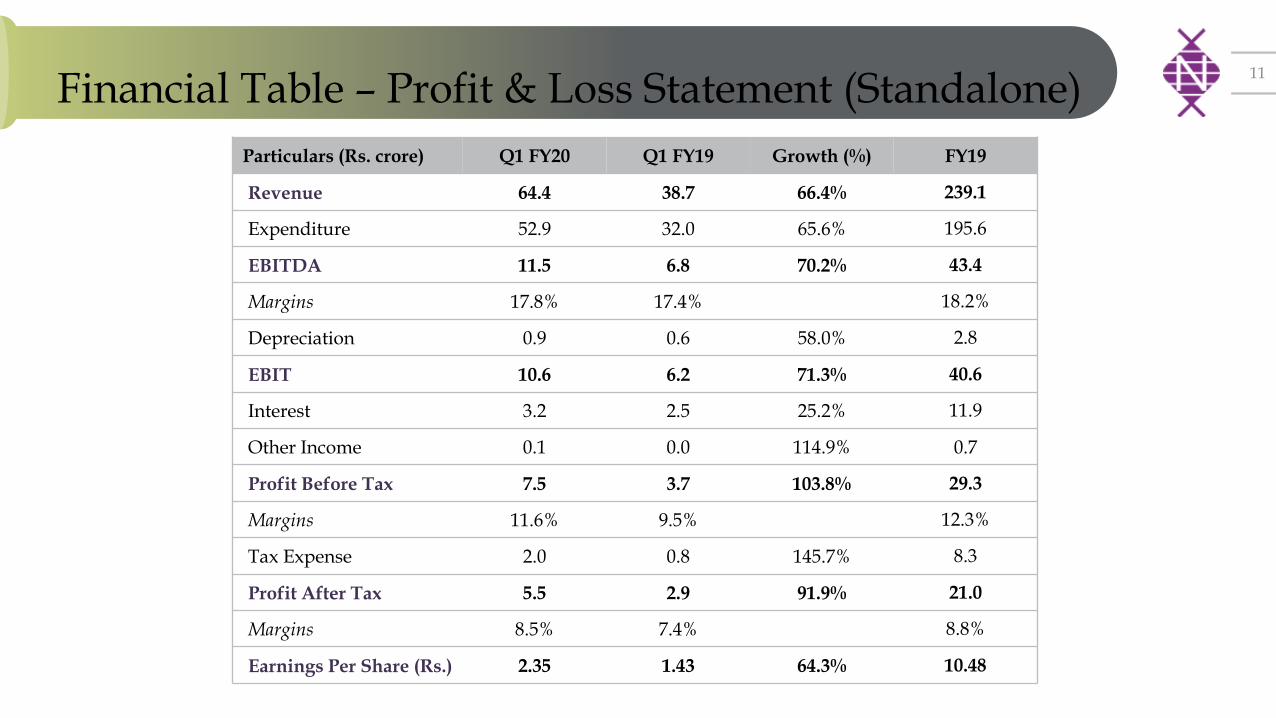
Financial Table – Profit & Loss Statement (Standalone)11
Particulars (Rs. crore) Q1 FY20 Q1 FY19 Growth (%) FY19
Revenue 64.4 38.7 66.4% 239.1
Expenditure 52.9 32.0 65.6% 195.6
EBITDA 11.5 6.8 70.2% 43.4
Margins 17.8% 17.4% 18.2%
Depreciation 0.9 0.6 58.0% 2.8
EBIT 10.6 6.2 71.3% 40.6
Interest 3.2 2.5 25.2% 11.9
Other Income 0.1 0.0 114.9% 0.7
Profit Before Tax 7.5 3.7 103.8% 29.3
Margins 11.6% 9.5% 12.3%
Tax Expense 2.0 0.8 145.7% 8.3
Profit After Tax 5.5 2.9 91.9% 21.0
Margins 8.5% 7.4% 8.8%
Earnings Per Share (Rs.) 2.35 1.43 64.3% 10.48

Management Commentary12
Commenting on the Q1 FY20 performance, Mr. Haridas Kanani, Chairman &Managing Director, at Neogen Chemicals said:
“I am glad to report a strong earnings performance in the first full quarter after our initialpublic offering. Performance was led by positive demand environment across our key productofferings and higher capacity utilisation at our plants. Both revenues and profit after tax grewstrongly Y-o-Y by 66% and 92% respectively. We have already repaid term debt and preferenceshares of aggregate value Rs. 34 crore, thereby strengthening the balance sheet.
The road ahead appears encouraging and growth will be driven by optimal utilisation ofexisting capacities through the current fiscal year. Greenfield expansion is now planned in bothOrganic and Inorganic segments at Dahej SEZ. I am happy to share that we have alreadystarted construction of the Inorganic facility and remain on track to commission the plant asper the targeted timeline. Developing our Organic expansion is also planned at Dahej SEZ dueto encouraging enquiries in the export business which would allow us better tax benefits. Theseexpansions, based on demand visibility and positive business landscape, also position usfavourably for medium term growth as per plan.”
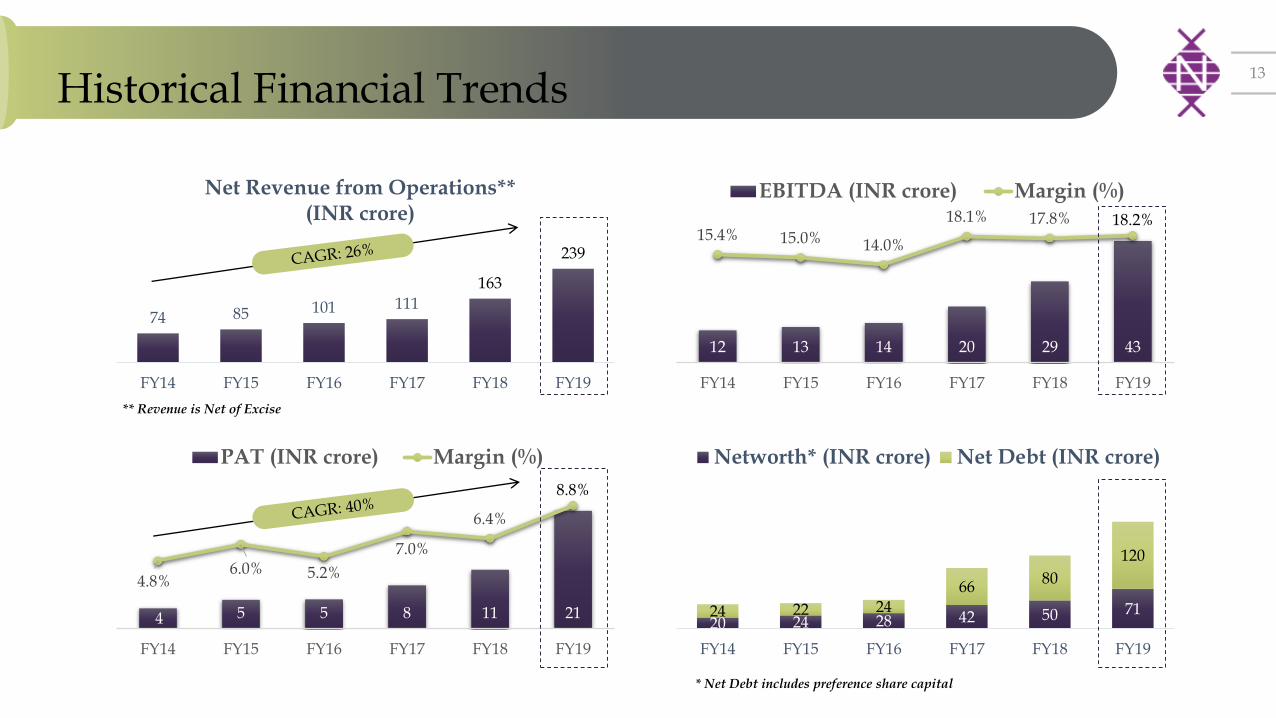
Historical Financial Trends13
74 85 101 111
163
239
FY14 FY15 FY16 FY17 FY18 FY19
Net Revenue from Operations** (INR crore)
4 5 5 8 11 21
4.8%6.0% 5.2%
7.0%
6.4%
8.8%
FY14 FY15 FY16 FY17 FY18 FY19
PAT (INR crore) Margin (%)
12 13 14 20 29 43
15.4% 15.0% 14.0%
18.1% 17.8% 18.2%
FY14 FY15 FY16 FY17 FY18 FY19
EBITDA (INR crore) Margin (%)
20 24 28 42 50 7124 22 2466
80
120
FY14 FY15 FY16 FY17 FY18 FY19
Networth* (INR crore) Net Debt (INR crore)
* Net Debt includes preference share capital
** Revenue is Net of Excise
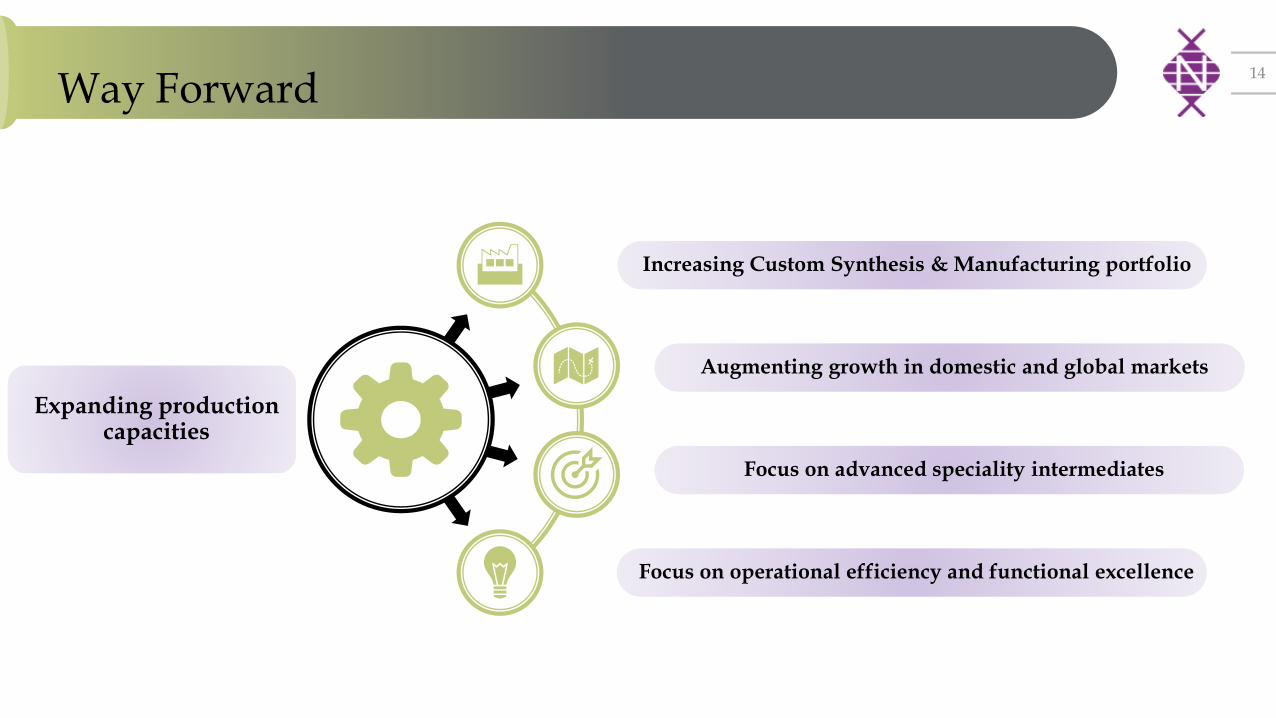
Way Forward14
Increasing Custom Synthesis & Manufacturing portfolio
Augmenting growth in domestic and global markets
Focus on advanced speciality intermediates
Focus on operational efficiency and functional excellence
Expanding production capacities
Contact Us
About Neogen Chemicals Limited
Incorporated in 1991, Neogen Chemicals Ltd. (NSE Code: NEOGEN; BSECode: 542665) is one of India’s leading manufacturers of Bromine-based andLithium-based specialty chemicals. It’s specialty chemicals product offeringscomprise of Organic as well as and Inorganic chemicals. Its products are usedin pharmaceutical and agrochemical intermediates, engineering fluids,electronic chemicals, polymer additives, water treatment, construction andaroma chemicals, flavours and fragrances, specialty polymers, chemicals andVAM original-equipment manufacturers. Over the years, Neogen hasexpanded its range of products and, presently, manufactures an extensiverange of specialty chemicals which find application across various industriesin India and globally. It has a product portfolio of 198 products comprising181 organic chemicals and 17 inorganic chemicals.
In addition to manufacturing speciality chemicals, Neogen also undertakescustom synthesis and manufacturing where the product is developed andcustomized primarily for a specific customer, but process know-how andtechnical specifications are developed in-house.
The Company operates out of its two manufacturing facilities located inMahape, Navi Mumbai in Maharashtra, and Karakhadi, Vadodara in Gujarat.It is presently, developing a Greenfield manufacturing unit in Dahej SEZ, inGujarat.
15
Shiv Muttoo / Nishid Solanki
CDR India
Tel: +91 98335 57572 / +91 22 6645 1221
Email: [email protected]
nishid@cdr- india.com
Mahesh Tanna
Neogen Chemicals Ltd.
Tel: +91 22 2549 7365 / 66
E-mail: [email protected]
For further information, please contact:
Thank You


![Service Manual · Service Manual SiUS711114 [Applied Models] VAM 300GVJU VAM 470GVJU VAM 600GVJU VAM1200GVJU Energy Recovery Ventilator](https://img.pdfslide.us/doc/110x75/5b8f613509d3f20e308c4cbc/service-manual-service-manual-sius711114-applied-models-vam-300gvju-vam-470gvju.jpg)