Embed Size (px)
Citation preview

Q1 FY16 Investor Update
2
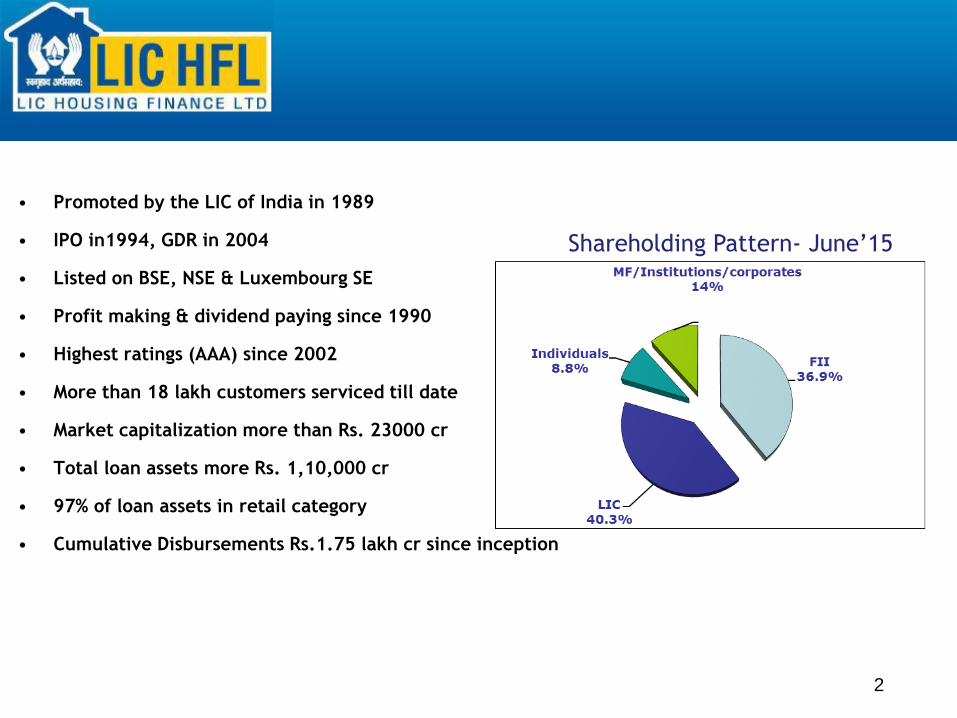
• Promoted by the LIC of India in 1989
• IPO in1994, GDR in 2004
• Listed on BSE, NSE & Luxembourg SE
• Profit making & dividend paying since 1990
• Highest ratings (AAA) since 2002
• More than 18 lakh customers serviced till date
• Market capitalization more than Rs. 23000 cr
• Total loan assets more Rs. 1,10,000 cr
• 97% of loan assets in retail category
• Cumulative Disbursements Rs.1.75 lakh cr since inception
Shareholding Pattern- June’15
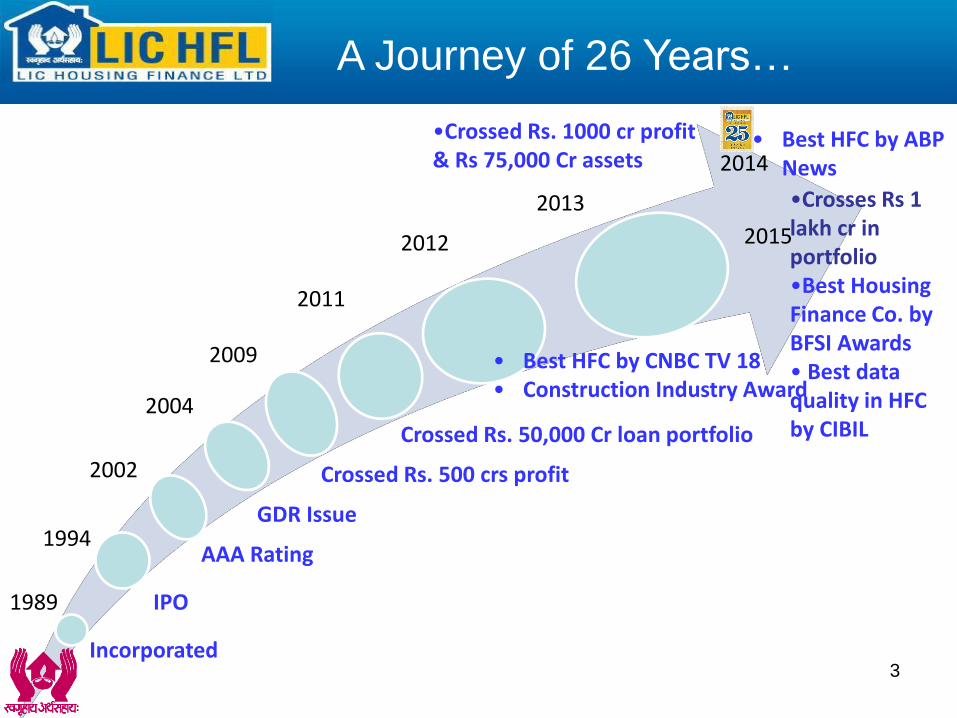
1989
1994
2002
2004
2009
2011
2012
2013
Incorporated
IPO
AAA Rating
GDR Issue
Crossed Rs. 500 crs profit
Crossed Rs. 50,000 Cr loan portfolio
• Best HFC by CNBC TV 18 • Construction Industry Award
•Crossed Rs. 1000 cr profit & Rs 75,000 Cr assets
2015
3
2014 • Best HFC by ABP
News
•Crosses Rs 1 lakh cr in portfolio •Best Housing Finance Co. by BFSI Awards • Best data quality in HFC by CIBIL
A Journey of 26 Years…
4
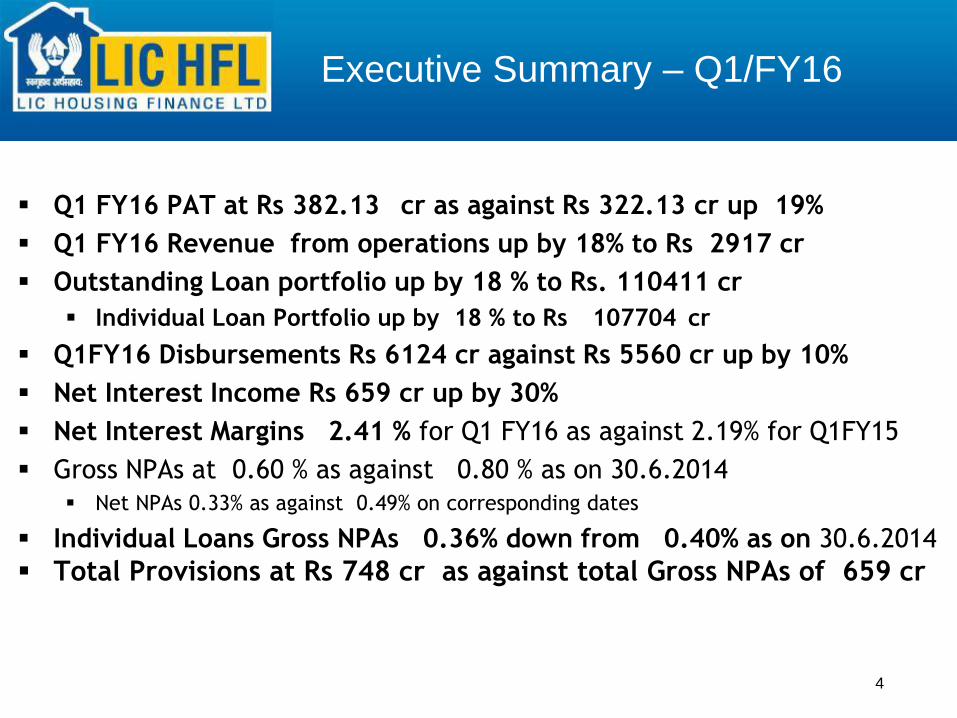
Q1 FY16 PAT at Rs 382.13 cr as against Rs 322.13 cr up 19%
Q1 FY16 Revenue from operations up by 18% to Rs 2917 cr
Outstanding Loan portfolio up by 18 % to Rs. 110411 cr
Individual Loan Portfolio up by 18 % to Rs 107704 cr
Q1FY16 Disbursements Rs 6124 cr against Rs 5560 cr up by 10%
Net Interest Income Rs 659 cr up by 30%
Net Interest Margins 2.41 % for Q1 FY16 as against 2.19% for Q1FY15
Gross NPAs at 0.60 % as against 0.80 % as on 30.6.2014
Net NPAs 0.33% as against 0.49% on corresponding dates
Individual Loans Gross NPAs 0.36% down from 0.40% as on 30.6.2014
Total Provisions at Rs 748 cr as against total Gross NPAs of 659 cr
Executive Summary – Q1/FY16
5
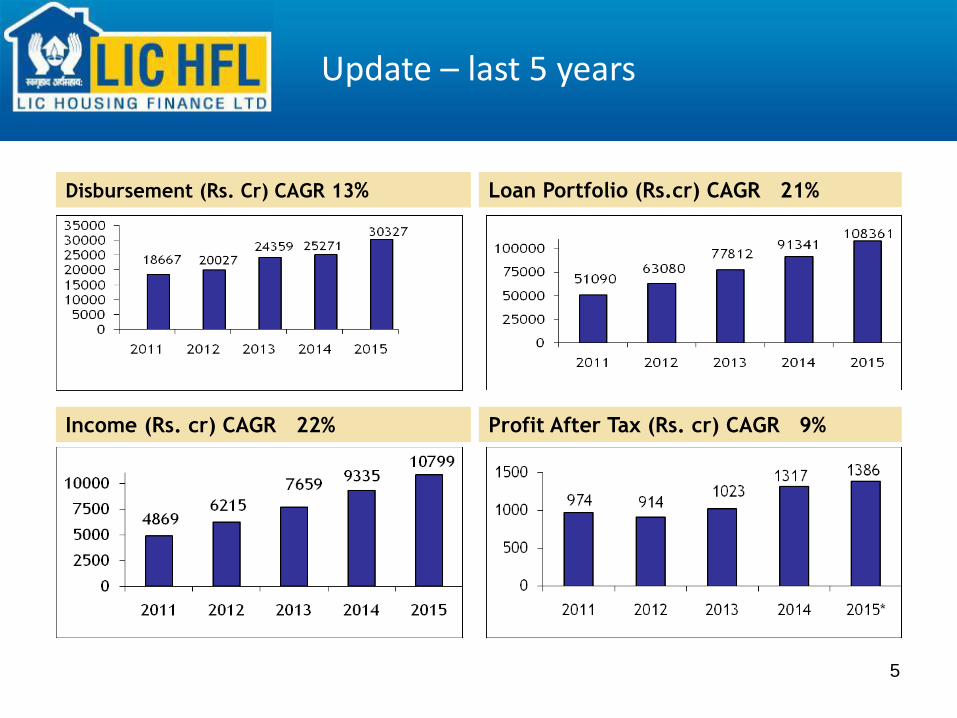
Disbursement (Rs. Cr) CAGR 13%
Profit After Tax (Rs. cr) CAGR 9% Income (Rs. cr) CAGR 22%
Loan Portfolio (Rs.cr) CAGR 21%
Update – last 5 years
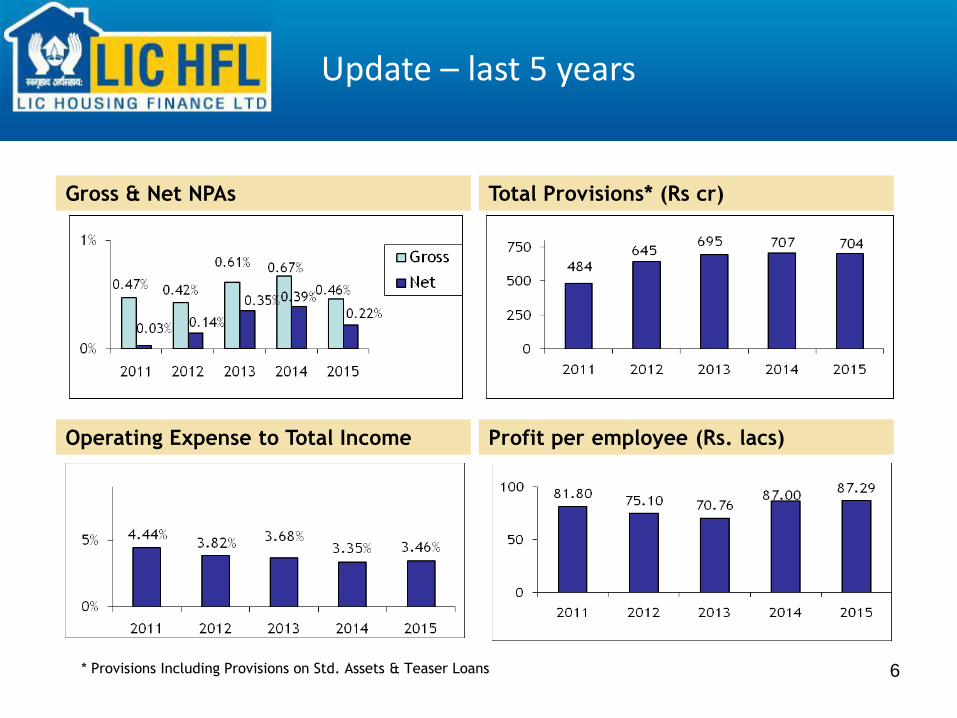
6
Gross & Net NPAs
Operating Expense to Total Income
Total Provisions* (Rs cr)
Profit per employee (Rs. lacs)
* Provisions Including Provisions on Std. Assets & Teaser Loans
Update – last 5 years
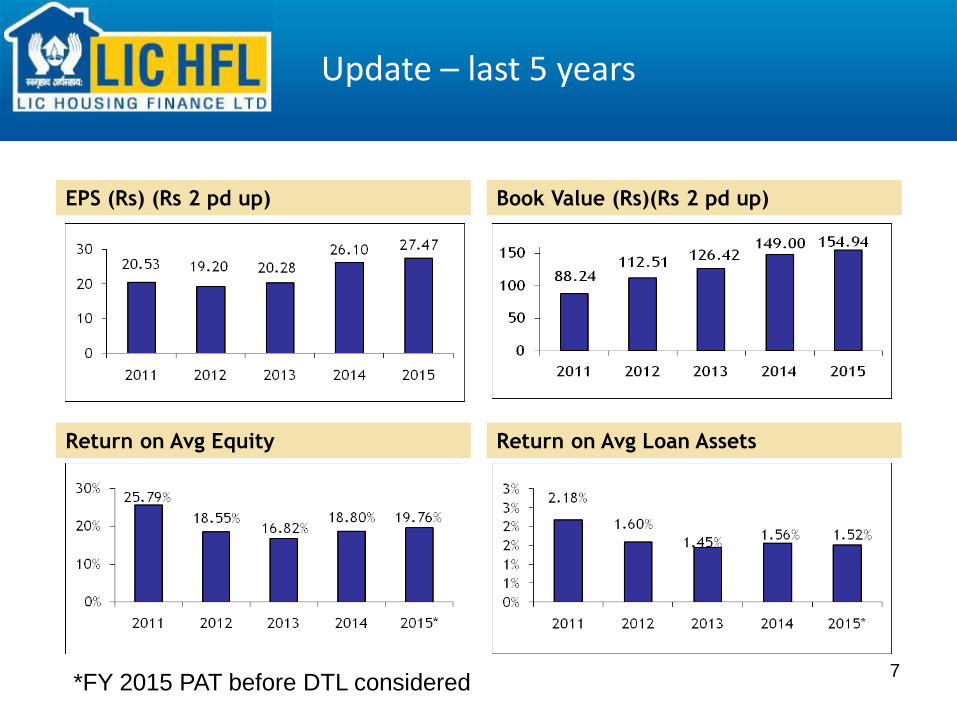
7
EPS (Rs) (Rs 2 pd up)
Return on Avg Equity
Book Value (Rs)(Rs 2 pd up)
Return on Avg Loan Assets
Update – last 5 years
*FY 2015 PAT before DTL considered
8
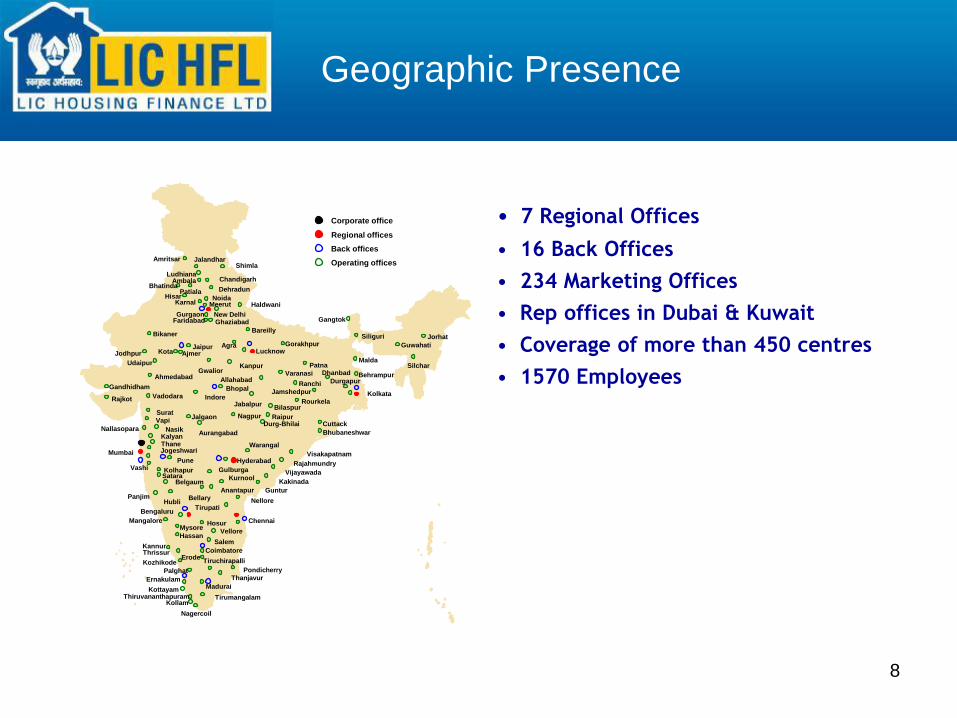
• 7 Regional Offices
• 16 Back Offices
• 234 Marketing Offices
• Rep offices in Dubai & Kuwait
• Coverage of more than 450 centres
• 1570 Employees
Back offices
Operating offices
Regional offices
Corporate office
Nagercoil
Thiruvananthapuram Kottayam
Ernakulam
Kozhikode
Thrissur
Tirumangalam
Madurai
Thanjavur
Pondicherry
Tiruchirapalli
Coimbatore
Salem
Vellore
Chennai Hosur Mysore
Mangalore
Bengaluru
Panjim
Vashi
Mumbai
Nellore Hubli Tirupati
Bellary Anantapur
Kurnool
Guntur
Kakinada
Vijayawada
Hyderabad Rajahmundry
Visakapatnam
Warangal
Bhubaneshwar
Kolkata
Silchar
Guwahati
Siliguri
Gangtok
Patna
Shimla Jalandhar Amritsar
Ludhiana Chandigarh
Dehradun
Haldwani Karnal
Bareilly
Ghaziabad New Delhi
Agra Lucknow
Kanpur
Jaipur Ajmer
Gwalior
Bikaner
Jodhpur
Rajkot
Udaipur
Ahmedabad
Vadodara Indore
Bhopal
Allahabad
Jabalpur
Varanasi
Ranchi
Jamshedpur
Rourkela Bilaspur
Raipur Nagpur Jalgaon Surat Vapi
Aurangabad Nasik
Kalyan Thane Jogeshwari
Pune
Kolhapur
Belgaum
Gulburga
Nallasopara
Kota
Hassan
Erode
Kannur
Kollam
Palghat
Gandhidham
Satara
Durg-Bhilai
Gorakhpur
Meerut
Behrampur
Cuttack
Dhanbad
Durgapur
Jorhat
Malda
Gurgaon Faridabad
Noida
Ambala Bhatinda
Hisar Patiala
Geographic Presence
9
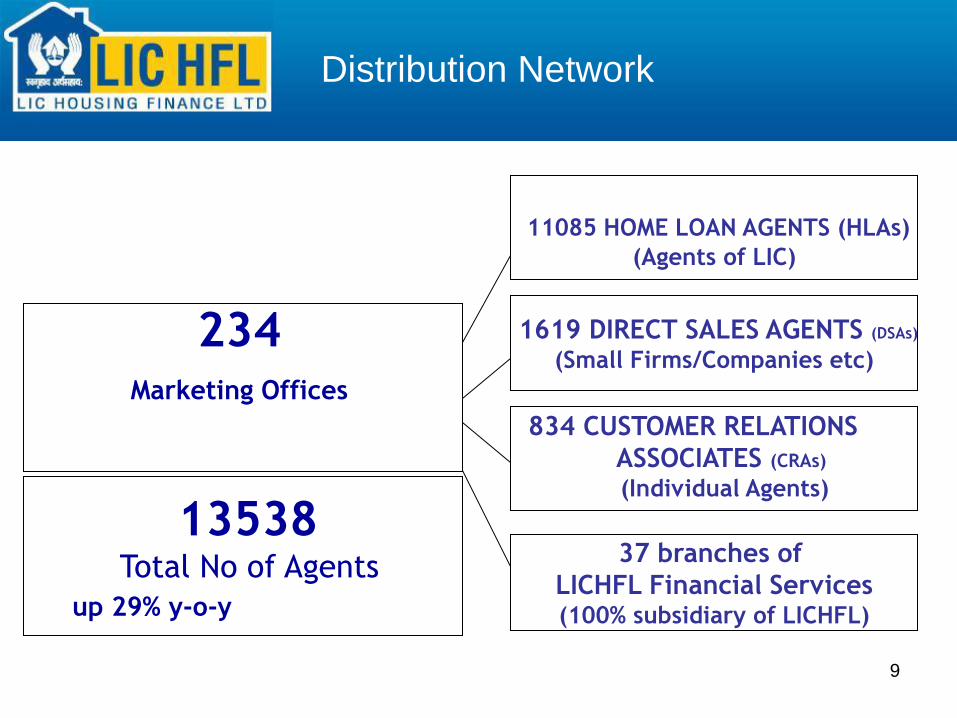
11085 HOME LOAN AGENTS (HLAs)
(Agents of LIC)
1619 DIRECT SALES AGENTS (DSAs)
(Small Firms/Companies etc)
834 CUSTOMER RELATIONS
ASSOCIATES (CRAs)
(Individual Agents)
234 Marketing Offices
13538 Total No of Agents
up 29% y-o-y
37 branches of
LICHFL Financial Services (100% subsidiary of LICHFL)
Distribution Network
10
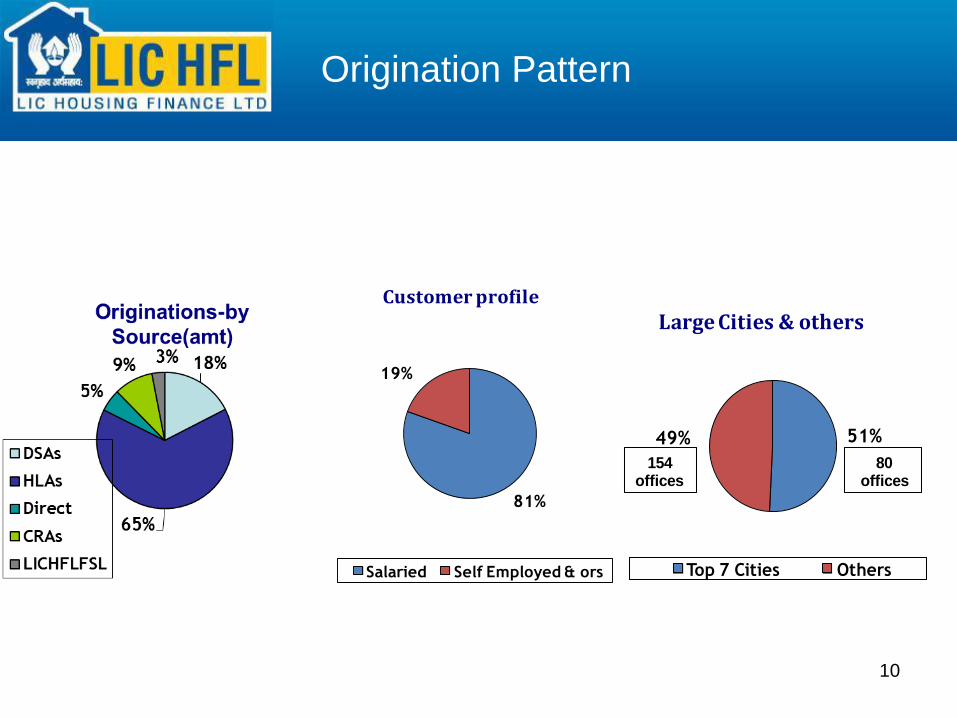
Origination Pattern
81%
19%
Customer profile
Salaried Self Employed & ors
51%49%
Large Cities & others
Top 7 Cities Others
154 offices
80offices
11
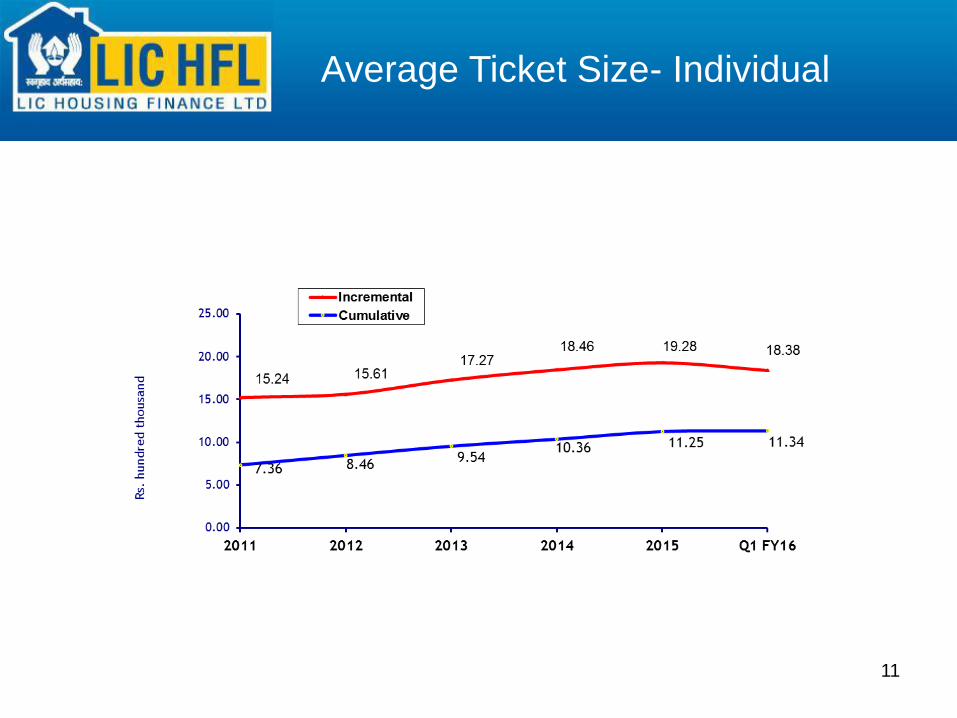
Average Ticket Size- Individual
12
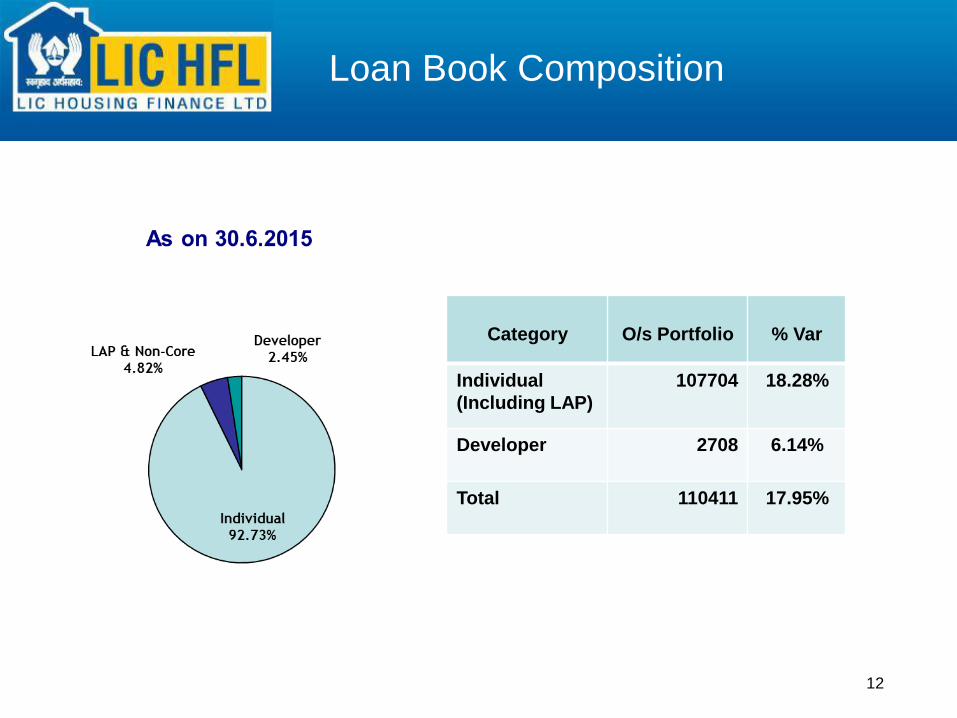
Loan Book Composition
Category
O/s Portfolio
% Var
Individual
(Including LAP)
107704 18.28%
Developer 2708 6.14%
Total 110411 17.95%
13
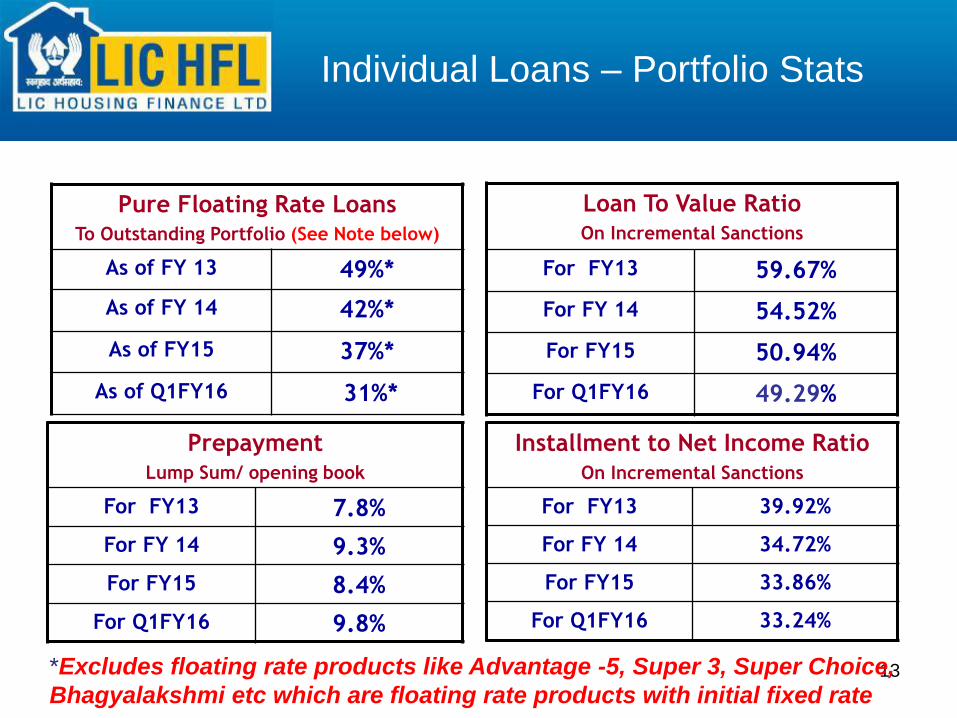
Installment to Net Income Ratio On Incremental Sanctions
For FY13 39.92%
For FY 14 34.72%
For FY15 33.86%
For Q1FY16 33.24%
Loan To Value Ratio On Incremental Sanctions
For FY13 59.67%
For FY 14 54.52%
For FY15 50.94%
For Q1FY16 49.29%
Pure Floating Rate Loans To Outstanding Portfolio (See Note below)
As of FY 13 49%*
As of FY 14 42%*
As of FY15 37%*
As of Q1FY16 31%*
Prepayment Lump Sum/ opening book
For FY13 7.8%
For FY 14 9.3%
For FY15 8.4%
For Q1FY16 9.8%
*Excludes floating rate products like Advantage -5, Super 3, Super Choice,
Bhagyalakshmi etc which are floating rate products with initial fixed rate
Individual Loans – Portfolio Stats
14
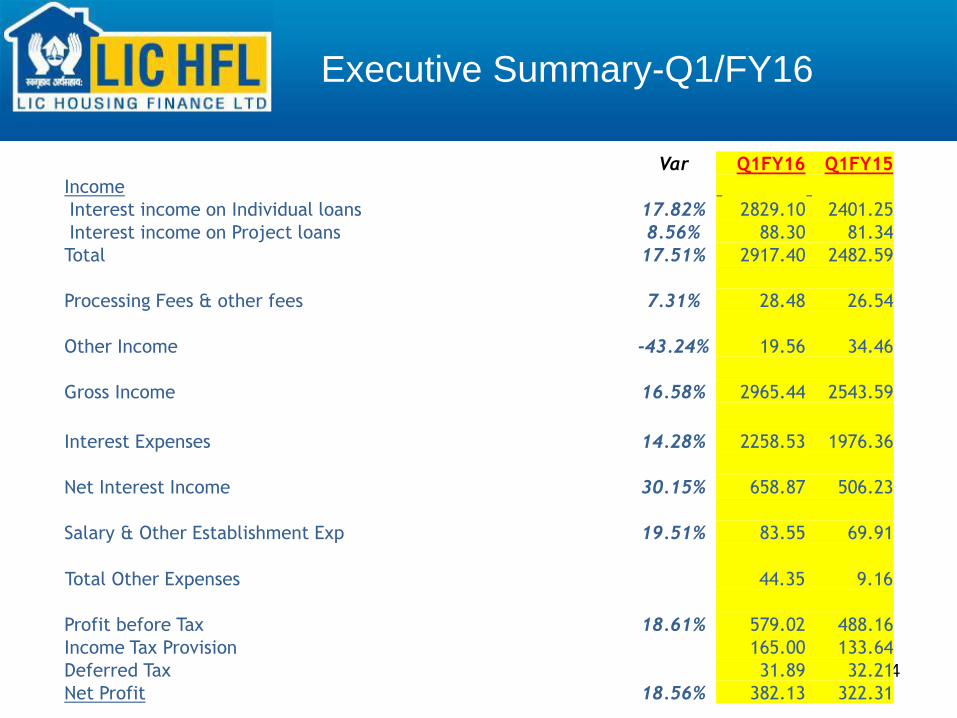
Executive Summary-Q1/FY16
Var Q1FY16 Q1FY15
Income
Interest income on Individual loans 17.82% 2829.10 2401.25
Interest income on Project loans 8.56% 88.30 81.34
Total 17.51% 2917.40 2482.59
Processing Fees & other fees 7.31% 28.48 26.54
Other Income -43.24% 19.56 34.46
Gross Income 16.58% 2965.44 2543.59
Interest Expenses 14.28% 2258.53 1976.36
Net Interest Income 30.15% 658.87 506.23
Salary & Other Establishment Exp 19.51% 83.55 69.91
Total Other Expenses 44.35 9.16
Profit before Tax 18.61% 579.02 488.16
Income Tax Provision 165.00 133.64
Deferred Tax 31.89 32.21
Net Profit 18.56% 382.13 322.31
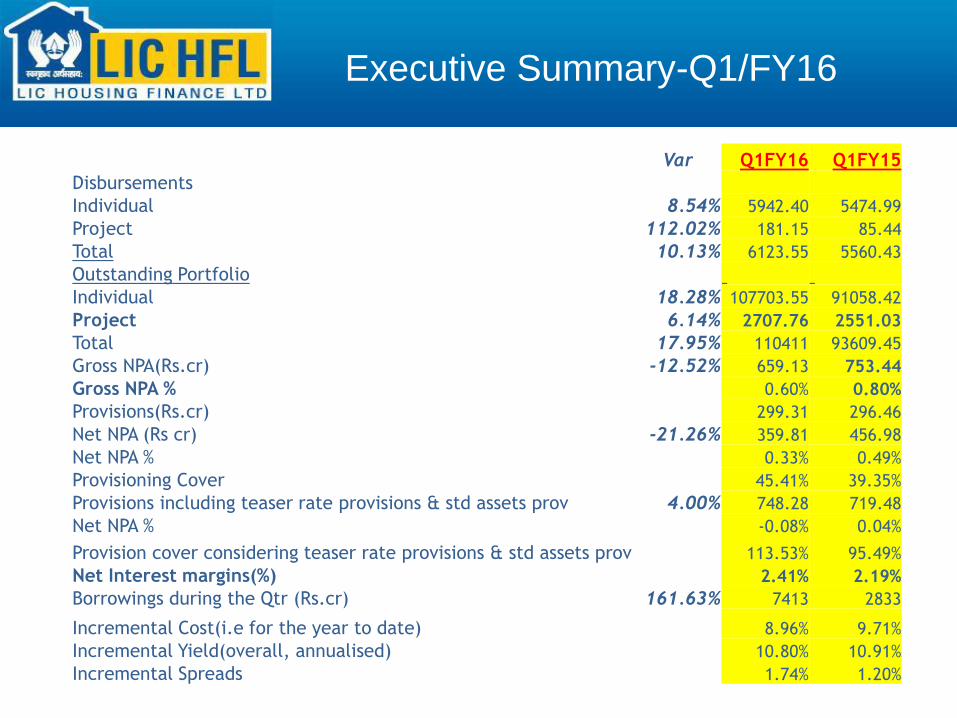
Executive Summary-Q1/FY16
Var Q1FY16 Q1FY15
Disbursements
Individual 8.54% 5942.40 5474.99
Project 112.02% 181.15 85.44
Total 10.13% 6123.55 5560.43
Outstanding Portfolio
Individual 18.28% 107703.55 91058.42
Project 6.14% 2707.76 2551.03
Total 17.95% 110411 93609.45
Gross NPA(Rs.cr) -12.52% 659.13 753.44
Gross NPA % 0.60% 0.80%
Provisions(Rs.cr) 299.31 296.46
Net NPA (Rs cr) -21.26% 359.81 456.98
Net NPA % 0.33% 0.49%
Provisioning Cover 45.41% 39.35%
Provisions including teaser rate provisions & std assets prov 4.00% 748.28 719.48
Net NPA % -0.08% 0.04%
Provision cover considering teaser rate provisions & std assets prov 113.53% 95.49%
Net Interest margins(%) 2.41% 2.19%
Borrowings during the Qtr (Rs.cr) 161.63% 7413 2833
Incremental Cost(i.e for the year to date) 8.96% 9.71%
Incremental Yield(overall, annualised) 10.80% 10.91%
Incremental Spreads 1.74% 1.20%
16
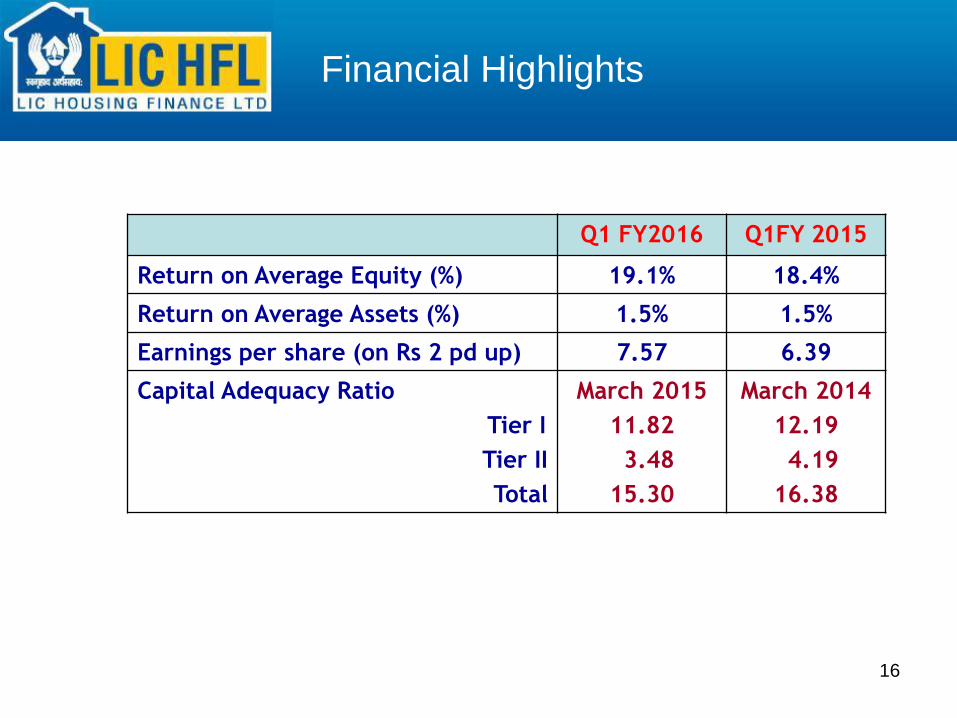
Q1 FY2016 Q1FY 2015
Return on Average Equity (%) 19.1% 18.4%
Return on Average Assets (%) 1.5% 1.5%
Earnings per share (on Rs 2 pd up) 7.57 6.39
Capital Adequacy Ratio
Tier I
Tier II
Total
March 2015
11.82
3.48
15.30
March 2014
12.19
4.19
16.38
Financial Highlights
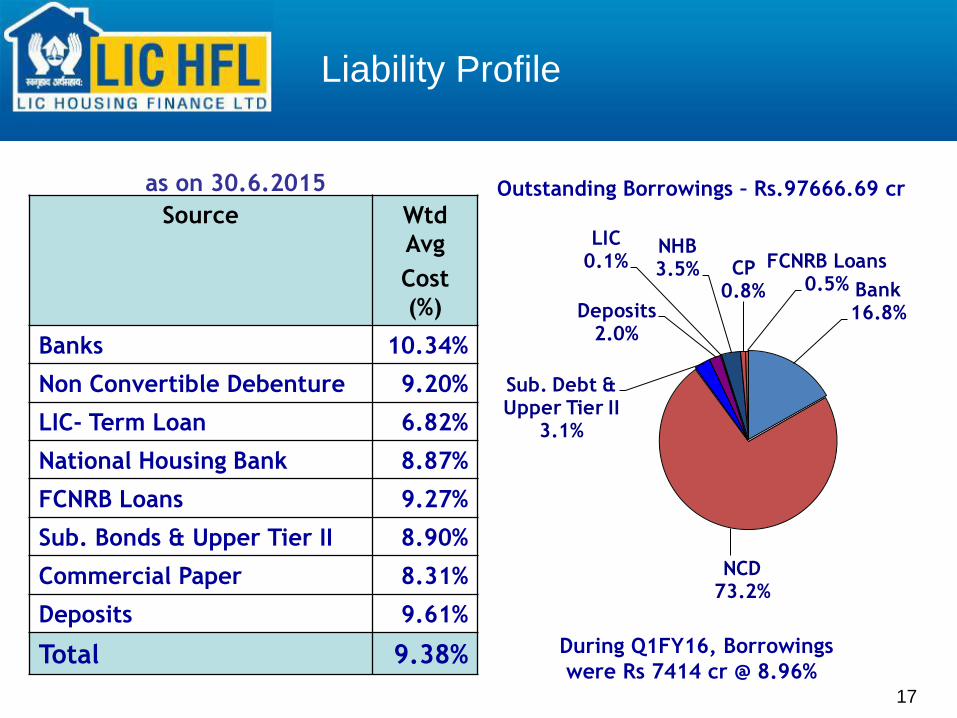
17
Bank16.8%
NCD73.2%
Sub. Debt & Upper Tier II
3.1%
Deposits2.0%
LIC0.1%
NHB3.5% CP
0.8%
FCNRB Loans0.5%
Outstanding Borrowings – Rs.97666.69 cr
Source Wtd
Avg
Cost
(%)
Banks 10.34%
Non Convertible Debenture 9.20%
LIC- Term Loan 6.82%
National Housing Bank 8.87%
FCNRB Loans 9.27%
Sub. Bonds & Upper Tier II 8.90%
Commercial Paper 8.31%
Deposits 9.61%
Total 9.38%
as on 30.6.2015
Liability Profile
During Q1FY16, Borrowings
were Rs 7414 cr @ 8.96%
18
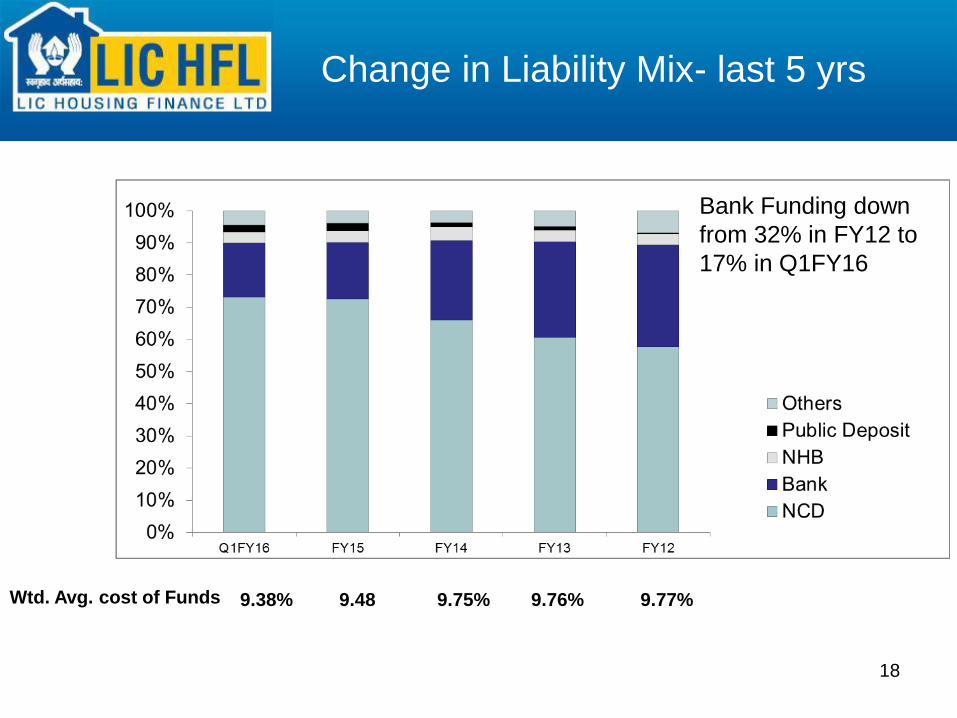
Change in Liability Mix- last 5 yrs
Wtd. Avg. cost of Funds
Bank funding has
reduced from
32% in FY12 to
25% in FY14.
Retail Deposits
increased to 2.2%
9.38% 9.48 9.75% 9.76% 9.77%
Bank Funding down
from 32% in FY12 to
17% in Q1FY16
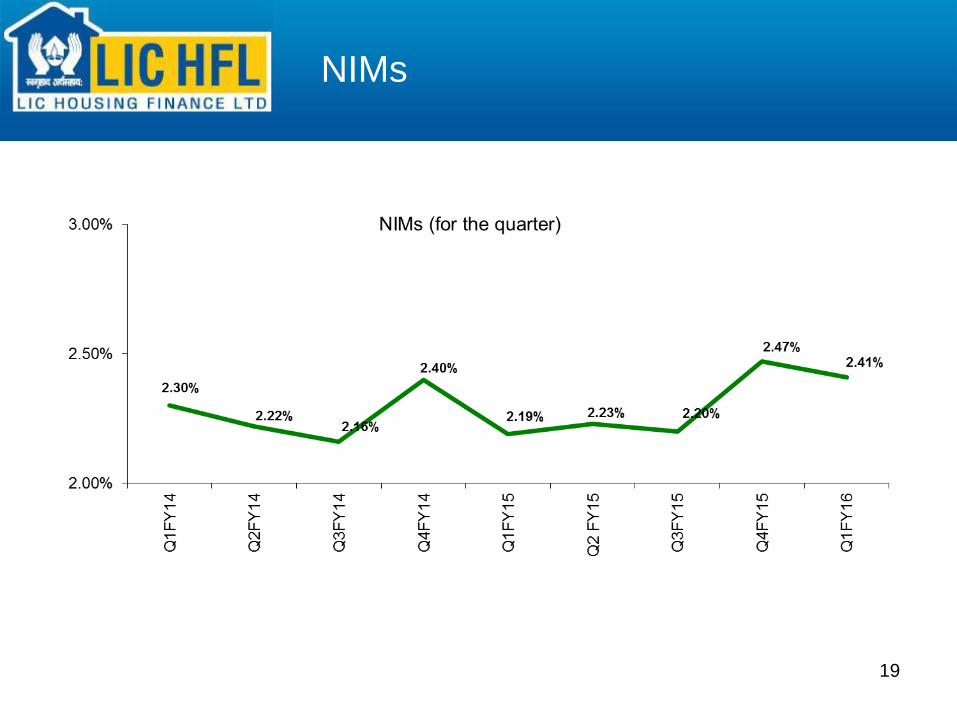
19
NIMs
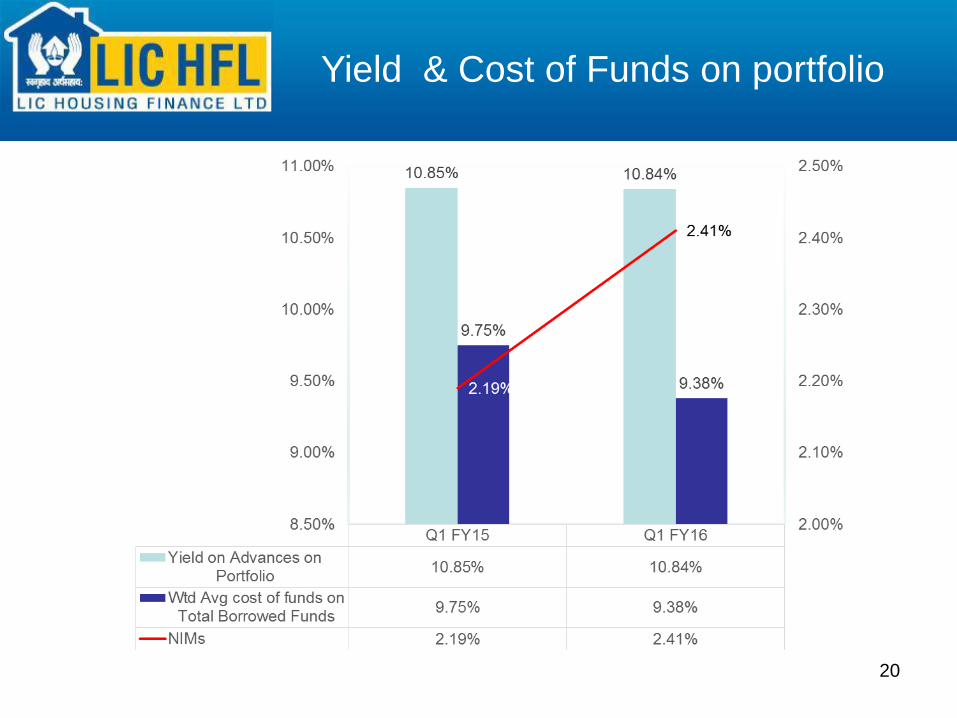
20
Yield & Cost of Funds on portfolio
21
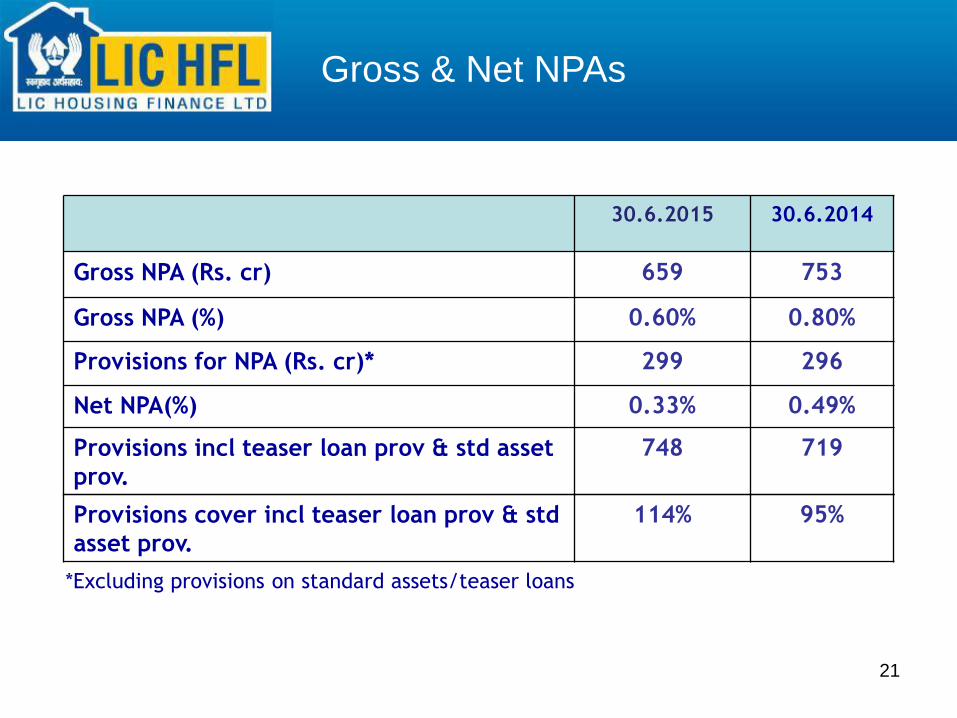
30.6.2015 30.6.2014
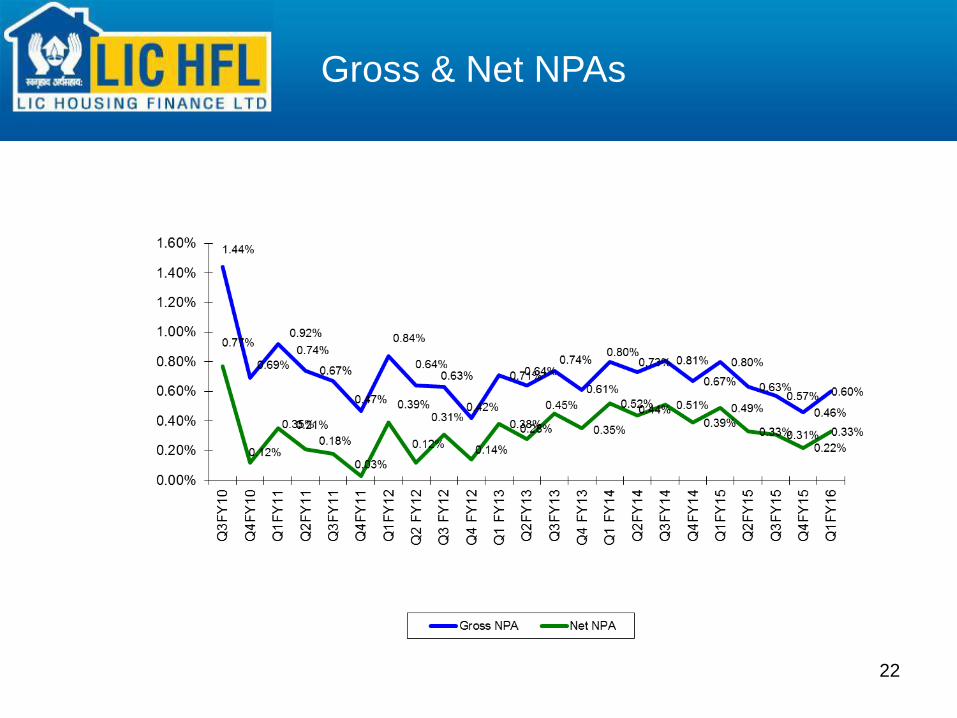
Gross NPA (Rs. cr) 659 753
Gross NPA (%) 0.60% 0.80%
Provisions for NPA (Rs. cr)* 299 296
Net NPA(%) 0.33% 0.49%
Provisions incl teaser loan prov & std asset
prov.
748 719
Gross & Net NPAs
*Excluding provisions on standard assets/teaser loans
Provisions cover incl teaser loan prov & std
asset prov.
114% 95%
22
Gross & Net NPAs
23
DISCLAIMER
This presentation is made purely for information. We have attempted to provide relevant information which we believe will help in knowing the Company. The users may use their own judgment and are advised to make their own calculations before deciding on any matter based on the information given herein.
While every care is taken to verify the accuracy of the information given in this presentation, neither the Company nor its officials would in any way be liable for any action taken or not taken by the viewers or the users of this presentation or for any claims, losses etc.
Thank you


![Investor Update Q2 FY16 / H1 FY16 [Company Update]](https://img.pdfslide.us/doc/110x75/577ca80a1a28abea748caad0/investor-update-q2-fy16-h1-fy16-company-update.jpg)