Embed Size (px)
Citation preview

KEY ECONOMIC DEVELOPMENTS
BRUNEI DARUSSALAM
Q1 2021
DEPARTMENT OF ECONOMIC PLANNING AND STATISTICS
MINISTRY OF FINANCE AND ECONOMY
DEPARTMENT OF PLANNING


Contents
01 GROSS DOMESTIC PRODUCT
02 INFLATION
03 INTERNATIONAL MERCHANDISE
TRADE
04 FISCAL
05 PRIORITY SECTORS
DEVELOPMENT
Page 01
03
04
07
08

-1.4%
Q1 2021 Brunei Economy
GDP grew by
GDP
Non-Oil & Gas
3.1% Oil & Gas
-5.3%
Prices
1.8% CPI rose by
3.8% Food Non-Food
1.2%
Fiscal
856m Fiscal Deficit
Revenue
667m 1.5b Expenditure
Trade
Trade Surplus
Exports
2.8b 2.1b Imports
689m

1 | P a g e
Q1 2021 BRUNEI KEY ECONOMIC DEVELOPMENTS Prepared by:
Department of Planning,
Department of Economic Planning and Statistics
Gross Domestic Product (GDP)
Overview In Q1 2021, the Non-Oil & Gas Sector recorded an
increase of 3.1 per cent due to strong performance of
the Manufacturing Subsector. However, a decline in the
Oil & Gas Sector by 5.3 per cent pulled down the overall
growth of Brunei Darussalam’s economy to negative
1.4 per cent year-on-year (y-o-y).
Exhibit 1 : GDP Growth (Q1 2020 – Q1 2021)
Source: Department of Economic Planning and Statistics
Oil & Gas Performance The decline in the Oil & Gas Sector was mainly due to
a decrease in the production of crude oil, natural gas,
and liquefied natural gas (LNG). The reduction in crude
oil and natural gas production was due to unscheduled
shutdowns in the offshore platform. Meanwhile, the
LNG production decline was mainly due to limited gas
supply following scheduled and unscheduled
maintenance activities.
Non-Oil & Gas Performance The positive growth of the Non-Oil & Gas Sector was
due to an increase in the Manufacturing Subsector as a
result of an increase in the production of petroleum
and chemical products, wearing apparel & textiles, and
food & beverage products.
The increase in the production of petroleum and
chemical products was in line with increasing demand
from China, New Zealand and Malaysia.
The increase in the production of wearing apparel &
textiles was following the growing need of domestic
industries.
Meanwhile, growth in the manufacturing of food and
beverages was driven by seafood processing, mainly
frozen shrimp in line with an increase in the production
of farm prawns. This growth is also to support the
country’s efforts in increasing exports.
This is followed by a positive growth in the subsector
of Wholesale and Retail Trade which was contributed
by an increase in the domestic demand as travel
restrictions remained in place to prevent the spread of
COVID-19. The increase in this subsector is also in line
with the increase in retail sales driven by the sales of
Department Store, Textiles, Wearing Apparel &
Footwear and Electrical Household Appliances and
Lighting Equipment.
The Business Services Subsector also registered a
positive growth in Q1 2021, supported by a rise in
demand for professional and technical services of oil
and gas-related activities.
The Agriculture, Forestry & Fishery Sector also
recorded a positive growth in Q1 2021. This was due to
an increase in the production of subsectors such as
Fishery and Livestock & Poultry caused by higher
domestic demand. In particular, the increase in fisheries
activities was mainly attributed to both the capture and
aquaculture industry. The increase in the capture
industry was mainly due to increased production from
small-scale fishermen. Meanwhile, increased
production of farm prawns was the main contributor to
the increase in aquaculture activities. As for livestock &
poultry activities, the increase was associated with an
increase in the production of beef cattle, broilers, and
goat. However, the Vegetables, Fruits & Other
Agriculture Subsector showed declining growth
undermined by decreased production of fruits mainly
due to seasonal factors.
The Health Services Subsector recorded an improved
growth in line with an increase in both government and
private health services activities.
The Finance Subsector grew by 2.6 per cent mainly due
to an increase of insurance activities sparked by rising
sales of life insurance policies as some companies
offered attractive insurance products with affordable
prices.
2.3 3.4
0.4 (1.4) (1.4)
(10.0)
(5.0)
0.0
5.0
10.0
15.0
Q1 Q2 Q3 Q4 Q1
2020 2021
%
Oil & Gas Sector Non-Oil & Gas Sector
2 | P a g e
Q1 2021 BRUNEI KEY ECONOMIC DEVELOPMENTS Prepared by:
Department of Planning,
Department of Economic Planning and Statistics
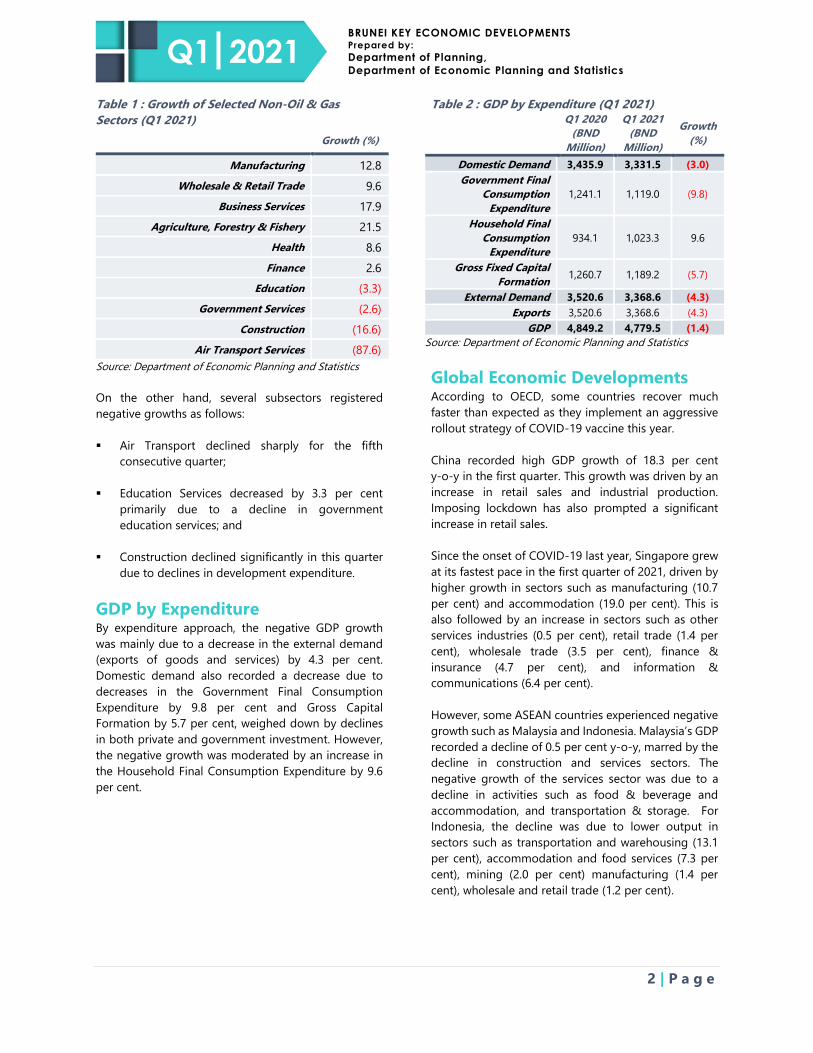
Table 1 : Growth of Selected Non-Oil & Gas
Sectors (Q1 2021)
Growth (%)
Manufacturing 12.8
Wholesale & Retail Trade 9.6
Business Services 17.9
Agriculture, Forestry & Fishery 21.5
Health 8.6
Finance 2.6
Education (3.3)
Government Services (2.6)
Construction (16.6)
Air Transport Services (87.6)
Source: Department of Economic Planning and Statistics
On the other hand, several subsectors registered
negative growths as follows:
Air Transport declined sharply for the fifth
consecutive quarter;
Education Services decreased by 3.3 per cent
primarily due to a decline in government
education services; and
Construction declined significantly in this quarter
due to declines in development expenditure.
GDP by Expenditure By expenditure approach, the negative GDP growth
was mainly due to a decrease in the external demand
(exports of goods and services) by 4.3 per cent.
Domestic demand also recorded a decrease due to
decreases in the Government Final Consumption
Expenditure by 9.8 per cent and Gross Capital
Formation by 5.7 per cent, weighed down by declines
in both private and government investment. However,
the negative growth was moderated by an increase in
the Household Final Consumption Expenditure by 9.6
per cent.
Table 2 : GDP by Expenditure (Q1 2021) Q1 2020
(BND
Million)
Q1 2021
(BND
Million)
Growth
(%)
Domestic Demand 3,435.9 3,331.5 (3.0)
Government Final
Consumption
Expenditure
1,241.1 1,119.0 (9.8)
Household Final
Consumption
Expenditure
934.1 1,023.3 9.6
Gross Fixed Capital
Formation 1,260.7 1,189.2 (5.7)
External Demand 3,520.6 3,368.6 (4.3)
Exports 3,520.6 3,368.6 (4.3)
GDP 4,849.2 4,779.5 (1.4)
Source: Department of Economic Planning and Statistics
Global Economic Developments According to OECD, some countries recover much
faster than expected as they implement an aggressive
rollout strategy of COVID-19 vaccine this year.
China recorded high GDP growth of 18.3 per cent
y-o-y in the first quarter. This growth was driven by an
increase in retail sales and industrial production.
Imposing lockdown has also prompted a significant
increase in retail sales.
Since the onset of COVID-19 last year, Singapore grew
at its fastest pace in the first quarter of 2021, driven by
higher growth in sectors such as manufacturing (10.7
per cent) and accommodation (19.0 per cent). This is
also followed by an increase in sectors such as other
services industries (0.5 per cent), retail trade (1.4 per
cent), wholesale trade (3.5 per cent), finance &
insurance (4.7 per cent), and information &
communications (6.4 per cent).
However, some ASEAN countries experienced negative
growth such as Malaysia and Indonesia. Malaysia’s GDP
recorded a decline of 0.5 per cent y-o-y, marred by the
decline in construction and services sectors. The
negative growth of the services sector was due to a
decline in activities such as food & beverage and
accommodation, and transportation & storage. For
Indonesia, the decline was due to lower output in
sectors such as transportation and warehousing (13.1
per cent), accommodation and food services (7.3 per
cent), mining (2.0 per cent) manufacturing (1.4 per
cent), wholesale and retail trade (1.2 per cent).

3 | P a g e
Q1 2021 BRUNEI KEY ECONOMIC DEVELOPMENTS Prepared by:
Department of Planning,
Department of Economic Planning and Statistics
Exhibit 2 : GDP Growth of Selected Countries
(Q1 2021)
Source: Organisation for Economic Co-operation and
Development (OECD), Department of Statistics Malaysia,
Ministry of Trade & Industry Singapore, Indonesia Economic
Update Report.
Inflation
Overview The Consumer Price Index (CPI) rate for Q1 2021
increased by 1.8 per cent y-o-y compared to Q1 2020.
Both the Food Index and the Non-Food Index
increased by 3.8 per cent and 1.2 per cent respectively.
Exhibit 3: Consumer Price Index (% Growth y-o-y),
Q1 2020 – Q1 2021
Source: Department of Economic Planning and Statistics
Food Prices In Q1 2021, the increase in the Food Index was
attributed by several sub-indices:
Meat by 8.6 per cent, driven by prices of chicken,
and beef & buffalo meat, which increased by 6.3
per cent and 11.8 per cent respectively.
The increase in chicken was contributed by the rise
in the average prices of whole chicken from
BND4.34/kg to BND4.59/kg and chicken wings
from BND7.50/kg to BND8.32/kg. Fresh/chilled
beef was another top driver with average prices
rising from BND14.49/kg to BND16.46/kg.
As for beef & buffalo meat, the increase in price
was due to among others increased domestic
demand from travel restrictions and limited import
supply.
Fresh vegetables by 14.9 per cent, specifically fruit
type (chillies and brinjals), leafy type (sayur sawi
and round cabbage), and to a lesser degree, root
type such as ginger and onions. This was due to
limited supply in line with a shortfall in local
production by 25.8 per cent.
Exhibit 4: Average Prices for Selected Vegetables
(Q1 2021)
Source: Department of Economic Planning and Statistics
Fruits costed more this quarter, increasing by 5.0
per cent as fresh tropical fruits (banana and Thai
durian) and non-tropical fruits (kiwi and oranges)
were not in peak season.
(6.1)
(3.1)
(1.5)
(1.4)
(0.7)
(0.5)
0.4
1.1
1.2
1.3
1.9
2.3
18.3
United Kingdom
Germany
Japan
Brunei Darussalam
Indonesia
Malaysia
United States
Australia
France
Singapore
Korea Republic
Brazil
China
%
1.4
2.3
1.9 2.1
1.8
0.0
1.0
2.0
3.0
4.0
Q1 Q2 Q3 Q4 Q1
2020 2021
%
Food Non-Food CPI
$3.70
$12.98
$6.53
$6.11
$-
$5.00
$10.00
$15.00
Jul Aug Sep Oct Nov Dec Jan Feb Mar
2021
Sawi hijau/manis Chillies
Brinjals Shallots

4 | P a g e
Q1 2021 BRUNEI KEY ECONOMIC DEVELOPMENTS Prepared by:
Department of Planning,
Department of Economic Planning and Statistics
Exhibit 5: Average Prices for Selected Fruits
(Q1 2021)
Source: Department of Economic Planning and Statistics
Non-Food Prices In Q1 2021, the Non-Food Index increased by 1.3 per
cent. The inflation was contributed by Transport,
Communication, and Recreation & Culture:
Transport increased by 6.6 per cent caused by
selected motor cars with specification upgrades,
and air fares to cover operational costs from
limited scheduled flights;
Communication increased by 1.7 per cent due to
new phone models being introduced in the market
and revamp in communication service packages;
and
Recreation and culture rose by 0.9 per cent,
contributed by recreational items, textbooks, files
and folders.
Meanwhile, several sub-indices of the Non-Food Index
recorded a decrease:
Clothing and Footwear decreased by 5.4 per cent,
particularly clothing material for both men and
women;
Furnishings, Household Equipment and Routine
Household Maintenance declined by 1.3 per cent,
pulled down by glassware and major household
appliances; and
1 Autoriti Monetari Brunei Darussalam Policy Statement 2/2020 (December
31, 2020). Autoriti Monetari Brunei Darussalam.
Miscellaneous Goods and Services fell by 0.4 per
cent due to personal products such as babies’
diapers, and personal effects such as bags.
Inflation Outlook Although global inflation is expected to increase
gradually in 2021 with the projected pickup in
economic activities, the increase is likely to remain
subdued as overall demand may continue to be weak
amidst the ongoing COVID-19 pandemic. In particular,
the impact of the pandemic may continue to pose
downward pressures on several price indices
particularly Restaurants and Hotels, and Recreation and
Culture. Nevertheless, uncertainties remain around the
outlook as it also hinges on the duration and intensity
of the COVID-19 outbreak and thus its impact on
global and domestic inflation1.
International Merchandise Trade
Overview In Q1 2021, total trade increased by 2.1 per cent y-o-y
mainly due to an increase in total imports by 53.4 per
cent while total exports fell by 18.3 per cent.
Despite this, trade balance recorded a surplus of
BND688.8 million.
Exhibit 6 : Trade Statistics (Q1 2020 – Q1 2021)
Source: Ministry of Finance and Economy
$2.02
$0.58
$1.24
$10.50
$9.60
$9.80
$10.00
$10.20
$10.40
$10.60
$-
$0.50
$1.00
$1.50
$2.00
$2.50Ja
n
Feb
Mar
Ap
r
May
Jun
Jul
Au
g
Sep
Oct
No
v
Dec
Jan
Feb
Mar
2020 2021
Banana Oranges
Kiwi Thai Durian - Chanee
2,030
681
(445) (482)
689
(1,000)
(500)
0
500
1,000
1,500
2,000
2,500
3,000
3,500
4,000
Q1 Q2 Q3 Q4 Q1
2020
BN
D M
illio
n
Export Import Trade Balance

5 | P a g e
Q1 2021 BRUNEI KEY ECONOMIC DEVELOPMENTS Prepared by:
Department of Planning,
Department of Economic Planning and Statistics
Export Development In Q1 2021, Brunei Darussalam's total exports
contracted by 18.3 per cent y-o-y.
Although total exports remained weaker from the same
period the year before, a clear recovery can be seen
compared to the past few quarters where exports were
impacted due to weaker global demand in general
created by the COVID-19 pandemic that disrupted
global trade activities.
Table 3 : Exports (Q1 2020 & Q1 2021)
Q1 2020
(BND
Million)
Q1 2021
(BND
Million)
Change
(BND
Million)
Domestic Exports 3,351.0 2,695.0 (656.0)
Re-Exports 30.0 66.6 36.5
Total Exports 3,381.0 2,761.6 (619.5)
Source: Ministry of Finance and Economy
In particular, the country's major exports declined
significantly due to weakened crude oil and LNG
demand coupled with lower price for LNG while crude
oil price per barrel increased slightly.
Table 4 : Major Exports (Q1 2020 & Q1 2021)
Q1 2020
(BND
Million)
Q1 2021
(BND
Million)
Change
(BND
Million)
Crude Oil 748.0 565.2 (182.8)
LNG 1,154.0 756.2 (397.8)
Methanol 50.5 73.8 23.3
Total 1,952.5 1,395.3 (557.3)
Source: Ministry of Energy
Note: Crude Oil, LNG and Methanol were the only major exports
(making up more than 90% of the country’s total export on average
(2012-2019)) prior to the operation of the new petrochemical industry
in November 2019.
Table 5 : Prices of Major Export Commodities
(Q1 2020 & Q1 2021)
Q1 2020 Q1 2021
Crude Oil (USD/barrel) 57.89 62.70
LNG (USD/MMBtu) 9.86 7.08
Methanol (USD/MT) 658.03 323.48
Source: Ministry of Energy
Table 6 : Volume of Major Export Commodities
(Q1 2020 & Q1 2021)
Q1 2020 Q1 2021
Crude Oil (Thousand barrels
per day) 89.9 75.4
LNG (MMBtu per day) 960,488 881,552
Methanol (MT) 165,552 171,620
Source: Ministry of Energy
Note: Export volume decreased for both crude oil and LNG while
methanol increased.
On the other hand, the petrochemical industry
continues to add value in the country’s overall exports
with its highest ever contribution amounting to
BND1,286.9 million in Q1 2021.
Exhibit 7 : Domestic Exports (Q1 2020 – Q1 2021)
Source: Ministry of Finance and Economy
Table 7 : Domestic Exports (Q1 2020 & Q1 2021)
Q1 2020
(BND
Million)
Q1 2021
(BND
Million)
Change
(BND
Million)
Major Exports 1,953.0 1,395.3 (557.7)
Petrochemical
Products 1,141.0 1,286.9 145.9
Others 15.0 12.8 (2.2)
Total 3,351.0 2,695.0 (656.0)
Source: Ministry of Finance and Economy
In terms of export destinations, Japan remained the top
export partner for Brunei Darussalam in this quarter
with export products comprising of mainly LNG.
Despite this, total exports to Japan in Q1 2021 were
substantially less than in Q1 2020. Future exports to
Japan will depend on the country’s management of its
COVID-19 situation, as this will affect their economy,
thus influencing their demand for imports from Brunei
0
500
1,000
1,500
2,000
2,500
3,000
3,500
Q1 Q2 Q3 Q4 Q1
2020 2021
BN
D M
illio
n
Crude Oil LNG Petrochemical Methanol Others

6 | P a g e
Q1 2021 BRUNEI KEY ECONOMIC DEVELOPMENTS Prepared by:
Department of Planning,
Department of Economic Planning and Statistics
Darussalam. With the Japan Olympics 2021
commencing July 2021, Japan’s energy demand is
expected to rise alongside demand for LNG from
Brunei Darussalam. This is followed by Singapore
comprising of mainly automotive fuels and crude oil.
Singapore has managed their COVID-19 situation well
with vaccination programmes progressing early 2021,
which has had a positive impact to their economic
recovery. Q1 2021 recorded higher total exports to
Singapore than in Q1 2020. This trend is expected to
continue into 2021, and may contend Japan as the
biggest trading partner with Brunei Darussalam. Finally,
total exports to China are the third biggest, mainly
comprising of downstream petrochemical products.
This quarter recorded higher total exports compared to
the previous quarter, Q1 2020, and this trend is
expected to continue into 2021.
Exhibit 8 : Domestic Exports (Top 6 Destinations),
Q1 2020 – Q1 2021
Source: Ministry of Finance and Economy
Import Development Brunei Darussalam’s total imports increased by 53.4 per
cent y-o-y in this quarter. This increase was mainly due
to a rise in imports of mineral fuels, food and machinery
& transport equipment.
Table 8 : Imports by Commodity
(Q1 2020 & Q1 2021)
Q1 2020
(BND
Million)
Q1 2021
(BND
Million)
Change
(BND
Million)
Food 129.7 191.5 61.8
Mineral Fuels 502.0 1,090.2 588.2
Chemical 96.2 125.9 29.7
Manufactured
Goods 187.9 145.9 (42.0)
Machinery &
Transport
Equipment
334.0 388.8 54.8
Others 101.8 130.5 28.8
Total 1,351.6 2,072.8 721.2
Source: Ministry of Finance and Economy
In Q1 2020, import of mineral fuels was significantly
higher compared to the previous year. This import was
mainly used as feedstock for the petrochemical
industry.
Exhibit 9 : Imports by Top 5 Commodity
(Q1 2020 – Q1 2021)
Source: Ministry of Finance and Economy
Among the top five (5) imports by commodity, mineral
fuels imports increased by 117.2 per cent, food by 47.6
per cent, chemicals by 30.9 per cent, machinery and
transport equipment by 16.4 per cent, while
manufactured goods recorded a decrease by 22.4 per
cent y-o-y.
0
500
1,000
1,500
2,000
2,500
3,000
Q1 Q2 Q3 Q4 Q1
2020 2021
BN
D M
illio
n
Japan Singapore China
India Australia Malaysia -
500
1,000
1,500
2,000
2,500
Q1 Q2 Q3 Q4 Q1
2020 2021
BN
D M
illio
n
Chemicals
Manufactured Goods
Food
Machinery and Transport Equipment
Mineral Fuels
7 | P a g e
Q1 2021 BRUNEI KEY ECONOMIC DEVELOPMENTS Prepared by:
Department of Planning,
Department of Economic Planning and Statistics
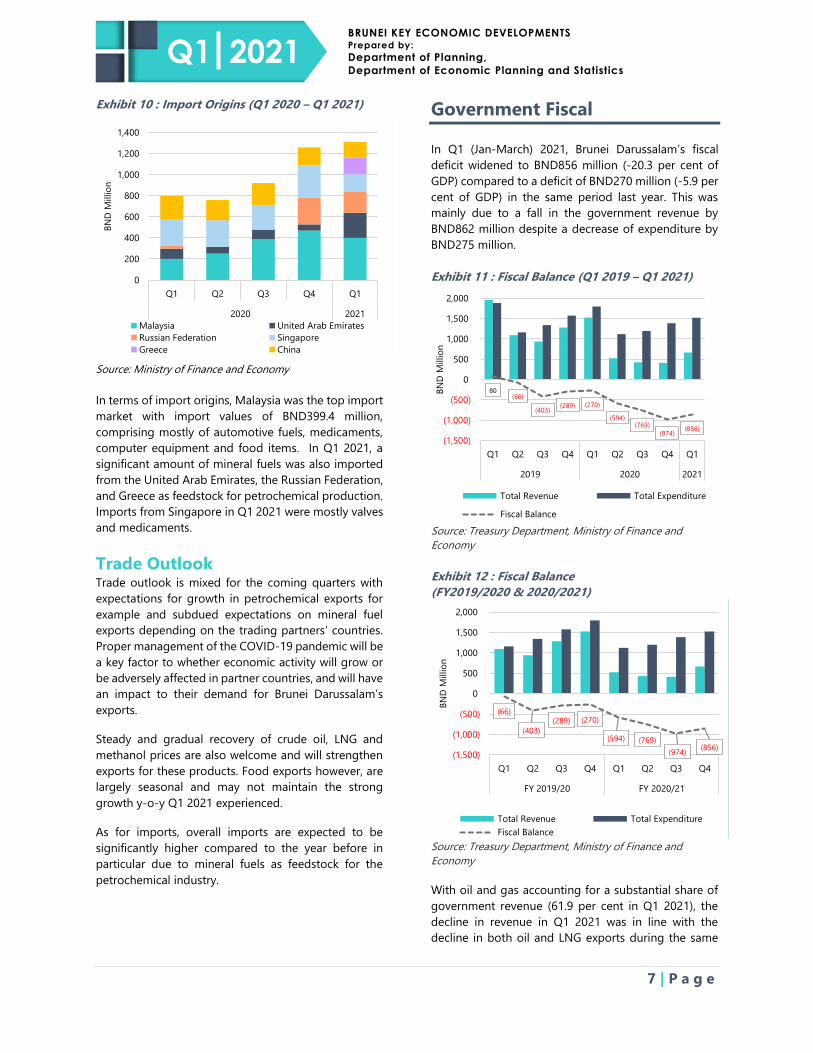
Exhibit 10 : Import Origins (Q1 2020 – Q1 2021)
Source: Ministry of Finance and Economy
In terms of import origins, Malaysia was the top import
market with import values of BND399.4 million,
comprising mostly of automotive fuels, medicaments,
computer equipment and food items. In Q1 2021, a
significant amount of mineral fuels was also imported
from the United Arab Emirates, the Russian Federation,
and Greece as feedstock for petrochemical production.
Imports from Singapore in Q1 2021 were mostly valves
and medicaments.
Trade Outlook Trade outlook is mixed for the coming quarters with
expectations for growth in petrochemical exports for
example and subdued expectations on mineral fuel
exports depending on the trading partners’ countries.
Proper management of the COVID-19 pandemic will be
a key factor to whether economic activity will grow or
be adversely affected in partner countries, and will have
an impact to their demand for Brunei Darussalam’s
exports.
Steady and gradual recovery of crude oil, LNG and
methanol prices are also welcome and will strengthen
exports for these products. Food exports however, are
largely seasonal and may not maintain the strong
growth y-o-y Q1 2021 experienced.
As for imports, overall imports are expected to be
significantly higher compared to the year before in
particular due to mineral fuels as feedstock for the
petrochemical industry.
Government Fiscal
In Q1 (Jan-March) 2021, Brunei Darussalam’s fiscal
deficit widened to BND856 million (-20.3 per cent of
GDP) compared to a deficit of BND270 million (-5.9 per
cent of GDP) in the same period last year. This was
mainly due to a fall in the government revenue by
BND862 million despite a decrease of expenditure by
BND275 million.
Exhibit 11 : Fiscal Balance (Q1 2019 – Q1 2021)
Source: Treasury Department, Ministry of Finance and
Economy
Exhibit 12 : Fiscal Balance
(FY2019/2020 & 2020/2021)
Source: Treasury Department, Ministry of Finance and
Economy
With oil and gas accounting for a substantial share of
government revenue (61.9 per cent in Q1 2021), the
decline in revenue in Q1 2021 was in line with the
decline in both oil and LNG exports during the same
0
200
400
600
800
1,000
1,200
1,400
Q1 Q2 Q3 Q4 Q1
2020 2021
BN
D M
illio
n
Malaysia United Arab Emirates
Russian Federation Singapore
Greece China
80 (66)
(403)(289) (270)
(594)(769)
(974)(856)
(1,500)
(1,000)
(500)
0
500
1,000
1,500
2,000
Q1 Q2 Q3 Q4 Q1 Q2 Q3 Q4 Q1
2019 2020 2021
BN
D M
illio
n
Total Revenue Total Expenditure
Fiscal Balance
(66)
(403)
(289) (270)
(594) (769)
(974)(856)
(1,500)
(1,000)
(500)
0
500
1,000
1,500
2,000
Q1 Q2 Q3 Q4 Q1 Q2 Q3 Q4
FY 2019/20 FY 2020/21
BN
D M
illio
n
Total Revenue Total Expenditure
Fiscal Balance

8 | P a g e
Q1 2021 BRUNEI KEY ECONOMIC DEVELOPMENTS Prepared by:
Department of Planning,
Department of Economic Planning and Statistics
quarter. Other than that, the decline in revenue from
government operations and returns from investments
& savings also contributed to the decline in
government revenue.
Meanwhile, the overall decline in government
expenditure was largely due to reductions in both other
charges annual recurrent (OCAR) and development
expenditure (by BND159 million and BND74 million,
respectively). In particular, the continuous decline in
development expenditure was in view of a number of
major National Development Plan (RKN) projects
having neared or seen completion.
Nevertheless, there are other major RKN projects which
are currently ongoing that would contribute to the
increase in development expenditure. Among these are
Sultan Sharif Ali Islamic University (UNISSA); Human
Resource Development Fund (HRD Fund); and
Kampong Lugu National Housing Phase 2 (1,500 Unit
Houses).
The commencement of the Kampong Lugu National
Housing Phase 2 (1,500 unit houses) project further
signifies the country's pursuit of providing quality and
affordable housing in improving the welfare of its
citizens. Meanwhile, the UNISSA and HRD Fund
projects demonstrate the Government’s continuous
commitment in investing quality education as it
recognises the vital need for human resource
development towards an educated and marketable
workforce. During the Financial Year 2020/2021,
around BND37.7 million was allocated for the HRD
Fund to finance programmes such as Learn & Grow and
Growth for Excellence programme.
Elsewhere, several projects geared towards human
resource development particularly in upgrading skills
and competencies are also currently ongoing. The i-
Ready programme was introduced to provide
unemployed graduates the opportunity to work in the
public or private sector and increase their chances of
landing a permanent job. During RKN11 period, as of
May 2021, a total of 1,259 out of 4,464 i-Ready trainees
managed to secure permanent jobs (83 per cent in the
private sector including FDI and GLCs companies as
well Statutory Body). Meanwhile, the Capacity Building
Centre (PPK) allows jobseekers to learn industry-
related skills in becoming more relevant and
employable in certain sectors. A total of 253 out of 505
PPK participants have secured permanent jobs (about
95 per cent in the private sector).
Towards the development of Temburong District, the
key project, the opening of the Sultan Haji Omar ‘Ali
Saifuddien Bridge, has brought various positive socio-
economic development such as improving connectivity
and access throughout the country, and facilitating
economic growth and development of Temburong
District. Apart from that, there are also several ongoing
projects aimed at improving the social development
and quality of life of Temburong District in particular
the construction of schools and university such as the
new UNISSA campus project and Rebuilding of Sultan
Hassan Bangar Secondary School Temburong; and the
provision of electricity such as the Reinforcement of
11kv Distribution Network System Overhead Wire
3c/300mcm for Kampong Senukoh, Kampong Piasau-
Piasau, Kampong Kenua, Kampong Semabat and
Surrounding Areas of Temburong District; and
Reinforcement of 11KV Network System Main Switch
Station Belingus to Propose Main Switch Station
66KV/11KV Perdayan.
Priority Sectors Development
Downstream Oil & Gas In the first quarter of 2021, the Downstream Oil & Gas
Sector, comprising Manufacture of Other Petroleum
and Chemical Products contributed about BND329.9
million to Gross Value Added, increasing from the
BND280.2 million recorded in the same quarter of
2020.
Exhibit 13 : Downstream Oil & Gas Sector GDP at
Current Prices (Q1 2019 – Q1 2021)
Source: Department of Economic Planning & Statistics
Meanwhile, exports from the Downstream Oil & Gas
Sector amounted to BND1,364.0 million in Q1 2021,
compared to the BND1,439.1 million recorded in the
same quarter of 2020. The decline in exports is perhaps
0
50
100
150
200
250
300
350
Q1 Q2 Q3 Q4 Q1 Q2 Q3 Q4 Q1
2019 2020 2021
BN
D M
illio
n
Other Petrochemicals Methanol

9 | P a g e
Q1 2021 BRUNEI KEY ECONOMIC DEVELOPMENTS Prepared by:
Department of Planning,
Department of Economic Planning and Statistics
linked with lower prices although export volumes of
several key downstream oil and gas-related products
such as paraxylene and methanol increased.
Exhibit 14 : Downstream Oil & Gas Exports
(Q1 2019 – Q1 2021)
Source: Department of Economic Planning & Statistics
In other developments, two new projects are being
planned in the downstream sector — sodium
methylate manufacturing and a liquefied petroleum
gas (LPG) bottling plant. The manufacturing of sodium
methylate is intended for the purpose of production of
pharmaceuticals and food ingredients, while an LPG
bottling plant involves the storage of liquefied
petroleum gas into bottles2.
Meanwhile, Brunei Fertilizer Industries (BFI) is slated to
begin operations in Q3 2021. The BND1.8 billion
fertiliser plant is expected to produce 0.77 million
tonnes per annum (MTPA) of urea in its first year of
operation before increasing its output to 1.37 MTPA in
2022. Brunei aims to achieve 32 MTPA in downstream
industry production by 20253. This is estimated to add
about BND100-200 million to the country’s GDP.
Food In the first quarter of 2021, the Food Sector, comprising
Vegetables, Fruits & Other Agriculture, Livestock &
Poultry, Fishery and Manufacture of Food & Beverage
Products contributed about BND56.0 million to Gross
Value Added, increasing from the BND44.0 million
recorded in the same quarter of 2020.
2 Government eyes Hengyi expansion in 2022 (March 22, 2021). The Scoop.
Exhibit 15 : Food Sector GDP at Current Prices
(Q1 2019 – Q1 2021)
Source: Department of Economic Planning & Statistics
By subsector, the Livestock & Poultry Subsector was
valued at BND19.2 million at GDP current prices in Q1
2021 compared to BND16.0 million in Q1 2020. This
improvement came from increased productions in the
following commodities:
Broiler chicken, which increased from 6,260.9 MT
in Q1 2020 to 7,628.5 MT in Q1 2021;
Chicken eggs, which increased from 41.4 million
eggs in Q1 2020 to 42.6 million eggs in Q1 2021;
Buffalo and cattle meat, which increased from
288.6 MT in Q1 2020 to 805.4 MT in Q1 2021; and
Goat and sheep meat, which increased from 7.3
MT in Q1 2020 to 45.0 MT in Q1 2021.
For the Fishery Subsector, it was valued at BND22.8
million at GDP current prices in Q1 2021 compared to
BND15.8 million in Q1 2020. This improvement was
supported by increased productions in both the
capture and the aquaculture industry. In particular, the
total output of the capture industry increased from
3,053.5 MT in Q1 2020 to 3,311.7 MT in Q1 2021,
supported by the increase in the number of operating
days recorded in fish capture activities as well as
favourable weather conditions. Meanwhile, the
aquaculture industry continued its uptrend, driven by
significant increases in marine shrimp productions,
which increased from 216.7 MT in Q1 2020 to 758.7 MT
in Q1 2021.
3 Brunei Fertilizer Industries to start operations in Q3 2021 (February 04, 2021).
The Scoop.
82.3 58.4 50.4
910.2
1,439.1
1,085.6
810.7 828.8
1,364.0
0
200
400
600
800
1,000
1,200
1,400
1,600
Q1 Q2 Q3 Q4 Q1 Q2 Q3 Q4 Q1
2019 2020 2021
BN
D M
illio
n 0
20
40
60
Q1 Q2 Q3 Q4 Q1 Q2 Q3 Q4 Q1
2019 2020 2021
BN
D M
illio
n
Vegetables, Fruits & Other Agriculture
Manufacture of Food & Beverage Products
Livestock & Poultry

10 | P a g e
Q1 2021 BRUNEI KEY ECONOMIC DEVELOPMENTS Prepared by:
Department of Planning,
Department of Economic Planning and Statistics
As for the Vegetables, Fruits & Other Agriculture
Subsector, it was valued at BND6.1 million at GDP
current prices in Q1 2021, lower than the BND6.3
million recorded in Q1 2020. The decline was due to decreased production of vegetables and fruits (from
2,294.0 MT and 2,621.6 MT in Q1 2020 to 1,702.6 MT
and 1,094.0 MT respectively in Q1 2021). One of the
primary factors that led to the declines was difficulties
in importing agricultural input materials such as seeds
and fertilizers due to the COVID-19 pandemic.
Despite the downturn in the Vegetables, Fruits & Other
Agriculture Subsector, paddy production continued to
increase, up from 395.4 MT in Q1 2020 to 1,309.3 MT
in Q1 2021. One of the primary factors which
contributed to the increase was the increase in the area
of high yielding hybrid paddy cultivation, namely
Sembada188.
For Manufacture of Food & Beverage Products, it was
valued at BND7.9 million at GDP current prices in Q1
2021 compared to BND5.8 million in Q1 2020. This
improvement was supported by the increase in
production of fishery processing industry from 494.8
MT in Q1 2020 to 715.5 MT in Q1 2021.
In terms of exports from the Food Sector, it amounted
to BND4.9 million in Q1 2021, higher than the BND1.8
million recorded in the same quarter of 2020. By type
of products, majority of exports in Q1 2021 were
comprised of shrimp products exported mainly to
Taiwan, Australia and Japan.
Exhibit 16 : Food Exports (Q1 2019 – Q1 2021)
Source: Department of Economic Planning & Statistics
4 BDFA overseen Brunei food safety, quality (February 27, 2021). Borneo Bulletin. 5 PDS to raise Australian cattle in Brunei through feedlotting programme
(February 22, 2021). Biz Brunei.
In other developments, several initiatives were laid out
in line with the country's goal of expediting the
development of the food industry. These include:
Establishment of a new regulatory body for food
safety called the Brunei Darussalam Food
Authority (BDFA). The statutory body will act as a
single point of contact in food-related matters,
ensuring the maximisation of food safety and
quality in the country as well as developing the
local food industry and achieve international
competitiveness4.
PDS Abattoir is planning to initiate its first
commercial feedlotting programme with a pilot
project that intensively feeds Australian cattle
starting Q2 2021. With the objective of bringing
more competitive prices for quality breeds of beef
to local markets, it is expected that once fully
operational, PDS’ annual slaughtering capacity will
increase to 8,000 cattle in the first phase, reaching
16,000 and 24,000 in the second and third phase
respectively. PDS is also planning for their feedlots
to produce beef that can be exported, with
potential markets inclu0ding the Middle East and
regional countries like Malaysia, Singapore, Macau
and Thailand5.
Royal Brunei Culinary (RBC) is keen to partner with
local Food & Beverage (F&B) businesses following
the recent launch of its state-of-the-art central
kitchen and headquarters in the Lambak West
Industrial Area. With high production scale and
volume, Halal and Hazard Analysis Critical Control
Point (HACCP) certifications and skilled staff, RBC
can help businesses to produce F&B products
according to their recipes (and specifications) at
competitive rates, enabling businesses to focus
more on marketing and growing demand for their
products6.
Golden Corporation Sdn Bhd has set its target of
producing no less than 5,000 tonnes of shrimps in
20217. As of 2020, the total production of shrimp
(farm prawn) in the aquaculture industry
amounted to 3,045.8 MT. Furthermore, with the
company's 200 hectares shrimp farm at Penyatang
in Tutong nearing completion and phase 2
expected to commence next year, the company
will have a further 259 hectares of shrimp farm to
6 RBC keen to partner with local F&B businesses (March 03, 2021). Biz Brunei. 7 Golden eyes 5,000 tonne shrimp output for 2021 (January 28, 2021). Borneo
Bulletin.
2.8
4.43.9
2.8
1.8
7.9
2.1 2.2
4.9
0.0
1.0
2.0
3.0
4.0
5.0
6.0
7.0
8.0
9.0
Q1 Q2 Q3 Q4 Q1 Q2 Q3 Q4 Q1
2019 2020 2021
BN
D M
illio
n

11 | P a g e
Q1 2021 BRUNEI KEY ECONOMIC DEVELOPMENTS Prepared by:
Department of Planning,
Department of Economic Planning and Statistics
take its annual production output to even greater
heights.
Tourism In the first quarter of 2021, the Tourism Sector
contributed about BND27.8 million to Gross Value
Added. Although this figure is lower than the BND35.6
million recorded in the same quarter of 2020, it showed
a gradual recovery on a quarter-to-quarter basis in line
with continued de-escalation of coronavirus
restrictions imposed by the Government.
Exhibit 17 : Tourism GDP at Current Prices
(Q1 2019 – Q1 2021)
Source: Department of Economic Planning & Statistics
Nevertheless, international tourism activities continued
to be underwhelmed as restrictions on non-essential
travel ban remained largely in place. As such,
international arrivals by air plunged (by 98.3 per cent y-
o-y) for the fourth consecutive quarter since Q2 2020.
Similarly, arrivals by sea and land declined by 93.7 per
cent and 97.9 per cent respectively.
Exhibit 18 : International Air Arrivals
(Q1 2019 – Q1 2021)
Source: Tourism Development Department, Ministry of
Primary Resources and Tourism
Exhibit 19 : Arrivals by Air, Sea and Land
(Q1 2019 – Q1 2021)
Source: Department of Immigration, Ministry of Home Affairs
Occupancy rates in accommodation places also
registered declines in Q1 2021, down on average by
34.0 per cent compared to 36.7 per cent in Q1 2020.
Exhibit 20 : Occupancy Rate of Hotels, Resorts,
Apartments and Guest Houses (Q1 2019 – Q1 2021)
Source: Ministry of Primary Resources and Tourism
Looking ahead, the outlook of the Tourism Sector will
continue to be restrained as much will hinge on the
extent and length of time in which travel restrictions are
imposed both domestically and internationally to curb
the outbreak of the COVID-19 pandemic.
Info-Communication & Technology (ICT) In the first quarter of 2021, the ICT Sector contributed
about BND125.7 million to Gross Value Added,
increasing from the BND115.1 million recorded in the
same quarter of 2020.
38.036.6
35.438.1
35.6
17.4
20.8 19.9
27.8
0
5
10
15
20
25
30
35
40
45
Q1 Q2 Q3 Q4 Q1 Q2 Q3 Q4 Q1
2019 2020 2021
BN
D M
illio
n
(98.3)
(120)
(100)
(80)
(60)
(40)
(20)
0
20
40
0
20,000
40,000
60,000
80,000
100,000
Q1 Q2 Q3 Q4 Q1 Q2 Q3 Q4 Q1
2019 2020 2021
%
Pers
on
Air Arrivals Total Growth y-o-y (RHS)
(97.7)
0
500,000
1,000,000
1,500,000
2,000,000
2,500,000
Q1 Q2 Q3 Q4 Q1 Q2 Q3 Q4 Q1
2019 2020 2021
(150)
(100)
(50)
0
50
Pers
on
%
By Sea By Air
By Land Total Growth y-o-y (RHS)
37.4
32.7 32.7
42.4
36.7
20.2
32.9
36.734.0
0
5
10
15
20
25
30
35
40
45
50
Q1 Q2 Q3 Q4 Q1 Q2 Q3 Q4 Q1
2019 2020 2021
%

12 | P a g e
Q1 2021 BRUNEI KEY ECONOMIC DEVELOPMENTS Prepared by:
Department of Planning,
Department of Economic Planning and Statistics
Exhibit 21 : ICT Sector GDP at Current Prices
(Q1 2019 – Q1 2021)
Source: Department of Economic Planning & Statistics
The improvement in the ICT Sector in Q1 2021 came
despite declines in both the number of internet (fixed
and mobile broadband) subscriptions (by 8.7 per cent
y-o-y) and mobile subscriptions (by 5.0 per cent y-o-y).
Exhibit 22 : Internet and Mobile Subscriptions
(Q1 2019 – Q1 2021)
Source: Authority for Info-Communications Technology
Industry (AITI)
*Internet subscriptions only include fixed and mobile broadband
subscriptions.
In other developments, as part of Brunei’s ‘Smart
Nation’ initiatives, Unified National Networks (UNN)
partnered with Germany’s leading internet exchange
operator DE-CIX to launch Brunei's first internet
exchange platform. The new platform will provide
domestic and regional network operators with faster
connectivity, improved user experience and access to
worldwide Internet hubs in Asia, Europe, and America.
It also enables global networks to get closer to users in
8 Brunei launches first internet exchange point (February 09, 2021). The Scoop.
Southeast Asia and acts as a new gateway between the
US and the region. With Borneo-IX as part of the global
Internet exchange network, Brunei will be a new prime
location for digital business. This will create new
opportunities for local businesses to collaborate and
expand internationally, while attracting foreign
organisations to consider Brunei for business and
investments8.
Services In the first quarter of 2021, the Services Sector,
comprising activities of Wholesale & Retail Trade,
Business Services and Transport & Logistics
contributed about BND509.5 million to Gross Value
Added, increasing from the BND449.5 million recorded
in the same quarter of 2020.
Exhibit 23 : Services Sector GDP at Current Prices
(Q1 2019 – Q1 2021)
Source: Department of Economic Planning & Statistics
In particular, improvements in Wholesale & Retail
Trade was supported by the increase in retail sales by
11.9 per cent y-o-y. As such, the impact of travel
restrictions abroad amid the ongoing pandemic was
reflected in the increase of domestic sales of all retail
activities, among the highest included Department
Store; Textiles, Wearing Apparel and Footwear; and
Electrical Household Appliances and Lighting
Equipment in specialised stores.
100.2 98.2
110.2
53.8
115.1 117.1
128.7
66.7
125.7
0
20
40
60
80
100
120
140
Q1 Q2 Q3 Q4 Q1 Q2 Q3 Q4 Q1
2019 2020 2021
BN
D M
illio
n
0
100,000
200,000
300,000
400,000
500,000
600,000
700,000
800,000
Q1 Q2 Q3 Q4 Q1 Q2 Q3 Q4 Q1
2019 2020 2021
Su
bsc
rib
ers
Internet* Mobile
422.9
372.6 368.4384.9
449.5
392.0 392.4 385.8
509.5
0
100
200
300
400
500
600
700
Q1 Q2 Q3 Q4 Q1 Q2 Q3 Q4 Q1
2019 2020 2021
BN
D M
illio
n

13 | P a g e
Q1 2021 BRUNEI KEY ECONOMIC DEVELOPMENTS Prepared by:
Department of Planning,
Department of Economic Planning and Statistics
Table 9 : Value of Sales and Growth Rate by
Activity (Q1 2021)
Q1
2021
Index
(2017
= 100)
Value of
Sales
(BND
Million)
Growth
y-o-y
(%)
Department Store 125.3 137.7 12.6
Supermarket 111.4 61.1 (11.1)
Mini Mart 85.3 10.2 (3.1)
Food and Beverages in Specialised Stores
100.3 6.2 (2.7)
Petrol Station 118.5 43.2 3.4
Computer & Telecommunications Equipment
115.9 26.0 6.1
Textiles, Wearing Apparel & Footwear
137.1 21.0 52.0
Hardware, Paints and Glass in Specialised Stores
93.2 31.0 24.7
Furniture & Household Equipment
102.6 14.4 6.0
Electrical Household Appliances and Lighting Equipment in Specialised Stores
134.5 34.7 22.6
Books, Newspapers and Stationery in Specialised Stores
105.9 7.0 27.8
Recreational Goods 144.0 9.5 34.5
Pharmaceutical and Medical Goods, Cosmetic and Toilet Articles in Specialized Stores
105.0 11.3 25.4
Watches & Jewellery 144.4 16.5 62.2
Others 129.8 23.9 20.8
Total 118.3 454.4 11.9
Source: Department of Economic Planning and Statistics
Meanwhile, in Transport & Logistics, sea freight
activities continued to be undermined by cross-border
movement restrictions, down by 6.0 per cent y-o-y in
Q1 2021.
Exhibit 24 : Sea Freight Activity (Q1 2019 – Q1 2021)
Source: Maritime and Port Authority Brunei Darussalam
In terms of freight by transport medium in Q1 2021, the
main type of goods exported via air were mainly re-
exports of machinery parts, particularly aviation parts
as well as domestic exports of food products such as
melons and seaweeds. On the other hand, the main
type of goods imported via air were mainly
medicaments, flowers as well as food products,
particularly fruits.
As for sea freight, mineral fuels made up a large share
of the exported goods while main imports through sea
were mainly comprised of mineral fuels, building
materials such as cement and stone-related products
as well as animal feed for poultry.
Meanwhile for land freight, majority were re-exported
goods including machinery parts and building
materials such as iron and steel products. On the other
hand, imports via land were largely comprised of
building materials such as bricks, pebbles and gravels;
animal feed for poultry as well as food products,
particularly fruits.
Table 10 : Main Exports and Imports in
weight/volume by Transport Medium (Q1 2021)
Main Exports Main Imports
Air Machinery parts,
Food Medicaments, Food
Sea Mineral fuels
Mineral fuels,
Building materials,
Animal feed
Land Machinery parts,
Building materials
Building materials,
Animal feed, Food
Source: Department of Economic Planning and Statistics
(14.6)
(20.4)
(0.3)
(15.2)
(29.6)
(45.7)
(20.2)
(52.6)
(6.0)
(60)
(50)
(40)
(30)
(20)
(10)
0
0
100
200
300
400
500
Q1 Q2 Q3 Q4 Q1 Q2 Q3 Q4 Q1
2019 2020 2021
%
Metr
ic T
on
ne
Loaded Discharged
Total Growth y-o-y (RHS)