Embed Size (px)
Citation preview

Q1 2020 Supplementary
SlidesM a y 7 , 2 0 2 0
© 2 0 2 0 S u n P o w e r C o r p o r a t i o n
2
Safe Harbor Statement
© 2020 SunPower Corporation
This presentation contains forward-looking statements within the meaning of the Private Securities Litigation Reform Act of 1995, including, but not limited to, statements regarding: (a) our
strategic goals and plans and our ability to achieve them, and the long-term fundamentals of our business; (b) plans and expectations regarding our areas of technology, services, and product
development focus, including continued investment plans, and the impact thereof; (c) statements regarding the anticipated spin-off of Maxeon Solar, including timing and certainty, the
anticipated achievement of conditions precedent for the transaction and the timing thereof, and Maxeon Solar’s preparation to act as an independent entity on the date of spin; (d) our
expectations regarding the impacts of Covid-19 on our business, our industry, and our markets, including supply and demand impacts, anticipated recovery, and our expected positioning post-
pandemic; (e) anticipated cash savings as the result of our cost-reduction and containment initiatives, including timing, amounts, and expected impacts on our financial performance, liquidity,
and our expected competitive and financial positioning post-recovery; (f) our expectations regarding 2020 financial and operational performance, including anticipated liquidity, supply chain
reliability and inventory optimization; (g) our expectations regarding tax equity and project debt capacity and adequacy for the remainder of the year; (h) expectations regarding our future
performance based on bookings, backlog, and pipelines in our sales channels; (i) the expected financial performance of our business lines, including timing and expectations for returning our
Commercial Direct business to profitability; (j) our plans and expectations for our products and planned products, including anticipated markets and demand, cost impacts, and impacts on our
financial performance and our ability to meet our targets and goals; (k) our expectations regarding our industry, market factors, anticipated including demand and volume; (l) our expectations
regarding resumption of production in certain of our manufacturing facilities; (m) anticipated manufacturing ramps, including Maxeon Solar’s planned ramp of our next generation Maxeon
technology and planned P-Series capacity expansion in our joint venture and anticipated cost reductions in connection therewith; and (m) our second quarter fiscal 2020 guidance, including
GAAP revenue, gross margin, and net loss, as well as non-GAAP revenue, gross margin, Adjusted EBITDA, and MW deployed, and related assumptions. These forward-looking statements are
based on our current assumptions, expectations and beliefs and involve substantial risks and uncertainties that may cause results, performance or achievement to materially differ from those
expressed or implied by these forward-looking statements. Factors that could cause or contribute to such differences include, but are not limited to: (1) These forward-looking statements are
based on our current assumptions, expectations and beliefs and involve substantial risks and uncertainties that may cause results, performance or achievement to materially differ from those
expressed or implied by these forward-looking statements. Factors that could cause or contribute to such differences include, but are not limited to: (1) challenges in executing transactions key
to our strategic plans, including regulatory and other challenges that may arise; (2) potential disruptions to our operations and supply chain that may result from epidemics or natural disasters,
including impacts of the Covid-19 pandemic; (3) the success of our ongoing research and development efforts and our ability to commercialize new products and services, including products
and services developed through strategic partnerships; (4) competition in the solar and general energy industry and downward pressure on selling prices and wholesale energy pricing; (5) our
liquidity, substantial indebtedness, and ability to obtain additional financing for our projects and customers; (6) changes in public policy, including the imposition and applicability of tariffs; (7)
regulatory changes and the availability of economic incentives promoting use of solar energy; (8) fluctuations in our operating results;; (9) appropriately sizing our manufacturing capacity and
containing manufacturing and logistics difficulties that could arise; and (10) challenges managing our acquisitions, joint ventures and partnerships, including our ability to successfully manage
acquired assets and supplier relationships. In addition, the proposed and the associated investment by TZS in Maxeon Solar may not be consummated within the anticipated period or at all and
the ultimate results of any separation depend on a number of factors, including the development of final plans and the impact of local regulatory requirements. A detailed discussion of these
factors and other risks that affect our business is included in filings we make with the Securities and Exchange Commission (SEC) from time to time, including our most recent report on Form 10-
K, particularly under the heading “Risk Factors.” Copies of these filings are available online from the SEC or on the SEC Filings section of our Investor Relations website at
investors.sunpower.com. All forward-looking statements in this press release are based on information currently available to us, and we assume no obligation to update these forward-looking
statements in light of new information or future events.
3© 2020 SunPower Corporation |
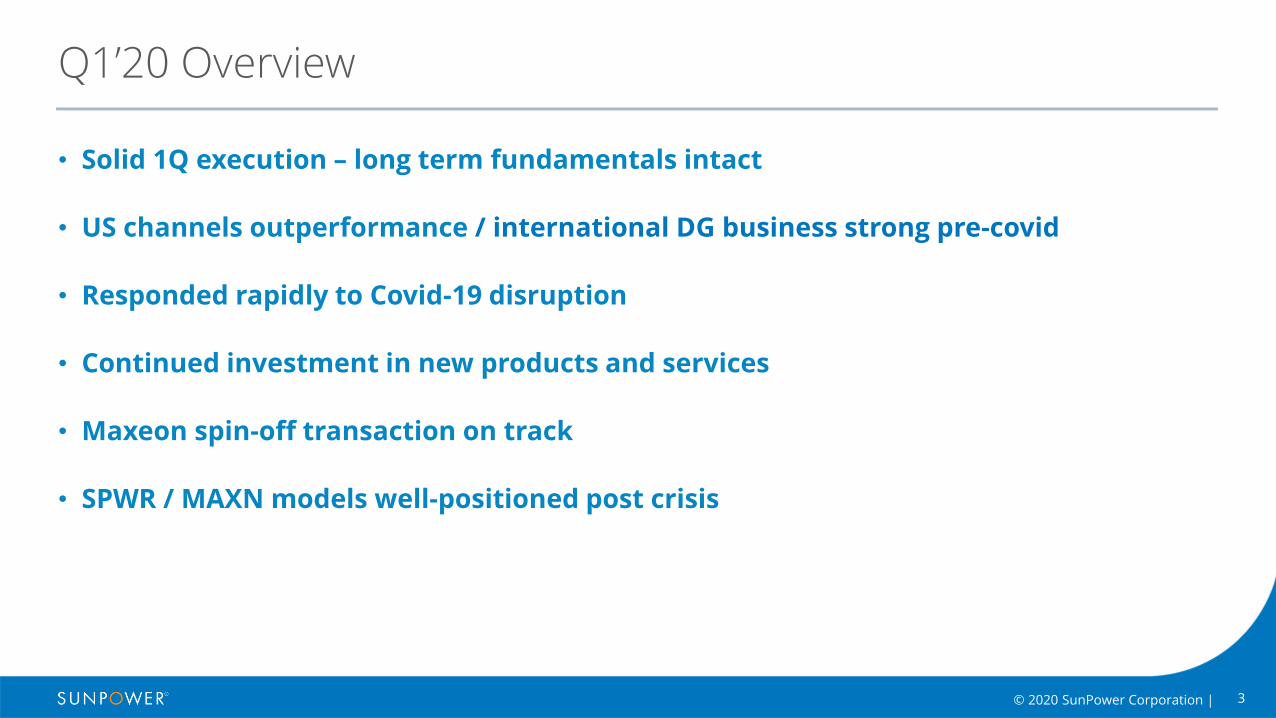
Q1’20 Overview
• Solid 1Q execution – long term fundamentals intact
• US channels outperformance / international DG business strong pre-covid
• Responded rapidly to Covid-19 disruption
• Continued investment in new products and services
• Maxeon spin-off transaction on track
• SPWR / MAXN models well-positioned post crisis
4© 2020 SunPower Corporation |
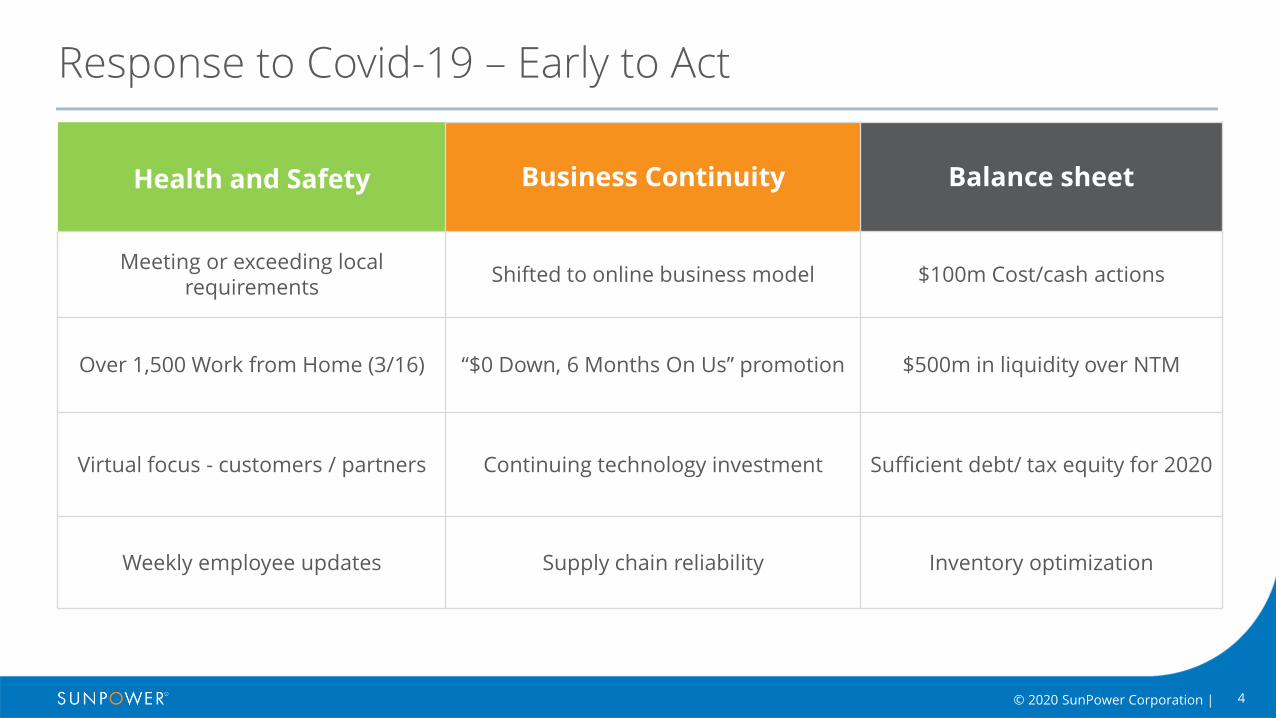
Response to Covid-19 – Early to Act
Health and Safety Business Continuity Balance sheet
Meeting or exceeding local requirements
Shifted to online business model $100m Cost/cash actions
Over 1,500 Work from Home (3/16) “$0 Down, 6 Months On Us” promotion $500m in liquidity over NTM
Virtual focus - customers / partners Continuing technology investment Sufficient debt/ tax equity for 2020
Weekly employee updates Supply chain reliability Inventory optimization
5© 2020 SunPower Corporation |
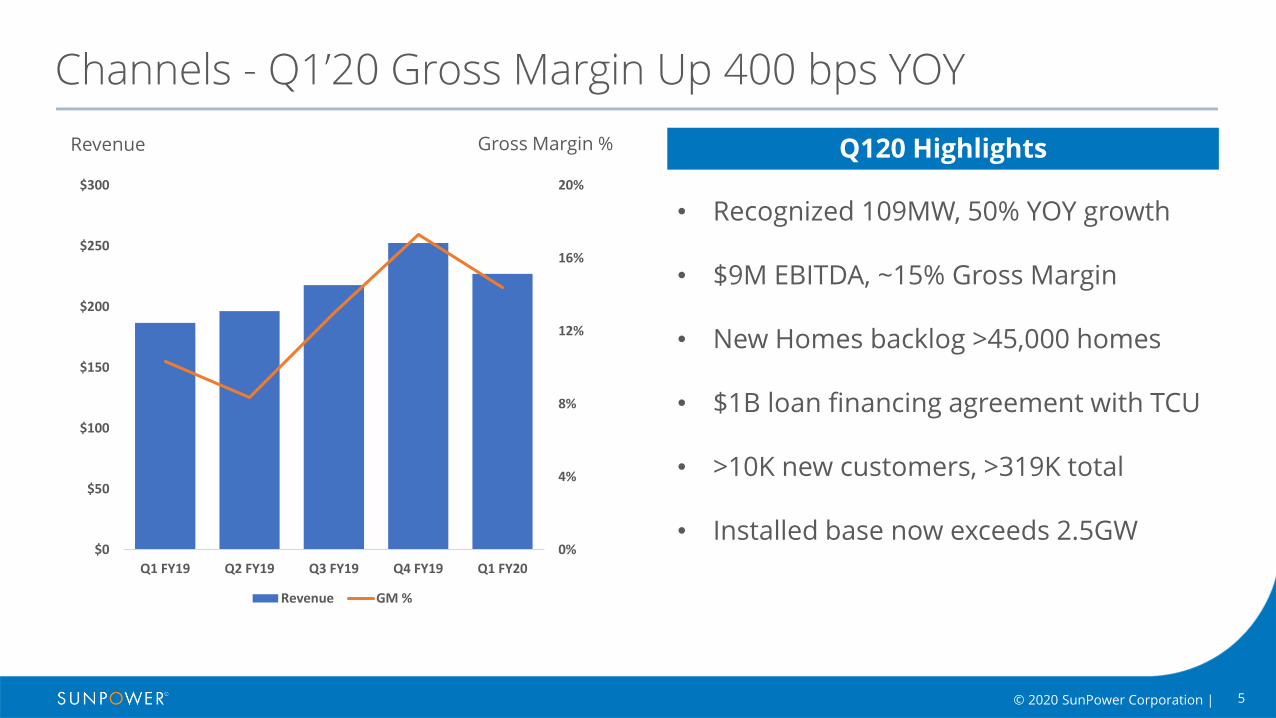
Channels - Q1’20 Gross Margin Up 400 bps YOY
• Recognized 109MW, 50% YOY growth
• $9M EBITDA, ~15% Gross Margin
• New Homes backlog >45,000 homes
• $1B loan financing agreement with TCU
• >10K new customers, >319K total
• Installed base now exceeds 2.5GW
Revenue Gross Margin % Q120 Highlights
0%
4%
8%
12%
16%
20%
$0
$50
$100
$150
$200
$250
$300
Q1 FY19 Q2 FY19 Q3 FY19 Q4 FY19 Q1 FY20
Revenue GM %
6
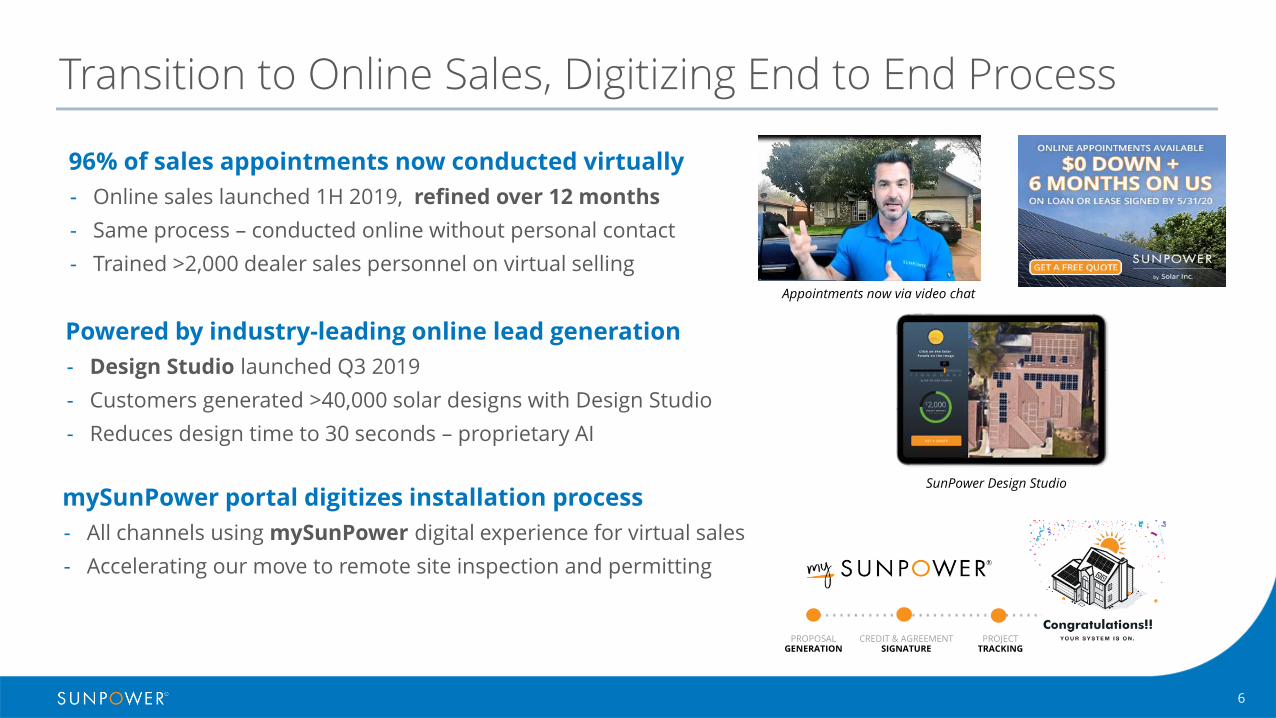
Transition to Online Sales, Digitizing End to End Process
Powered by industry-leading online lead generation
- Design Studio launched Q3 2019
- Customers generated >40,000 solar designs with Design Studio
- Reduces design time to 30 seconds – proprietary AI
96% of sales appointments now conducted virtually
- Online sales launched 1H 2019, refined over 12 months
- Same process – conducted online without personal contact
- Trained >2,000 dealer sales personnel on virtual selling
mySunPower portal digitizes installation process
- All channels using mySunPower digital experience for virtual sales
- Accelerating our move to remote site inspection and permitting
Appointments now via video chat
SunPower Design Studio
PROPOSAL GENERATION
CREDIT & AGREEMENTSIGNATURE
PROJECTTRACKING
7
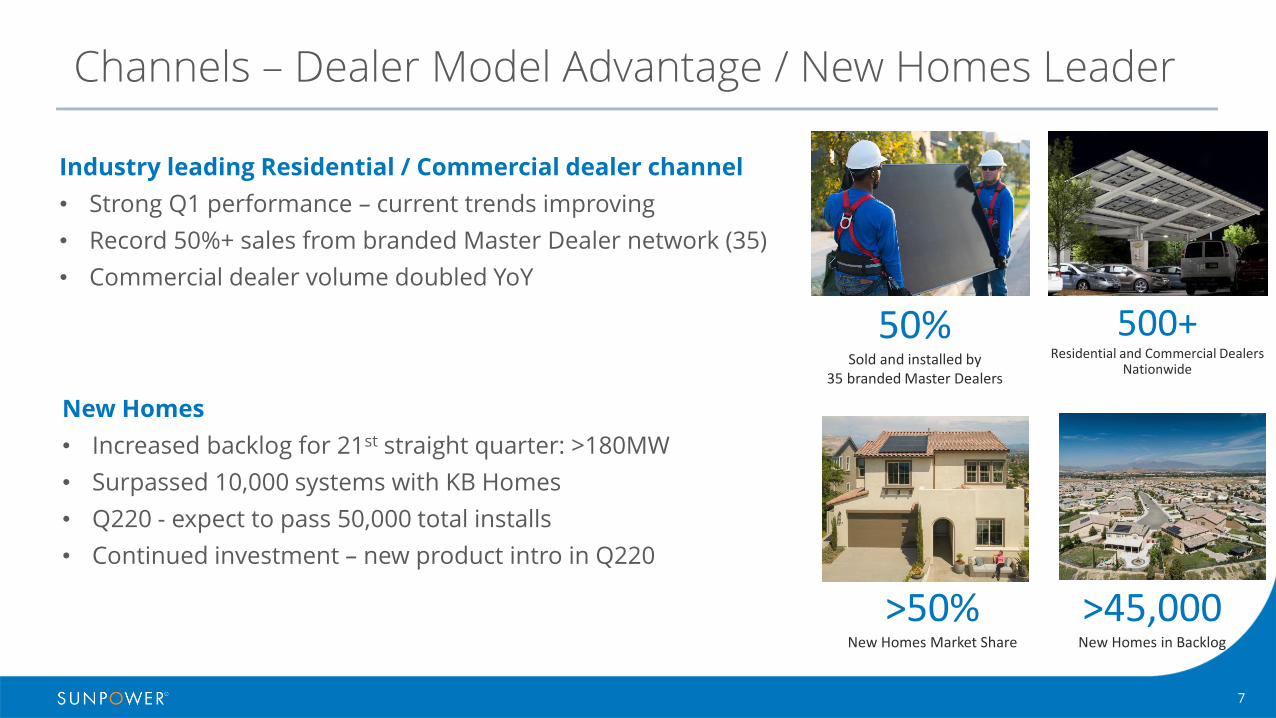
Channels – Dealer Model Advantage / New Homes Leader
>50%New Homes Market Share
>45,000 New Homes in Backlog
New Homes
• Increased backlog for 21st straight quarter: >180MW
• Surpassed 10,000 systems with KB Homes
• Q220 - expect to pass 50,000 total installs
• Continued investment – new product intro in Q220
50%Sold and installed by
35 branded Master Dealers
500+Residential and Commercial Dealers
Nationwide
Industry leading Residential / Commercial dealer channel
• Strong Q1 performance – current trends improving
• Record 50%+ sales from branded Master Dealer network (35)
• Commercial dealer volume doubled YoY
8
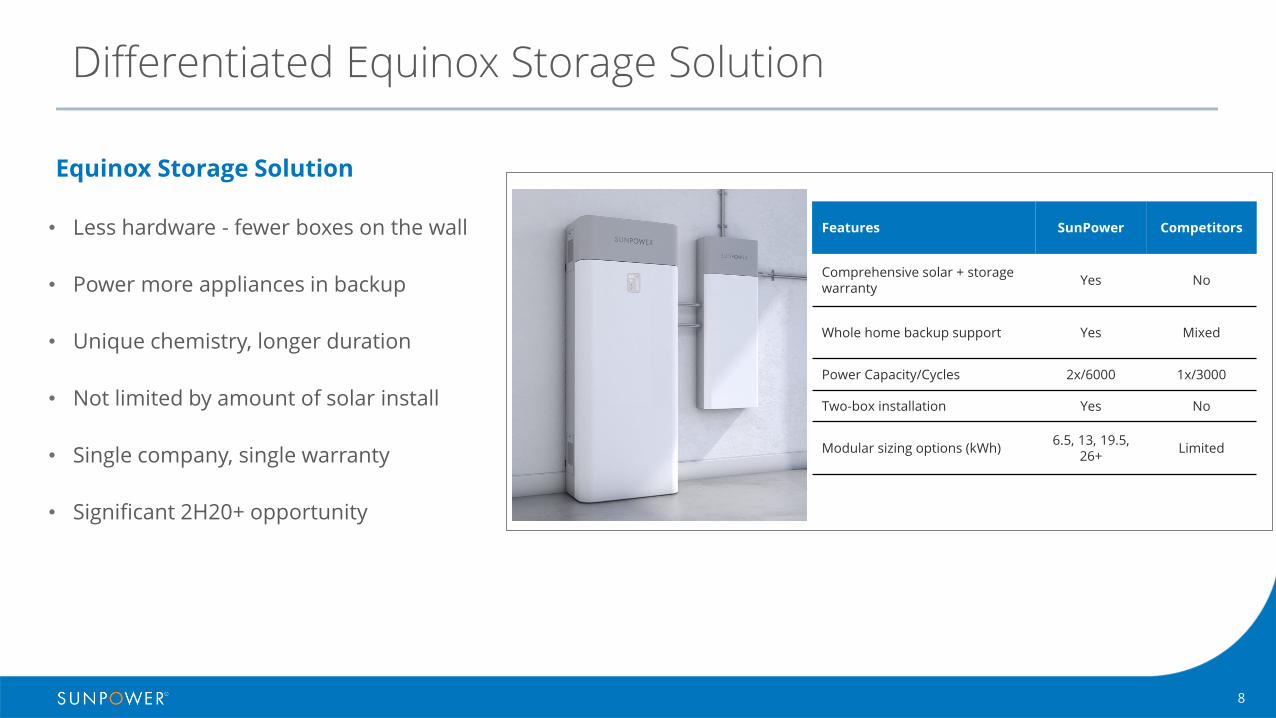
Differentiated Equinox Storage Solution
• Less hardware - fewer boxes on the wall
• Power more appliances in backup
• Unique chemistry, longer duration
• Not limited by amount of solar install
• Single company, single warranty
• Significant 2H20+ opportunity
Features SunPower Competitors
Comprehensive solar + storage warranty
Yes No
Whole home backup support Yes Mixed
Power Capacity/Cycles 2x/6000 1x/3000
Two-box installation Yes No
Modular sizing options (kWh)6.5, 13, 19.5,
26+Limited
Equinox Storage Solution
9© 2020 SunPower Corporation |
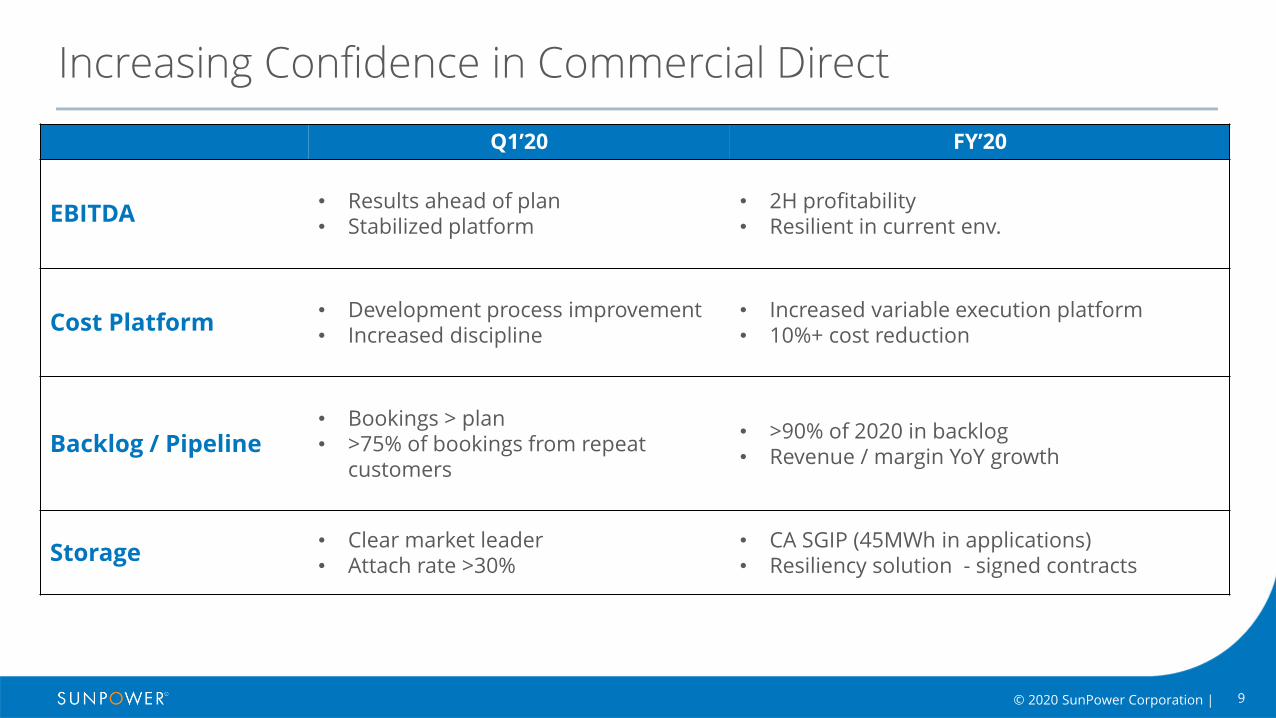
Increasing Confidence in Commercial Direct
Q1’20 FY’20
EBITDA • Results ahead of plan• Stabilized platform
• 2H profitability• Resilient in current env.
Cost Platform• Development process improvement • Increased discipline
• Increased variable execution platform• 10%+ cost reduction
Backlog / Pipeline• Bookings > plan• >75% of bookings from repeat
customers
• >90% of 2020 in backlog• Revenue / margin YoY growth
Storage• Clear market leader• Attach rate >30%
• CA SGIP (45MWh in applications)• Resiliency solution - signed contracts
10© 2020 SunPower Corporation |
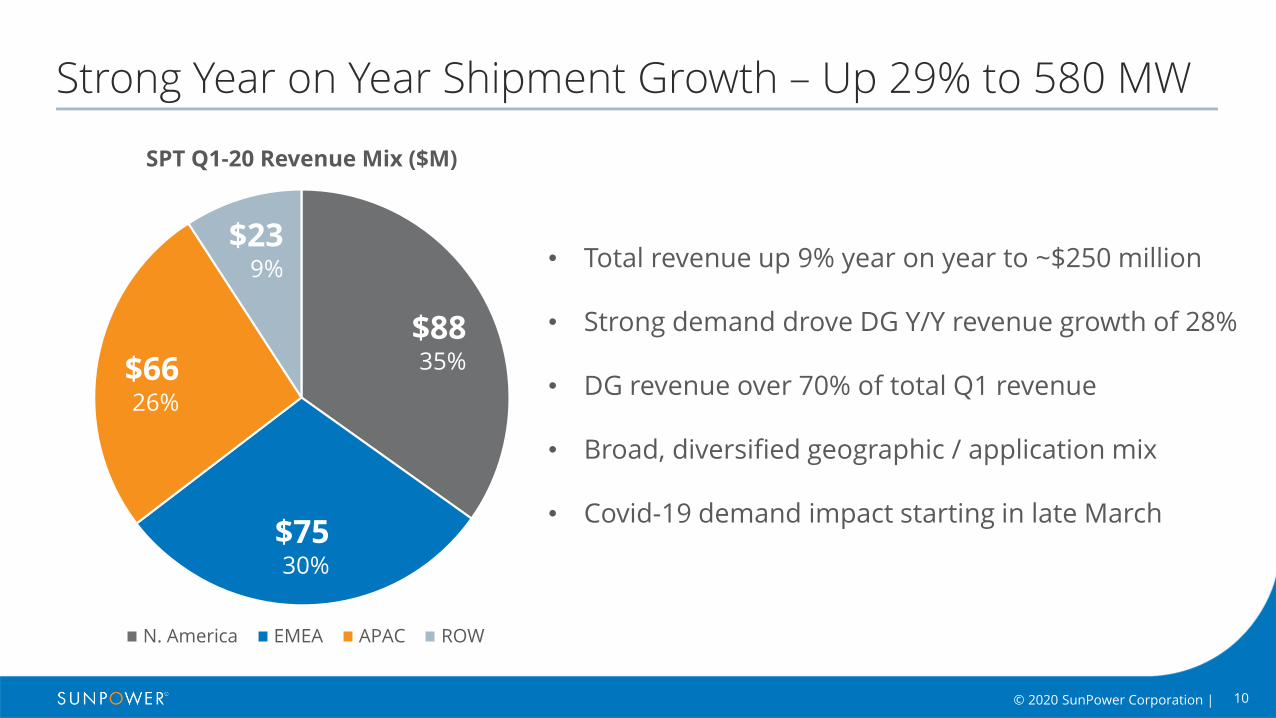
Strong Year on Year Shipment Growth – Up 29% to 580 MW
• Total revenue up 9% year on year to ~$250 million
• Strong demand drove DG Y/Y revenue growth of 28%
• DG revenue over 70% of total Q1 revenue
• Broad, diversified geographic / application mix
• Covid-19 demand impact starting in late March
SPT Q1-20 Revenue Mix ($M)
N. America EMEA APAC ROW
$8835%
$7530%
$6626%
$239%
11Confidential | © 2019 SunPower Corporation | 11
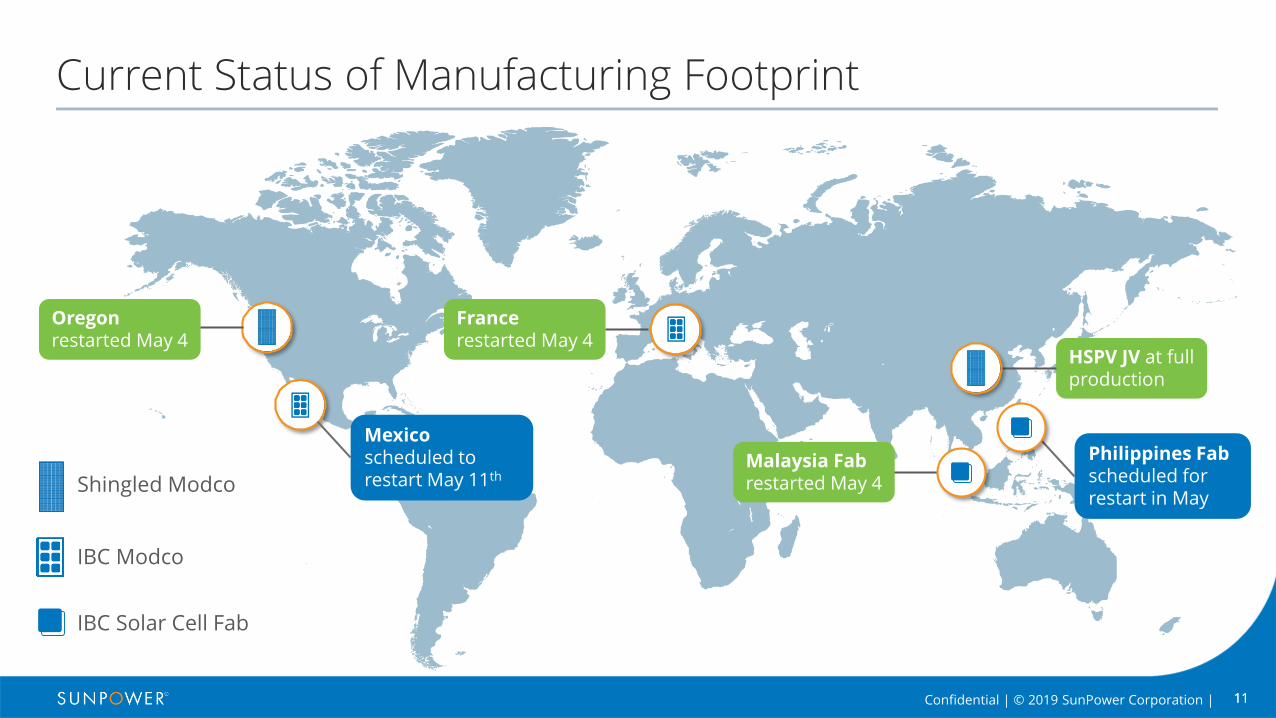
Current Status of Manufacturing Footprint
Shingled Modco
IBC Modco
IBC Solar Cell Fab
Oregonrestarted May 4
Francerestarted May 4
HSPV JV at full production
Malaysia Fab restarted May 4
Mexico scheduled to restart May 11th
Philippines Fab scheduled for restart in May
12© 2020 SunPower Corporation |
-
0.5
1.0
1.5
2.0
2.5
3.0
3.5
4.0
4.5
5.0
2019 2021
Yixing Expansion
Current HSPV
0.0
0.2
0.4
0.6
0.8
1.0
1.2
1.4
1.6
1.8
2.0
2019 2021
Max 5
Max 3
Max 2
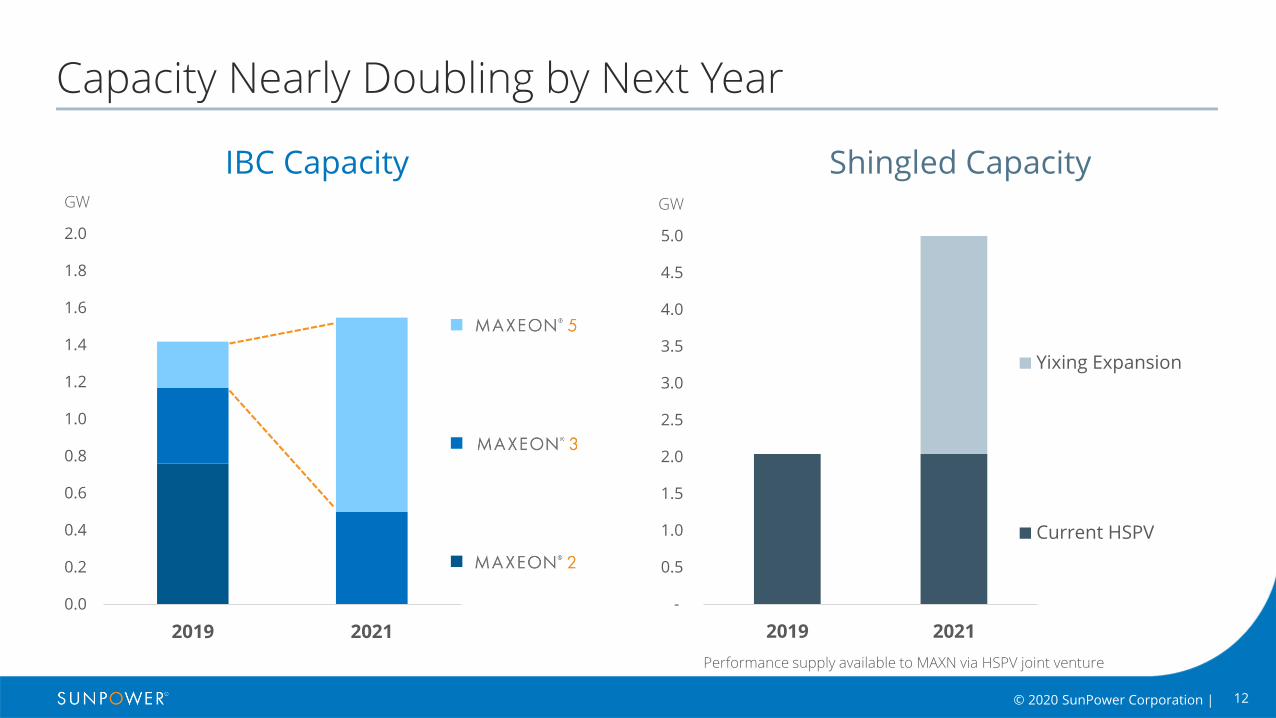
Capacity Nearly Doubling by Next Year
IBC Capacity Shingled CapacityGW GW
Performance supply available to MAXN via HSPV joint venture
13© 2020 SunPower Corporation |
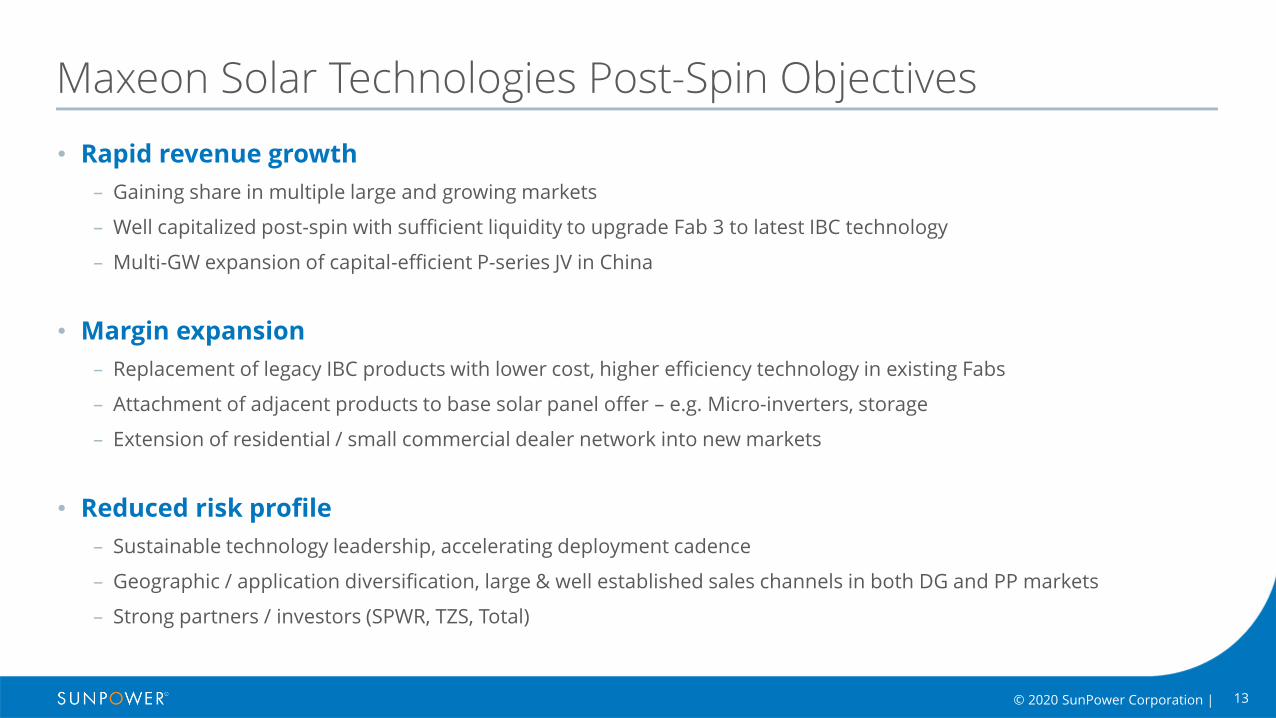
Maxeon Solar Technologies Post-Spin Objectives
• Rapid revenue growth
– Gaining share in multiple large and growing markets
– Well capitalized post-spin with sufficient liquidity to upgrade Fab 3 to latest IBC technology
– Multi-GW expansion of capital-efficient P-series JV in China
• Margin expansion
– Replacement of legacy IBC products with lower cost, higher efficiency technology in existing Fabs
– Attachment of adjacent products to base solar panel offer – e.g. Micro-inverters, storage
– Extension of residential / small commercial dealer network into new markets
• Reduced risk profile
– Sustainable technology leadership, accelerating deployment cadence
– Geographic / application diversification, large & well established sales channels in both DG and PP markets
– Strong partners / investors (SPWR, TZS, Total)
14
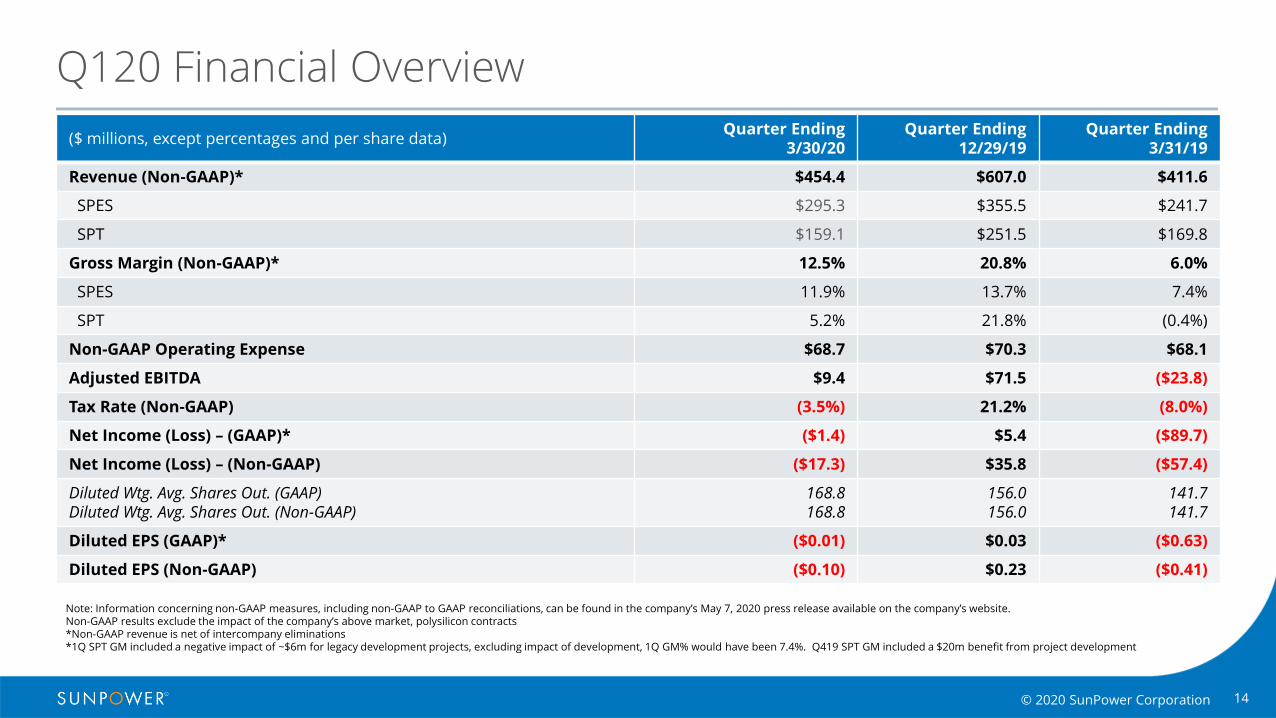
Q120 Financial Overview
($ millions, except percentages and per share data)Quarter Ending
3/30/20Quarter Ending
12/29/19Quarter Ending
3/31/19
Revenue (Non-GAAP)* $454.4 $607.0 $411.6
SPES $295.3 $355.5 $241.7
SPT $159.1 $251.5 $169.8
Gross Margin (Non-GAAP)* 12.5% 20.8% 6.0%
SPES 11.9% 13.7% 7.4%
SPT 5.2% 21.8% (0.4%)
Non-GAAP Operating Expense $68.7 $70.3 $68.1
Adjusted EBITDA $9.4 $71.5 ($23.8)
Tax Rate (Non-GAAP) (3.5%) 21.2% (8.0%)
Net Income (Loss) – (GAAP)* ($1.4) $5.4 ($89.7)
Net Income (Loss) – (Non-GAAP) ($17.3) $35.8 ($57.4)
Diluted Wtg. Avg. Shares Out. (GAAP)Diluted Wtg. Avg. Shares Out. (Non-GAAP)
168.8168.8
156.0156.0
141.7141.7
Diluted EPS (GAAP)* ($0.01) $0.03 ($0.63)
Diluted EPS (Non-GAAP) ($0.10) $0.23 ($0.41)
Note: Information concerning non-GAAP measures, including non-GAAP to GAAP reconciliations, can be found in the company’s May 7, 2020 press release available on the company’s website.Non-GAAP results exclude the impact of the company’s above market, polysilicon contracts*Non-GAAP revenue is net of intercompany eliminations*1Q SPT GM included a negative impact of ~$6m for legacy development projects, excluding impact of development, 1Q GM% would have been 7.4%. Q419 SPT GM included a $20m benefit from project development
© 2020 SunPower Corporation
1515© 2020 SunPower Corporation |
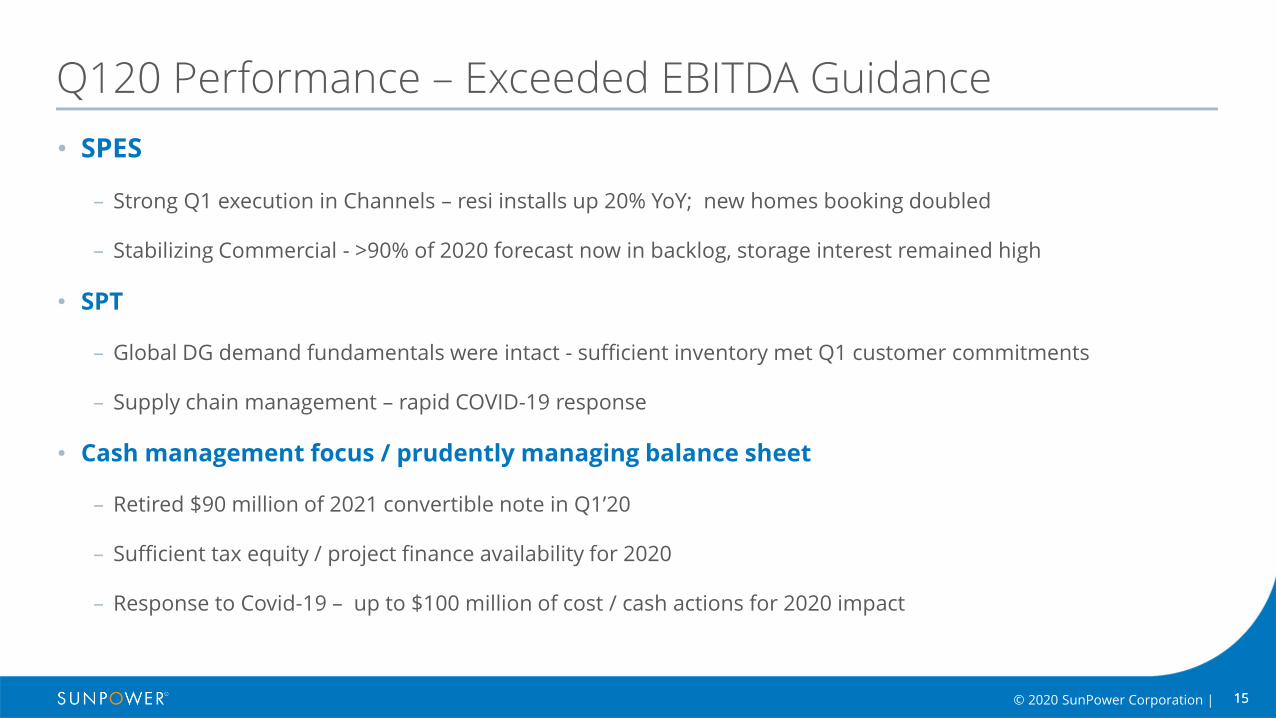
Q120 Performance – Exceeded EBITDA Guidance
• SPES
– Strong Q1 execution in Channels – resi installs up 20% YoY; new homes booking doubled
– Stabilizing Commercial - >90% of 2020 forecast now in backlog, storage interest remained high
• SPT
– Global DG demand fundamentals were intact - sufficient inventory met Q1 customer commitments
– Supply chain management – rapid COVID-19 response
• Cash management focus / prudently managing balance sheet
– Retired $90 million of 2021 convertible note in Q1’20
– Sufficient tax equity / project finance availability for 2020
– Response to Covid-19 – up to $100 million of cost / cash actions for 2020 impact
16© 2020 SunPower Corporation | 16
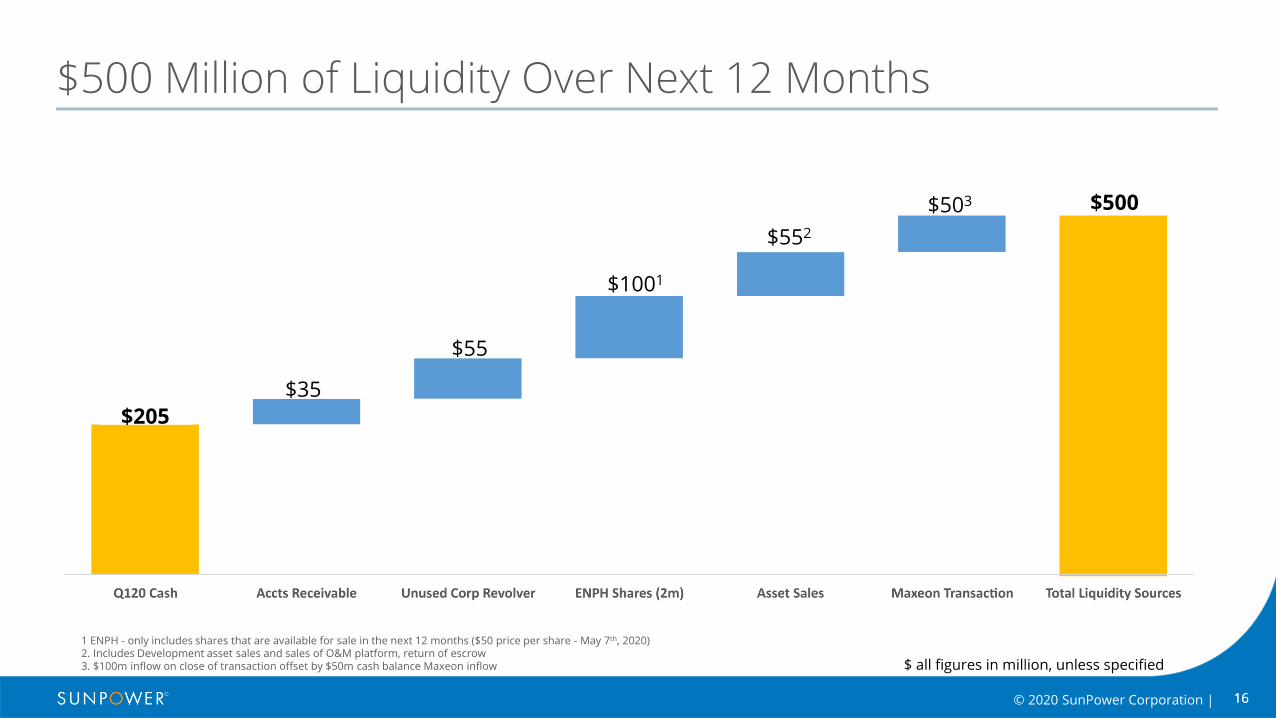
$500 Million of Liquidity Over Next 12 Months
1 ENPH - only includes shares that are available for sale in the next 12 months ($50 price per share - May 7th, 2020)2. Includes Development asset sales and sales of O&M platform, return of escrow 3. $100m inflow on close of transaction offset by $50m cash balance Maxeon inflow
$205
$35
$55
$1001
$552
$503 $500
1717© 2020 SunPower Corporation |
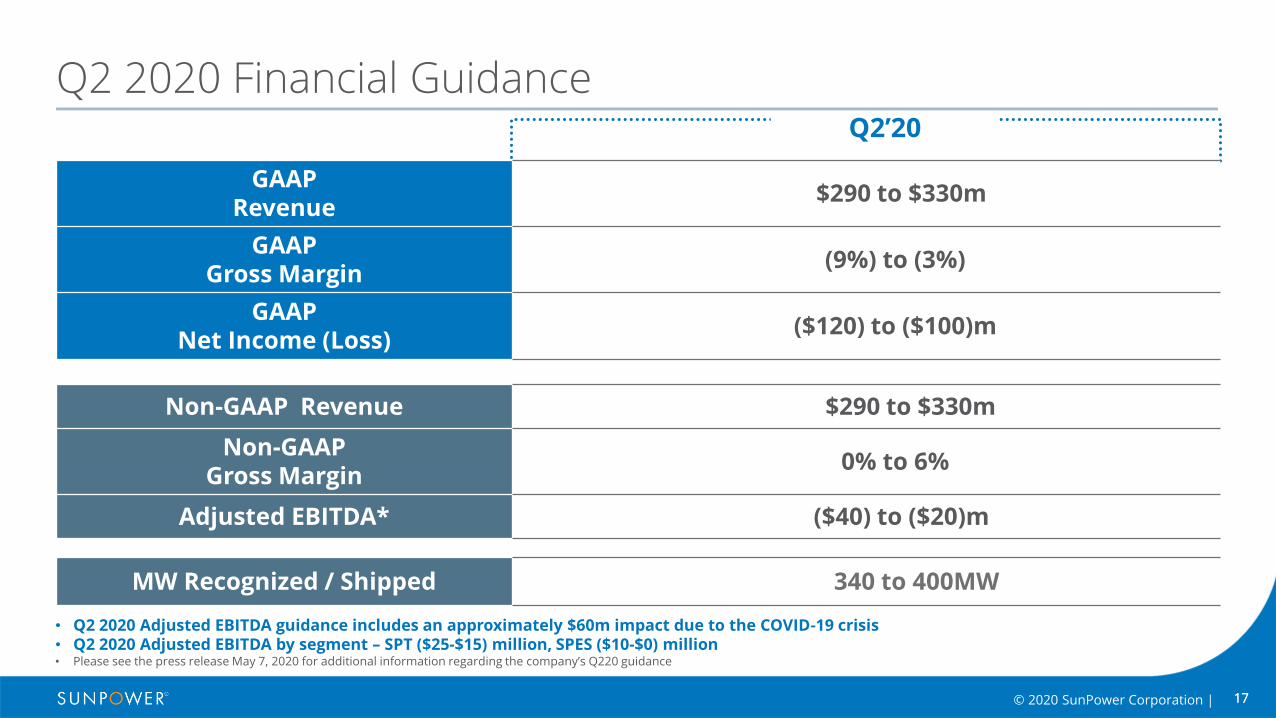
Q2 2020 Financial Guidance Q2’20
GAAP Revenue
$290 to $330m
GAAP Gross Margin
(9%) to (3%)
GAAP Net Income (Loss)
($120) to ($100)m
Non-GAAP Revenue $290 to $330m
Non-GAAP Gross Margin
0% to 6%
Adjusted EBITDA* ($40) to ($20)m
MW Recognized / Shipped 340 to 400MW
• Q2 2020 Adjusted EBITDA guidance includes an approximately $60m impact due to the COVID-19 crisis• Q2 2020 Adjusted EBITDA by segment – SPT ($25-$15) million, SPES ($10-$0) million• Please see the press release May 7, 2020 for additional information regarding the company’s Q220 guidance
18© 2020 SunPower Corporation
First Quarter 2020 Supplementary Slides
Appendix
May 7, 2020
1919© 2020 SunPower Corporation |
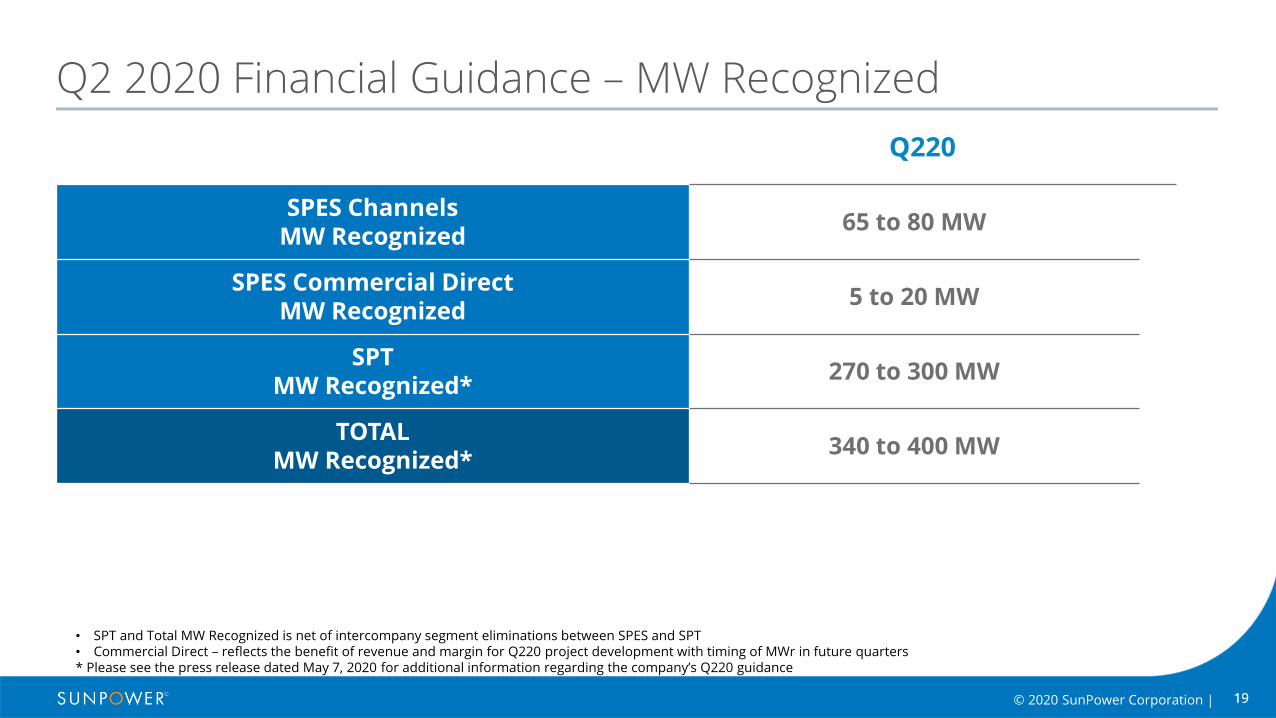
Q2 2020 Financial Guidance – MW Recognized
SPES ChannelsMW Recognized
65 to 80 MW
SPES Commercial DirectMW Recognized
5 to 20 MW
SPTMW Recognized*
270 to 300 MW
TOTALMW Recognized*
340 to 400 MW
Q220
• SPT and Total MW Recognized is net of intercompany segment eliminations between SPES and SPT• Commercial Direct – reflects the benefit of revenue and margin for Q220 project development with timing of MWr in future quarters* Please see the press release dated May 7, 2020 for additional information regarding the company’s Q220 guidance
20
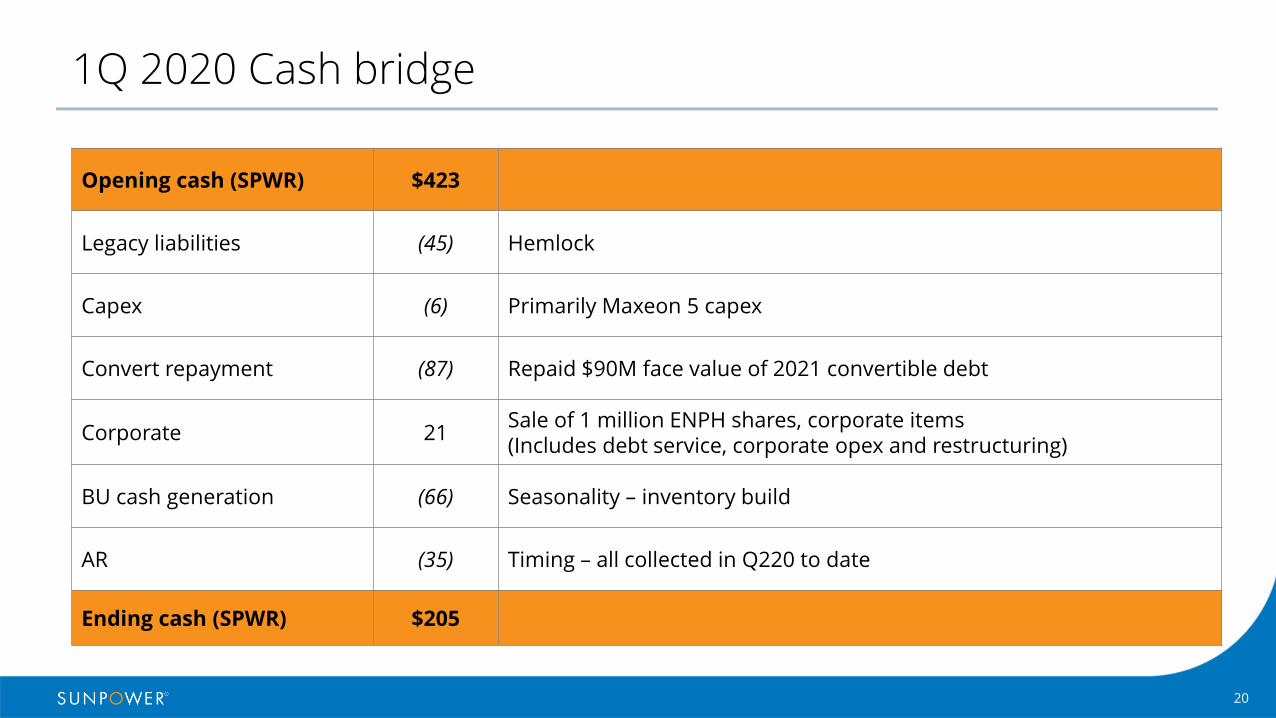
1Q 2020 Cash bridge
Opening cash (SPWR) $423
Legacy liabilities (45) Hemlock
Capex (6) Primarily Maxeon 5 capex
Convert repayment (87) Repaid $90M face value of 2021 convertible debt
Corporate 21Sale of 1 million ENPH shares, corporate items(Includes debt service, corporate opex and restructuring)
BU cash generation (66) Seasonality – inventory build
AR (35) Timing – all collected in Q220 to date
Ending cash (SPWR) $205
21
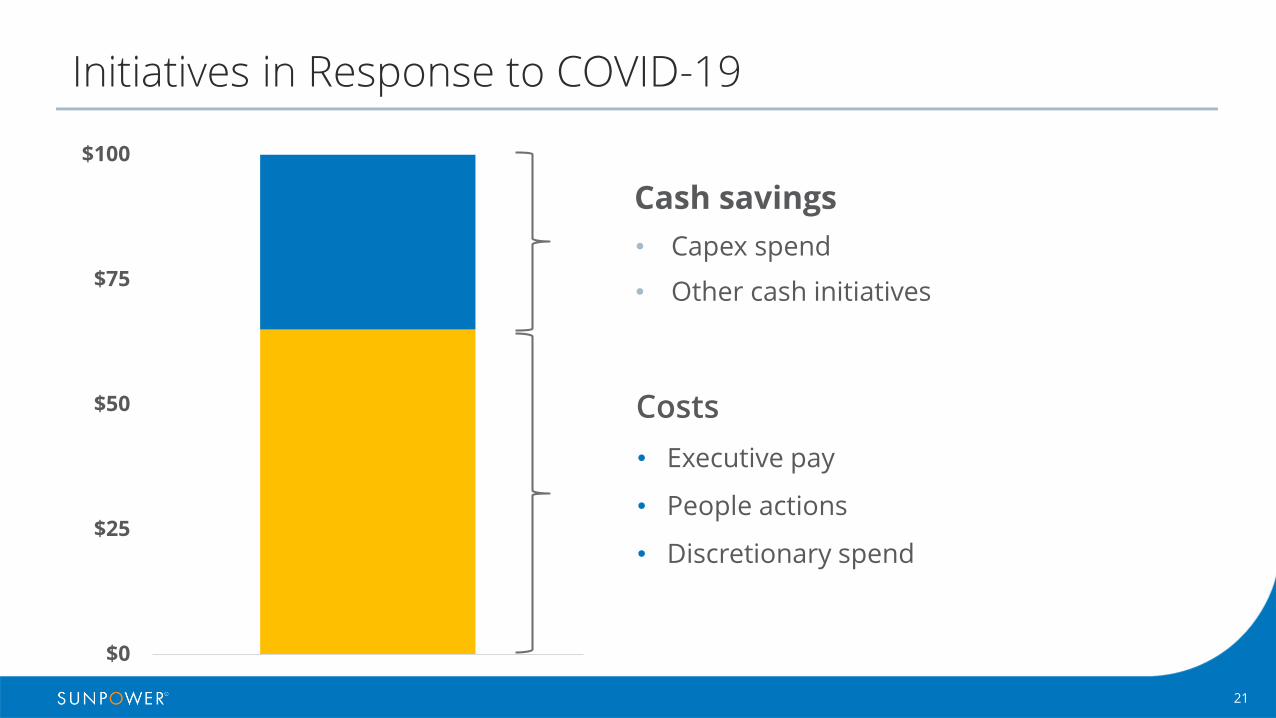
Initiatives in Response to COVID-19
Cash savings
• Capex spend
• Other cash initiatives
$0
$25
$50
$75
$100
Costs
• Executive pay
• People actions
• Discretionary spend
22© 2020 SunPower Corporation |
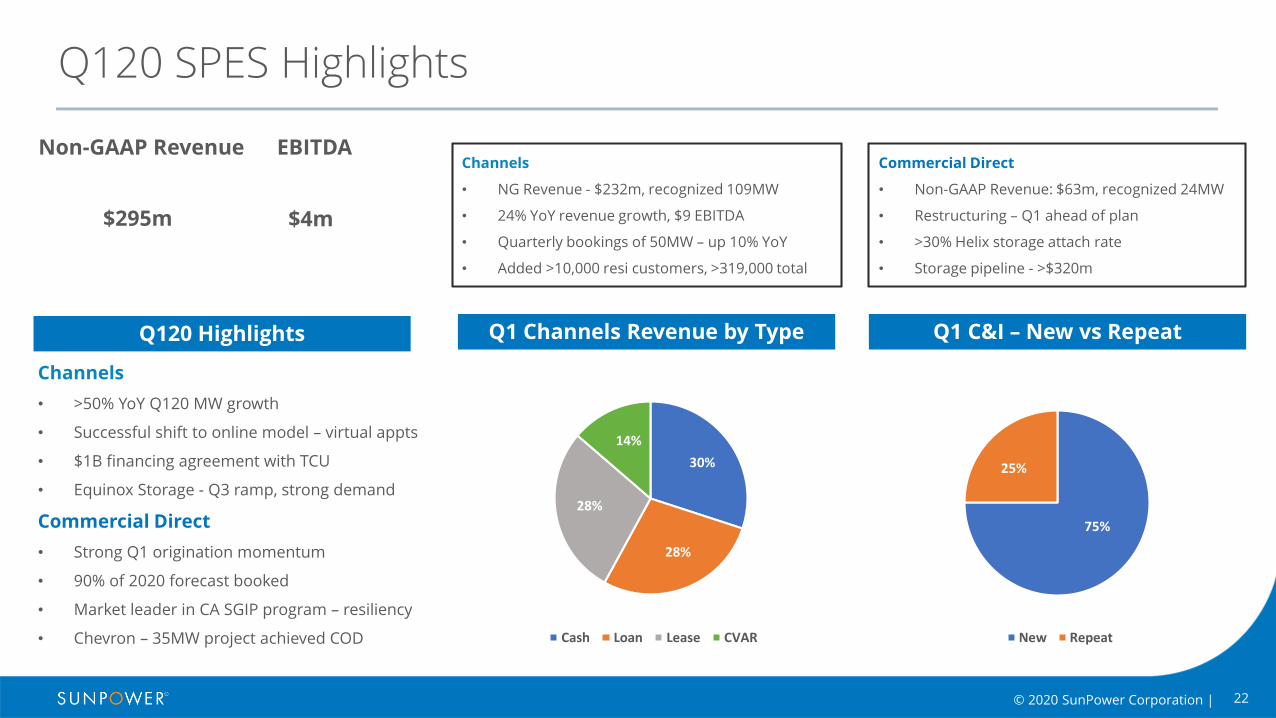
$4m
Q120 SPES Highlights
Channels
• NG Revenue - $232m, recognized 109MW
• 24% YoY revenue growth, $9 EBITDA
• Quarterly bookings of 50MW – up 10% YoY
• Added >10,000 resi customers, >319,000 total
Non-GAAP Revenue
$295m
EBITDA
Q120 Highlights
Channels
• >50% YoY Q120 MW growth
• Successful shift to online model – virtual appts
• $1B financing agreement with TCU
• Equinox Storage - Q3 ramp, strong demand
Commercial Direct
• Strong Q1 origination momentum
• 90% of 2020 forecast booked
• Market leader in CA SGIP program – resiliency
• Chevron – 35MW project achieved COD
Commercial Direct
• Non-GAAP Revenue: $63m, recognized 24MW
• Restructuring – Q1 ahead of plan
• >30% Helix storage attach rate
• Storage pipeline - >$320m
Q1 Channels Revenue by Type Q1 C&I – New vs Repeat
30%
28%
28%
14%
Cash Loan Lease CVAR
75%
25%
New Repeat
23© 2020 SunPower Corporation |
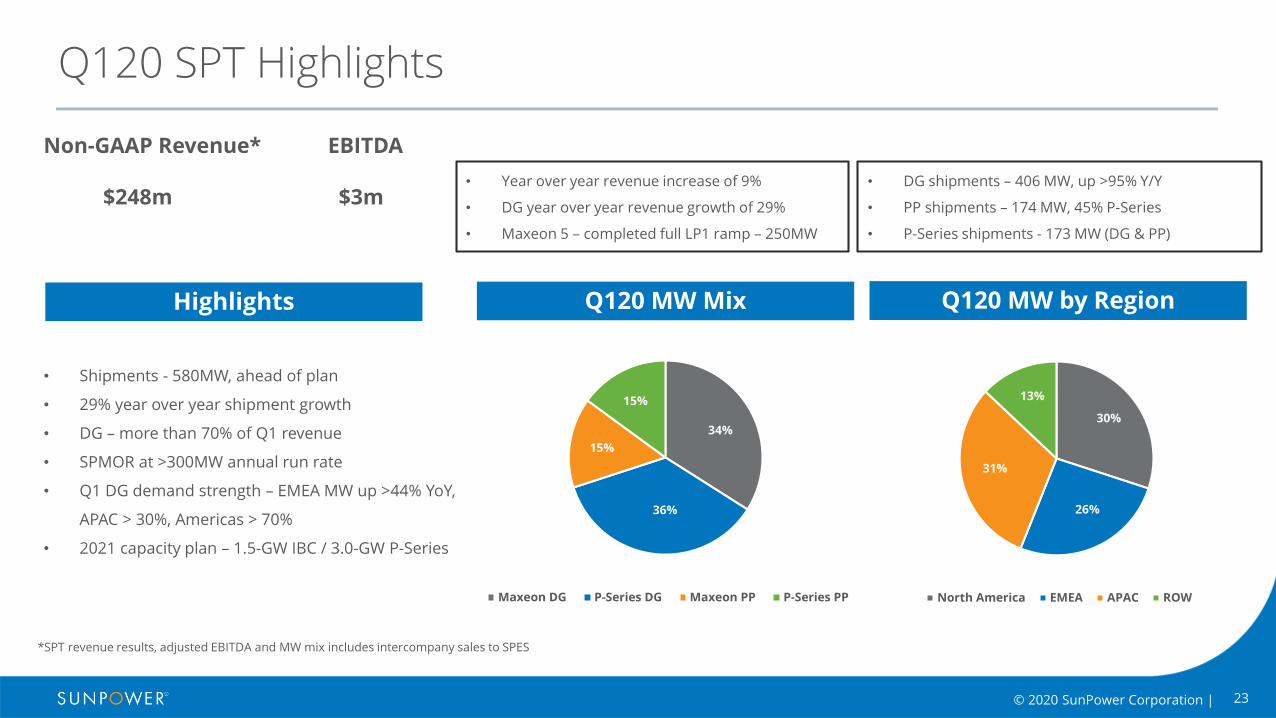
Q120 SPT Highlights
• Shipments - 580MW, ahead of plan
• 29% year over year shipment growth
• DG – more than 70% of Q1 revenue
• SPMOR at >300MW annual run rate
• Q1 DG demand strength – EMEA MW up >44% YoY,
APAC > 30%, Americas > 70%
• 2021 capacity plan – 1.5-GW IBC / 3.0-GW P-Series
Non-GAAP Revenue*
$248m
EBITDA
$3m
Highlights
• Year over year revenue increase of 9%
• DG year over year revenue growth of 29%
• Maxeon 5 – completed full LP1 ramp – 250MW
• DG shipments – 406 MW, up >95% Y/Y
• PP shipments – 174 MW, 45% P-Series
• P-Series shipments - 173 MW (DG & PP)
*SPT revenue results, adjusted EBITDA and MW mix includes intercompany sales to SPES
Q120 MW Mix Q120 MW by Region
30%
26%
31%
13%
North America EMEA APAC ROW
34%
36%
15%
15%
Maxeon DG P-Series DG Maxeon PP P-Series PP
24© 2020 SunPower Corporation |
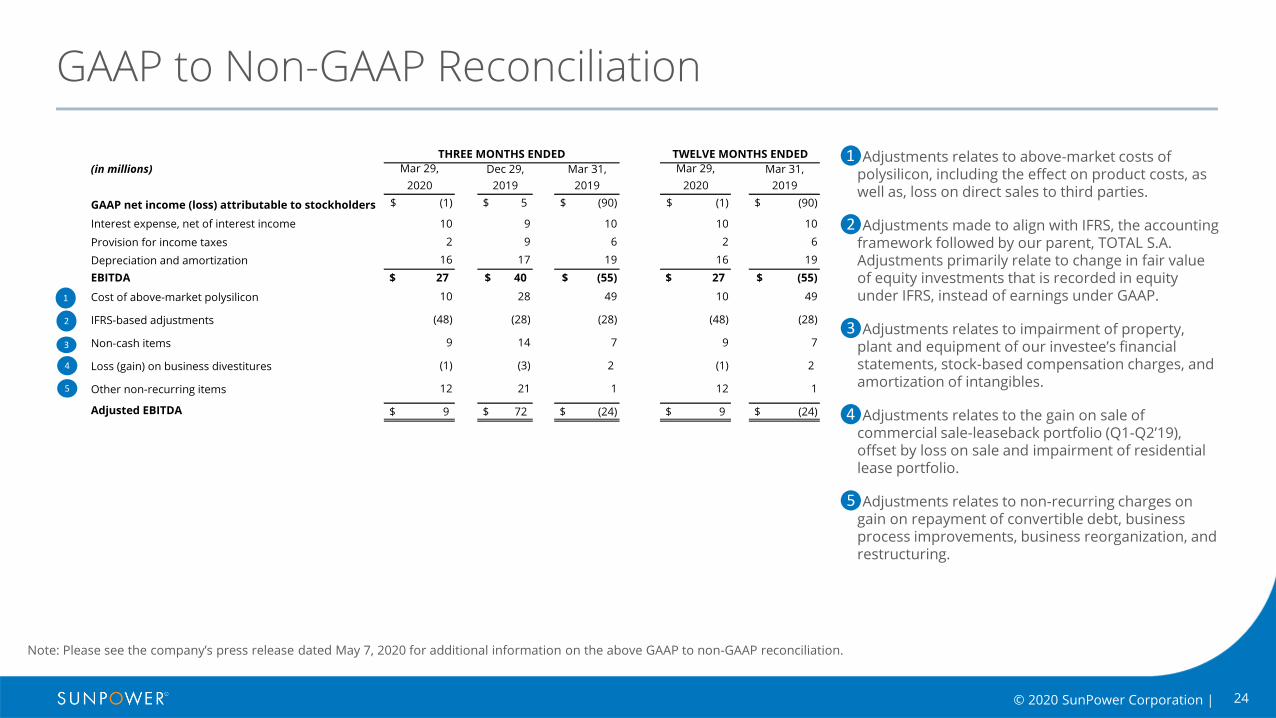
GAAP to Non-GAAP Reconciliation
Note: Please see the company’s press release dated May 7, 2020 for additional information on the above GAAP to non-GAAP reconciliation.
❶Adjustments relates to above-market costs of polysilicon, including the effect on product costs, as well as, loss on direct sales to third parties.
❷Adjustments made to align with IFRS, the accounting framework followed by our parent, TOTAL S.A. Adjustments primarily relate to change in fair value of equity investments that is recorded in equity under IFRS, instead of earnings under GAAP.
❸Adjustments relates to impairment of property, plant and equipment of our investee’s financial statements, stock-based compensation charges, and amortization of intangibles.
❹Adjustments relates to the gain on sale of commercial sale-leaseback portfolio (Q1-Q2’19), offset by loss on sale and impairment of residential lease portfolio.
❺Adjustments relates to non-recurring charges on gain on repayment of convertible debt, business process improvements, business reorganization, and restructuring.
(in millions) Mar 29, Dec 29, Mar 31, Mar 29, Mar 31,
2020 2019 2019 2020 2019
GAAP net income (loss) attributable to stockholders (1)$ 5$ (90)$ (1)$ (90)$
Interest expense, net of interest income 10 9 10 10 10
Provision for income taxes 2 9 6 2 6
Depreciation and amortization 16 17 19 16 19
EBITDA 27$ 40$ (55)$ 27$ (55)$
Cost of above-market polysilicon 10 28 49 10 49
IFRS-based adjustments (48) (28) (28) (48) (28)
Non-cash items 9 14 7 9 7
Loss (gain) on business divestitures (1) (3) 2 (1) 2
Other non-recurring items 12 21 1 12 1
Adjusted EBITDA 9$ 72$ (24)$ 9$ (24)$
TWELVE MONTHS ENDEDTHREE MONTHS ENDED
1
2
3
4
5
Q1 2020 Supplementary
SlidesM a y 7 , 2 0 2 0
© 2 0 2 0 S u n P o w e r C o r p o r a t i o n