Embed Size (px)
Citation preview
Q1 2019May 14, 2019 | Ströer SE & Co. KGaA
INDEX
01Strategic Reassurance
02Business Update
03Financial Status
04Outlook
2
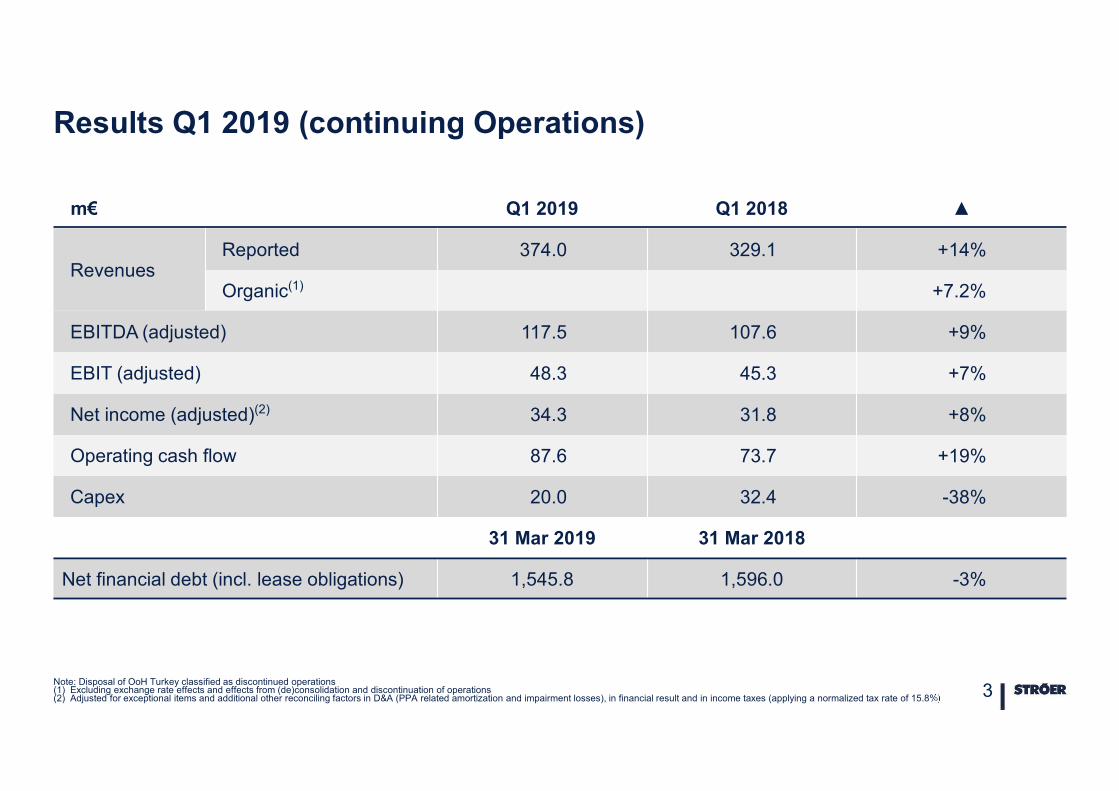
m€ Q1 2019 Q1 2018 ▲
RevenuesReported 374.0 329.1 +14%
Organic(1) +7.2%
EBITDA (adjusted) 117.5 107.6 +9%
EBIT (adjusted) 48.3 45.3 +7%
Net income (adjusted)(2) 34.3 31.8 +8%
Operating cash flow 87.6 73.7 +19%
Capex 20.0 32.4 -38%
31 Mar 2019 31 Mar 2018
Net financial debt (incl. lease obligations) 1,545.8 1,596.0 -3%
Results Q1 2019 (continuing Operations)
Note: Disposal of OoH Turkey classified as discontinued operations(1) Excluding exchange rate effects and effects from (de)consolidation and discontinuation of operations(2) Adjusted for exceptional items and additional other reconciling factors in D&A (PPA related amortization and impairment losses), in financial result and in income taxes (applying a normalized tax rate of 15.8%) 3

4
0%
2%
4%
6%
8%
10%
12%
14%
16%
18%
Q12013
Q22013
Q32013
Q42013
Q12014
Q22014
Q32014
Q42014
Q12015
Q22015
Q32015
Q42015
Q12016
Q22016
Q32016
Q42016
Q12017
Q22017
Q32017
Q42017
Q12018
Q22018
Q32018
Q42018
Q12019
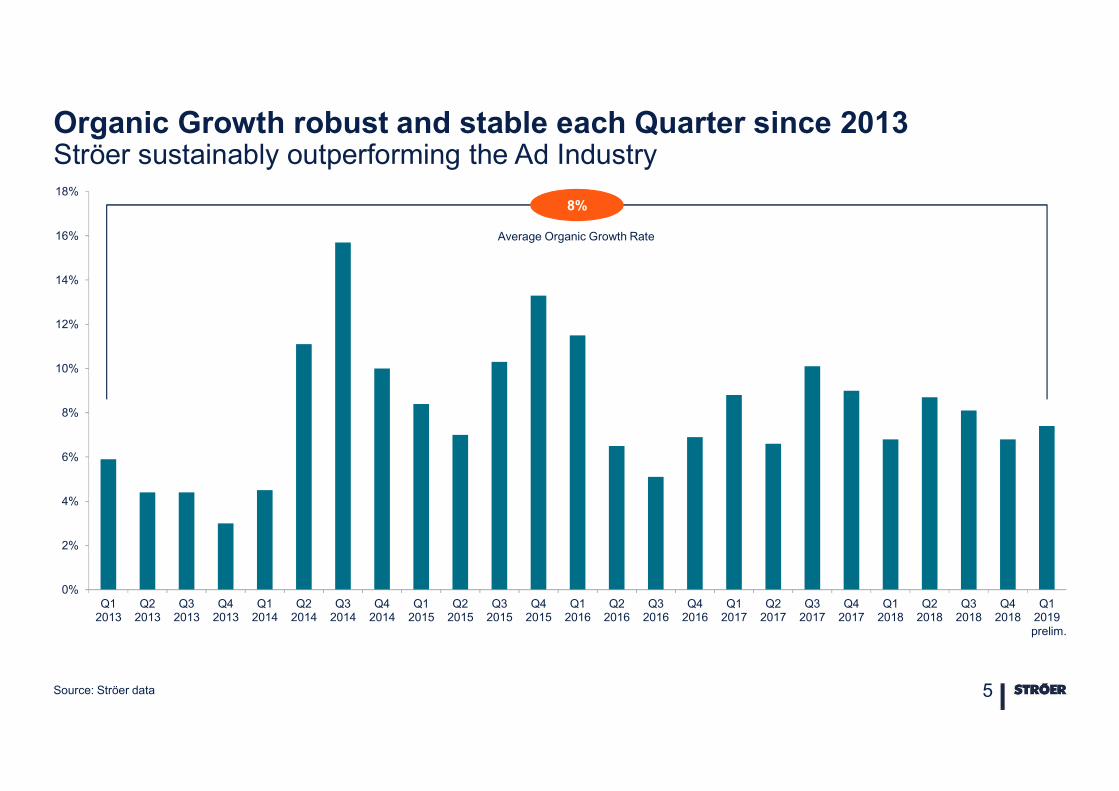
Organic Growth robust and stable each Quarter since 2013Ströer sustainably outperforming the Ad Industry
Source: Ströer data 5
prelim.
Average Organic Growth Rate
8%
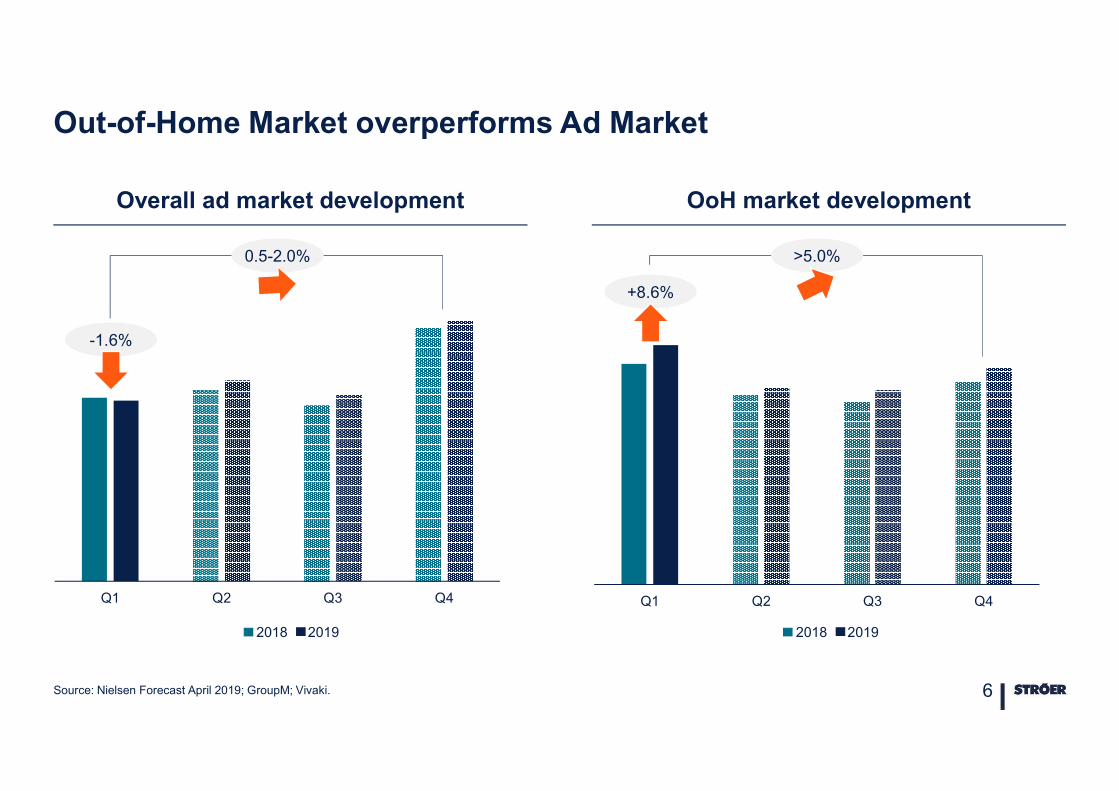
Q1 Q2 Q3 Q4
2018 2019
0.5-2.0%
Out-of-Home Market overperforms Ad Market
Source: Nielsen Forecast April 2019; GroupM; Vivaki. 6
-1.6%
Overall ad market development OoH market development
Q1 Q2 Q3 Q4
2018 2019
>5.0%
+8.6%
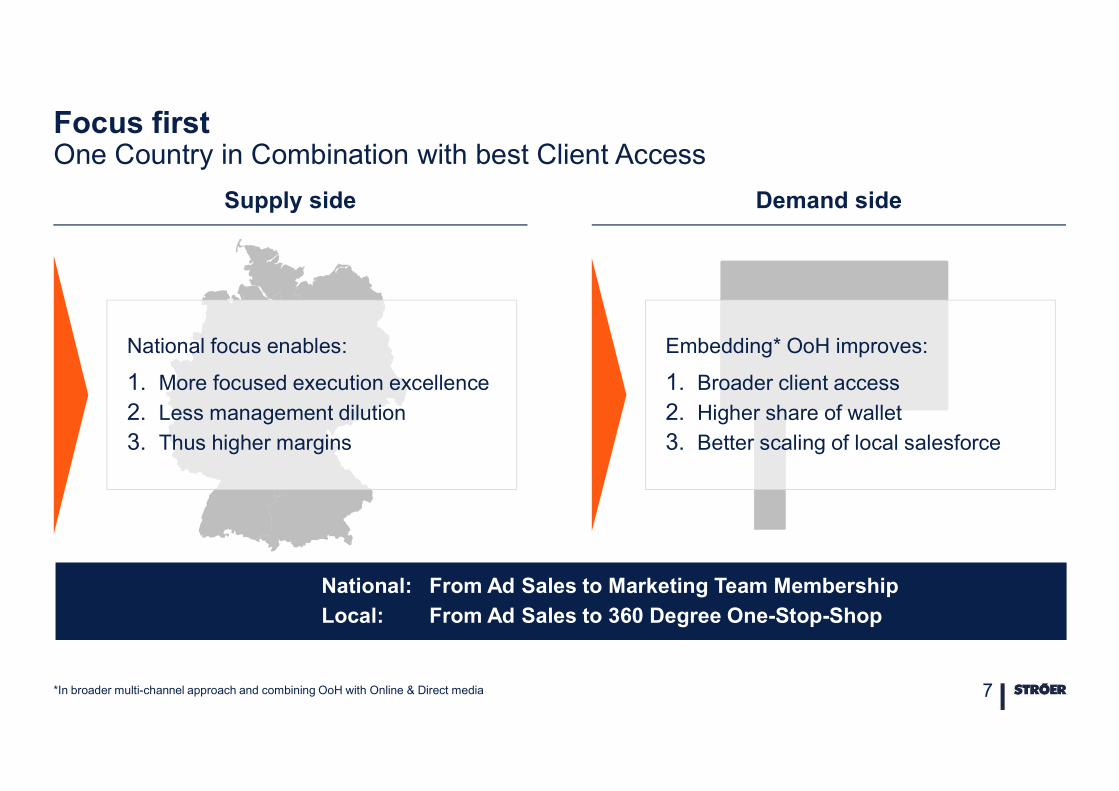
Focus firstOne Country in Combination with best Client Access
*In broader multi-channel approach and combining OoH with Online & Direct media 7
National focus enables:
1. More focused execution excellence
2. Less management dilution
3. Thus higher margins
Supply side Demand side
National: From Ad Sales to Marketing Team Membership
Local: From Ad Sales to 360 Degree One-Stop-Shop
Embedding* OoH improves:
1. Broader client access
2. Higher share of wallet
3. Better scaling of local salesforce
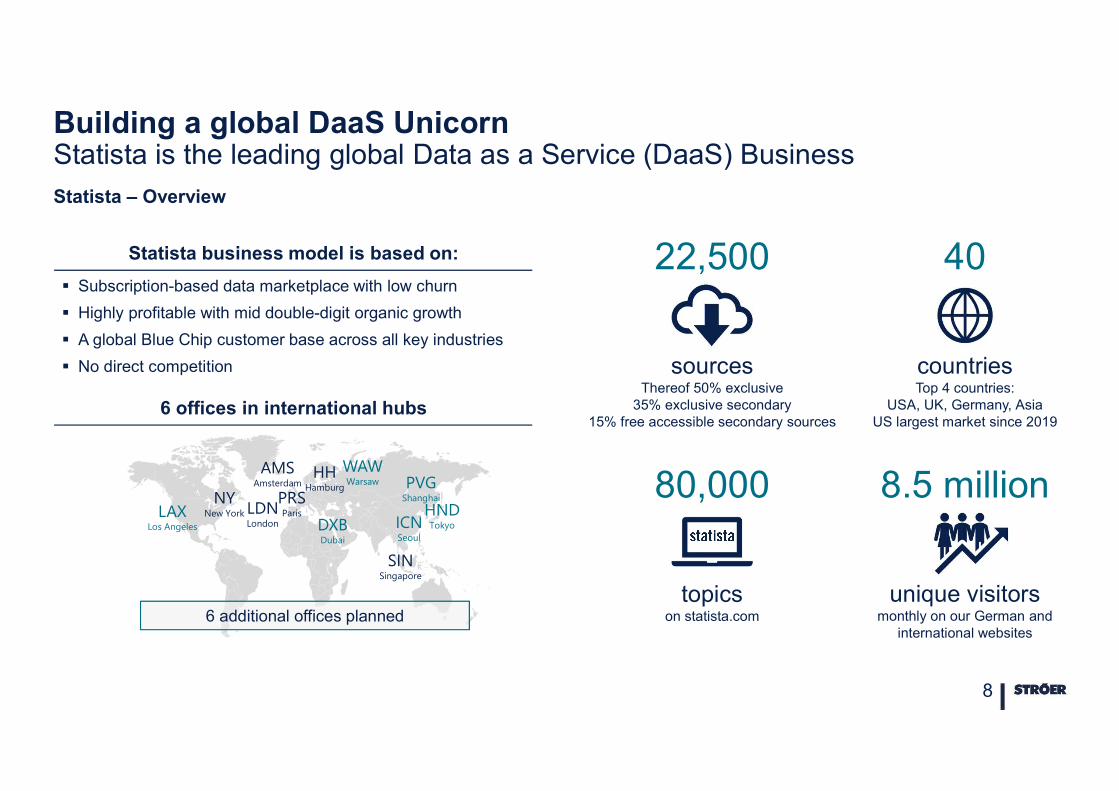
80,000
topics on statista.com
Statista – Overview
8
6 offices in international hubs
NYNew York
HHHamburg
LDNLondon
PRSParis
AMSAmsterdam
SINSingapore
HNDTokyo
PVGShanghai
LAXLos Angeles
WAWWarsaw
6 additional offices planned
40
countriesTop 4 countries:
USA, UK, Germany, AsiaUS largest market since 2019
8.5 million
unique visitorsmonthly on our German and
international websites
Subscription-based data marketplace with low churn
Highly profitable with mid double-digit organic growth
A global Blue Chip customer base across all key industries
No direct competition
Statista business model is based on: 22,500
sourcesThereof 50% exclusive
35% exclusive secondary15% free accessible secondary sources
Building a global DaaS Unicorn Statista is the leading global Data as a Service (DaaS) Business
DXBDubai
ICNSeoul
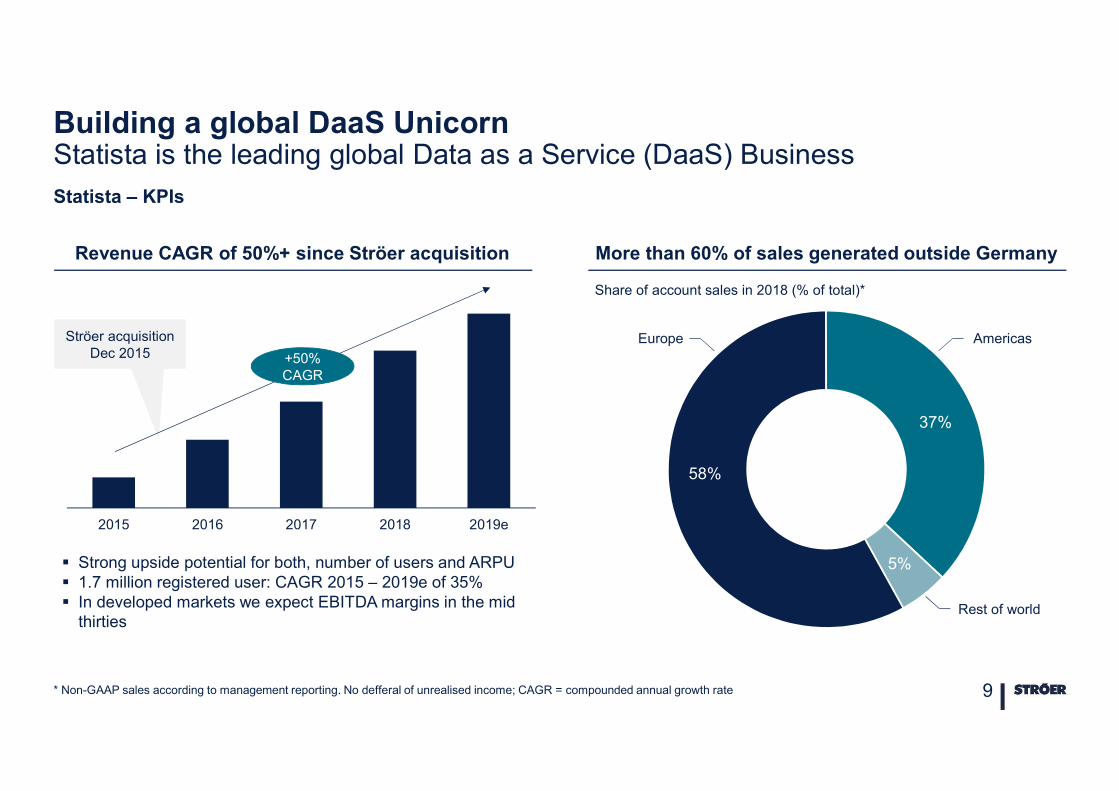
58%
37%
5%
2015 2016 2017 2018 2019e
Strong upside potential for both, number of users and ARPU 1.7 million registered user: CAGR 2015 – 2019e of 35% In developed markets we expect EBITDA margins in the mid
thirties
* Non-GAAP sales according to management reporting. No defferal of unrealised income; CAGR = compounded annual growth rate 9
Revenue CAGR of 50%+ since Ströer acquisition More than 60% of sales generated outside Germany
Ströer acquisitionDec 2015 +50%
CAGR
Statista – KPIs
Building a global DaaS Unicorn Statista is the leading global Data as a Service (DaaS) Business
Share of account sales in 2018 (% of total)*
AmericasEurope
Rest of world
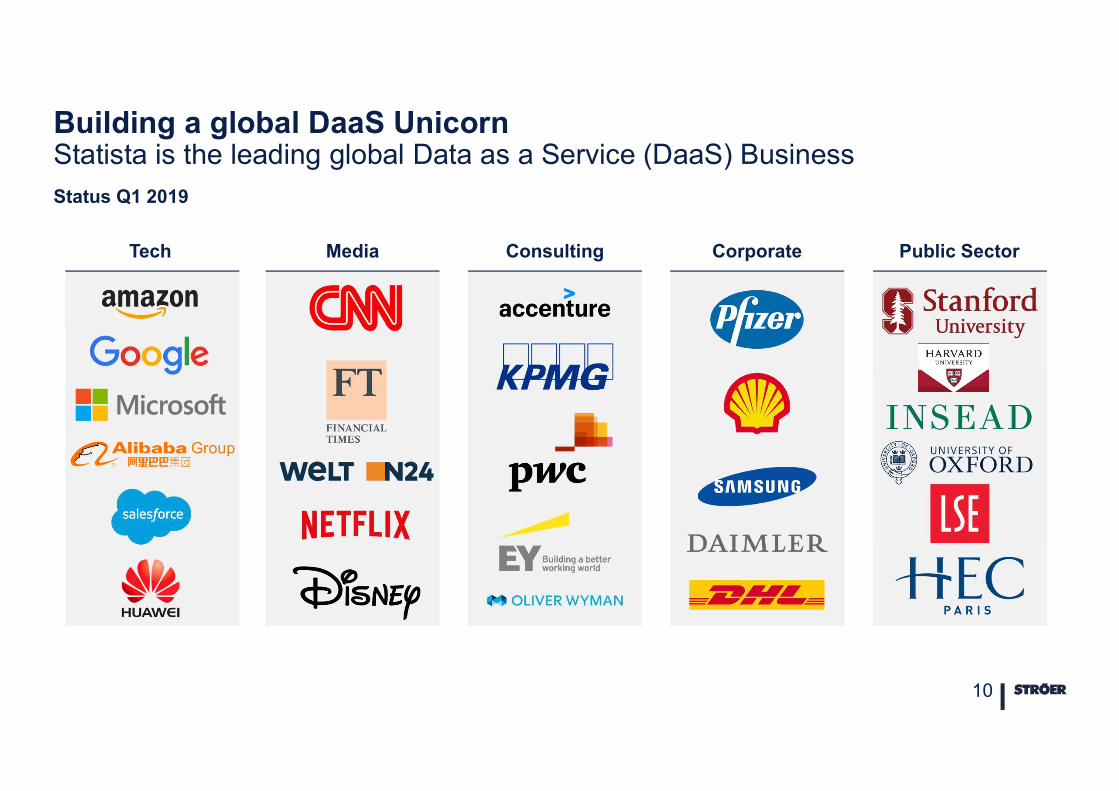
Building a global DaaS Unicorn Statista is the leading global Data as a Service (DaaS) Business Status Q1 2019
10
Tech Media Consulting Corporate Public Sector
INDEX
01Strategic Reassurance
02Business Update
03Financial Status
04Outlook
11
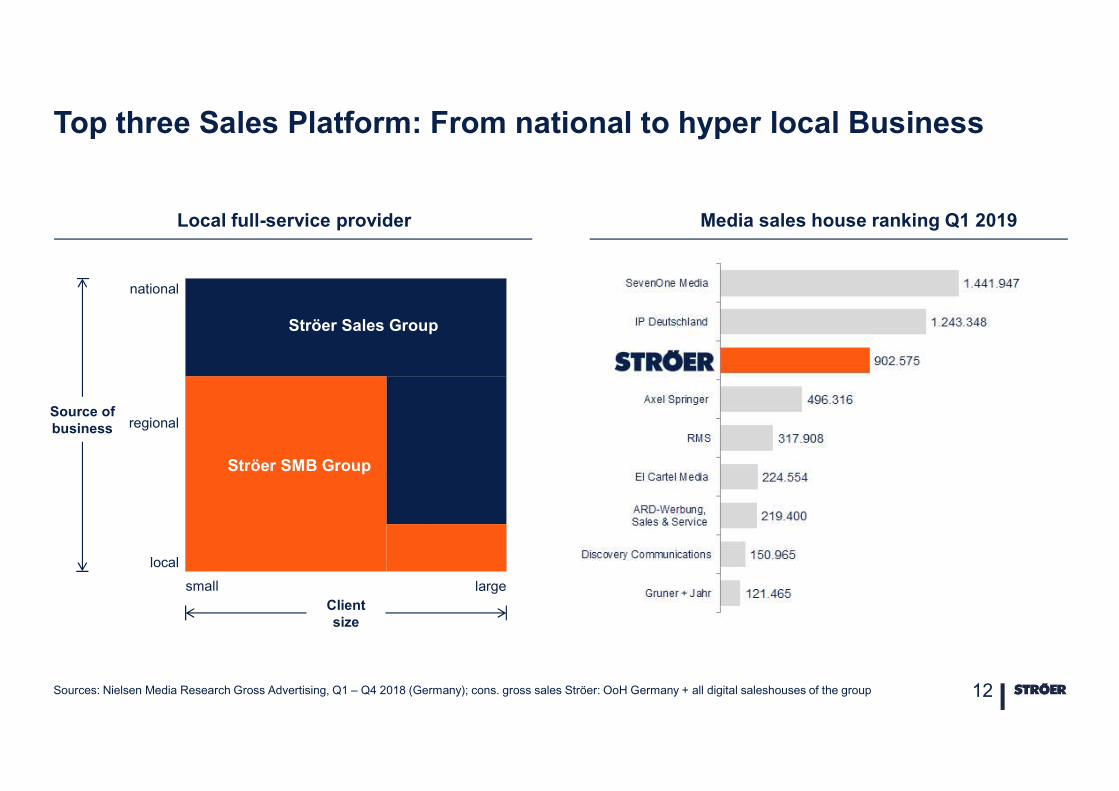
Top three Sales Platform: From national to hyper local Business
Sources: Nielsen Media Research Gross Advertising, Q1 – Q4 2018 (Germany); cons. gross sales Ströer: OoH Germany + all digital saleshouses of the group 12
Media sales house ranking Q1 2019Local full-service provider
small largeClient size
national
local
Source ofbusiness regional
Ströer Sales Group
Ströer SMB Group
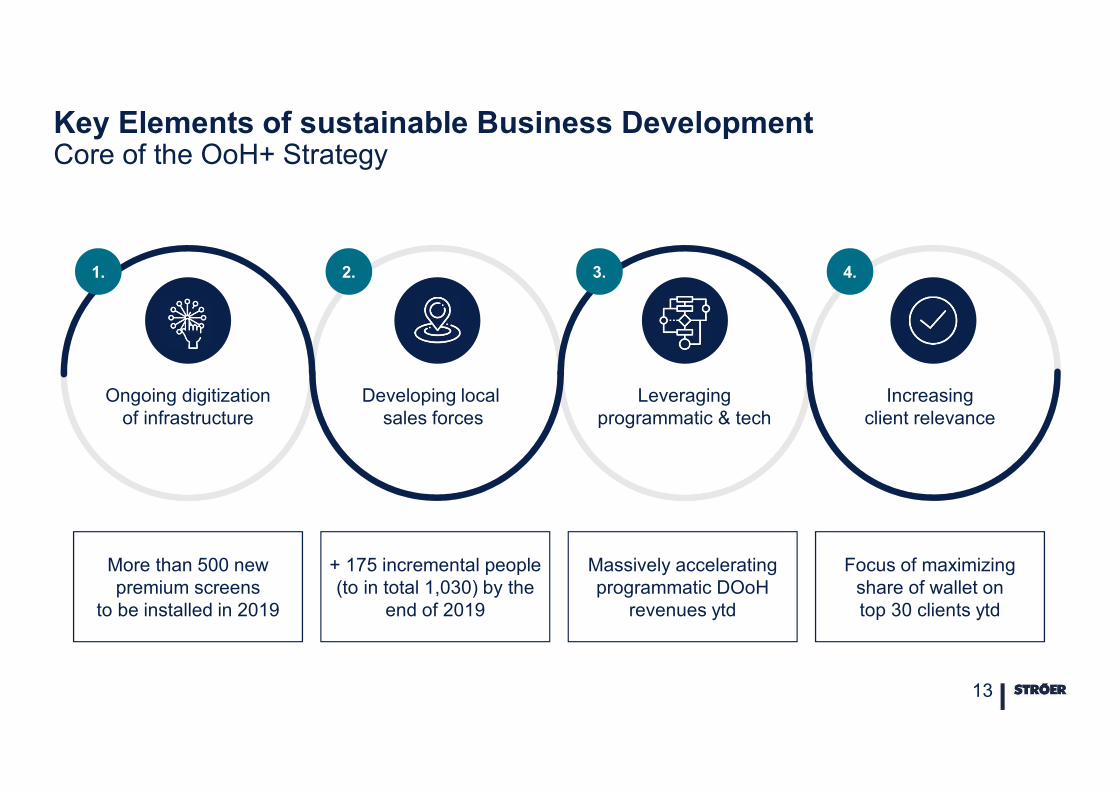
Key Elements of sustainable Business DevelopmentCore of the OoH+ Strategy
13
Ongoing digitization of infrastructure
Developing localsales forces
Leveragingprogrammatic & tech
Increasing client relevance
1. 2. 3. 4.
More than 500 new premium screens
to be installed in 2019
+ 175 incremental people (to in total 1,030) by the
end of 2019
Massively accelerating programmatic DOoH
revenues ytd
Focus of maximizing share of wallet ontop 30 clients ytd
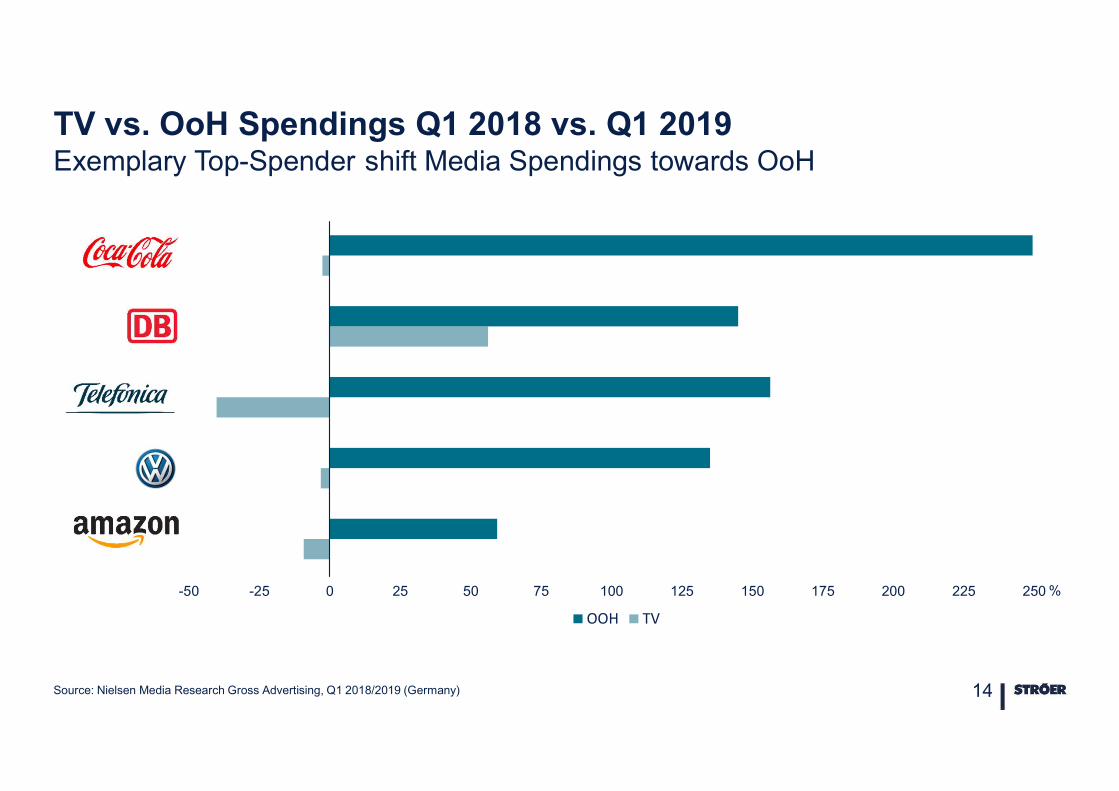
TV vs. OoH Spendings Q1 2018 vs. Q1 2019 Exemplary Top-Spender shift Media Spendings towards OoH
Source: Nielsen Media Research Gross Advertising, Q1 2018/2019 (Germany) 14
-50 -25 0 25 50 75 100 125 150 175 200 225 250
OOH TV
%
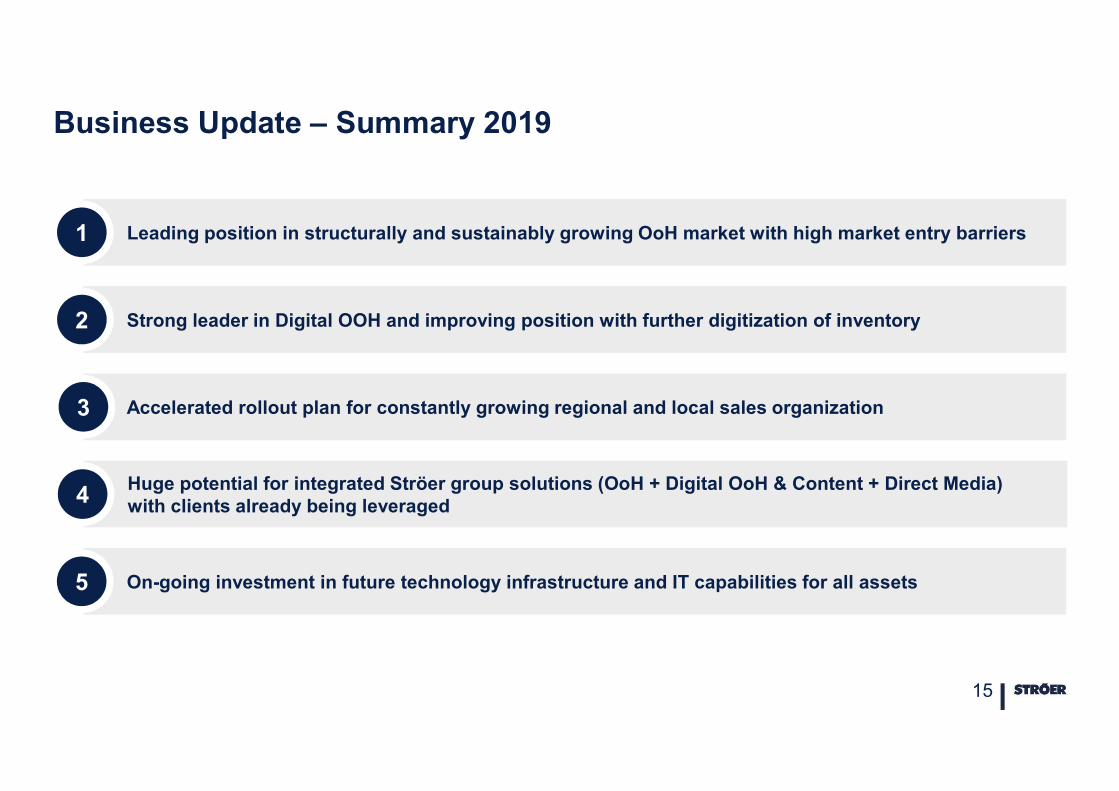
Business Update – Summary 2019
15
Leading position in structurally and sustainably growing OoH market with high market entry barriers 1
Strong leader in Digital OOH and improving position with further digitization of inventory2
Accelerated rollout plan for constantly growing regional and local sales organization3
Huge potential for integrated Ströer group solutions (OoH + Digital OoH & Content + Direct Media) with clients already being leveraged4
On-going investment in future technology infrastructure and IT capabilities for all assets5
INDEX
01Strategic Reassurance
02Business Update
03Financial Status
04Outlook
16
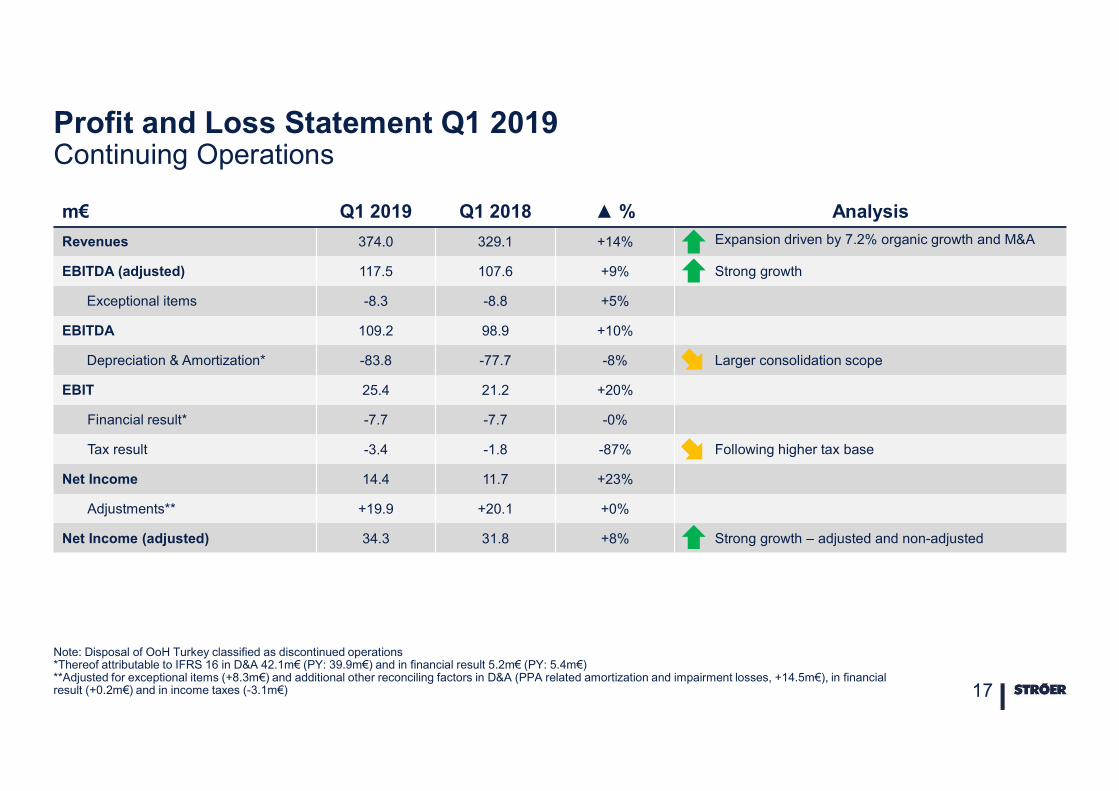
m€ Q1 2019 Q1 2018 ▲ % Analysis
Revenues 374.0 329.1 +14% Expansion driven by 7.2% organic growth and M&A
EBITDA (adjusted) 117.5 107.6 +9% Strong growth
Exceptional items -8.3 -8.8 +5%
EBITDA 109.2 98.9 +10%
Depreciation & Amortization* -83.8 -77.7 -8% Larger consolidation scope
EBIT 25.4 21.2 +20%
Financial result* -7.7 -7.7 -0%
Tax result -3.4 -1.8 -87% Following higher tax base
Net Income 14.4 11.7 +23%
Adjustments** +19.9 +20.1 +0%
Net Income (adjusted) 34.3 31.8 +8% Strong growth – adjusted and non-adjusted
Profit and Loss Statement Q1 2019Continuing Operations
Note: Disposal of OoH Turkey classified as discontinued operations*Thereof attributable to IFRS 16 in D&A 42.1m€ (PY: 39.9m€) and in financial result 5.2m€ (PY: 5.4m€)**Adjusted for exceptional items (+8.3m€) and additional other reconciling factors in D&A (PPA related amortization and impairment losses, +14.5m€), in financial result (+0.2m€) and in income taxes (-3.1m€) 17
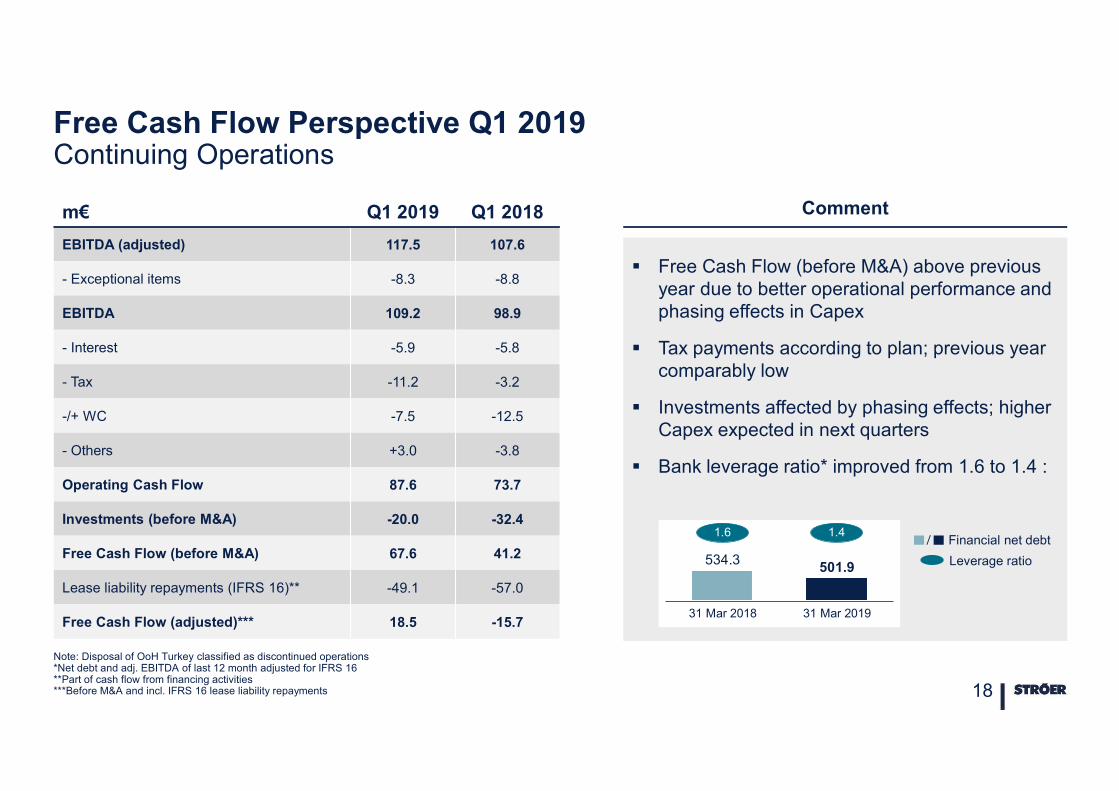
m€ Q1 2019 Q1 2018
EBITDA (adjusted) 117.5 107.6
- Exceptional items -8.3 -8.8
EBITDA 109.2 98.9
- Interest -5.9 -5.8
- Tax -11.2 -3.2
-/+ WC -7.5 -12.5
- Others +3.0 -3.8
Operating Cash Flow 87.6 73.7
Investments (before M&A) -20.0 -32.4
Free Cash Flow (before M&A) 67.6 41.2
Lease liability repayments (IFRS 16)** -49.1 -57.0
Free Cash Flow (adjusted)*** 18.5 -15.7
Free Cash Flow Perspective Q1 2019Continuing Operations
18
Free Cash Flow (before M&A) above previous year due to better operational performance and phasing effects in Capex
Tax payments according to plan; previous year comparably low
Investments affected by phasing effects; higher Capex expected in next quarters
Bank leverage ratio* improved from 1.6 to 1.4 :
Comment
Note: Disposal of OoH Turkey classified as discontinued operations*Net debt and adj. EBITDA of last 12 month adjusted for IFRS 16**Part of cash flow from financing activities***Before M&A and incl. IFRS 16 lease liability repayments
Financial net debt
Leverage ratio
1.6
31 Mar 2018
501.9534.3
31 Mar 2019
1.4
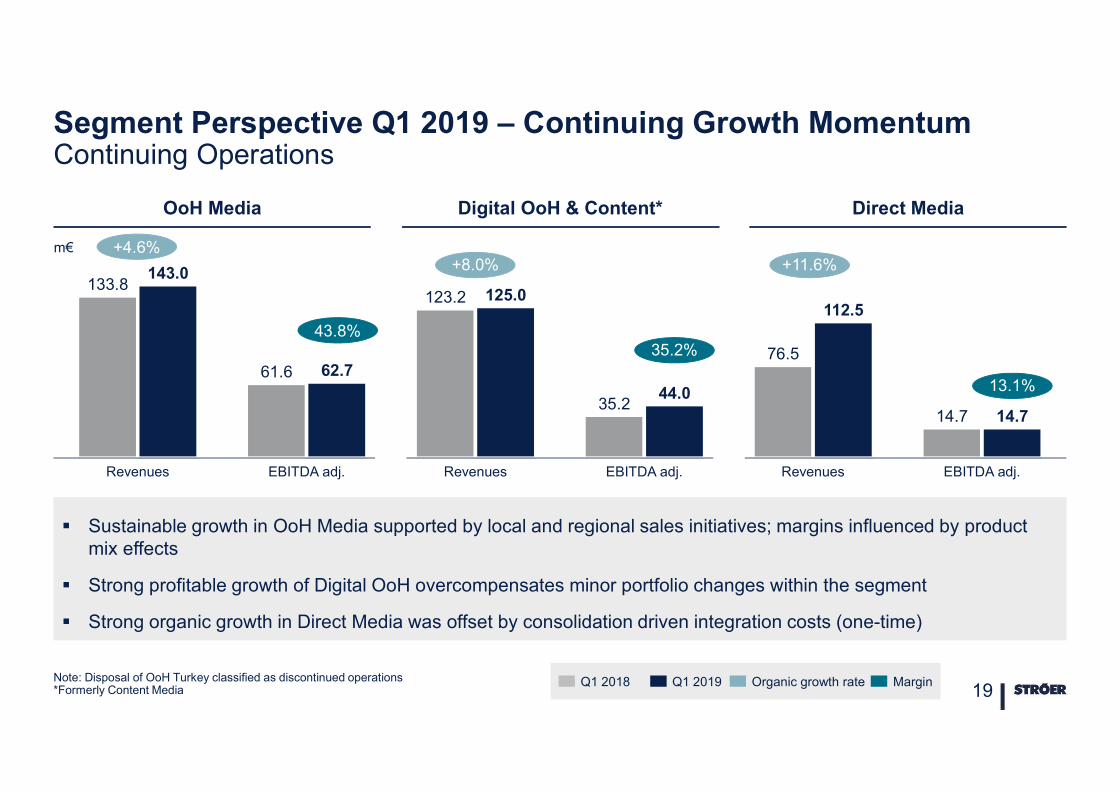
Segment Perspective Q1 2019 – Continuing Growth MomentumContinuing Operations
Note: Disposal of OoH Turkey classified as discontinued operations*Formerly Content Media 19
OoH Media Digital OoH & Content* Direct Media
Sustainable growth in OoH Media supported by local and regional sales initiatives; margins influenced by product mix effects
Strong profitable growth of Digital OoH overcompensates minor portfolio changes within the segment
Strong organic growth in Direct Media was offset by consolidation driven integration costs (one-time)
Revenues EBITDA adj.EBITDA adj.EBITDA adj. Revenues
143.0133.8
Revenues
62.761.6
123.2 125.0
35.244.0
76.5
112.5
14.7 14.7
+11.6%
13.1%
+8.0%
35.2%
+4.6%
43.8%
m€
Organic growth rateQ1 2019Q1 2018 Margin
INDEX
01Strategic Reassurance
02Business Update
03Financial Status
04Outlook
20
*incl. IFRS changes
Ströer Group’s Key Performance Indicators – Guidance 2019*
For 2019 as a whole, we expect a positive sales and earnings trend in the mid single-digit percentage range.
For Q2, and the first half of the year, we expect organic revenue growth of around 7% and therefore at the very top end of our annual guidance.
21
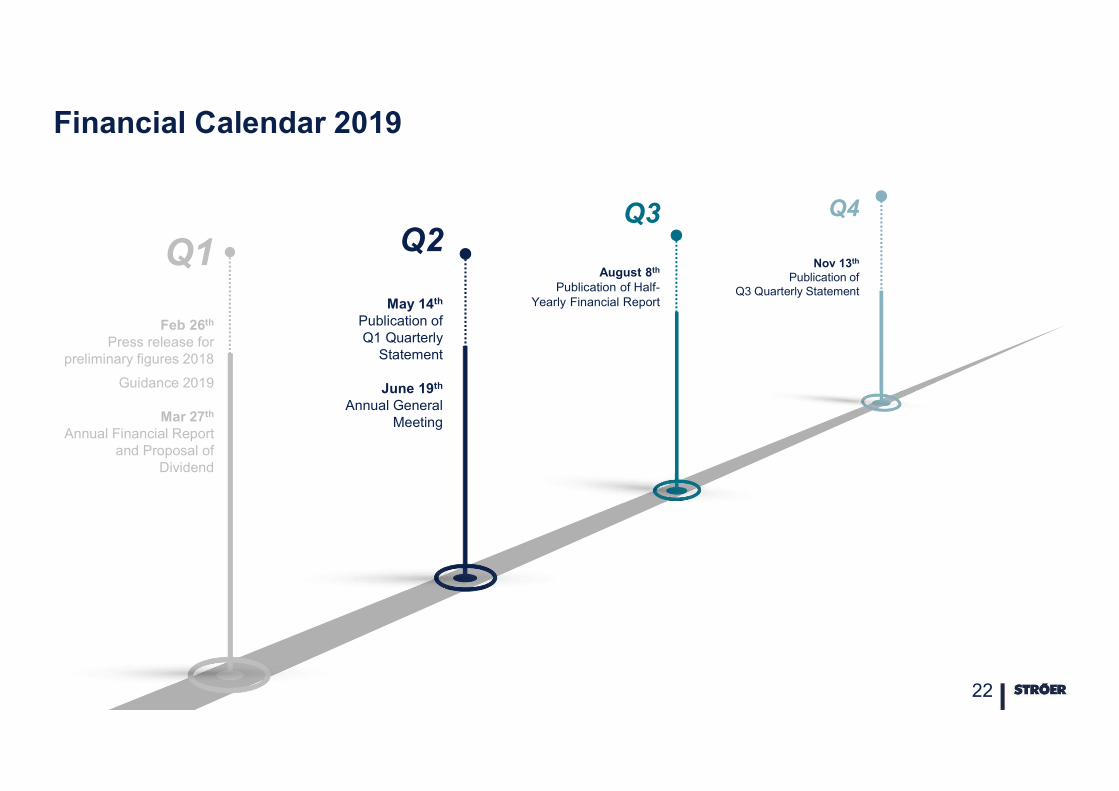
Feb 26th
Press release for preliminary figures 2018
Guidance 2019
Mar 27th
Annual Financial Report and Proposal of
Dividend
Q1May 14th
Publication of Q1 Quarterly
Statement
June 19th
Annual General Meeting
Q2August 8th
Publication of Half-Yearly Financial Report
Q3
Nov 13th
Publication ofQ3 Quarterly Statement
Q4
Financial Calendar 2019
22


![Oh Pretty Woman4sc].pdfã ### ### ### ### ### ### ### ### 4 4 4 4 4 4 4 4 4 4 4 4 4 4 4 4 4 4 4 2 4 2 4 2 4 2 4 2 4 2 4 2 4 2 4 2 4 4 4 4 4 4 4 4 4 4 4 4 4 4 4 4](https://img.pdfslide.us/doc/110x75/60cfb349cd0cbb00d32b6774/oh-pretty-woman-4scpdf-4-4-4-4-4-4-4-4-4-4.jpg)