Embed Size (px)
Citation preview

Investor Conference CallQ1 2015 Results
April 30, 2015 / Marijn Dekkers, CEO
• Q1 2015 Investor Conference Call • Marijn Dekkers Page 1

DisclaimerThis presentation may contain forward-looking statements based on currentassumptions and forecasts made by Bayer Group or subgroup management.
Various known and unknown risks, uncertainties and other factors could lead tomaterial differences between the actual future results, financial situation,development or performance of the company and the estimates given here.These factors include those discussed in Bayer’s public reports which areavailable on the Bayer website at www.bayer.com.
The company assumes no liability whatsoever to update these forward-lookingstatements or to conform them to future events or developments.
• Q1 2015 Investor Conference Call • Marijn Dekkers Page 2

Page 3
Q1 2015 – Strong Start to the Year
Significant sales and earnings growth in HealthCare
CropScience performance steady in a weaker market environment
MaterialScience posts earnings growth
Portfolio transformation into a pure Life Science company, integration of the acquired businesses and preparations for the flotationof MaterialScience remain on track
Full-year Group Guidance 2015 raised mainly due to Fx
• Q1 2015 Investor Conference Call • Marijn Dekkers

Page 4
EBITin € million
-5%
1,9982,096
Salesin € million% currency & portfolio adj.
+3%
12,11710,555
EBITDAbefore special itemsin € million
+10%
3,0002,738
Core EPSin €
+8%
2.101.95
Q1’15Q1’14 Q1’15Q1’14 Q1’15Q1’14 Q1’15Q1’14
Q1 2015 – Strong Start to the Year
• Q1 2015 Investor Conference Call • Marijn Dekkers
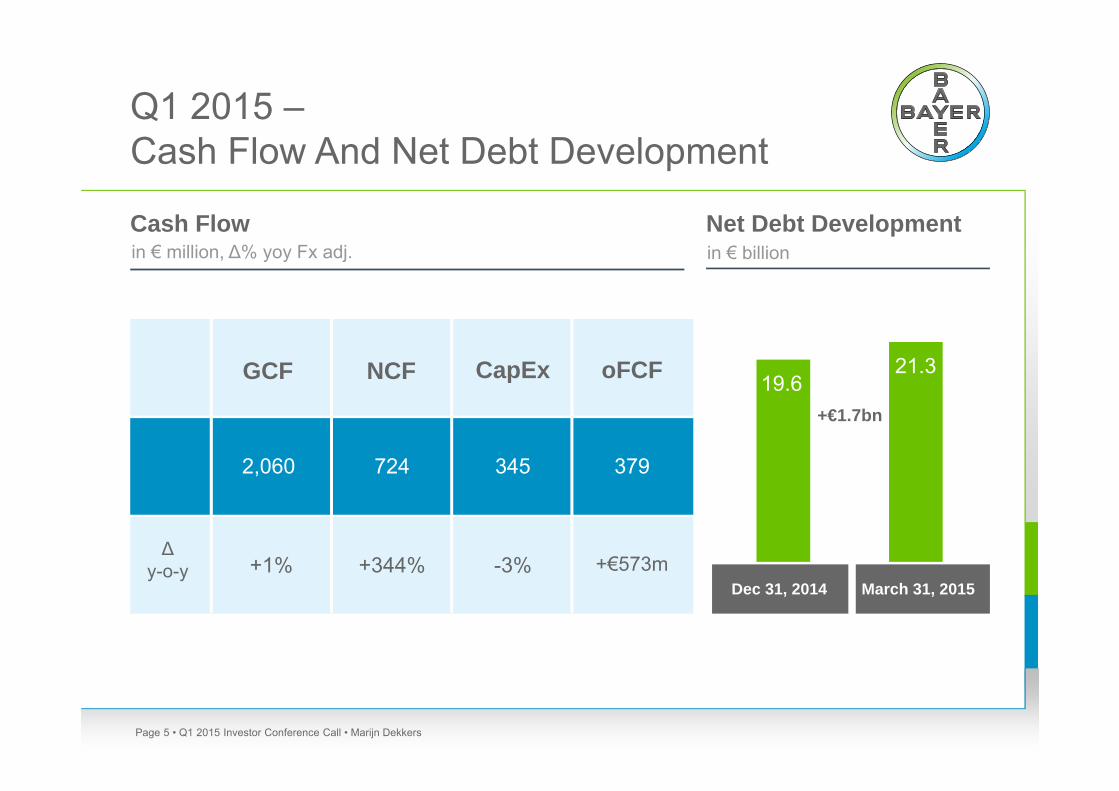
Q1 2015 –Cash Flow And Net Debt Development
Page 5
+€1.7bn
21.3GCF oFCF
2,060
CapEx
345 379
∆y-o-y +1% +€573m
NCF
724
+344% -3%Dec 31, 2014 March 31, 2015
19.6
• Q1 2015 Investor Conference Call • Marijn Dekkers
Cash Flow in € million, ∆% yoy Fx adj.
Net Debt Developmentin € billion

Q1 2015 – HealthCare: All Divisions Generated Strong Growth
Page 6
Pharma+15% (+7%)
ConsumerHealth
42% (+7%)
36%
HealthCare €5,742m; +26% (+7%)
3,2002,542
Price1%
Volume+7%
Fx+8%
Portfolio+11% Q1‘14 Q1‘15
873 988
428 627
+13%
+46%
1,301
1,615 +24%
321 +46%
946
1,185 +25%
625
470
EBITDA EBIT
715 +14%
• Q1 2015 Investor Conference Call • Marijn Dekkers
Salesin € million, ∆% yoy, () = Fx & portf. adj.
Earnings
Q1‘14 Q1‘15
before special items, in € million, ∆% yoy

Q1 2015 – Pharma:Launch Products Drove Growth
Page 7
Launch products
Pharmaceuticals €3,200m; +15% (+7%)
898
Q1‘14 Q1‘15 Q1‘14 Q1‘15
873
988 +13%
625715 +14%
• Q1 2015 Investor Conference Call • Marijn Dekkers
Salesin € million, ∆% yoy, () = Fx & portf. adj.
EBITDA EBIT
Earningsbefore special items, in € million, ∆% yoy

Q1 2015 – Consumer Health:All Businesses with Strong Growth
Page 8
Medical Care+12% (+6%)
ConsumerCare
+69% (+8%)
36%
Consumer Health €2,542m; +42% (+7%)
600
1,556
Q1‘14 Q1‘15 Q1‘14 Q1‘15
428
627 +46%
321
+46%470
• Q1 2015 Investor Conference Call • Marijn Dekkers
Animal Health+17 (+6%)
386
Salesin € million, ∆% yoy, () = Fx & portf. adj.
EBITDA EBIT
Earningsbefore special items, in € million, ∆% yoy

Q1 2015 – CropScience: Steady in Weak Market Environment
Page 9
Crop Protection+3% (-1%)
Environmental Science+22% (+4%)
Seeds+19% (+8%)
CropScience €3,092m; +7% (+1%)
Price+3%
Volume-2%
Fx+5%
Portfolio+1%
2,292
Q1‘14 Q1‘15 Q1‘14 Q1‘15
1,089 1,040 -5% 988 921 -7%
203
597
• Q1 2015 Investor Conference Call • Marijn Dekkers
Salesin € million, ∆% yoy, () = Fx & portf. adj.
EBITDA EBIT
Earningsbefore special items, in € million, ∆% yoy

Q1 2015 – MaterialScience:Lower Raw Material Costs Impacted Sales and Earnings
Page 10**CAS: Coatings, Adhesives, Specialties *** IO: Industrial Operations
CAS**+14% (+5%)
MaterialScience €3,014m; +8% (-2%)
Price-4%
Volume+2%
Fx+10%
Portfolio0%
1,551764
IO***0% (-4%)
Q1‘14 Q1‘15 Q1‘14 Q1‘15
366
424 +16%
221261534
165
• Q1 2015 Investor Conference Call • Marijn Dekkers
Polyurethanes+3% (-7%)
Polycarbonates+16% (+4%)
+18%
Salesin € million, ∆% yoy, () = Fx & portf. adj.
EBITDA EBIT
Earningsbefore special items, in € million, ∆% yoy

Q1 2015 –Full-Year Group Guidance Raised Mainly Due to Fx
Page 11
2014 2015original guidance
2015Update (April) Fx effect
Sales €42.2bnLow-single digit %
increase~€46bn
Low-single digit % increase
€48 - 49bn~ +9%
EBITDAbefore special items
€8.8bn Low-to-mid-teens % increase
High-teens % increase ~ +8%
core EPS €6.02 Low-teens % increase
High-teens % increase ~ +7%
Sales ∆% Fx and portfolio adjusted
Assuming end Q1’15 Fx ratesOutlook depends on specific planning assumptions as detailed in the Annual Report• Q1 2015 Investor Conference Call • Marijn Dekkers

Investor Conference CallQ1 2015 Results
April 30, 2015 / Marijn Dekkers, CEO
• Q1 2015 Investor Conference Call • Marijn Dekkers Page 12