Embed Size (px)
Citation preview

Q1 2015 Financial Results Presentation 23 April 2015
Table of Contents
3 Q1 2015 Results Overview
7 Divisional Performance and Market Outlook
11 Financial Position
16 Appendices

Q1 2015 Results Overview

Page 4
Summary
Primarily reflecting a combination of ongoing efficiency improvements as well as lower input costs with RUB devaluation mitigating the
impact of lower selling prices Severstal posted further EBITDA* margin expansion by 6.4 ppts q/q to 38.5% (Q4 14: 32.1%).
This represents the highest level in Severstal’s history as a public company amidst challenging market conditions
Q1 15 Group revenue decreased 18.5% q/q to $1,531m (Q4 14: $1,878m) largely reflecting a decline in global steel prices and
steelmaking raw materials price. However, Group EBITDA decreased a negligible 2.0% q/q to $590m (Q4 14: $602m)
Free cash flow of $209m (Q4 14: $425m) generated in line with our key strategic focus. Q/q decline of 50.8% primarily reflects an
increase in stock to normalized level after divesting inventories during Q4 2014 against strong demand
Q1 15 net profit** of $343m (Q4 14: net loss ** of $795m) was marginally impacted by FX translation losses of continuing operations of
$31m. Adjusting for those non-cash items, Severstal would have posted a net profit of $374m (Q4 14: net profit of $534m excluding
impairments)
Net Debt/EBITDA ratio further decreased q/q to 0.6x at the end of Q1 15 (Q4 14: 0.7x). This represents one of the lowest levels among
steel companies globally
Q1 15 capex *** of $103 million, 34.4% lower q/q (Q4 14: $157 million) reflecting our prudent approach to investments as well as the
completion of most large-scale development projects
Recommended dividend payment of 12.81 roubles per share for the three months ended 31 March 2015
Q1 2015 Highlights:
* EBITDA represents profit/(loss) from operations plus depreciation and amortization of productive assets (including the Group’s share in depreciation and amortization of associates and joint ventures) adjusted for gain/(loss) on disposals of PPE and intangible assets and for share in associates’ and joint ventures’ non-operating income/(expenses) ** Net profit/ (loss) attributable to shareholders of PAO Severstal. *** Represents cash outflow on capex in the period
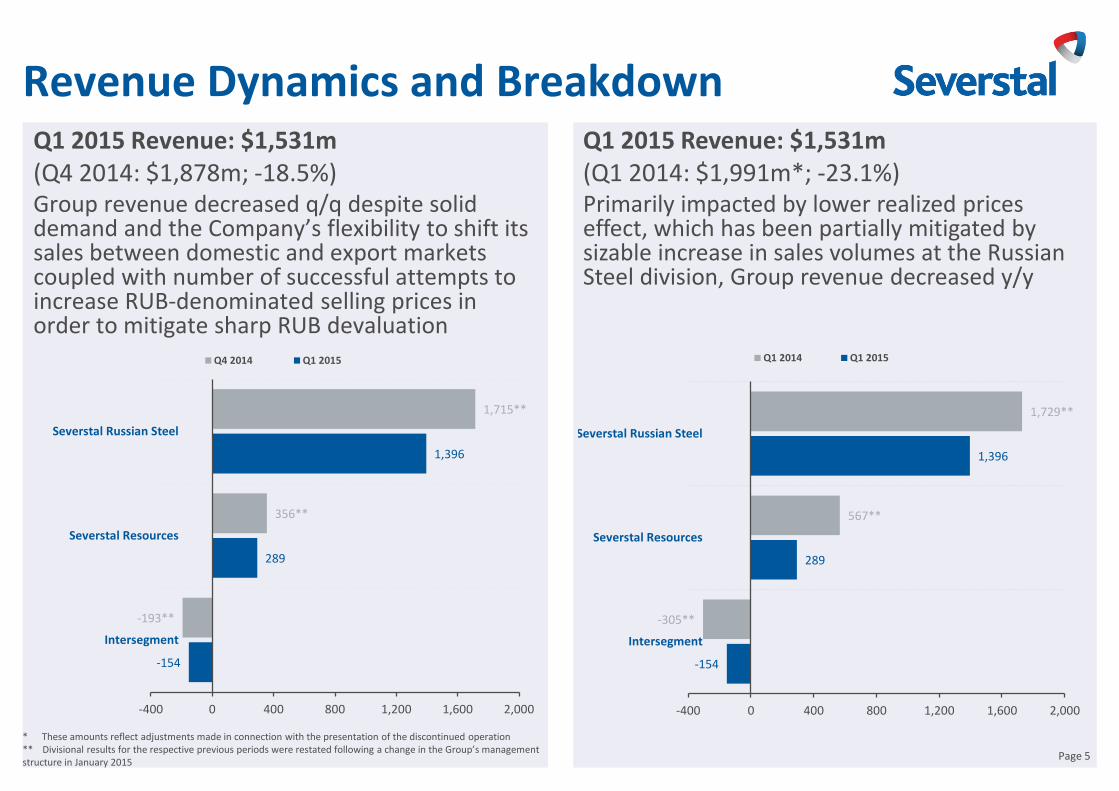
Revenue Dynamics and Breakdown Q1 2015 Revenue: $1,531m (Q4 2014: $1,878m; -18.5%) Group revenue decreased q/q despite solid demand and the Company’s flexibility to shift its sales between domestic and export markets coupled with number of successful attempts to increase RUB-denominated selling prices in order to mitigate sharp RUB devaluation
Page 5
Q1 2015 Revenue: $1,531m (Q1 2014: $1,991m*; -23.1%) Primarily impacted by lower realized prices effect, which has been partially mitigated by sizable increase in sales volumes at the Russian Steel division, Group revenue decreased y/y
* These amounts reflect adjustments made in connection with the presentation of the discontinued operation ** Divisional results for the respective previous periods were restated following a change in the Group’s management structure in January 2015
-154
289
1,396
-193**
356**
1,715**
-400 0 400 800 1,200 1,600 2,000
Intersegment
Severstal Resources
Severstal Russian Steel
Q4 2014 Q1 2015
-154
289
1,396
-305**
567**
1,729**
-400 0 400 800 1,200 1,600 2,000
Intersegment
Severstal Resources
Severstal Russian Steel
Q1 2014 Q1 2015
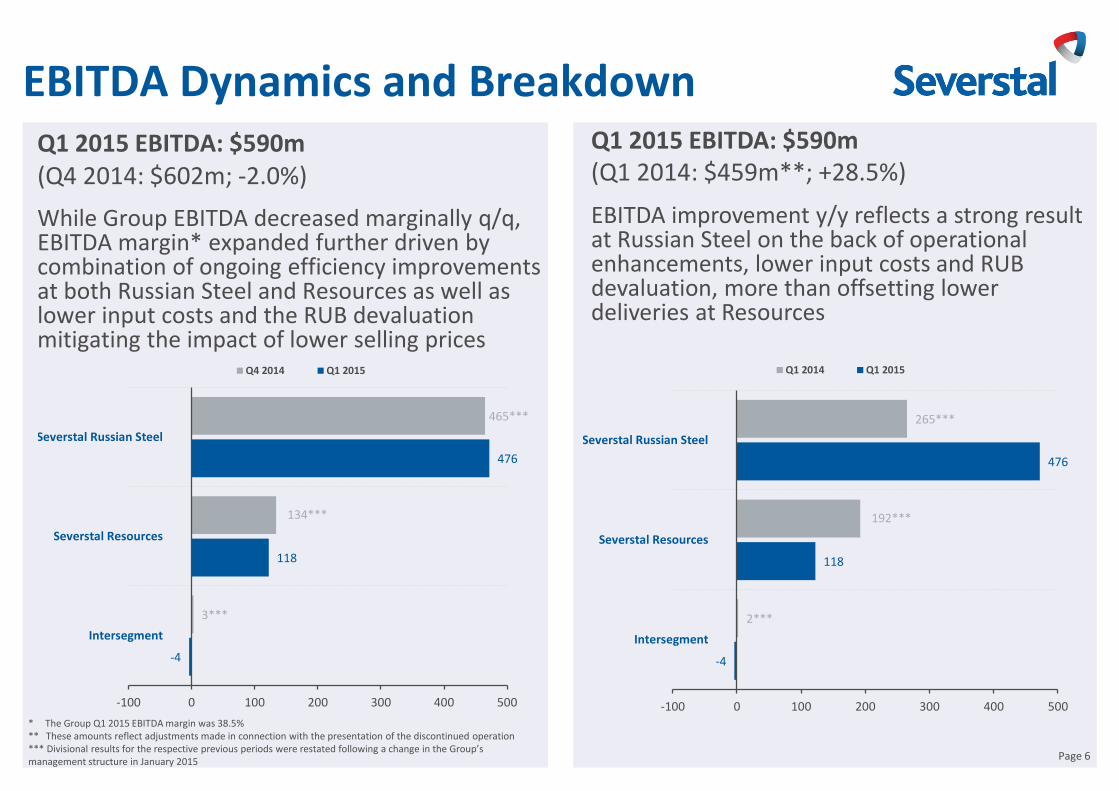
EBITDA Dynamics and Breakdown Q1 2015 EBITDA: $590m (Q4 2014: $602m; -2.0%)
While Group EBITDA decreased marginally q/q, EBITDA margin* expanded further driven by combination of ongoing efficiency improvements at both Russian Steel and Resources as well as lower input costs and the RUB devaluation mitigating the impact of lower selling prices
Q1 2015 EBITDA: $590m (Q1 2014: $459m**; +28.5%)
EBITDA improvement y/y reflects a strong result at Russian Steel on the back of operational enhancements, lower input costs and RUB devaluation, more than offsetting lower deliveries at Resources
Page 6
* The Group Q1 2015 EBITDA margin was 38.5% ** These amounts reflect adjustments made in connection with the presentation of the discontinued operation *** Divisional results for the respective previous periods were restated following a change in the Group’s management structure in January 2015
-4
118
476
3***
134***
465***
-100 0 100 200 300 400 500
Intersegment
Severstal Resources
Severstal Russian Steel
Q4 2014 Q1 2015
-4
118
476
2***
192***
265***
-100 0 100 200 300 400 500
Intersegment
Severstal Resources
Severstal Russian Steel
Q1 2014 Q1 2015

Divisional Performance and Market Outlook

Severstal Russian Steel (RSD) Severstal Russian Steel increased its steel output in Q1 2% to 2.96mnt with all its rolling facilities at
Cherepovets Steel Mill (CherMK) running at almost full capacity. However, steel products sales
decreased 4% q/q to 2.56mnt. This allowed the Company to build up its internal stock of high value-
added (HVA) products to normal levels following the divestment of inventory against strong demand in
Q4 14
Severstal’s proximity to export markets facilitated a shift from domestic to export deliveries. As a result,
in Q1 2015 exports accounted for 38% of sales (Q4 14: 29%)
Increased exports and increased domestic RUB-denominated sales prices in order to catch up with the
USD-denominated parity helped to partially mitigate the negative impact of the sharp RUB devaluation
on revenue. That said, revenue decreased 18.6% q/q to $1,396m (Q4 14: $1,715m**)
RSD has been able to fully mitigate the impact of lower selling prices through lower input prices in
conjunction with reductions in production and G&A costs. That said, EBITDA increased 2.4% q/q to
$476m (Q4 14: $465m**), while EBITDA margin increased to 34.1% (Q4 14: 27.1%)
In Q1 Cherepovets total non-integrated cash cost of slab decreased $41/t q/q due to lower raw materials
prices as well as a higher crude steel production volumes and the positive impact of RUB devaluation. Q1
integrated cash cost of slab decreased $34/t q/q to $169/t
Share of high-value-added products*** in total steel shipments, %
EBITDA per tonne and average selling price
*All steel products, incl. pipes, etc.; Ex Works price terms.
Steel sales volumes by destination, %
** Divisional results for the respective previous periods were restated following a change in the Group’s management structure in January 2015 *** High-value-added comprises: plate; cold-rolled , galvanized and metallic coated, color coated sheet; metalware; large-diameter and other pipes. **** Excluding foreign exchange effect
EBITDA drivers in Q1 2015, $m
Page 8
175 186
108
186
579
490
619
490
Q4 2014 Q1 2015 Q1 2014 Q1 2015
EBITDA per tonne (US$/t) Average Selling Price (US$/t)*
2.6 2.6 2.7
2.3
2.6 2.7 2.6 2.7
2.5 2.7 2.7 2.7 2.6
40% 43% 46% 46% 43% 45% 50% 49% 47% 47%
52% 52% 46%
0%
20%
40%
60%
80%
100%
0.0
0.5
1.0
1.5
2.0
2.5
3.0
Q112
Q212
Q312
Q412
Q113
Q213
Q313
Q413
Q114
Q214
Q314
Q414
Q115
Total finished steel, mt (lhs) share of HVA, %
53% 58% 61% 65% 56%
65% 69% 62% 60% 64%
71% 71% 62%
47% 42% 39% 35% 44%
35% 31% 38% 40% 36%
29% 29% 38%
Q112
Q212
Q312
Q412
Q113
Q213
Q313
Q413
Q114
Q214
Q314
Q414
Q115
Russia Export
465 476
(85)
76
68
(19) (29)
EBITDAQ4
2014**
SalesVolume
COGSVolume
SalesPrice****
COGSPrice
Other EBITDAQ1 2015

Cost Control at Severstal Russian Steel
Page 9
Cherepovets Steel Mill production cash cost of slab, $/t
Q1 15 non-integrated cash cost of slab down $41/t q/q
Cherepovets cash cost of
slab at market price of raw
materials
Q1 15 integrated cash cost of slab down $34/t q/q
358 389 378
329 337 344 336 348 342 324 299 279 272 318
280
203 169
484
559 537
472 457 457
432
401 418 409
370 377 350
361
327
255
214
$0
$100
$200
$300
$400
$500
$600
1Q11 2Q11 3Q11 4Q11 1Q12 2Q12 3Q12 4Q12 1Q13 2Q13 3Q13 4Q13 1Q14 2Q14 3Q14 4Q14 1Q15
Contribution of Severstal Resources division to the integrated costs Cash cost of slab on an integrated basis

Severstal Resources Severstal Resources has been able to partially mitigate the impact of a 15% q/q drop in
the global iron ore benchmark and negative RUB devaluation effect. USD-denominated
prices for iron ore pellets and concentrate decreased 4% q/q and 11% q/q, respectively
Coking coal concentrate price decline of 16% q/q is purely a function of ca. 30% q/q RUB
devaluation partially offset by another round of RUB-denominated prices upgrades
The division’s total coking coal concentrate sales down 13% q/q due to severe weather
conditions. The Company expects production volumes to recover in Q2 15. Iron ore
pellet sales volumes down 6% q/q against strong comparatives in Q4 14
Severstal Resources’ revenue decreased 18.8% q/q to $289m (Q4 14: $356m*).
Nevertheless, Q1 15 EBITDA decreased 11.9% q/q to $118m (Q4 14: $134m*) with
EBITDA margin increasing to 40.8%
Continuous implementation of efficiency improvement projects to further decrease TCC
of production supported by RUB devaluation: TCC at Karelsky Okatysh declined to $22/t
($25/t in Q4 14), while TCC at Vorkutaugol decreased to $33/t ($40/t in Q4 14)
TCC at Olcon improved substantially to $23/t ($32/t in Q4 14) on solid production
Page 10
Average selling price and cash cost per tonne
Vo
rku
tau
gol (
coki
ng
coal
co
nce
ntr
ate,
mix
) Ka
rels
ky O
katy
sh
(pel
lets
)
* Divisional results for the respective previous periods were restated following a change in the Group’s management structure in January 2015 ** Excluding foreign exchange effect *** Free carrier price terms
EBITDA drivers in Q1 2015, $m
Olc
on
(ir
on
ore
co
nce
ntr
ate)
40 33
93
33
76 64
96
64
Q4 2014 Q1 2015 Q1 2014 Q1 2015
Cost per tonne (US$/t) Average Selling Price (US$/t)***
32 23
46
23
36 32
70
32
Q4 2014 Q1 2015 Q1 2014 Q1 2015
Cost per tonne (US$/t) Average Selling Price (US$/t)***
25 22 42
22
55 53
107
53
Q4 2014 Q1 2015 Q1 2014 Q1 2015
Cost per tonne (US$/t) Average Selling Price (US$/t)***
134 118
(25)
1
26 15
(33)
EBITDA Q42014*
Sales Volume COGS Volume Sales Price** COGS Price Other EBITDA Q12015

Financial Position

Cash Flow and Net Working Capital
Solid liquidity position of $1,522m in cash and cash equivalents
Strong operating cash flow of $277m*
Q1 15 capex of $103m, 34.4% lower q/q (Q4 14: $157m) reflecting our prudent
approach to investments as well as the completion of most large-scale
development projects
Q1 15 free cash flow of $209m
Net working capital up 30.9% YTD; NWC/LTM revenue increased to 12.4% YTD on a
back of inventory build up as well as higher share of export sales
Net working capital, $m
March 31, 2015 December 31, 2014 Change, %
975 745 30.9%
Page 12
Net working capital as % of revenues (LTM)
March 31, 2015 December 31, 2014 Change, ppts
12.4% 9.0% 3.4 ppts
Net Working Capital developments
Q1 2015 Highlights:
Q1 2015 CAPEX breakdown, $m FY 2015 target CAPEX breakdown, RUBbn
$103m RUB30bn
Cash Flow dynamics, 31 Dec 2014 to 31 Mar 2015
Severstal Russian
Steel $51m
Severstal Resources
$52m
Severstal Russian
Steel RUB16bn
Severstal Resources RUB14bn
* Net cash from operating activities – continuing operations
1,897 1,522
263
(68)
(570)
Dec 2014Cash & CE
Operating CF Investing CF Financing CF,incl. FX effecton cash & CE
Mar 2015Cash & CE

3,695 2,924
3,528
775
3,429
1,532
2,899
1,376
3,860
3,080
1.3x
1.5x
0.4x
0.7x
0.6x
Total debt, $m Net debt, $m Net debt/EBITDA, x Net debt/EBITDA ex-SNA, x
Q2 14 Q3 14 Q4 14 Q1 15
SNA portion, $m
1,522
4 456 1 4
688
Liquidity 2Q 2015 3Q 2015 4Q 2015 1Q 2016
Cash Short-term Debt to be Repaid Unused Committed Credit Lines
Robust Liquidity and Sustainable Leverage Strong liquidity position:
Severstal gross debt reduced by 15.5% since the end of Q4 14 to
$2,899m
Total of $221m of bond issues redeemed during a public tender offer
to buy back the Company’s 2016 and 2017 Eurobonds
Committed unused credit lines returned to $688m after $300m of
short-term debt raised in Q4 14 via committed facilities was repaid
during Q1 15
Solid liquidity position at the end of Q1 15 with $1,522m in cash and
cash equivalents and committed unused credit lines of $688m, more
than covering short-term debt of $465m*
Net Debt/EBITDA ratio further decreased q/q to 0.6x at the end of Q1
15 (Q4 14: 0.7x), one of the lowest amongst steel companies globally
* Represents principal amount of debt including repayment of Convertible Bond in line with Put Option in September 2015 assuming Put Option realized
Page 13
Total Short-term Debt to be Repaid of $465m*
Q1 2015 debt currency mix Q1 2015 cash currency mix
USD 89.9%
EUR 0.8%
RUB 9.3%
RUR 25%
USD 68%
EUR 7%

Debt Structure
As at 31.03.2015 the debt structure was dominated by public debt (90% of total) and the US dollar (89.9% of total).
Page 14
Debt Maturity Schedule*, $m
Notes: Debt represents the principal amount of debt. Debt for 2015 represents amount of debt as at 31 March 2015 * Figures exclude accrued interest and unamortized balance of transactional costs. ** Repayment of Convertible Bond in line with Put Option in September 2015 assuming Put Option realized *** Redeemed in February 2015
9
521
627 575
2
703
452**
137***
84***
2015 2016 2017 2018 2019 2020+

2015 Market Outlook Global:
Global steel markets remain under pressure due to steel overcapacity, weakening of the
Chinese economy and softening of the steel-related commodity prices
Near-term support for steel pricing can come from the seasonal pick-up in the construction-
related demand globally with first signs already seen in Europe
Moreover, additional support in terms of supply/demand issues might be seen on declining
steel exports from China and economic development acceleration in countries benefiting from
the low oil price
Russia:
Steel demand on the domestic market both in Q1 and so far in Q2 2015 turned to be better
than initially expected with pricing reaching export USD-denominated parity after the sharp
RUB devaluation in Q4 2014
Though visibility of the steel demand remains low in Russia, we remain cautiously optimistic
Source: Worldsteel, Rosstat, Severstal estimates
Page 15

Appendices

Summary Income Statement
$ million, unless otherwise stated Q1 2015 Q4 2014 Q1 2015 Q1 2014*
Revenue 1,531 1,878 1,531 1,991
COGS (812) (1,137) (812) (1,357)
EBITDA 590 602 590 459
EBITDA margin, % 38.5% 32.1% 38.5% 23.1%
Profit from operations 502 453 502 310
Operating margin, % 32.8% 24.1% 32.8% 15.6%
Profit/(loss) before income tax 446 (953) 446 (98)
Net profit/(loss) 343 (795) 343 (100)
Basic EPS, $ 0.42 (0.98) 0.42 (0.12)
Page 17
* These amounts reflect adjustments made in connection with the presentation of the discontinued operation
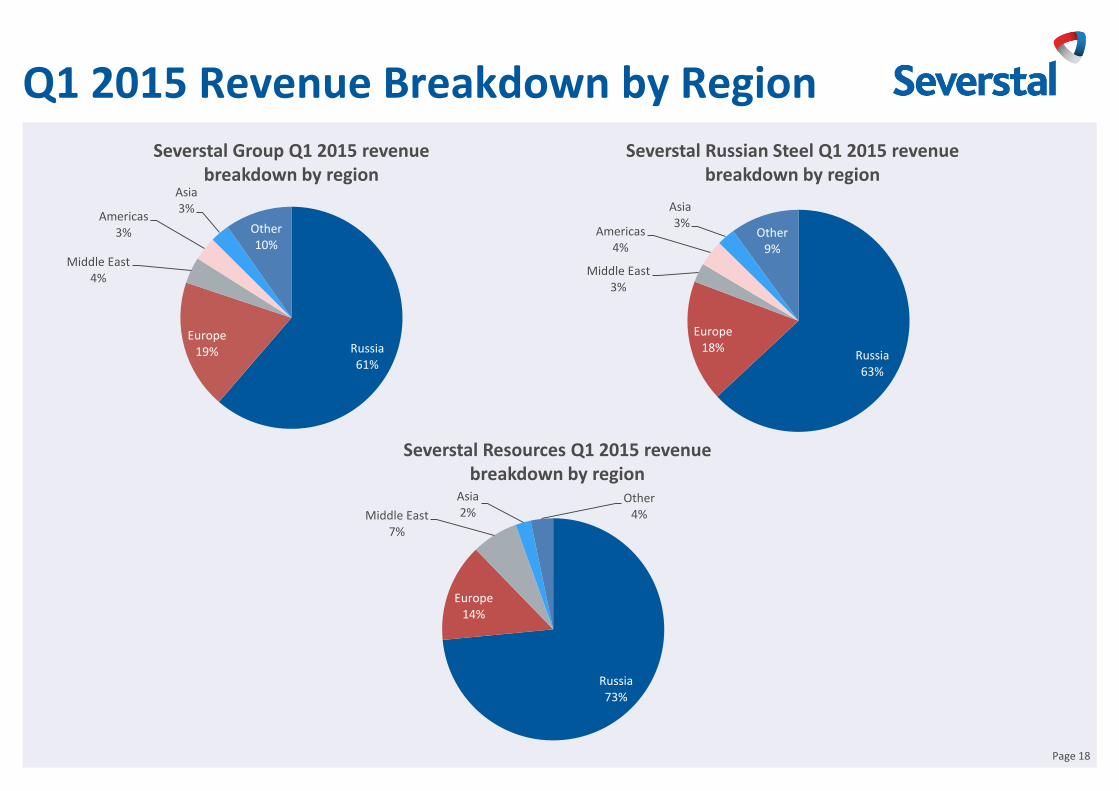
Q1 2015 Revenue Breakdown by Region
Page 18
Severstal Resources Q1 2015 revenue breakdown by region
Severstal Russian Steel Q1 2015 revenue breakdown by region
Severstal Group Q1 2015 revenue breakdown by region
Russia 61%
Europe 19%
Middle East 4%
Americas 3%
Asia 3%
Other 10%
Russia 63%
Europe 18%
Middle East 3%
Americas 4%
Asia 3%
Other 9%
Russia 73%
Europe 14%
Middle East 7%
Asia 2%
Other 4%

Q1 2015 Division Results
Q1 2015 Q4 2014* Change, % Q1 2015 Q1 2014* Change, %
Revenue ($m) 1,396 1,715 (18.6%) 1,396 1,729 (19.3%)
Cost of sales ($m) (797) (1,108) (28.1%) (797) (1,305) (38.9%)
G&A expenses ($m) (70) (87) (19.5%) (70) (106) (34.0%)
Distribution expenses ($m) (101) (123) (17.9%) (101) (127) (20.5%)
EBITDA ($m) 476 465 2.4% 476 265 79.6%
Operating Profit ($m) 423 364 16.2% 423 174 143.1%
EBITDA Margin, % 34.1% 27.1% 7.0 ppts 34.1% 15.3% 18.8 ppts
EBITDA per tonne ($/t) 186 175 6.3% 186 108 72.2%
Average Selling Price (US$/t**) 490 579 (15.4%) 490 619 (20.8%)
Severstal Russian Steel
Severstal Resources
* Divisional results for the respective previous periods were restated following a change in the Group’s management structure in January 2015 **All steel products, incl. pipes, etc.; Ex Works price terms Page 19
Q1 2015 Q4 2014* Change, % Q1 2015 Q1 2014* Change, %
Revenue ($m) 289 356 (18.8%) 289 567 (49.0%)
Cost of sales ($m) (155) (211) (26.5%) (155) (344) (54.9%)
G&A expenses ($m) (15) (12) 25.0% (15) (30) (50.0%)
Distribution expenses ($m) (30) (36) (16.7%) (30) (49) (38.8%)
EBITDA ($m) 118 134 (11.9%) 118 192 (38.5%)
Operating Profit ($m) 84 88 (4.5%) 84 133 (36.8%)
EBITDA Margin, % 40.8% 37.6% 3.2 ppts 40.8% 33.9% 6.9 ppts
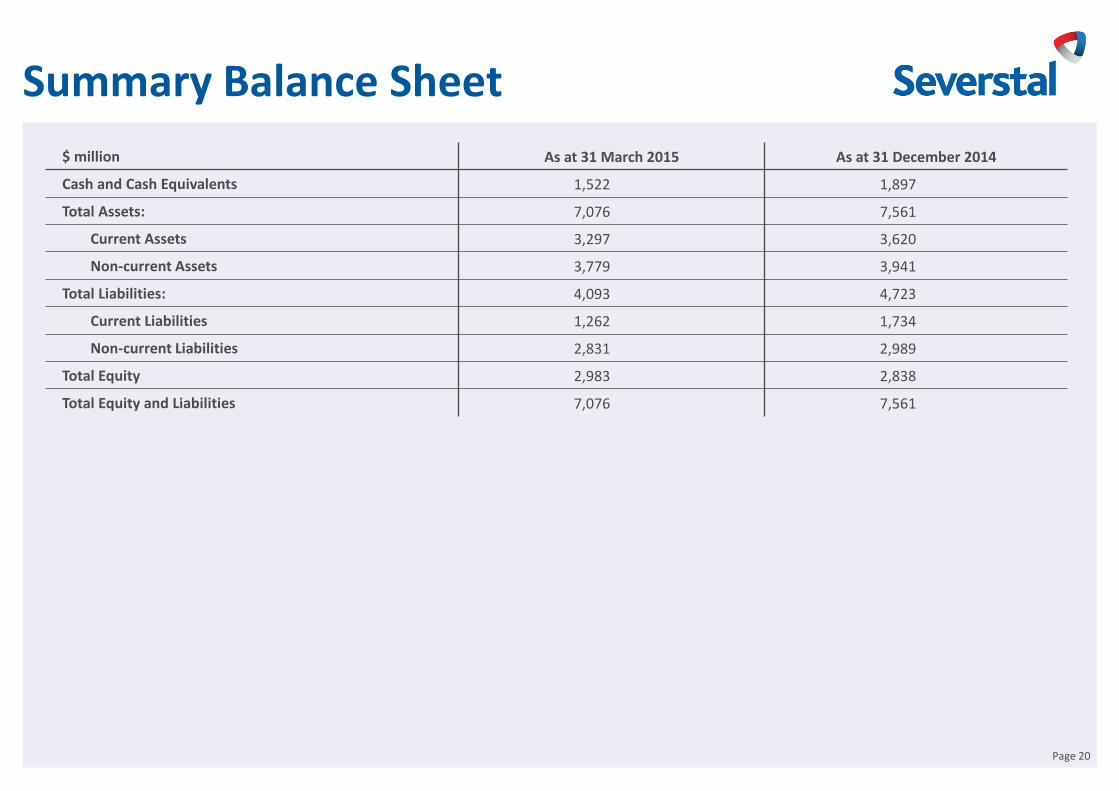
Summary Balance Sheet
$ million As at 31 March 2015 As at 31 December 2014
Cash and Cash Equivalents 1,522 1,897
Total Assets: 7,076 7,561
Current Assets 3,297 3,620
Non-current Assets 3,779 3,941
Total Liabilities: 4,093 4,723
Current Liabilities 1,262 1,734
Non-current Liabilities 2,831 2,989
Total Equity 2,983 2,838
Total Equity and Liabilities 7,076 7,561
Page 20

Summary Cash Flow Statement
$ million Q1 2015 Q4 2014 Q1 2015 Q1 2014*
Profit before Financing and Taxation 488 290 488 289
Cash Generated from Operations 323 612 323 538
Interest Paid (42) (57) (42) (35)
Income Tax Paid (4) (9) (4) (8)
Net cash from Operating Activities - continuing operations 277 546 277 495
Net cash used in Operating Activities - discontinued operation (14) (15) (14) (7)
Net cash from Operating Activities 263 531 263 488
Net cash used in Investing Activities - continuing operations (68) (101) (68) (237)
Net cash used in Investing Activities - discontinued operation - - - (14)
Total cash used in Investing Activites, incl. (68) (101) (68) (251)
Additions to PP&E and IA (103) (157) (103) (251)
Free Cash Flow** 209 425 209 256
Cash (used in)/from Financing Activities - continuing operations (554) (1,035) (554) 120
Cash from/(used in) Financing Activities - discontinued operation - 1 - (478)
Cash used in Financing Activities (554) (1,034) (554) (358)
Effect of Exchange Rate on Cash and Cash Equivalents (16) (252) (16) (23)
Net decrease in Cash and Cash Equivalents (375) (856) (375) (144)
Cash and Cash Equivalents at beginning of the Period 1,897 2,753 1,897 1,036
Cash and Cash Equivalents at end of the Period 1,522 1,897 1,522 892
Page 21
* These amounts reflect adjustments made in connection with the presentation of the discontinued operation ** Free cash flow excludes discontinued operation

Disclaimer
These materials are confidential and have been prepared by PAO Severstal (Severstal) solely for your
information and may not be reproduced, retransmitted or further distributed to any other person or
published, in whole or in part, for any other purpose.
These materials may contain projections and other forward-looking statements regarding future
events or the future financial performance of Severstal. You can identify forward-looking statements
by terms such as “expect,” “believe,” “estimate,” “intend,” “will,” “could,” “may” or “might”, or other
similar expressions. Severstal cautions you that these statements are only predictions and that actual
events or results may differ materially. Severstal will not update these statements to reflect events
and circumstances occurring after the date hereof. Factors that could cause the actual results to differ
materially from those contained in projections or forward-looking statements of Severstal may
include, among others, general economic and competitive environment conditions in the markets in
which Severstal operates, market change in the steel and mining industries, as well as many other risks
affecting Severstal and its operations.
These materials do not constitute or form part of any advertisement of securities, any offer or
invitation to sell or issue or any solicitation of any offer to purchase or subscribe for, any securities of
Severstal in any jurisdiction, nor shall they or any part of them nor the fact of their presentation,
communication or distribution form the basis of, or be relied on in connection with, any contract or
investment decision.
No representation or warranty, express or implied, is given by Severstal, its affiliates or any of their
respective advisers, officers, employees or agents, as to the accuracy of the information or opinions or
for any loss howsoever arising, directly or indirectly, from any use of these materials or their contents.
Page 22