Embed Size (px)
Citation preview

Q1 2014 – BUSINESS AND FINANCIAL UPDATE
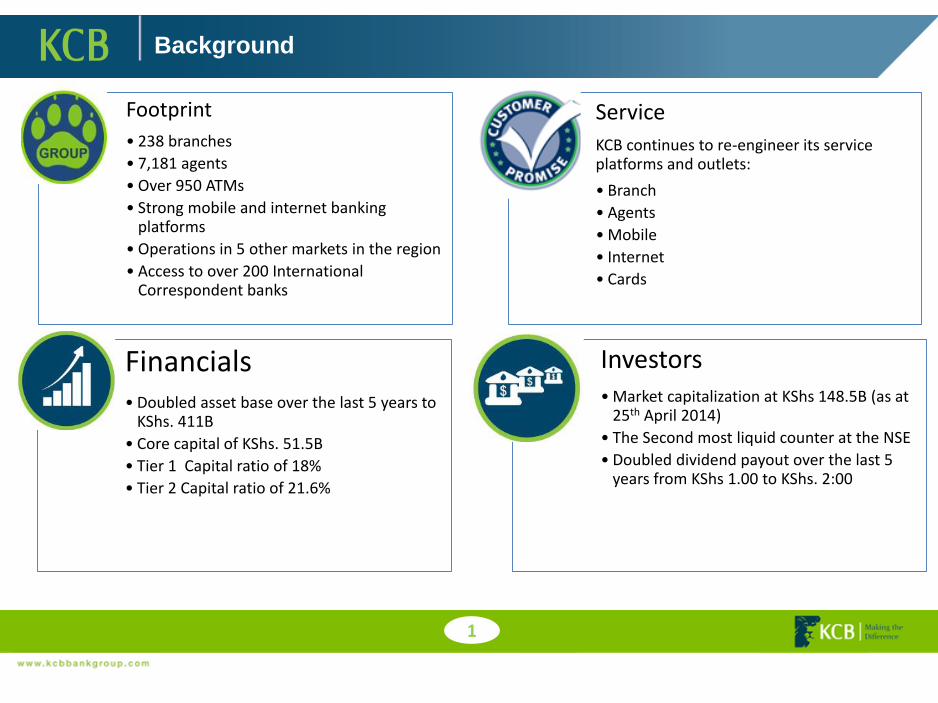
Background
1
Footprint
• 238 branches
• 7,181 agents
• Over 950 ATMs
• Strong mobile and internet banking platforms
• Operations in 5 other markets in the region
• Access to over 200 International Correspondent banks
Service
KCB continues to re-engineer its service platforms and outlets:
• Branch
• Agents
• Mobile
• Internet
• Cards
Financials• Doubled asset base over the last 5 years to
KShs. 411B
• Core capital of KShs. 51.5B
• Tier 1 Capital ratio of 18%
• Tier 2 Capital ratio of 21.6%
Investors• Market capitalization at KShs 148.5B (as at
25th April 2014)
• The Second most liquid counter at the NSE
• Doubled dividend payout over the last 5 years from KShs 1.00 to KShs. 2:00
MACRO-ECONOMIC ENVIRONMENT
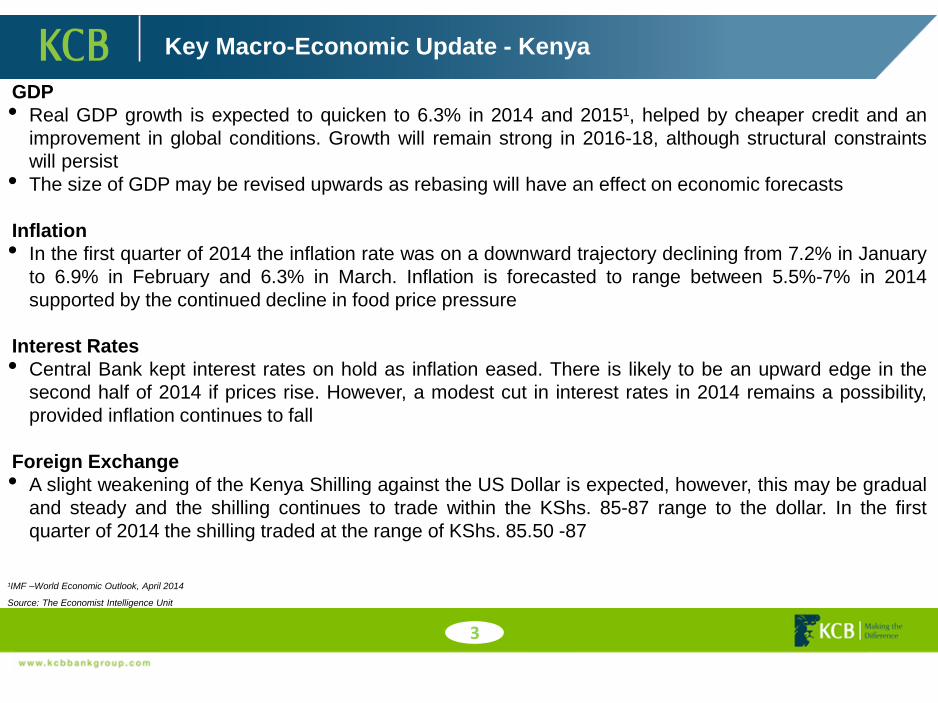
Key Macro-Economic Update - Kenya
3
GDP
• Real GDP growth is expected to quicken to 6.3% in 2014 and 2015¹, helped by cheaper credit and an
improvement in global conditions. Growth will remain strong in 2016-18, although structural constraints
will persist
• The size of GDP may be revised upwards as rebasing will have an effect on economic forecasts
Inflation
• In the first quarter of 2014 the inflation rate was on a downward trajectory declining from 7.2% in January
to 6.9% in February and 6.3% in March. Inflation is forecasted to range between 5.5%-7% in 2014
supported by the continued decline in food price pressure
Interest Rates
• Central Bank kept interest rates on hold as inflation eased. There is likely to be an upward edge in the
second half of 2014 if prices rise. However, a modest cut in interest rates in 2014 remains a possibility,
provided inflation continues to fall
Foreign Exchange
• A slight weakening of the Kenya Shilling against the US Dollar is expected, however, this may be gradual
and steady and the shilling continues to trade within the KShs. 85-87 range to the dollar. In the first
quarter of 2014 the shilling traded at the range of KShs. 85.50 -87
¹IMF –World Economic Outlook, April 2014
Source: The Economist Intelligence Unit

Key Macro-Economic Update - Kenya
4
Source: CBK
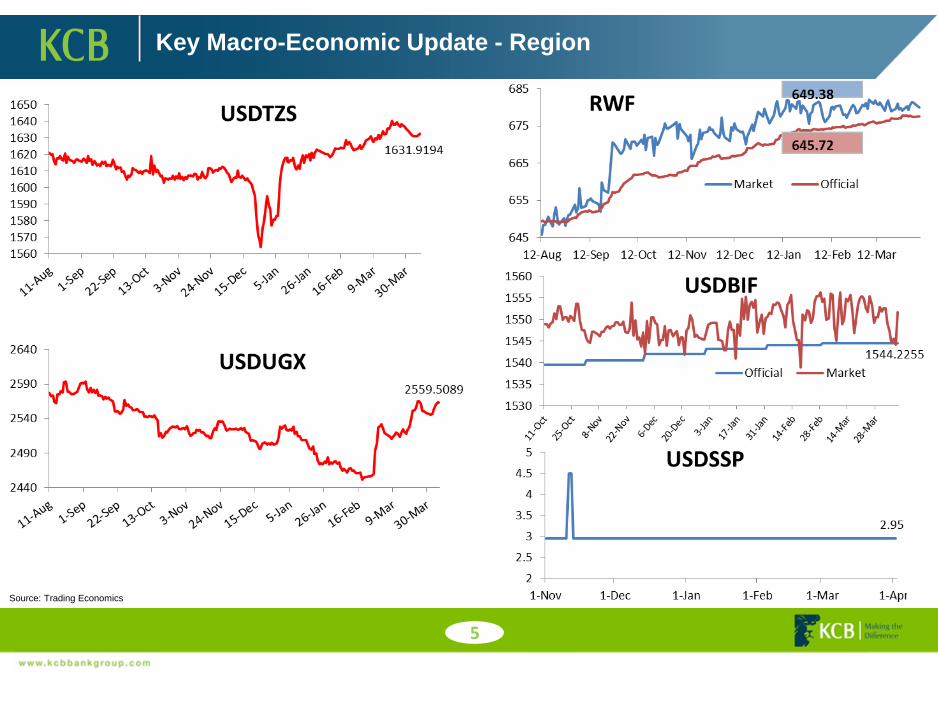
Key Macro-Economic Update - Region
5
Source: Trading Economics
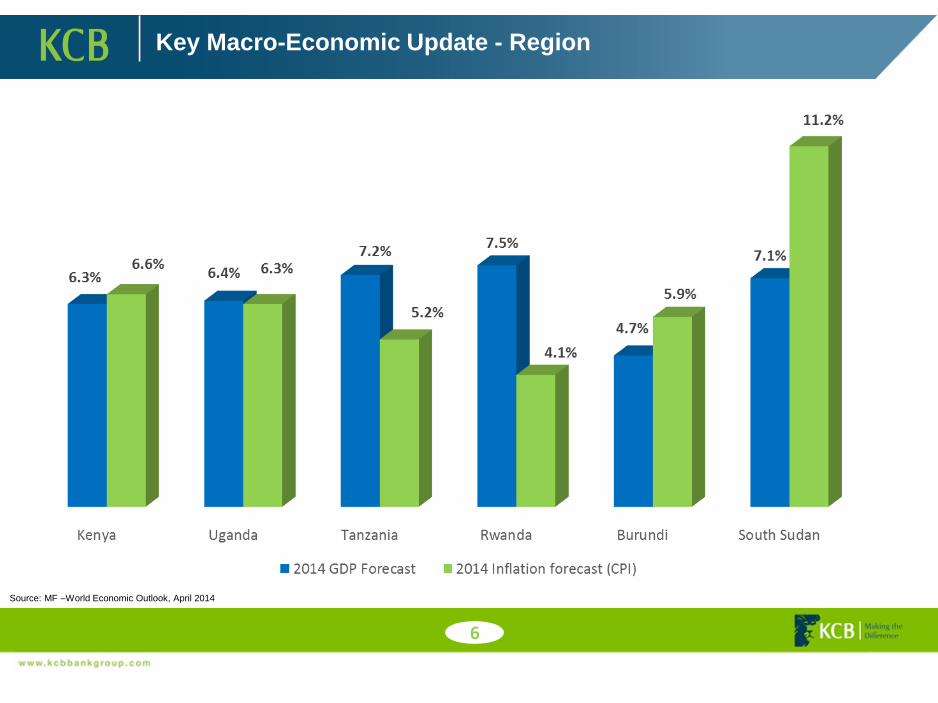
Key Macro-Economic Update - Region
6
Source: MF –World Economic Outlook, April 2014
• Sub Sahara Africa: inflation is expected to continue its downward trend as food and energy prices
remain low, which combined with steadily rising remittances should stimulate household consumption
and permit a continued rapid expansion of domestic demand
• GDP growth in Sub-Saharan Africa to accelerate to 5.5 percent in 2014, up from 4.9 percent last year
• A modest fiscal consolidation is projected to start in 2014; but fiscal deficits will remain elevated as
governments maintain their investment programs while revenue stays low. Current account deficits are
projected to widen in 2014-15, before narrowing in 2016 as import growth decelerates and export
capacity strengthens
• Globally, The U.S. Federal Reserve taper of asset purchases is not expected to have a major impact
on countries (except South Africa) in the region owing to their limited integration in global financial
markets
• Frontier market countries that have seen significant portfolio inflows in local securities markets would
also be affected by the reversal of capital flows; and countries that are planning to tap the international
bond markets are likely to face higher coupon rates
Source: The Economist Intelligence Unit
7
Key Macro-Economic Update - Global
KEY STRATEGIC THEMES
KEY STRATEGIC THEMES
9
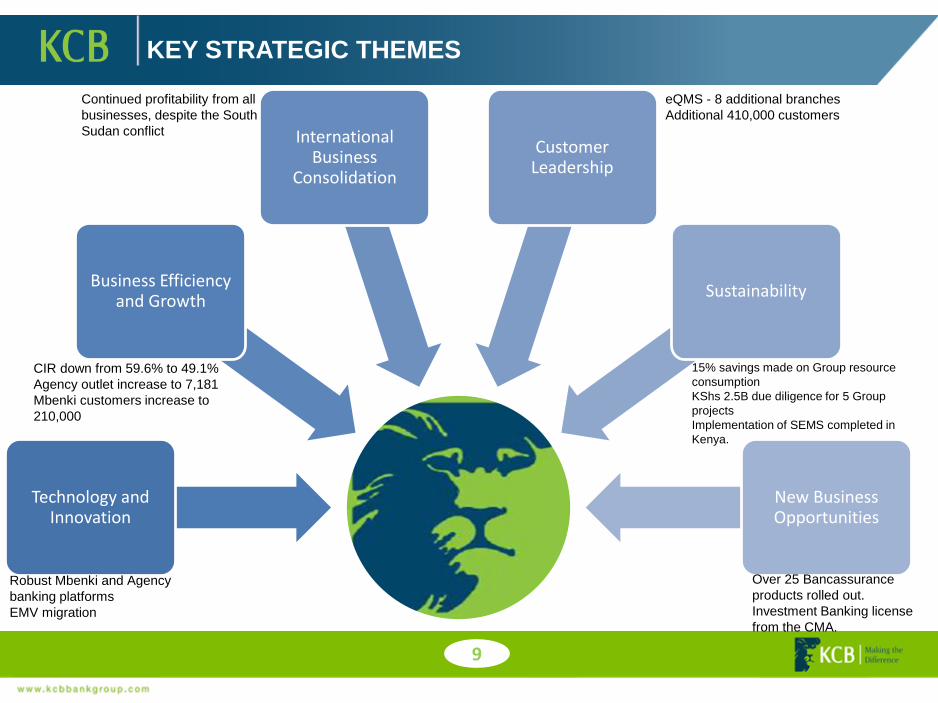
Technology and Innovation
Business Efficiency and Growth
International Business
Consolidation
Customer Leadership
Sustainability
New Business Opportunities
eQMS - 8 additional branches
Additional 410,000 customers
Robust Mbenki and Agency
banking platforms
EMV migration
CIR down from 59.6% to 49.1%
Agency outlet increase to 7,181
Mbenki customers increase to
210,000
Continued profitability from all
businesses, despite the South
Sudan conflict
15% savings made on Group resource
consumption
KShs 2.5B due diligence for 5 Group
projects
Implementation of SEMS completed in
Kenya.
Over 25 Bancassurance
products rolled out.
Investment Banking license
from the CMA.
Technology & Innovation driving Q1 growth
10
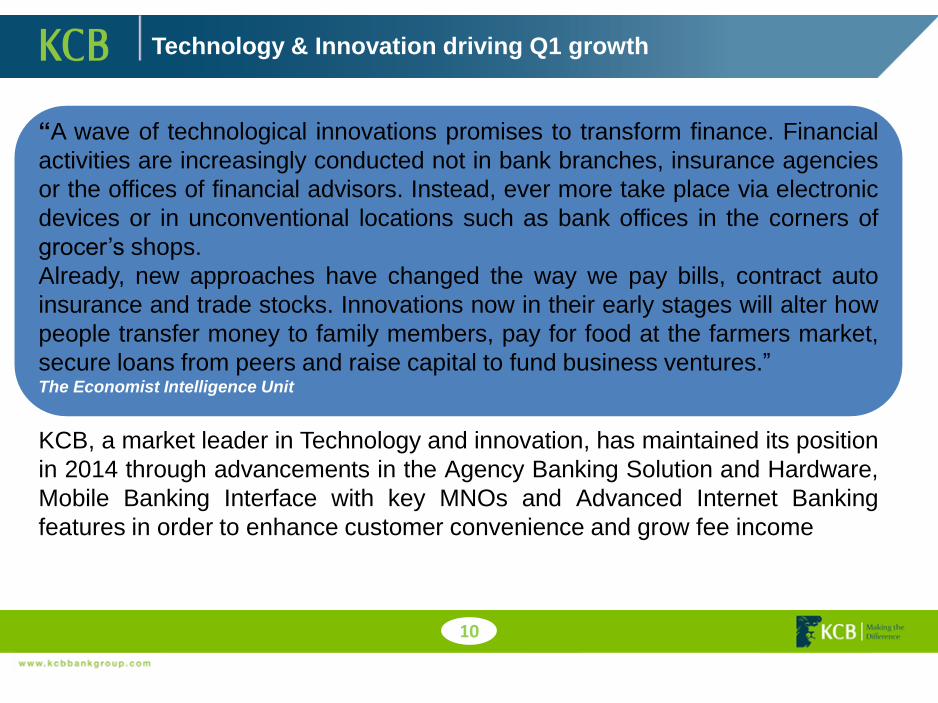
“A wave of technological innovations promises to transform finance. Financial
activities are increasingly conducted not in bank branches, insurance agencies
or the offices of financial advisors. Instead, ever more take place via electronic
devices or in unconventional locations such as bank offices in the corners of
grocer’s shops.
Already, new approaches have changed the way we pay bills, contract auto
insurance and trade stocks. Innovations now in their early stages will alter how
people transfer money to family members, pay for food at the farmers market,
secure loans from peers and raise capital to fund business ventures.”The Economist Intelligence Unit
KCB, a market leader in Technology and innovation, has maintained its position
in 2014 through advancements in the Agency Banking Solution and Hardware,
Mobile Banking Interface with key MNOs and Advanced Internet Banking
features in order to enhance customer convenience and grow fee income
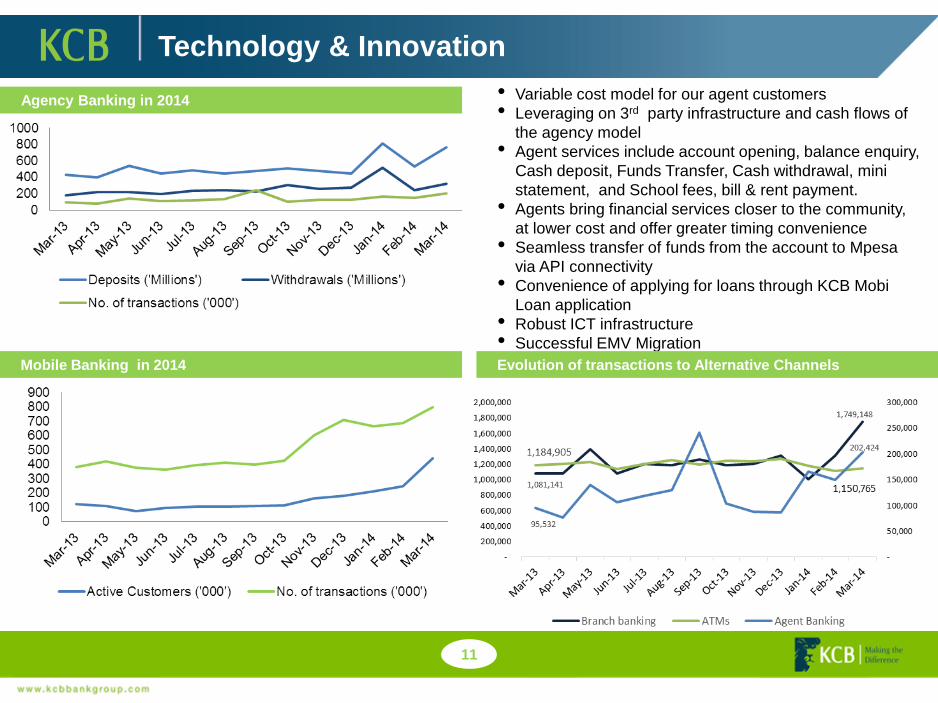
Technology & Innovation
Mobile Banking in 2014
• Variable cost model for our agent customers
• Leveraging on 3rd party infrastructure and cash flows of
the agency model
• Agent services include account opening, balance enquiry,
Cash deposit, Funds Transfer, Cash withdrawal, mini
statement, and School fees, bill & rent payment.
• Agents bring financial services closer to the community,
at lower cost and offer greater timing convenience
• Seamless transfer of funds from the account to Mpesa
via API connectivity
• Convenience of applying for loans through KCB Mobi
Loan application
• Robust ICT infrastructure
• Successful EMV Migration
Agency Banking in 2014
11
Evolution of transactions to Alternative Channels
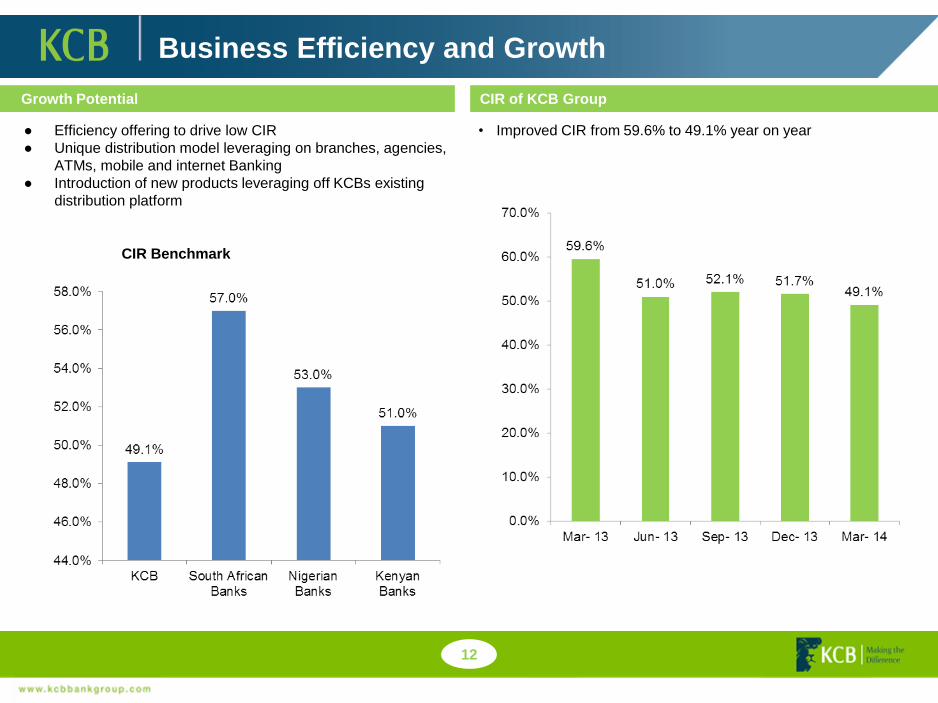
Business Efficiency and Growth
● Efficiency offering to drive low CIR
● Unique distribution model leveraging on branches, agencies,
ATMs, mobile and internet Banking
● Introduction of new products leveraging off KCBs existing
distribution platform
Growth Potential
12
CIR Benchmark
CIR of KCB Group
• Improved CIR from 59.6% to 49.1% year on year
50% market
share-South
Sudan
15% market
share-Kenya
3% market share-
Tanzania
3% market share-
Uganda
2.1% market
share-Burundi
8% market
share-Rwanda
Consolidation of Regional Businesses
Total Assets Contribution
Kenya 80.2%
Uganda 4.5%Tanzania 3.4%
Rwanda 2.4% Burundi 0.6%
Uganda 3.0%
Tanzania 3.0%
Rwanda 3.0%
Burundi 1.0%
Total Revenue Contribution
South Sudan 8.0%
Kenya 83.0%
South Sudan 8.9%
13
Burundi 0.1%
Rwanda 0.7%
Uganda 1.1%
Tanzania 0.5%
South Sudan 8.7%
Kenya 88.9%
PBT Contribution
● Focus on High margin lending – specifically to the SME,
Micro and Personal segments
● Improved customer leadership through improved services
and system uptime
● Deliberate action to achieve Social, Financial, Economic and
Environmental sustainability
● Talent maximization through embedding a culture of
performance and productivity
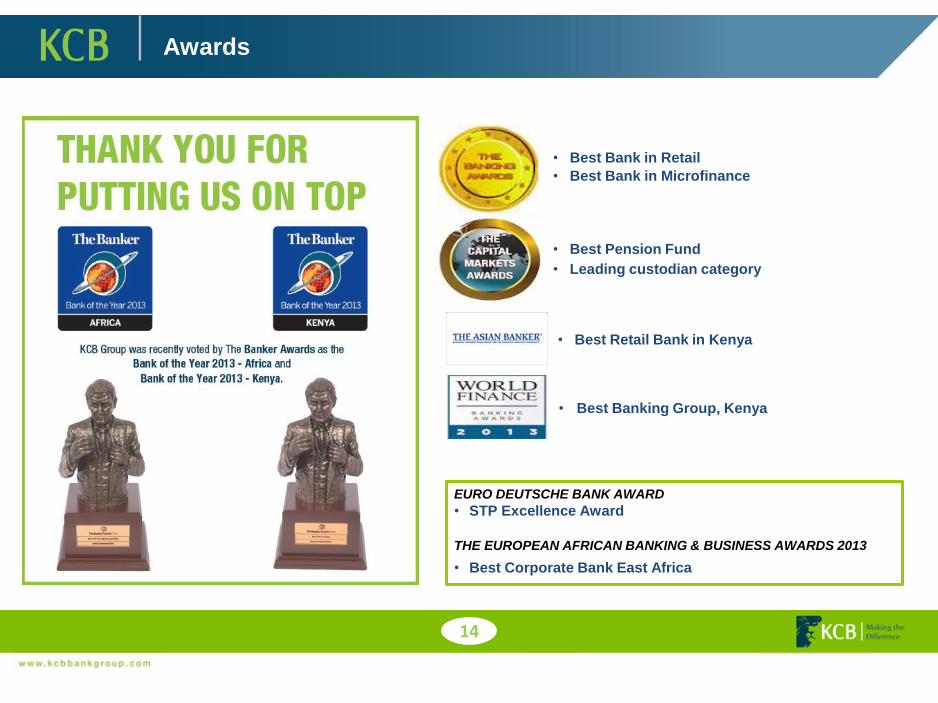
Awards
14
• Best Retail Bank in Kenya
• Best Bank in Retail
• Best Bank in Microfinance
• Best Banking Group, Kenya
• Best Pension Fund
• Leading custodian category
EURO DEUTSCHE BANK AWARD
• STP Excellence Award
THE EUROPEAN AFRICAN BANKING & BUSINESS AWARDS 2013
• Best Corporate Bank East Africa
Q1 FINANCIAL RESULTS
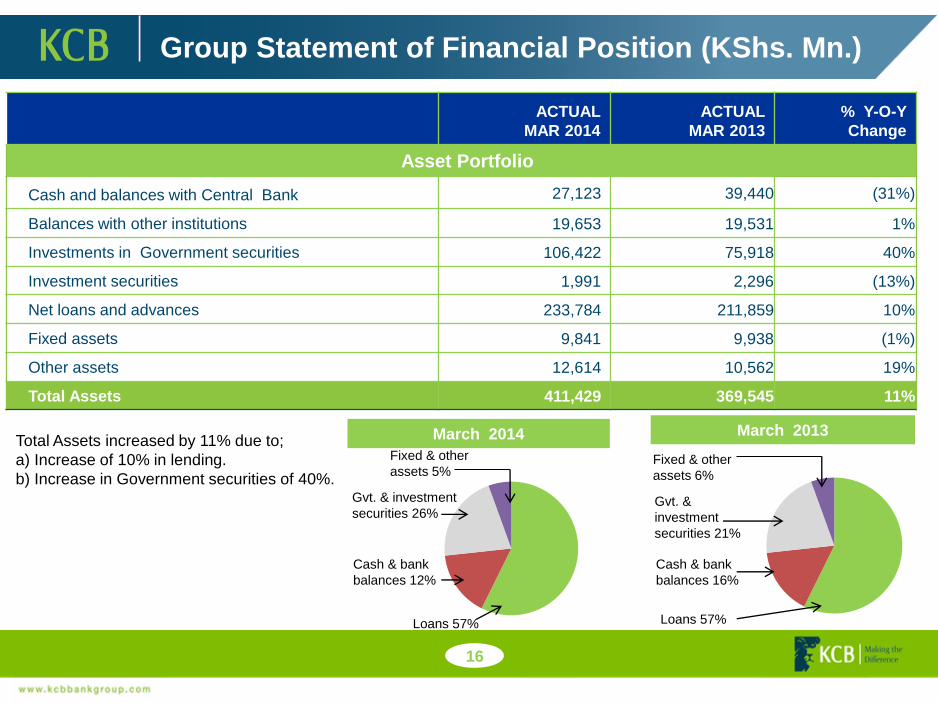
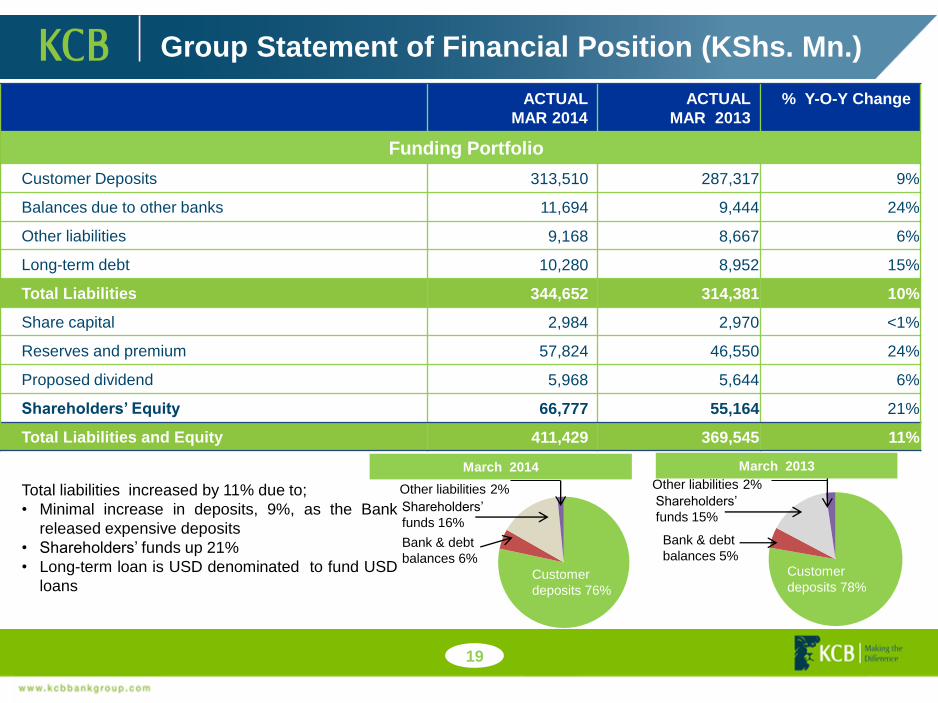
Group Statement of Financial Position (KShs. Mn.)
ACTUAL
MAR 2014
ACTUAL
MAR 2013
% Y-O-Y
Change
Asset Portfolio
Cash and balances with Central Bank 27,123 39,440 (31%)
Balances with other institutions 19,653 19,531 1%
Investments in Government securities 106,422 75,918 40%
Investment securities 1,991 2,296 (13%)
Net loans and advances 233,784 211,859 10%
Fixed assets 9,841 9,938 (1%)
Other assets 12,614 10,562 19%
Total Assets 411,429 369,545 11%
Total Assets increased by 11% due to;
a) Increase of 10% in lending.
b) Increase in Government securities of 40%.
March 2013
Fixed & other
assets 5%
Gvt. & investment
securities 26%
Cash & bank
balances 12%
Loans 57%
March 2014
16
Fixed & other
assets 6%
Gvt. &
investment
securities 21%
Cash & bank
balances 16%
Loans 57%
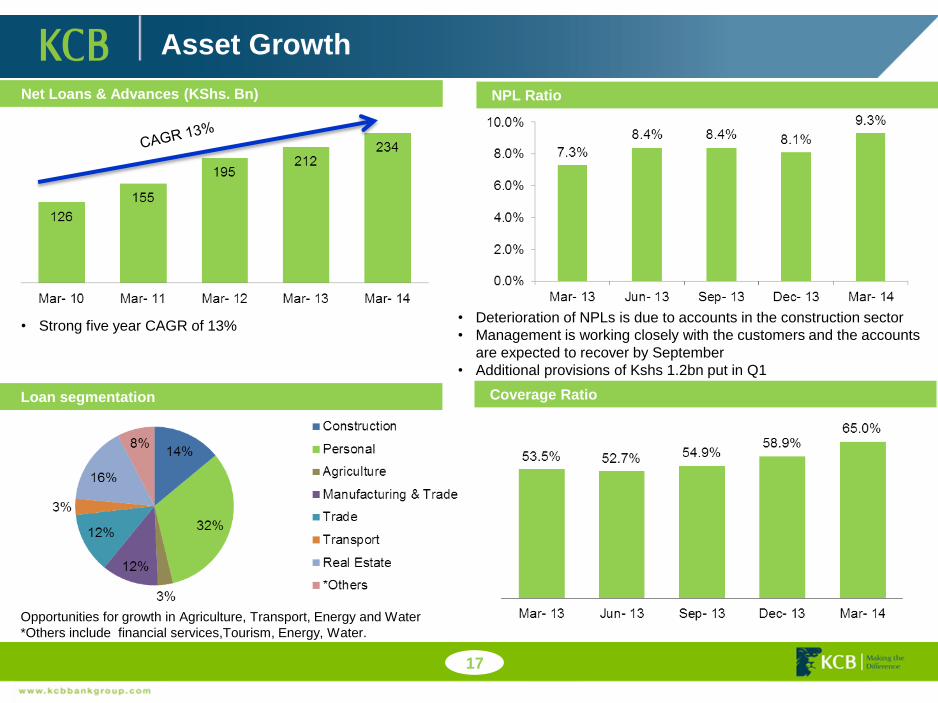
Asset Growth
• Strong five year CAGR of 13%• Deterioration of NPLs is due to accounts in the construction sector
• Management is working closely with the customers and the accounts
are expected to recover by September
• Additional provisions of Kshs 1.2bn put in Q1
Net Loans & Advances (KShs. Bn)
Opportunities for growth in Agriculture, Transport, Energy and Water
*Others include financial services,Tourism, Energy, Water.
**
NPL Ratio
Loan segmentation Coverage Ratio
17
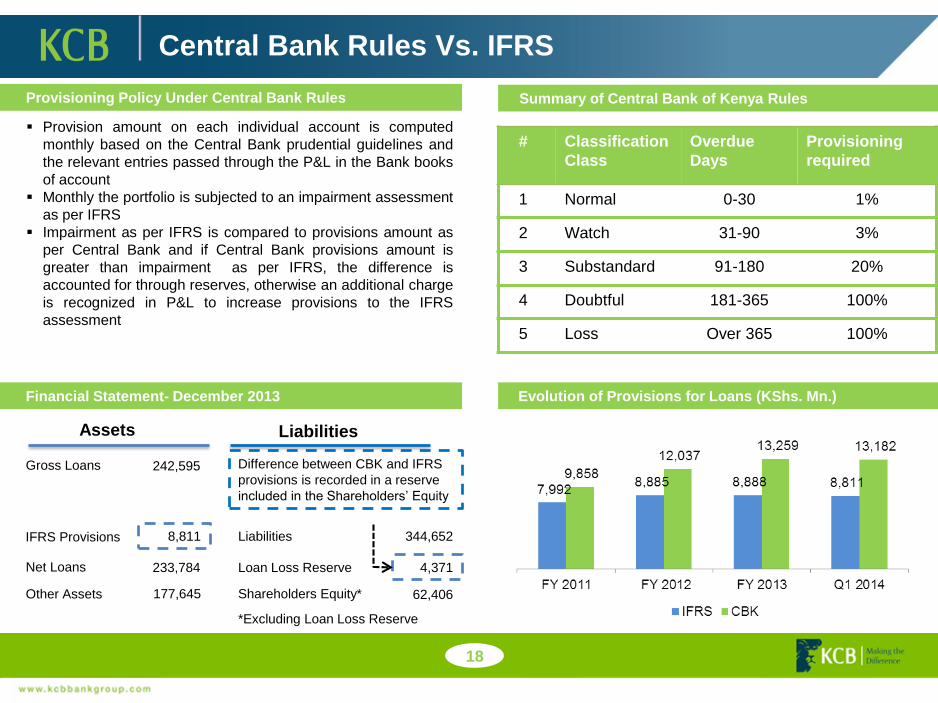
Central Bank Rules Vs. IFRS
Provisioning Policy Under Central Bank Rules
Financial Statement- December 2013
4.2
8.510.1
Evolution of Provisions for Loans (KShs. Mn.)
Provision amount on each individual account is computed
monthly based on the Central Bank prudential guidelines and
the relevant entries passed through the P&L in the Bank books
of account
Monthly the portfolio is subjected to an impairment assessment
as per IFRS
Impairment as per IFRS is compared to provisions amount as
per Central Bank and if Central Bank provisions amount is
greater than impairment as per IFRS, the difference is
accounted for through reserves, otherwise an additional charge
is recognized in P&L to increase provisions to the IFRS
assessment
Summary of Central Bank of Kenya Rules
# Classification
Class
Overdue
Days
Provisioning
required
1 Normal 0-30 1%
2 Watch 31-90 3%
3 Substandard 91-180 20%
4 Doubtful 181-365 100%
5 Loss Over 365 100%
Assets Liabilities
Gross Loans
IFRS Provisions
Net Loans
Other Assets
8,811
Difference between CBK and IFRS
provisions is recorded in a reserve
included in the Shareholders’ Equity
Liabilities
Loan Loss Reserve
Shareholders Equity*
344,652
4,371
62,406
*Excluding Loan Loss Reserve
242,595
233,784
177,645
18
Group Statement of Financial Position (KShs. Mn.)
ACTUAL
MAR 2014
ACTUAL
MAR 2013
% Y-O-Y Change
Funding Portfolio
Customer Deposits 313,510 287,317 9%
Balances due to other banks 11,694 9,444 24%
Other liabilities 9,168 8,667 6%
Long-term debt 10,280 8,952 15%
Total Liabilities 344,652 314,381 10%
Share capital 2,984 2,970 <1%
Reserves and premium 57,824 46,550 24%
Proposed dividend 5,968 5,644 6%
Shareholders’ Equity 66,777 55,164 21%
Total Liabilities and Equity 411,429 369,545 11%
Total liabilities increased by 11% due to;
• Minimal increase in deposits, 9%, as the Bank
released expensive deposits
• Shareholders’ funds up 21%
• Long-term loan is USD denominated to fund USD
loansCustomer
deposits 78%
Bank & debt
balances 5%
Shareholders’
funds 15%
Other liabilities 2%
Customer
deposits 76%
Bank & debt
balances 6%
Shareholders’
funds 16%
Other liabilities 2%
19
March 2013March 2014
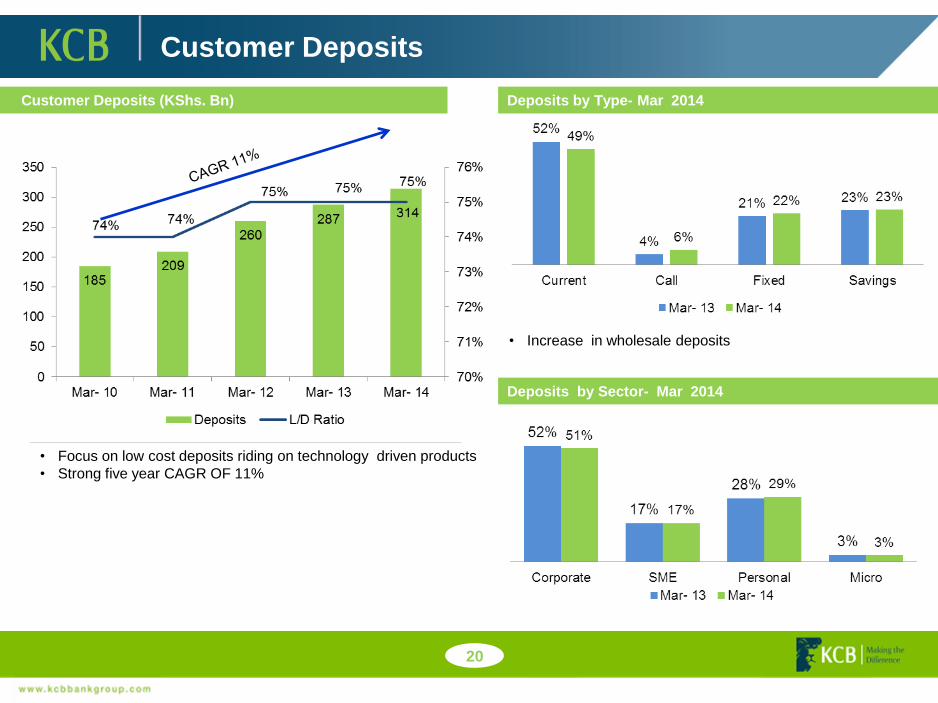
Customer Deposits
• Increase in wholesale deposits
Customer Deposits (KShs. Bn) Deposits by Type- Mar 2014
• Focus on low cost deposits riding on technology driven products
• Strong five year CAGR OF 11%
Deposits by Sector- Mar 2014
20
24.8%
25.8%
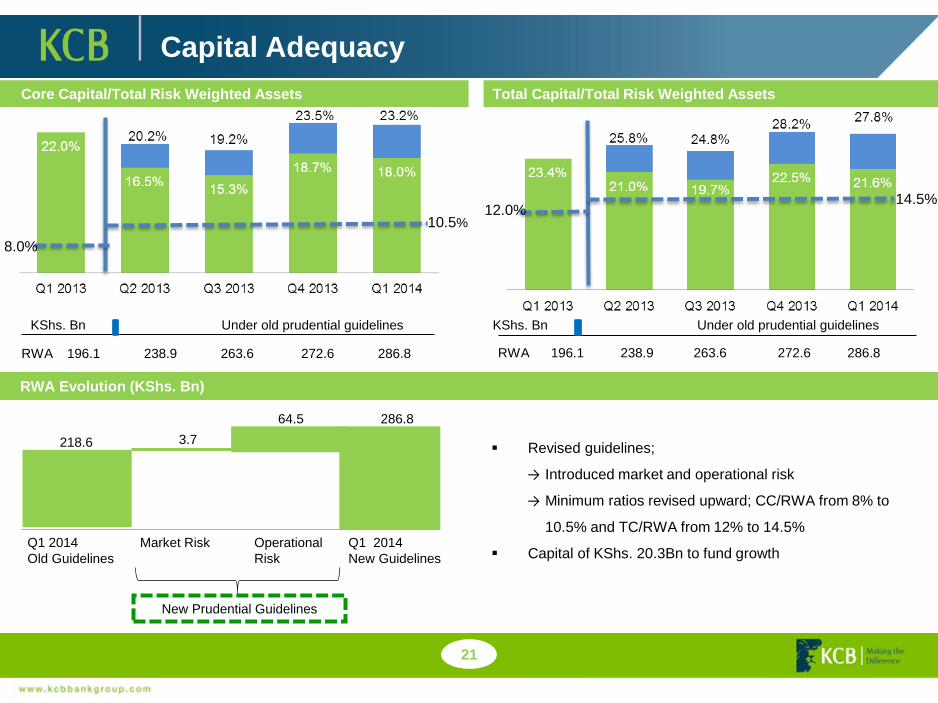
Capital Adequacy
KShs. Bn
RWA 196.1 238.9 263.6 272.6 286.8
Core Capital/Total Risk Weighted Assets
KShs. Bn
Total Capital/Total Risk Weighted Assets
Revised guidelines;
→ Introduced market and operational risk
→ Minimum ratios revised upward; CC/RWA from 8% to
10.5% and TC/RWA from 12% to 14.5%
Capital of KShs. 20.3Bn to fund growth
RWA Evolution (KShs. Bn)
Q1 2014
Old Guidelines
Market Risk Operational
Risk
Q1 2014
New Guidelines
New Prudential Guidelines
218.6 3.7
64.5 286.8
Under old prudential guidelines Under old prudential guidelines
21
RWA 196.1 238.9 263.6 272.6 286.8
10.5%
8.0%
12.0%14.5%
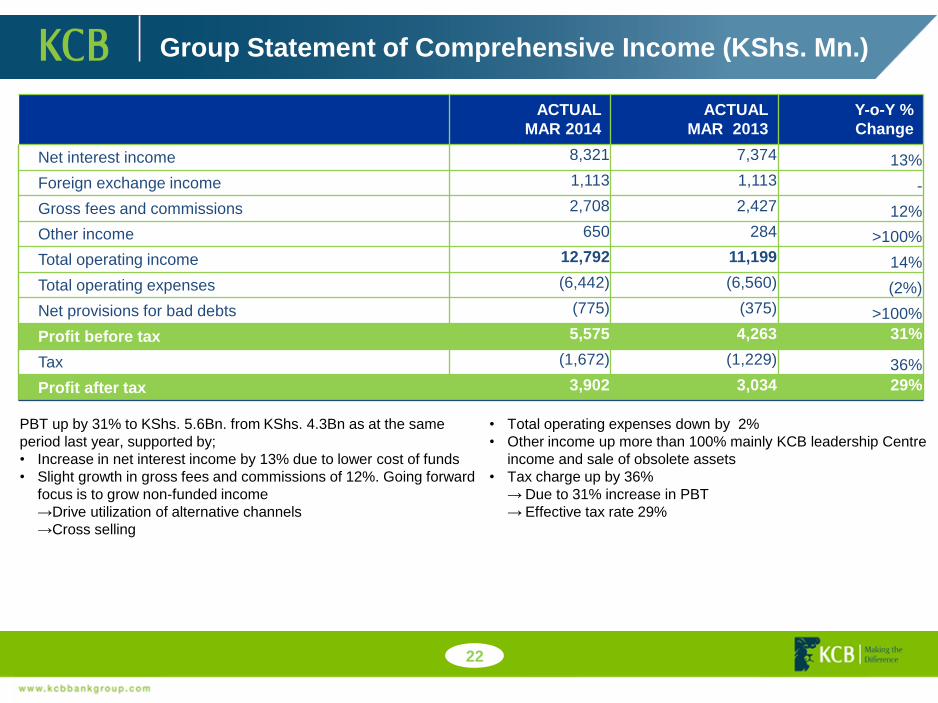
Group Statement of Comprehensive Income (KShs. Mn.)
ACTUAL
MAR 2014
ACTUAL
MAR 2013
Y-o-Y %
Change
Net interest income 8,321 7,374 13%
Foreign exchange income 1,113 1,113 -
Gross fees and commissions 2,708 2,427 12%
Other income 650 284 >100%
Total operating income 12,792 11,199 14%
Total operating expenses (6,442) (6,560) (2%)
Net provisions for bad debts (775) (375) >100%
Profit before tax 5,575 4,263 31%
Tax (1,672) (1,229) 36%
Profit after tax 3,902 3,034 29%
PBT up by 31% to KShs. 5.6Bn. from KShs. 4.3Bn as at the same
period last year, supported by;
• Increase in net interest income by 13% due to lower cost of funds
• Slight growth in gross fees and commissions of 12%. Going forward
focus is to grow non-funded income
→Drive utilization of alternative channels
→Cross selling
• Total operating expenses down by 2%
• Other income up more than 100% mainly KCB leadership Centre
income and sale of obsolete assets
• Tax charge up by 36%
→ Due to 31% increase in PBT
→ Effective tax rate 29%
22
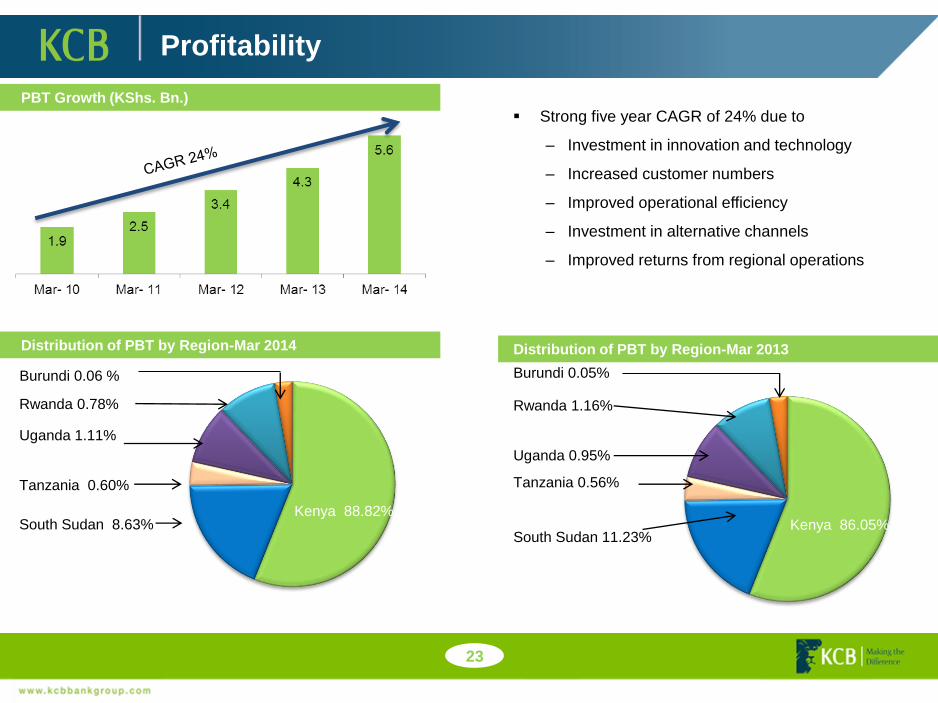
Profitability
Strong five year CAGR of 24% due to
‒ Investment in innovation and technology
‒ Increased customer numbers
‒ Improved operational efficiency
‒ Investment in alternative channels
‒ Improved returns from regional operations
Burundi 0.06 %
PBT Growth (KShs. Bn.)
Distribution of PBT by Region-Mar 2014
8.5
Rwanda 0.78%
Uganda 1.11%
Tanzania 0.60%
South Sudan 8.63%
Kenya 89.3%
Distribution of PBT by Region-Mar 2013
Burundi 0.05%
Rwanda 1.16%
Uganda 0.95%
Tanzania 0.56%
South Sudan 11.23%Kenya 86.05%
23
Kenya 88.82%
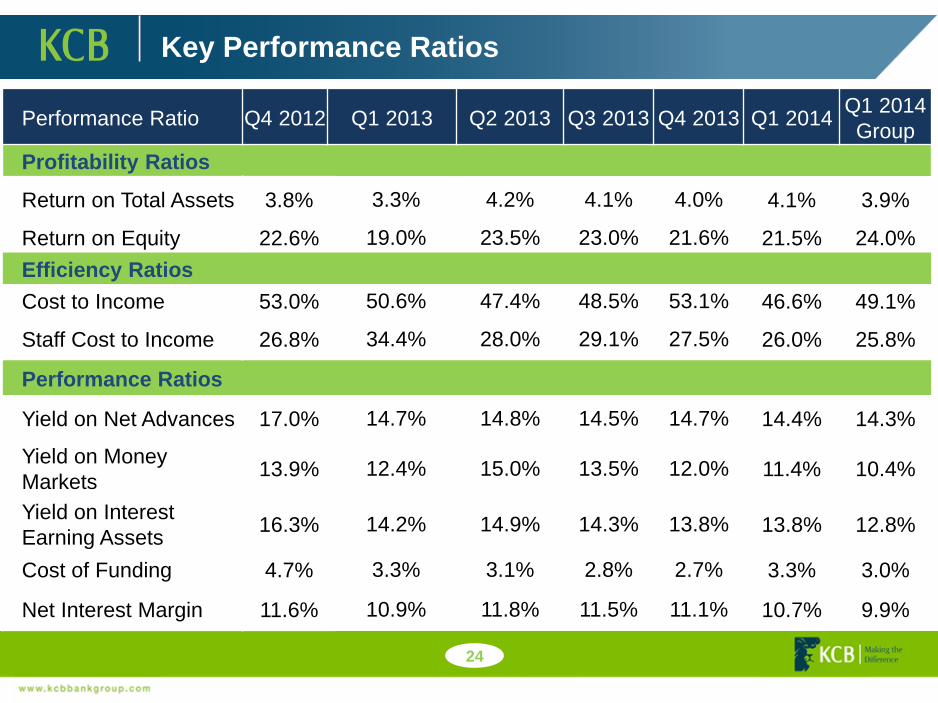
Key Performance Ratios
24
Performance Ratio Q4 2012 Q1 2013 Q2 2013 Q3 2013 Q4 2013 Q1 2014Q1 2014
Group
Profitability Ratios
Return on Total Assets 3.8% 3.3% 4.2% 4.1% 4.0% 4.1% 3.9%
Return on Equity 22.6% 19.0% 23.5% 23.0% 21.6% 21.5% 24.0%
Efficiency Ratios
Cost to Income 53.0% 50.6% 47.4% 48.5% 53.1% 46.6% 49.1%
Staff Cost to Income 26.8% 34.4% 28.0% 29.1% 27.5% 26.0% 25.8%
Performance Ratios
Yield on Net Advances 17.0% 14.7% 14.8% 14.5% 14.7% 14.4% 14.3%
Yield on Money
Markets13.9% 12.4% 15.0% 13.5% 12.0% 11.4% 10.4%
Yield on Interest
Earning Assets16.3% 14.2% 14.9% 14.3% 13.8% 13.8% 12.8%
Cost of Funding 4.7% 3.3% 3.1% 2.8% 2.7% 3.3% 3.0%
Net Interest Margin 11.6% 10.9% 11.8% 11.5% 11.1% 10.7% 9.9%
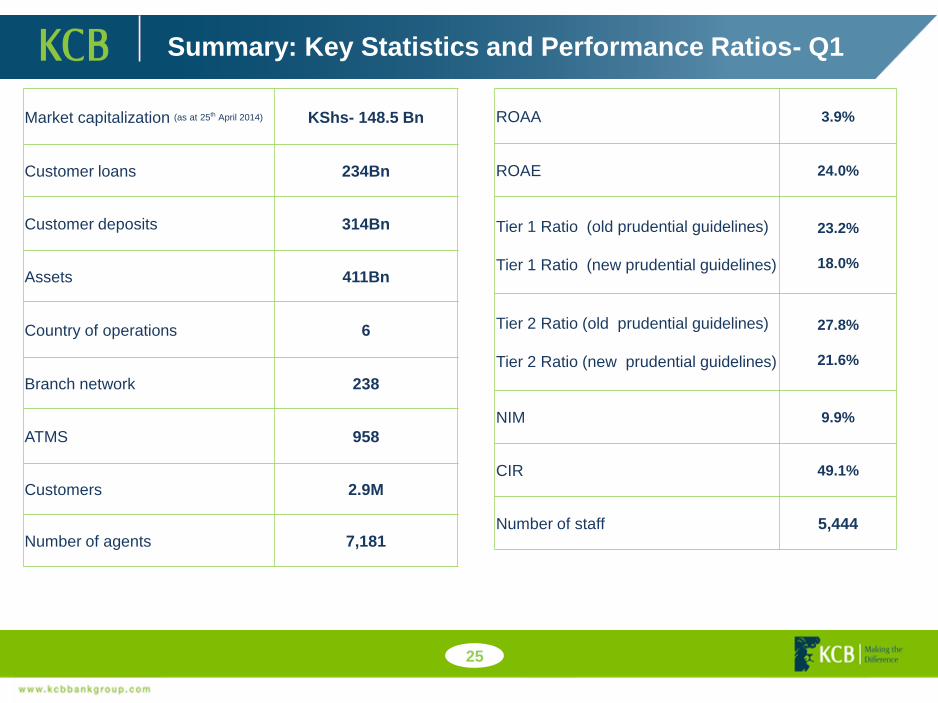
Summary: Key Statistics and Performance Ratios- Q1
25
Market capitalization (as at 25th April 2014) KShs- 148.5 Bn
Customer loans 234Bn
Customer deposits 314Bn
Assets 411Bn
Country of operations 6
Branch network 238
ATMS 958
Customers 2.9M
Number of agents 7,181
ROAA 3.9%
ROAE 24.0%
Tier 1 Ratio (old prudential guidelines)
Tier 1 Ratio (new prudential guidelines)
23.2%
18.0%
Tier 2 Ratio (old prudential guidelines)
Tier 2 Ratio (new prudential guidelines)
27.8%
21.6%
NIM 9.9%
CIR 49.1%
Number of staff 5,444
THANK YOU