Embed Size (px)
Citation preview

Q
Industry~ Trade Summary Soaps, Detergents, and Surface-Active Agents
USITC Publication 2458 (CH-1) November 1991
OFFICE OF INDUSTRIES U.S. International Trade Commission Washington, DC 20436

UNITED STATES INTERNATIONAL TRADE COMMISSION
COMMISSIONERS
Anne E. Brunsdale, Acting Chairman
Seeley G. Lodwick David B. Rohr
Don E. Newquist
Office of Operations Charles W. Ervin, Director
Office of Industries Robert A. Rogowsky, Director
This report was prepared principally by
Eric Land
Energy, Petroleum, Benzenoid Chemicals, and Rubber and Plastics Branch Energy and Chemicals DivisiOn
Addr~ all communications to Kenneth R. Mason, Secretary to the Commission United States International Trade Commission
Washington, DC 20436

PREFACE
In 1991 the United States International Trade Commission initiated its current Industry and Trade Summary series of informational reports on the thousands of products imported into and exported from the United States. Each summary addresses a different commodity/industry area and contains information on product uses, U.S. and foreign producers, and customs treatment Also included is an analysis of the basic factors affecting trends in consumption, production, and trade of the commodity, as well as those bearing on the competitiveness of U.S. industries in domestic and foreign markets.1 · ·
This report on soaps, detergents, and surface-active agents covers the period 1986 through 1990 and represents one of approximately 250-300 individual reports to be produced in this series during the first half of the 1990s. This is the first individual· summary report published to date on the energy and chemicals sector.
1 The information and analysis provided in this report are for the purpose of this report only. Nothing in this report should be construed to indicate how the Commission would find in an investigation conducted under swutory authority covering the same or similar subject mauer.


CONTENTS
Page
Preface ............................................................................. .
Introduction ......................................................................... .
U.S. industry profile .................................................................. . Industry structure . . . . . . . . . . . . . . . . . . . . . . . . . . . . . . . . . . . . . . . . . . . . . . . . . . . . . . . . . . . . . . . . . . . . 1 Consumer characteristics and factors affecting demand . . . . . . . . . . . . . . . . . . . . . . . . . . . . . . . . . . . . 5
Foreign industry profile . . . . . . . . . . . . . . . . . . . . . . . . . . . . . . . . . . . . . . . . . . . . . . . . . . . . . . . . . . . . . . . 5
U.S. trade measures . . . . . . . . . . . . . . . . . . . . . . . . . . . . . . . . . . . . . . . . . . . . . . . . . . . . . . . . . . . . . . . . . . 6
Foreign trade measures . . . . . . . . . . . . . . . . . . . . . . . . . . . . . . . . . . . . . . . . . . . . . . . . . . . . . . . . . . . . . . . 6
U.S. market.......................................................................... 6 Consumption . . . . . . . . . . . . . . . . . . . . . . . . . . . . . . . . . . . . . . . . . . . . . . . . . . . . . . . . . . . . . . . . . . . . . . . . 6 Production ...... ; . . . . . . . . . . . . . . . . . . . . . . . . . . . . . . . . . . . . . . . . . . . . . . . . . . . . . . . . . . . . . . . . . . . 11 Imports . . . . . . . . . . . . . . . . . . . . . . . . . . . . . . . . . . . . . . . . . . . . . . . . . . . . . . . . . . . . . . . . . . . . . . . . . . . . 12
Foreign markets ....................................................... :. . . . . . . . . . . . . . 12 Foreign market profile· . . . . . . . . . . . . . . . . . . . . . . . . . . . . . . . . . . . . . . . . . . . . . . . . . . . . . . . . . . . . . . . 13 U.S. exports . . . . . . . . . . . . . . . . . . . . . . . . . . . . . . . . . . . . . . . . . . . . . . . . . . . . . . . . . . . . . . . . . . . . . . . . 13
U.S. trade balance . . . . . . . . . . . . . . . . . . . . . . . . . . . . . . . . . . . . . . . . . . . . . . . . . . . . . . . . . . . . . . . . . . . . 14
Appendix A. Explanation of tariff and trade agreement terms . . . . . . . . . . . . . . . . . . . . . . . . . . . . . . . . . . . . . A-1
Figures 1. U.S. soap, detergent, and surface-active agent industry:
Principal raw materials, producer types, major products, and principal consumers . . . . . . . . . . . . . . . . . . . . . . . . . . . . . . . . . . . . . . . . . . . . . . . . . . . . . . . . 2
2. Soaps, detergents, and surface-active agents: U.S. imports, producers' shipments, and apparent consumption . . . . . . . . . . . . . . . . . . . . . . . . . . . . . . . . . . . 10
3. Surface-active agents: U.S. production . . . . . . . . . . . . • . . . . . . . . . . . . . . . . . . . . . . . . . . . . . . . . 12 4. Soaps, detergents, and surface-active agents: Share (percent)
of U.S. exports, by principal market . . . . . . . . . . . . . . . . . . . . . . . . . . . . . . . . . . . . . . . . . . . . . 14
Tables 1. Soaps, detergents, and surface-active agents: Harmonized Tariff
Schedule subheading; description; U.S. col. 1 rate of duty as of Jan. 1, 1991; U.S. exports, 1990; and U.S. imports, 1990 . . . . . . . . . . . . . . . . . . . . . . . . . . 7
2. Soaps, detergents, and surface-active agents: U.S. shipments, exports of domestic merchandise, imports for consumption, and apparent U.S. consumption, 1986-90.......................................... 10
3. Surface-active agents: U.S. production by major category, 1985-89 . . . . . . . . . . . . . . . . . . . . . 11 4. Soaps, detergents, and surface-active agents: U.S. imports for
consumption, by principal source, 1986-90 . . . . . . . . . . . . . . . . . . . . . . . . . . . . . . . . . . . . . . . . 13 5. Soaps, detergents, and surface-active agents: U.S. exports of
domestic merchandise, 1986-90 . . . . . . . . . . . . . . . . . . . . . . . . . . . . . . . . . . . . . . . . . . . . . . . . . . 13 6. Soaps, detergents, and surface-active agents: U.S. exports of
domestic merchandise, imports for consumption, and merchandise trade balance, by selected country, 1986-90 . . . . . . . . . . . . . . . . . . . . . . . . . . . . . . . . . . . . . . . 15
iii


Introduction
This report contains information regarding the soap, detergent, and surface-active agent industry, both in the United States and throughout the world. Most information in this report is provided in a 5-year context.
This summary describes an one of the oldest industries in the world, with documented production dating back approximately 5,000 years. Currently, the international soap, detergent, and surface-active agent industry comprises a multitude of different types of producers. These producers range from large multinational firms that are vertically integrated from the cultivation of plant materials and recovery of necessary components through the manufacture, marketing, and distribution of the final consumer products, to small, cottage-industry producers located in many developing nations where soap-making remains almost as it was 5,000 years ago.
Soap, detergent, and surface-active agent products are among the most commonplace items found in both the home and the workplace throughout the world. Major household products include toilet soap bars, shampoos, and creams used for personal care; as well as laundry and washing detergents, scouring powders, and fabric softeners for common household uses. Numerous non-household products of this industry are used in the following industrial applications: (1) building and construction (to improve the adherence of asphalt to gravel and to control the density and other characteristics of concrete); (2) food and beverage industry (to improve various properties associated with foods and beverages); (3) textiles and leathers (to promote wetting, penetration, and other material properties for sizing, dyeing, printing, and finishing of these items); (4) petroleum and mineral production (to aid in mining and drilling operations and in secondary and tertiary petroleum recovery); and (5) general industrial cleaning.
The production of most general use soap and detergent products takes place in nearly all developed nations, as well as in many developing nations. Therefore, there is a relatively low level of imports of these materials into most developed countries. However, many of the more recently developed synthetic surface-active agents, and specialized products derived from these materials designed to replace soaps, are now major items of regional international trade, flowing primarily from developed nations to developing nations located within a close proximity. In most cases, the location of the producers that compete to supply the needs of these consuming nations are determined by the costs associated with transporting the products from the producing to the consuming market
U.S. Industry Profile
Industry Structure
All of the items included in this digest are contained within two discrete Standard Industrial Classification (SIC) groupings: SIC industry No. 2841, Soap and Other Detergents, Except Specialty Cleaners; and SIC industry No. 2843, Surface-Active Agents, Finishing Agents, Sulfonated Oils, and Assistants. As shown in figure 1, the structure of the soap, detergent, and surface-active agent industry, although fairly simple in nature, has various levels of vertical integration throughout the industry. There are a number of U.S.-based, as well as foreign-based, multinational companies active in the domestic market that are involved in the entire process, beginning with the cultivation of the plants and trees from which many of the oils used in the industry are obtained and culminating in production of consumer products. Other smaller domestic firms may only purchase surface-active agents at specific stages of product development and perform one or two specialized steps to increase the value-added of the material. These smaller "specialty" companies can exist and compete in such an industry by carving out very specific niches, and maintaining competitive advantages either through continuous product innovation or by the maintenance of a proprietary technological advantage. There are also many firms that, although once classifiable in one of these two distinct categories, have evolved into more complex organizations.
This industry was one of the first to develop an organized and systematic approach to the production and marketing of its products in the nineteenth century; further, it was also one of the most well-developed industries in relation to the cooperation and inter-relationships that have developed among various producers. As such, it would be impossible to describe every type of relationship within the industry. However, the basic starting materials used to produce soaps, detergents, and surface-active agents are the same regardless of the site or the complexity of the producer. These materials are natural fats and oils, normal-paraffins, and certain primary petrochemicals (e.g., ethylene, benzene, propylene). These materials are used to produce certain generic types of raw materials, which are then used to produce surface-active agents. The raw materials used most often, and in the greatest quantities to produce surface-active agents are fatty acids, detergent-range · primary alcohols, ethylene oxide, and linear alky !benzene.
The major categories of surface-active agents that are produced are linear alkylbenzene sulfonates; alpha-olefin sulfonates; amine oxides; alkanolamides; linear alcohol ethoxylates; alcohol and alcohol-ether sulfates; and alkyl-glyceryl ether sulfonatcs. These surfactant materials are then either sold (in bulk
Figure 1 U.S. soap, detergent, and surface-active agent Industry: Principal raw materials, producer fypes, major products, and principal consumers
Producer types
• Natural fats • Multinational and oils chemical
companies
• Normal paraffins • Multinational
consumer products
• Primary companies petrochemicals
• Multinational specialty chemical products companies
•Domestic specialty soap and detergent companies
Source: USITC staff.
quantities) to firms that specialize in consumer products or to firms that produce industrial cleaning compounds, or further processed by vertically integrated firms to make personal care, household, or industrial cleaning products.
According to U.S. Government sources, I there were 867 companies reporting information based on SIC codes 2841 (Soaps and other detergents), and 2843 (Surface-active agents) to the U.S. Bureau of the Census for the Census of Manufactures. At least 123 companies reporting shipments valued at more than $100,000. The tabulation on the following page indicates several pertinent industry statistics conce~in~ these items, according to their SIC groupings.
1 U.S. Bureau of the Census. 1987 Census of Manufactures, Soap, Cleaners, and Toilet Goods, February 1990; U.S. Department of Commerce, 199i U.S. industrial Outlook, January 1991, p. 36-2; and U.S. International Trade Commission, Synihetic Organic Chemicals, U.S. Production and Sales, i989, USITC Publication 2338, December 1990.
2 U.S. industrial Outlook, January 1991, p. 36-2; and U.S. Bureau of the Census, i987 Census of Manufactures, Soap, Cleaners, and Toilet Goods, February 1990.
2
Major products
• Non-household • Industrial (industrial) consumers cleaning products •General
consuming • Household public
cleaning products
• Personal care cleaning products
Industry sources report that the concentration of production among the largest firms has decreased slightly during the past 5 years, owing to increased levels of competition seen domestically and in the international market. Such increased competition has developed because of the increasing numbers of mergers and buyouts among primarily medium-sized firms seeking to expand their share of the world market. The goals of these mergers or alliances range from the development of guaranteed sources of either the basic starting materials or the raw materials, to the acquisition of certain proprietary technologies, particularly those involving the improvement in the environmental friendliness of the final products. As of 1985, the four largest U.S. producers of soaps and detergents were reported to account for 59 percent of the domestic market.3 Although current data are unavailable, it is believed that the concentration of production among the four largest U.S. producers has declined to closer to 55 percent of the domestic market.
3 U.S. Deparunen·t of Commerce, U.S. Industrial Outlook, 1985, pp. 12-1 and 12-2.

SIC Number of Number of Number of Specialization Year grouping companies establishments employees ratio
1987 2841 ........ 683 764 (Percent)
31,700 80 2843 ........ 184 217 9,100 75
Total ...... 867 981 40,800
1988 2841 ........ (1) ~:~ 32,900 ~~~ 2843 ........ (1) 8,900 Total ...... 41,700
1989 2841 ........ (1) (1) 31,800 (2) 2843 ........ (1) (1) 9,200 (2)
Total ...... 41,000
1990 2841 ........ (1) (,) 32,100 (2) 2843 ........ (1) (1) 9,200 (2)
Total ...... 41,300
1 Data not available, but the number of firms is believed to have declined because of mergers and other acquisitions.
2 Data not available, however the specialization ratio during the past 15 years has trended downward. The specialization ratio measures the share of the total industry production for which the primary product accounts.
Total employment in the soap, detergent, and surface-active agent industry declined significantly during the past decade. Most of this decline occurred during the early 1980s, when the industry restructured as part of the broader restructuring process that affected the entire U.S. chemical industry, related to the changes in the pricing of petroleum and natural gas. The followin~ tabulation shows employment in this industry:
SIC Year grouping
1982 2841 ..... 2843 .....
1986 2841 2843 .....
1987 2841 2843 .....
1988 2841 ..... 2843 .....
1989 2841 ..... 2843 .....
1990 2841 ..... 2843 .....
1 Not available. 2 Estimated
Total employment
Production workers
Thousands --35.4 21.2
8.5 3.8
32.3 19.4 9.5 4.4
31.7 19.3 9.1 4.7
32.9 (1) 8.9 (1)
31.8 r) 9.2 1)
232.1 (1) 29.2 (1)
As can be seen from the above information, total employment in the soap, detergent, and surface-active agent industry declined fairly steadily through 1989, although at the same time the value of shipments
4 U.S. Bureau of the Census, 1987 Census of Manufactures, Soap, Cleaners.and Toilet Goods, February 1990, and U.S. Department of Commerce, 1991 U.S. Industrial Outlook, 1990, p. 36-2.
within the industry rose at a steady pace (see U.S. and Foreign Markets, below). This indicates that the overall productivity of the industry was climbing. Further evidence of this assumption is that the amount of value-added per employee increased from approximately $122,000 in 1981 to nearly $144,000 in 1986.5 It is estimated that the value-added ~r employee may have approached $200,000 by 1990.6
Of the 981 establishments reported to be active in the soap, detergent, and surface-active agent industry, the majority were staffed with less than 20 employees. Although costs associated with employment were reduced significantly when this industry, along with the entire chemical industry, rationalized in the early 1980s, the major costs associated with production of these products do not involve personnel. The major expenses associated with this industry include those for raw materials, transportation, and packaging. The cost of materials as a percent of the value of shipments has ranged from 50 to 55 percent in the recent past, payroll costs have accounted for 8 to 10 percent of the value of shipments during the corresponding period.
In terms of geographic concentration, this industry has located itself so as to provide for an efficient distribution network. As the majority of this industry's products are consumed uniformly by virtually all of the consuming public, the most significant factors that enter into company decisions regarding the location of production facilities involve access to major transportation corridors and proximity to major population centers. This industry, therefore, is highly concentrated in several distinct areas: the Northeast (particularly in New Jersey, New York, and
5 U.S. Bureau of the Census, 1987 Census of Manufactures, Soap, Cleaners, and Toilet Goods, February 1990.
6 Ibid.
3

Pennsylvania); the South (North Carolina, Florida, Texas, and Georgia); the Midwest (Ohio, Illinois, and Missouri); and in California.
Although many multinational companies are active in both the domestic and the international market, there is less international trade in the products of this industry than might be expected. This is primarily related to the high cost of transporting this industry's products, which generally have low profit margins, over large distances. This encourages the development of facilities within a nation designed specifically to supply that nation's domestic, or sometimes slightly broader, local demands. Also, because this industry is a technologically mature industry, most of the more recent increases in multinational firm's involvement have come through purchases of existing facilities.
The marketing of the soaps, detergents, and surface-active agents involves both consumer and industrial marketing strategies. The expenses associated with each of these marketing strategies represent a significant addition to the cost of the products of these two distinct sectors. Only the basic starting materials . and the feedstocks (primary petrochemicals and natural fats and oils) do not have significant marketing_expenditures related to their sale, purchase or use by companies involved with this industry, because they are commodity products available to the consumers at uniform costs. However, the purchase of specialty industrial materials that may be included in consumer products to impart certain specific sensory characteristics, as well as the surface-active agents themselves, are advertised heavily in the industrial print media in the hopes of influencing potential buyers operating within the formulations end or in the consumer products segment of the industry.
Often, final consumer products undergo multiple formulation changes within short periods of time, and the producers of these items are often open to and influenced by the media advertising of new specialty ingredients. Additionally, multiple formulations of "single products" are marketed within certain geographic areas related either to performance characteristics associated with regional atmospheric conditions (e.g., altitude or hardness of local water) or environmental regulations (e.g., mandated elimination of phosphate builders from laundry products). Another potential mechanism for the introduction of "new" products or product innovations is the annual trade show sponsored by various trade associations.
The channels of distribution within the soap, detergent, and surface-active agent industry are fairly elementary. Producers of primary petrochemicals generally market their products directly to the producers of surface-active agents, while the extractors of natural fats and oils both sell directly and through brokerage houses (mostly used by foreign-based producers) to their domestic customers. The producers of the industrial grade detergents and the consumeroriented soap and detergent products generally purchase their surfactant raw materials directly from
4
domestic suppliers. The high level of vertical integration within this industry further simplifies the process, as the sales stages described above often represent transfers of goods from one profit-center to another within one company.
The initial and intermediate bulk products of this industry are typically priced at very low profit margins, representative of an industry with multiple producers, a similar product. and generally comparable quality among all of the various producers. However, those firms that operate within certain specialty areas or niches generally produce a much smaller volume of materials and their product sales are much lower than the firms that operate within the commodity area of the industry. These firms base their price on an entirely different mechanism, because they have very high R&D costs associated with almost all of their products. As such, these producers generally need to have higher profit margins associated with their individual products in order to facilitate new product development.
The other significant factor affecting this industry now and well into the coming century, is the environmental effect of its products. Changes anticipated in the near future include the increased use of natural products (eventually expected to account for nearly 20 percent of surface-active agent production) and the trend toward superconcentrated powder laundry detergents replacing both the normal powder detergents dating from the 1960s and the liquid laundry detergents from the 1980s. Industry experts foresee almost complete domestic market takeover by these products in the 1990s, just as they have already captured almost the entire Japanese market 7
Another major change in the detergent industry that began many years ago, the elimination of phosphates from heavy duty consumer laundry formulations, has again begun accelerating. Specifically, this change involves the replacement of sodium tripolyphosphate (STPP) as the primary detergent builder with combinations of other builders, such as sodium nitrilotriacetate, sodium carbonate, sodium citrate, zeolite A, and various polymers. These domestic replacement programs have been necessitated both because of specific bans in several States8 and because of the advertising value associated with the phosphate-free slogan.9 Industry experts predict the U.S. demand for STPP and tetrasodium polyphosphate in home laundry detergents to continue to decline by 5 or 10 percent annually through 1994, dependent on whether the ban on these products remains limited to the Northeast United States, or it is expanded to include states located in the Pacific Northwest.10 It is
7 "Soaps and Detergents, Cleaner and Greener in the '90s," Chemical Week, Jan. 30, 1991, p. 38.
8 Legislation expected to be enacted by 1992 will affect approximately 40 percent of the domestic laundry detergent market.
9 "Phosphate Use Continues to Take its Lumps," Chemical Week, Jan. 30, 1991, p. 40.
10 Prediction by SRI Intemational's (Menlo Park, CA) Chemical Economics Handbook reponed in Chemical Week, Jan. 30, 1991, p. 40.

these areas of environmental concern that will probably account for the majority of the research and development expenditures of this industry for the foreseeable future.
Consumer Characteristics and Factors Affecting Demand
The soap, detergent, and surface-active agent industry serves two distinct consumer markets in the United States. The first market is the non-household, or industrial market, which has seen an increase -in the value of shipments from just under $7 .9 billion in 1982 to more than $9 .5 billion in 1987 .11 This represents an average annual growth rate of approximately 4 percent, which tends to reflect the growth of U.S. industrial output during the same period.
The second consumer market is the general public, i.e., purchasers of personal or household soaps and other cleaning and laundry products. Household consumers are becoming increasingly aware of their environment and the resulting trends in the industry reflect a growing awareness of the persuasive force wielded by the consumer. Until recently, much of the domestic soap, detergent, and surface-active agent industry response to the "green" movement, or to the concern voiced about the results of steadily increasing consumption of products not friendly to the environment, has involved changes to the packaging of consumer products. 12 However, the resentment and anger caused by careless environmental policies already evident in areas of Western Europe has begun to manifest itself within the U.S. domestic market, and the industry has begun to respond. For example, Western European use of wash-cycle laundry softeners has declined by approximately 90 percent because of the nonbiodegradability of the effluent. 13 Expectations of industry experts are that the domestic consuming public will also influence the household market in the same manner in the coming decade.
Foreign Industry Profile The soap, detergent, and surface-active agent
industry, although very strong in the United States, is a true international industry. All industrialized nations have well-developed domestic industries capable of supplying both their own internal demand, and a considerable export market. Additionally, the cost structure for the producers in other highly industrialized nations.is very close to that of producers in the United States. Costs of production for the less technologically advanced producers of the simpler soap
11 1987 Census of Manufactures, Soap, Cleaners, and Toilet Goods, February 1990.
12 "Concentrating on Detergents," Soap/Cosmelfcs/Chemical Specialties, January 1991, pp. 32-36, and 56.
13 "Biodegradation & Detergents," Soap/Cosmetic/Chemical Specialties, January 1991, pp. 40-46.
products used in many less developed nations are relatively modest compared to the costs associated with production of the detergent materials that dominate the markets in the United States, Western Europe, and Japan. In particular, costs associated with research and development in foreign-based multinational firms will continue to parallel R&D costs of the domestic industry.
The Western European market is driven by a $10 billion-per-year detergents sector, which accounts for more than 90 percent of the 9-millionmetric-ton-per-year Western European soap and detergent output.14 European industry analysts believe that the switch of the European consuming public from less biodegradable soaps to more environmentallyfriendly synthetic detergents has stabilized and that the IO-percent market share currently held by soaps will be retained, 15 primarily owing to the fairly stable Western European toilet soap bar market.
The Western European market is dominated by four multinational firms; Lever Europe (Belgium) and Procter & Gamble (USA) currently account for more than 50 percent of sales within the European market. Henkel (Germany) and · Colgate-Palmolive (USA) account for another 25 percent of Western European sales.16 The largest of the European firms, Lever, reported worldwide soap and detergent sales of $7.3 billion in 1989, one-third of which were in Europe.
Western European production of soap and synthetic detergents is estimated to have reached about 6.7 million metric tons in 1990. This quantity is not believed to have increased significantly during the past 7 to IO years.
Japan's soap and detergent market is valued at approximately $3 billion per year by the Japan Soap and Detergent Association.17 Synthetic detergents account for 85 percent of the Japanese industry production. Currently, Japan's production of soaps and synthetic detergents is estimated to be about 1.2 million metric tons, just less than one-fifth the size of Western European production. ·
As in the European market, consumption of soap in Japan has been declining. This decline is expected to continue until the detergent/soap ratio in Japan approaches the 90/10 figure. One area in which the Japanese market is far ahead of the rest of the world is the almost complete elimination of the use of phosphates as a builder for detergents. The penetration of phosphate-free detergent powders in the Japanese market reached almost 95 percent in 1990, up from 25 percent in 1981.1 8 This change was accomplished by the Japanese industry's addition of a greater
14 "Environmental Concerns Come First in Europe," Chemical Week, Jan. 30, 1991, pp. 48-49.
15 Ibid. 16 Ibid. 17 "Japan Sees Good Growth, Low Profits," Chemical
Week, Jan. 30, 1991, pp. 52-54. 18 Ibid.
5

concentration of surface-active agents in their products and facilitated by the naturally soft water ~up~ly in Japan. The three dominant firms currently active m the Japanese market are Kao Corp. (Tokyo), Lion Corp. (Tokyo), and Procter & Gamb~e Far E~t (0~). However, new participants seeking to achieve !Ila~or market shares in Japan are Nippon Lever and Shiseido (Tokyo).
U.S. Trade Measures Table 1 shows the rates of duty, as of January 1,
1991, applicable to imports of soaps, dete~gents, ~d surface-active agents under the Harmonized Tariff Schedule of the United States (HTS). The table shows the column-I duty rates for countries considered for general or most-favored-nation (MFN) treatment, as well as duty rates under column 1 for countri~s qualifying under special tariff programs. (See appendix A for an explanation of rate of duty columns.)
The 1991 column-I U.S. general rate of duty for most soaps under HTS heading 3401 ranged from 3.1 to 4.4 percent ad valorem; the general rate of duty for most surface-active agents and synthetic detergents classified in heading 3402 ranged from "free" to 7.7 percent ad valorem:- The aggregate trade-weighted, average rate of duty for all products covered based on full-year 1990 trade was approximately 4 percent ad valorem.
The only provision affecting tariff ~tes outsi~e of the indicated subheadings of the HTS mvolves hnear alkylbenzenesulfonates, one of the largest vo!~e chemicals comprising a major class of aniomc surface-active agents used in many common household detergents. In the transition from the Tariff Schedules of the Unites States (TSUS) to the HTS, the classification of linear alkylbenzenesulfonates was shifted from a basket which was ineligible for duty-free treatment under the Generalized System of Preferences (GSP) to one which was GSP-eligible. Proposed legislation has been introduced that would restore the
Nation
original treatment to this high-volume, low value-added product
There are no known significant domestic nontariff import restrictions. No statutory investig~tio~s have been instituted within the past 5 years, which mvolve these products.
Foreign Trade Measures The duty rates associated with soaps, detergents,
and surface-active agents are relatively low throughout the world. ·Particularly in those nations that are ma~or U.S. trading partners (see below), the average duties are only slightly higher than U.S. MFN duty rates. The tabulation below summarizes avera~e rates of duty for certain important trading partners. I
There are no known specific nontariff barriers that effect any of the soaps, detergents, or surface-active agents discussed in this report.
U.S. Market
Consumption As there is relatively little international trade of the
items covered, consumption generally approximates production (table 2 and figure 2). The ratio of imJ><?rts to consumption never exceeded 2.5 percent dunng 1986-90. Additionally, the use of soaps, detergents, and surface-active agents is related closely to the size of .a given population group. Once the products of this industry are introduced and reach a mature growth stage in a particular market, real gro~th tend~ .to follow a pattern similar to that of growth m the size of the general population.
19 Duties compiled from various tariff schedules. Dates associated with the average duty rates indicated are as follows: Canada, 1991; European Communities, 1990; Japan, 1991; Korea, 1988; Malaysia, 1988; Singapore, 1990.
Average rate of duty on soaps, detergents, and surface-active agents
Percent Canada .................................. •.• ...... . 10-15(MFN) ...
European Communities .............................. . Japan ............................................ .
South Korea ....................................... .
Malaysia1
Mexico ........................................... . Singapore ........................................ .
(United States on a 5-year duty ehmrnat1on schedule, 1989-93) 6.9 5.8 - 8.0 (soaps) 6.2 (surface-active agents) 4.8 - 6.2 (detergents/preparations) 20 (except nonmedicated toilet soaps -30 percent ad valorem) . 2 (certain items where t_hese maten~ls are impre~nated onto certain paper or fiber materials - 30 and 55 percent ad valorem) 18 - 20 Free
1 Malaysia is one of the world's largest producers of the natural fats and oils that are used to produce soaps, detergents, ~nd surface-active agents.
6

-.J
Table 1 Soaps, detergents, and surface-active agents: Harmonized Tariff Schedule subheading; description; U.S. col. 1 rate of duty as of Jan. 1, 1991; U.S. exports, 1990; and U.S. Imports, 1990
Col. 1 rate of duty U.S. U.S. HTS as. a.l J.aa l l 9.9. l exports, imports, subheading Description General Special1 1990 1990
Thousand dollars 2923.20.00 Lecithins and other phosphoaminolipids 2.2¢/kg Free (A,E,IL) 20,491 3,283
+4.5% 1.5¢/kg + 3.1% (CA)
2923.90.00 Quaternary ammonium salts and hydroxides, 6.2% Free (A,E,IL) 33,648 11,463 except choline and its salts 2.4% (CA)
3401.11.10 Castile soap in the form of bars, cakes 3.1% Free (A,E,IL) 385 2,814 or molded pieces or shapes 1.2% (CA)
3401.11.50 Organic surface-active products used as soap, 1.1 ¢/kg Free (A,E,IL) 38,134 49,748 for toilet use +3.6% 0.3¢/kg +
1.2% (CA)2
3401.19.00 Organic surface-active products used as soap, 0.9¢/kg Free (A,E,IL) 14,807 3,946 not for toilet use +2.9% 0.3¢/kg +
1.1%(CA)
3401.20.00 Soap, not in the form of bars, cakes, 4.4% Free (A,E,IL) 29,379 5,989 molded pieces or shapes 1.7% (CA)
3402.11.10 Aromatic or modified aromatic anionic organic 7.2% Free (A,E,IL) 13,001 5,745 surface-active agents (other than soap) 2.8% (CA)
3402.11.50 Nonaromatic anionic organic surface-active 3.7% Free (A,E,IL) 39,004 29,881 agents (other than soap) 1.4% (CA)
3402.12.10 Aromatic or modified aromatic cationic organic 6.6% Free (A,E,IL) 4,237 803 surface-active agents (other than soap) 2.6% (CA)
3402.12.50 Nonaromatic cationic organic surface-active 5.2% Free (A,E,IL) 12,710 8,710 agents (other than soap) 2% (CA)
3402.13.10 Aromatic or modified aromatic nonionic organic 7.3% Free (A,E,IL) 25,590 4,569 surface-active agents (other than soap) 2.9% (CA)
3402.13.20 Nonaromatic nonionic organic surface-active 2.2¢/kg Free (A,E,IL) 51,181 11,222 apents (other than soap) of fatty substances +4.5% 0.8¢/kg + o animal or vegetable origin 1.8% (CA)
3402.13.50 Nonaromatic nonionic organic surface-active 3.7% Free (A,E,IL) 25,590 14,411 agents (other than soap), other than of fatty 1.4% (CA) substances of animal or vegetable origin
3402.19.10 Aromatic or modified aromatic organic surface- 7.1% Free (A,E,IL) 4,245 2,930 active agents (other than soap), other 2.8% (CA)
See notes at end of table.

O
0
O
O
O
1-5 2 = = a)
-c
=
-Cj O E 0
C
0 0 m ,c
▪
2 e
m 0 m g E
34
03.
11.2
0 o 0
0
o 0
38
09.
92.
10
340
3.9
1.10
34
03.
91.5
0
34
02.
90.3
0
34
02.
20.1
0
34
02.
20.5
0
340
2.90
.10
3402.9
0.5
0
CO. t M M ..— r■ M M M CO co m m m m 0
US 8.8.) f■ 0 M
D W
W N 0 .7. M M
cD Co o It) N- co Q)
r.... m O) IL) ,- sr co IL)
th .E .72. co ai. c.6 N c NI cci to "a-- N N N N
I.- 0) 0) 1.-
t_ stf t■ W N N V •4. W N .- N W N LO f■ 0 ID N ▪ N. W (C 1... W M M
cci (oNI co" N O) .-. O ,-- - - m -
" 1 R. ....I -.J ' --I :. a ---
-I 0 —....-, _._... ----, --....... -- ---, ------.. -----, w< w_ w< -- w< w< w< -.< w< ='< .,(D Q¢ ,e0 -.J m ,e0 ., - 0 .c.) Lijo .„.(..) uso
a ---- 0 ,_,.....
re 0 — cDe a) -4 a) e a) e . e .z,.. a, -as: a) e , L.) 22 e m' 0 N m.4. 2 it) m"4" 2 co a) Nr m0
LL_ •-: U CO U- .- L: 6 II- N u_ 6 Li- N u- N LI: N L. NI-
0 0 co co
to 0
E o
-
a E 6. c
z
0
m
C ._ 0 CD to. O f-- E 0) ?_' 6 0 cD 0 co 9. -- ' E 7 ..- •-• -
c) 0 DI ca Q— ,.(11 a) ,y) a) a) 0 - — a) a) -o 0 0 a 0 ) )-.= a) .c 0 = 6 " c a c ) _c a 76 Di- as o) - = > a_ ..- cn RS as c 0 0 :—
C c -,. 7, 0 o •,--:‹ 0 Iii E. 3".< _ a, o c '` ' - -1" E a> 'E E 0 -E cu cTI - E E c E _cv a) ....r. tr._ a) Lr) . a) 0 a) c -a-, ca 2 - ca cp tom 0 a) . = -0 -- 7:3 ...: 2 .c. 0 2 0 ° 2? 1.15 .._ ... E co c "ic' c a) ca
6
N co cp ca a_ U cD cz co CD 0,0 0 0 ._ 15C (:)- "62 0 - (7, -6
Tie 76E _xi La) Ln ca.:E; O c
-6 w "E ).... n, • -o c - -o --- - 0 )...o_ uo so •E _. i -0 . . -0 . i:, . r, . . a) w 0)
.
_c 0 .-
al m c o_ a_ _c - _cf._ _c..°533 13: 0clis>:0.! eg .-a)a) 1
c
co co .- as a a a) a3 5- C
as 0) E r 0 E vi 2 E cr) -t .- , cpcn 0,..c o 0, p 0 01c_ Q-_ 635 rum g) 1) 76a) ty, g 16. . c2, 32 a3 . . c c z . a ,_ ,_ _ _ ,_ ca a ,__ -. .c >„ .....c w ° --,. a_ -E Q- ca- co _c _; co :E 8 0 "E "c7; a c_o a)E -6 m lii ',7) a) o - C 0 0 a) - ›..-0 a) 2 - in .- ' co - 0) .-- co •E' cp co _ - C 0_ co 0 o '*--, M CD c Om ,.0- ..c CD ,(0 0 CO (.2 52 -C MS 0 -F., ......CT1 .:-.03 -C..... E ca_ -c •c.7) 0 :2
-o = -o cn 0 s c.) a_ > 0) o a s 0 o s - ._ -6 8 ._ c a_ L... ,,. ._ .7) a) .F_ 0 v)
c u cc; a 2
O 0 CI 0 tr ci (12 8 c a) ) ..- ai u ) .?- ai 0 2 8 E -2 8-- -2 -c 0° "2 2 (.7.; -',,f) .2 . e 0 C 0 0 C -a. g CD --?- 0 "6
c o R t ..., 22 .. c . A_n
Q -.- 0 to w al ..;
.> g 6 2 t•t". g t't• 1) (0 ill ci co co S2 as ..E. .P. co ac) .P. In CD A.'.4 c6 .1= ..:' = 0.) 15 0) ", a)
O (0 ._ 0
E 7-CD CDT 8 a) 6 ai 'B. 6 8 (-) 6 8 7E1 . `-: 0 'CB. - C . CD .C-0 - -.C. ta I= ifs 0 = c o c 8 2 - _, c..) ca..?_ 0 0- 8 sl--2 8 ce 'cii f, 2•r a', ..1- - r/2 :in, cv-,-), zcif, :e f) 1:2 -_,E;) am at ...... .. . ...... . 0 = „„-_,,-, = 6-. , .---- . D >... .i cL.- cia =, cl."- m E cl a Ei_)" .>" -- -0 2 E co 0 a,' . _.E a_ . E o_Ln
0 Z U) U) U) Cl) U) CL 0. L 0_ 0. CL ..-1 U. Li.
Ls-) cri
co
e N " t0 m co N h-.
co Li_
8
\0
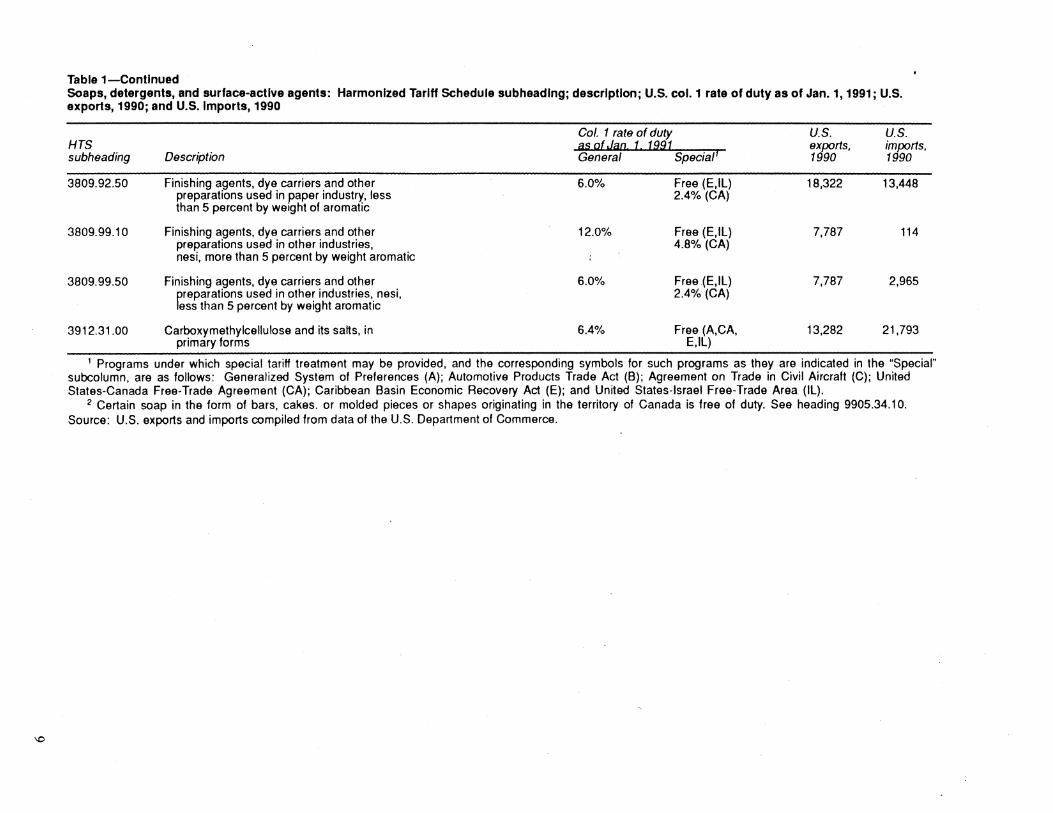
Table 1-Contlnued Soaps, detergents, and surface-active agents: Harmonized Tariff Schedule subheading; description; U.S. col. 1 rate of duty as of Jan. 1, 1991; U.S. exports, 1990; and U.S. Imports, 1990
Col. 1 rate of duty U.S. U.S. HTS as. cit J.aa l 19.9. l exports, imports, subheading Description General Special1 1990 1990
3809.92.50 Finishing agents, dye carriers and other 6.0% Free (E,IL) 18,322 13,448 preparations used in paper industry, less 2.4°/o (CA) than 5 percent by weight of aromatic
3809.99.10 Finishing agents, dye carriers and other 12.0% Free (E,IL) 7,787 114 preparations used in other industries, nesi, more than 5 percent by weight aromatic
4.8% (CA)
3809.99.50 Finishing agents, dye carriers and other 6.0% Free (E,IL) 7,787 2,965 ~reparations used in other industries, nesi, 2.4% (CA) ass than 5 percent by weight aromatic
3912.31.00 Carboxymethylcellulose and its salts, in 6.4% Free (A.CA, 13,282 21,793 primary forms E,IL)
1 Programs under which special tariff treatment may be provided, and the corresponding symbols for such programs as they are indicated in the "Special" subcolumn, are as follows: Generalized System of Preferences (A); Automotive Products Trade Act (8); Agreement on Trade in Civil Aircraft (C); United States-Canada Free-Trade Agreement (CA); Caribbean Basin Economic Recovery Act (E); and United States-Israel Free-Trade Area (IL).
2 Certain soap in the form of bars, cakes. or molded pieces or shapes originating in the territory of Canada is free of duty. See heading 9905.34.10. Source: U.S. exports and imports compiled from data of the U.S. Department of Commerce.

(/) .... ~ 0 "O c::
~ ~
~~1:s~ detergents, and surface-active age~ts: U.S. shipments, exports of domestic merchandise, Imports for consumption, and apparent U.S. consumption, 1986-1990 -
Year U.S. shipments'
U.S. exports
U.S. imports
Apparent Ratio of U.S. imports to consumption consumption
--------- Million dollars -------- Percent
1986 ................ . 1987 ................ . 1988 ................ . 1-989 ................ . 1990 ................ .
11,500 11,870 12,750 13, 100 13,551
328 384 431 561 775
242 245 305 250 321
11,414 11,731 12,624 12,789 13,097
2.1 2.1 2.4 2.0 2.5
1 Estimated by the staff of the U. S. International Trade Commission. Source: Compiled from official statistics of the U.S. Department of Commerce, except as noted.
Figure 2 Soaps, detergents, and Surface-active agents: U.S. imports, P.roducers' shipments, and apparent consumption 1
E:S:::'.:l 1111111111111
1 2
...
9
6
3
0 1986 1 987 1 988 1 989 1990
1 Apparent Consumption = Producers' Shipments + Imports • Exports. Source: Compiled from official statistics of the U.S Department of Commerce; domestic shipments estil!Jated by the staff of the U.S. International Trade Comm1ss1on.
While apparent U.S. consumption increased at an average annual rate of about 3.5 percent from 1986 to 1990, domestic shipments increased at an average annual rate of about 4.2 percent during the same period. The slow but stea~y growth in ~.J.S. consumption has followed mdustry expectations through the past 5 years because most soap and detergent products are considered_ nec~ssi~es and demand for these items rarely declines s1gmficantly, even during periods of economic recession.
In the domestic household market, synthetic detergents have essentially replaced soaps, which clearly dominated this market prior to the 1950s. The inclusion of synthetic detergents in household products gradually took hold during the 1940s, when detergents
10
achieved a market penetration of nearly one-third by 1950. By the late 1950s, detergents held more than a 75-percent share of the household market. The share has since steadily increased as research and new product developments further enhance the market· ability of detergents at the expense of soaps.
There is relatively little competition in most areas of the domestic mark~t with respect to international producers. It is also believed that much of ~e foreign-produced materials that enter the domesuc market may represent either transfers between var_ious affiliates of multinational producers, or specialty materials not available from domestic producers. The geographic areas in which the greatest competition exists are those areas where regional markets overlap national borders. The largest of such areas is along the U.S.-Canadian border, stretching from the Great Lakes through New England.
Most imported materials are also more likely to be bulk surface-active agents or bulk industrial detergents, rather than consumer or household-type products. These materials are generally equivalent in quality to and are produced using methods utilizing levels of technology similar to that of the U.S.-produced counterparts. There is little difference in price among the materials produced domestically and abroad; therefore, purchase decisions are often based first on the availability of material from an affiliated company or through long-tenn contracts, and second, on the availability of the material on the open market.
Production U.S. production levels of soaps, detergents, and
surface-active agents are currently at an all-time high, as sales have increased throughout the 1980s along with increases in sales of all chemicals (see table 2). Production in the surface-active agents segmentto increased from 5.4 billion pounds in 1985 to more than 7.3 billion pounds in 1988 and then declined slightly to about 6.8 billion pounds in 1989, the last year for which data are available (table 3).
2D Domestic production of all synthetic organic chemicals is reported on an annual basis to the U.S. International Trade Commission for its annual report, Synlhetic Organic Chemicals, U.S. Production and Sales.

Table 3 Surface-active agents: U.S. production by major category, 1985-89
(In million pounds)
Description 1985 1986 1987 1988 1989
A~ph~teric ....................... . 25 27 33 41 39 Anionic ........................... . 3,355 3,659 3,672
737 655 199
4,560 4,469 ~lky!benzenesulfonates ............ . 569 753 819 763
Cationic ........................... . 418 492 703 644 Quaternary ammonium salts ........ . 187 197 225 208
Nonionic .......................... . 1,564 1,717 1,909 2,012 1,635
Total . . . . . . . . . . . . . . . . . . . . . . . . . . 5,363 5,895 6,269 7,316 6,787
Source: U.S. International Trade Commission, Synthetic Organic Chemicals, U.S. Production and Sales, 1985-89.
A similar pattern also is reflected within each of the major categories of surface-active agent production21 throughout the same period (figure 3). Each of these groups grew from 1985 to 1988 then experienced a decline, possibly resulting from an effort by the industry to allow inventories to be reduced, or as a reaction to the recession.
Sales of these surface-.active-agents22 were valued at $2.1 billion in 1989, up from a value of $1.6 billion in 1985. This represents an average annual increase of more that 7 percent. These sales figures, however, represent only about 16 percent of the estimated value of shipments of all the products being discussed. This is indicative of the lower value-added associated with the surfactants when compared with finished detergents and detergent products with their naturally higher value-added.
Shipments of certain other specific segments of the soap and detergent industry, as reported by the U.S. Bureau of the Census23 are shown in the following tabulation for the 2 most recently reported years, 1982 and 1987.
As was true of the major categories of surface-active agents, each of these three major classifications of the soap and detergent industry has also shown growth, again reflecting the stability and the steady growth associated with this industry and the majority of its component sectors, as opposed to the cyclical nature of most areas of the chemical industry.
21 The four major categories of surface-active agent production are defined by the ionic groups associated with the specific chemical surfactant. The groups are: ( 1) Amphoteric, in which the active "surfactant group" within the chemical contains both negative and positive charges, (2) Anionic, in which the active group contains only a negative charge, (3) Cationic, in which the active group contains only a positive charge, and (4) Nonionic, in which the active group contains no charge.
22 As reported to the U.S. International Trade Commission.
23 U.S. Bureau of the Census, 1987 Census of Manufactures: Soap, Cleaners, and Toilet Goods, February 1990.
Shipments
Industry segment 1987 1982
- Million dollars -Nonhousehold soap and · detergents . . . . . . . . . . . . . . . . 1,791 1,539
Household detergents .... ·. . . . . 5,249 4,349 Household soaps . . . . . . . . . . . . 1,423 1,220
Although the ratio of household detergents to household soaps has steadily increased, there has not been an overall decline in sales of soaps. The value of sales of soaps has continued to increase during the past decade, although at a significantly slower pace than other competitive synthetic products.
Imports
Imports make up a relatively insignificant segment of the domestic market for soaps, detergents, and surface-active agents. Imported materials enter the domestic market only for very specific reasons, presumably because the material is a specialty product that is unavailable from domestic sources, or because the source is an affiliated firm or subsidiary with long-term agreements regarding purchase and use of certain products. In the case of the United States, the majority of imports belong to this latter category, as most, if not all, of the world's largest multinational firms are active both producing and marketing product in the United States. Additionally, a number of producers have facilities that are located immediately across national borders in Canada and Mexico that serve regional markets. As such, there is very little difference in the product mix of imports when compared with the domestic product
Duty-free trade comprises a significant part of the imports of soaps, detergents, and surface-active agents, as shown in the following tabulation.24
24 Compiled from official statistics of the U.S. Department of Commerce.
11

MIT semed Imm■mmom
• ----- - ---- ■ • 11=11•11NOMIIM Maill••1••••I ■ • IMI••=1
1•M
-
•1•INII ■ IMIMIN•—• IMIN•MNO M•••■ • MIIMMI=1••1011 ■ IMMIIIMM• IN•1•••1•••••11MI 11•IMMI =IMIIMMINI •••••M• 01•IMMI • ON•11M• MIMI=rn M•I=M•M=• IIMM=1 MMMI
1•111•11•1•• ■ ••1 a l= 1••••1— ■ • =1=111• 11•1•• al•M•MMINI•
=1=11•11111•1=1 ••11=1•1•10•11•1• INIMINNI•1111••••• ••11•1••••••••1 1•1•6•IMIM•1111•• 1••••••••1•1•• • 1111• ■ ••••■• ■ —11•11•OW 'EMU —11•1•1•••1•1••
■••••••••• 1•MIINNUM
1•M•MIN•
7M7WI IIMM •1==1•••••• ••■ ••■■••• 12•••••••••• ••■■••••••• ■•••• ■•••• Is•• ■■■••■ ---••••• 1•••■ ••■•• usamm w••••••■•• ••••••••■ •
•• • wammo
■omma• •••••■••■ • 1.•••••••••• ■ ■••■■ •
11• ■■■■■■ ■ ■■■■ •
1•■■■■■
Nonionic Quaternary ammonium Cationic Alklbenzenesulfonates Anionic Amphoteric
11111111•11111•1111 m
▪
osimem...
▪ •••••• MUM 1•MIN•IM OMI•1•••••III•O ••••••••••••• IMINME•11•01••• •••••••■ ••• OM11=1M•M•1•NIN
NI•1••1•1111•1=1 MOIME•1•••100 • MI•• ■ •••111 1••••••••••• ■ • 1••••••••IM
Mit LV M
illio
n p
oun
ds
9000
8000
7000
6000
5000
4000
3000
2000
1000
Value of imports, 1990
1,000 dollars
320,584 263,313
57,271
45,917
43,393
Share of total imports
percent
100 82.1
17.9
14.3
13.5
Figure 3 Surface-active agents: U.S. production
- 1985
1986
1987
1988 1989
Source: U.S. International Trade Commission, Synthetic Organic Chemicals, U.S. Production and Sales, 1985-89.
Total imports Dutiable imports .. Total duty-free
imports Duty-free imports
by provisions' Duty-free imports
by GSP
Includes GSP, CBERA, Israel Free Trade Implementation Act, and 9802.00.60/80.
As can be seen from the above information, the majority of duty-free imports enter through the provisions of the GSP program. However, GSP imports account for less than 1 percent of apparent domestic consumption of soaps, detergents, and surface-active agents.
Firms that are the principal foreign suppliers of these items to the domestic market may be characterized as based in developed nations with a significant share of their production generated by multinational firms, or as firms located in a specific area in order to supply certain specific regional markets. Therefore, the top suppliers to the U.S. market, as of 1990, were Canada, Germany, Japan, the United Kingdom, and Mexico, together accounting for nearly 72 percent of U.S. imports for consumption (table 4).
The major importers of these materials within the United States are also U.S. producers.
Foreign Markets
Foreign Market Profile
The major markets for U.S.-produced soaps, detergents, and surface-active agents are, to a great extent, determined by the intercompany relationships between firms operating within the United States and other major producing nations (Japan, Western Europe), the proximity to specific marketing areas outside U.S. borders (Canada, Mexico), and the proximity to foreign markets (vis-a-vis other major producing nations) lacking sufficient domestic production to satisfy their internal demand. In this last category, nations that are potential growth markets for U.S. exports are the Republic of Korea, Taiwan, Australia, Hong Kong, and Saudi Arabia.
The issue of protective tariffs or non-tariff barriers does not exist for those nations to which we export soaps, detergents, and surface-active agents. The major criterion influencing decisions as to source of supply within those multinational firms active in the U.S. market and in most overseas markets is the location of the most economical sources for the respective market. Transportation costs and accessibility are generally believed to be the determining factors.
Type of trade
12

Table 4 . Soaps, detergents, and surface-active agents: U.S. Imports for consumption, by principal source, 1986-90
(1,000 dollars)
Source 1986 1987 1988 1989 1990
Canada ......................... (1) (1) (1) 59,675 88,780 Germany ........................ (1) p p 37,653 46,159 Japan ........................... (1) 1) 1) 30,408 34,239 United Kingdom ................... (1) (1) (1) 24,858 30,918 Mexico .......................... (1) ~:~ r) 27,736 29,309 France .......................... (1) 1) 14,734 15,932 Venezuela ....................... (1) (1) (1) 1,954 10,918 Switzerland ...................... (1) p (1) 6,560 9,200 Netherlands ...................... (1) 1) (1) 12,416 8,629
All other ....................... (1) (1) (1) 4,004 46,500
Total ............................ 241,702 245,421 305,181 249,998 320,584
1 Country detail provided only for years in which there are actual import data under the HTS - suppressed for years in which data were derived from the TSUS using a concordance.
Source: Compiled from official statistics of the U.S. Department of Commerce.
U.S. Exports U.S. exports of soap, detergents, and surface-active
agents accounted for between 3 percent and 6 percent of estimated U.S. producers' shipments from 1986 to 1990. The mix of U.S. exports is fairly representative of all the soaps, detergents, and surface-active agents produced domestically. Exports to developed nations are believed to consist of a greater share of specialty items, while exports to developing nations tend to consist of a greater share of finished products packaged for retail sale. However, the specialty items (not for retail sale) are in many cases classified in the same basket categories as the simpler, more common materials.
Exports of materials produced in the United States increased fairly steadily from 1986 to 1990 to most foreign markets (table 5). Exports to Mexico and Canada have increased more dramatically in the past 2 to 3 years (figure 4), and may be partly in response to
Table 5
the staged reduction in tariffs between the United States and Canada, and to the opening of the Mexican market to more U.S. consumer products.
The value of exports of soaps, detergents, and surface-active agents increased steadily throughout 1986-90, at an average annual rate of about 24 percent. A significant share of this increase is believed to be derived from two major factors. First, cross-border trade with Canada has increased dramatically. Second, trade that represents intracompany transfers is believed to have also increased significantly. This has resulted from the expansion of the share of the international industry held by multinational firms via various types of cooperative working arrangements, as well as many outright acquisitions of smaller specialty firms in order to improve their standing in certain national markets. The ratio of exports to shipments increased from 3 percent in 1986 to more than 6 percent in 1990, an average annual increase of nearly 19 percent.
Soaps, detergents, and surface-active agents: U.S. exports of domestic merchandise, 1986-90
(1,000 dollars)
Market 1986 1987 1988 1989 1990
Canada ......................... (1) (1) (1) 94,126 206,497 Japan ........................... (1) (1) (1) 63,483 74,910 Mexico .......................... (1) (1) (1) 35,078 67,679 Belgium .......................... (1) (1) (1) 24,628 36,891 South Korea ...................... (1) (1) (1) 25,970 32,001 Taiwan ........................... (1) p p 22,493 31,850 Germany ........................ (1) 1) 1) 23,420 28,894 Australia ......................... (1) (1) (1) 23,924 24,090 Netherlands ...................... (1) p r) 25,931 22,569 United Kingdom ................... (1) 1) 1) 19,702 20,329
All other ....................... (1) (1) (1) 202,184 260,831
Total ............................ 327,074 383,866 430,694 560,939 774,691
1 Country detail provided only for years in which there are actual import data under the HTS - suppressed for years in which data were derived from the TSUS using a concordance.
Source: Compiled from official statistics of the U.S. Department of Commerce.
13

Figure 4
Soaps, detergents and surface-active agents: Share (percent) of U.S. exports, by principal market
Other 65%
1989
Japan 11.3%
Mexico 6.9%
Other 54.9%
1990
Canada 26.7%
Japan 9.7%
Source: Compiled from official statistics of the U.S. Department of Commerce.
U.S. Trade Balance The U.S. trade balance remained positive during
1986-90, increasing in size throughout most of the period (table 6). Data show the trade balance with
14
Canada grew by a factor of about three from 1989 to 1990. Trade with our Mexico has also increased significantly. The positive U.S. trade balance. has grown by a factor of more than 5 during 1986-90.
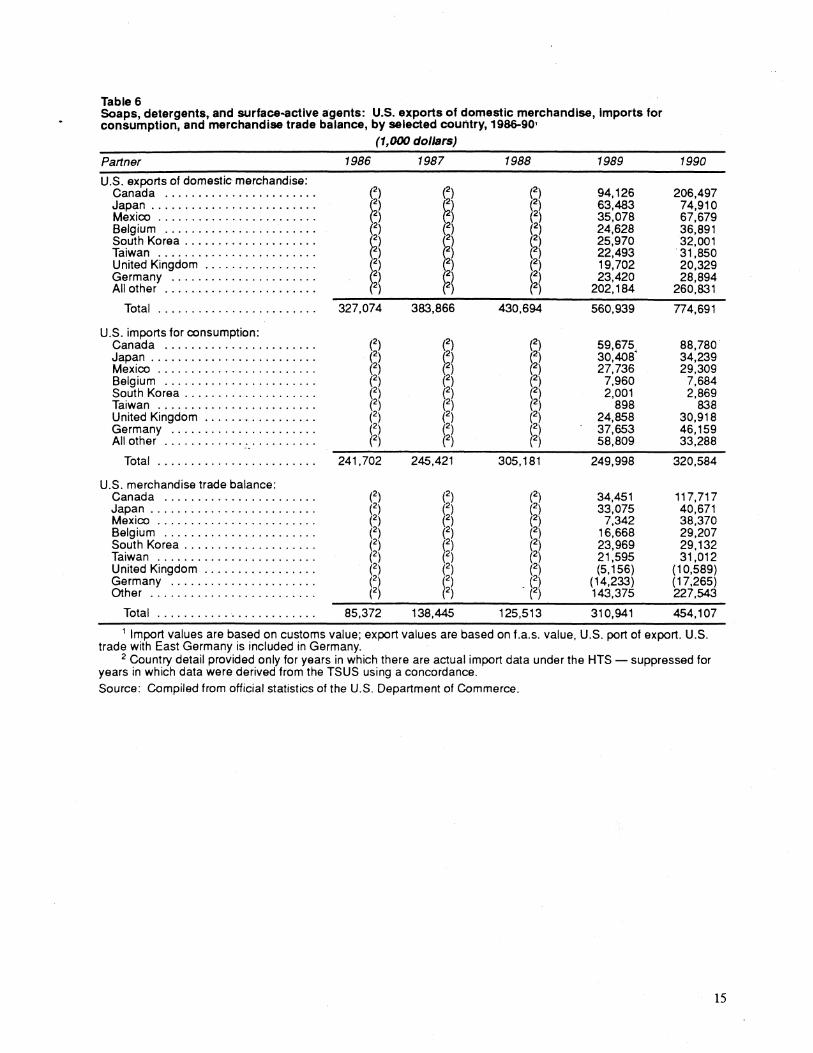
Table 6 Soaps, detergents, and surface-active agents: U.S. exports of domestic merchandise, Imports for consumption, and merchandise trade balance, by selected country, 1986-901
(1,000 dollars)
Partner 1986 1987 1988 1989 1990
U.S. exports of domestic merchandise: ~) ~~
(2) Canada ....................... 94,126 206,497 Japan ......................... ~2l ~2) 63,483 74,910 Mexico ........................ 2) 35,078 67,679 Belgium ....................... (2) (2) (2) 24,628 36,891 South Korea .................... ~2) r) r) 25,970 32,001 Taiwan ........................ 2) 2) 2) 22,493 31,850 United Kingdom ................. (2)
~~ (2) 19,702 20,329
Germany ...................... ~l ~l 23,420 28,894 All other ....................... 202,184 260,831
Total ........................ 327,074 383,866 430,694 560,939 774,691
U.S. imports for consumption:
~) ~) ~) Canada ....................... 59,675 88,780 Japan .......................... (2) ~2l ~2l 30,408' 34,239 Mexico ........................ (2) 27,736 29,309 Belgium ...... ~ . . . . . . . ......... (2) (2) (2) 7,960 7,684 South Korea .................... (2) (2) (2) 2,001 2,869 Taiwan ........................ () (2) (2) 898 838 United Kingdom .................. () (2) (2) 24,858 30,918 Germany ...................... ~2l ~2) ~2) 37,653 46, 159 All other ....................... 2) 2) 58,809 33,288
Total ........................ 241,702 245,421 305, 181 249,998 320,584
U.S. merchandise trade balance: Canada ....................... (2) (2) (2) 34,451 117,717 Japan ......................... (2) (2) (2) 33,075 40,671 Mexico ........................ (2) (2) (2) 7,342 38,370 Belgium ....................... (2) (2) (2) 16,668 29,207 South Korea .................... ~2) ~2) (2) 23,969 29,132 Taiwan ........................ 2) 2) (2) 21,595 31,012 United Kingdom ................. (2) (2) (2) (5,156) (10,589) Germany ...................... (2) r) . ~~l (14,233) (17,265) Other ......................... (2) 2) 143,375 227,543
Total ........................ 85,372 138,445 125,513 310,941 454,107
1 Import values are based on customs value; export values are based on f.a.s. value, U.S. port of export. U.S. trade with East Germany is included in Germany.
2 Country detail provided only for years in which there are actual import data under the HTS - suppressed for years in which data were derived from the TSUS using a concordance.
Source: Compiled from official statistics of the U.S. Department of Commerce:
15


APPENDIX A EXPLANATION OF TARIFF AND TRADE AGREEMENT TERMS

TARIFF AND TRADE AGREEMENT TERMS
The Harmonized Tariff Schedule of the United States (HTS) replaced the Tariff Schedules of the United States (TSUS) effective January I, I989. Chapters I through 97 are based on the internationally adopted Hannonized Commodity Description and Coding System through the 6-digit level of product description, with additional U.S. product subdivisions at the 8-digit level. Chapters 98 and 99 contain special U.S. classification provisions and temporary rate provisions, respectively.
Rates of duty in the general subcolumn of HTS column I are most-favored-nation (MFN) rates; for the most part, they represent the final concession rate from the Tokyo Round of Multilateral Trade Negotiations. Column I-general duty rates are applicable to imported goods from all countries except those enumerated in general note 3(b) to the HTS, whose products are dutied at the rates set forth in column 2. Goods from the People's Republic of China, Czechoslovakia, Hungary, Poland, and Yugoslavia are among those eligible for MFN treatment. Among articles dutiable at column I-general rates, particular products of enumerated countries may be eligible for reduced rates of duty or for duty-free entry under one or more preferential tariff programs. Such tariff treatment is set forth in the special subcolumn of HTS column 1.
The Generalized System of Preferences (GSP) affords nonreciprocal tariff preferences to developing countries to aid their economic development and to diversify and expand their production and exports. The U.S. GSP, enacted in title V of the Trade Act of I974 and renewed in the Trade and Tariff Act of 1984, applies to merchandise imported on or after January 1, 1976, and before July 4, 1993. Indicated by the symbol "A" or "A*" in the special subcolumn of column 1, the GSP provides duty-free entry to eligible articles the product of and imported directly from designated beneficiary developing countries, as set forth in general note 3(c)(ii) to the HTS.
The Caribbean Basin Economic Recovery Act (CBERA) affords nonreciprocal tariff preferences to developing countries in the Caribbean Basin area to aid their economic development and to di-
A-2
versify and expand their production and exports. The CBERA, enacted in title II of Public Law 98-67, implemented by Presidential Proclamation 5I33 of November 30, I983, and amended by the Customs and Trade Act of I990, applies to merchandise entered, or withdrawn from warehouse for consumption, on or after January I, I984; this tariff preference program has no expiration date. Indicated by the symbol "E" or "E*" in the special subcolumn of column I, the CBERA provides duty-free entry to eligible articles the product of and imported directly from designated countries, as set forth in general note 3(c)(v) to the HTS.
Preferential rates of duty in the special subcolumn of column I followed by the symbol "IL" are applicable to products of Israel under the United States-Israel Free-Trade Area Implementation Act of I985, as provided in general note 3(c)(vi) of the HTS. When no rate of duty is provided for products of Israel in the special subcolumn for a particular provision, the rate of duty in the general subcolumn of column 1 applies.
Preferential rates of duty in the special duty rates subcolumn of column 1 followed by the symbol "CA" are applicable to eligible goods originating in the territory of Canada under the United States-Canada Free-Trade Agreement, as provided in general note 3(c)(vii) to the HTS.
Other special tariff treatment applies to particular products of insular possessions (general note 3(a)(iv)), goods covered by the Automotive Products Trade Act (general note 3(c)(iii)) and the Agreement on Trade in Civil Aircraft (general note 3(c)(iv)), and articles imponed from freely associated states (general note 3(c)(viii)).
The General Agreement on Tariffs and Trade (GAIT) (61 Stat. (pt. 5) A58; 8 UST (pt. 2) 1786) is the multilateral agreement setting forth basic principles governing international trade among its more than 90 signatories. The GAIT's main obligations relate to most-favored-nation treatment, the maintenance of scheduled concession rates of duty, and national (nondiscriminatory) treatment for imported products. The GAIT also provides the legal framework for customs valuation standards, "escape clause" (emergency) actions, antidumping and countervailing duties, and other

measures. Results of GAIT-sponsored multilateral tariff negotiations are set forth by way of separate schedules of concessions for each participating contracting party, with the U.S. schedule designated as schedule XX.
Officially known as 'The Arrangement Regarding International Trade in Textiles," the Multlfiber A"angement (MFA) provides a framework for the negotiation of bilateral agreements between importing and producing countries, or for unilateral action by importing countries in the absence
of an agreement. These bilateral agreements establish quantitative limits on imports of textiles and apparel, of cotton and other vegetable fibers, wool, manrnade fibers, and silk blends, in order to prevent market disruption in the importing countries-restrictions that would otherwise be a departure from GATT provisions. The United States has bilateral agreements with more than 30 supplying countries, including the four largest suppliers: China, Hong Kong, the Republic of Korea, and Taiwan.
A-3


![SOA - ceit.aut.ac.irceit.aut.ac.ir/~sa_hashemi/My Research/0-Selected Papers/2... · - Scalability -Flexibility [-p] SOA ... XML-RPC SOAP SOAP SOAP SOAP SOAP XMLSOAP SOAP HTTP](https://img.pdfslide.us/doc/110x75/5aad6c0a7f8b9a2e088e2be0/soa-ceitautac-sahashemimy-research0-selected-papers2-scalability-flexibility.jpg)