Embed Size (px)
Citation preview
REDEFINING AFFLUENCE IN CHINA:
CARBON EMISSION FROM PRIVATE TRANSPORTATION
THESIS
AUTHOR: YUN ZHANG (993718492)
SUPERVISOR: PROFESSOR YU-LING CHENG
DIVISION OF ENGINEERING SCIENCE
FACULTY OF APPLIED SCIENCE AND ENGINEERING
UNIVERSITY OF TORONTO
APRIL 11, 2011
i
Abstract
This thesis focuses on the link between economic growth and carbon dioxide emissions in
China’s transportation sector. Specifically, a bottom-up model is constructed to measure the total
carbon dioxide emissions generated from driving privately-owned vehicles. Three scenarios are
designed to illustrate the potential carbon pathways from 2010 to 2030. All three scenarios
assume that the total number of private vehicles will increase from 50.1 to 342.8 million between
2010 and 2030. Other factors such as vehicle usage, technical efficiency change by different
amounts in three scenarios. In the baseline scenario, carbon emissions in 2010, 2020, and 2030
are estimated to be 201, 566, and 968 MtCO2 respectively. With stricter carbon mitigation
measures, the second and third scenarios are estimated to produce 353 and 231 MtCO2 in 2020
and 476 and 257 MtCO2 in 2030. The result shows that it is possible to decouple carbon
emissions from increase in total vehicle stock. A case study is performed on Beijing and
Shanghai’s transport systems to examine the relationship between economic growth and vehicle
stock growth. The comparison shows that policies related to vehicle registration price and urban
planning – such as investments in public transit and road infrastructure – have significant
influence on private vehicle fleet growth.
ii
Acknowledgement
I want to thank Professor Yu-Ling Cheng for supervising this thesis and showing me how to
think critically from different perspectives. I also want to thank Professor Murray Metcalfe for
his opinions on the final draft of this thesis.
It has been a great pleasure to work with everyone at the Centre for Global Engineering –
Professor Yu-Ling Cheng, Professor Murray Metcalfe, Bev Bradley, Marina Freire Gormaly,
Ryan Hum, and Sean Yamana-Hayes.
iii
Glossary
CO2 Carbon dioxide
CSY China Statistical Yearbook
EIA U.S. Energy Information Administration
EIO Economic Input Output
FYP Five Year Plan
GHG Greenhouse Gas
IEA International Energy Agency
IPCC Intergovernmental Panel on Climate Change
IPCC AR4 IPCC Fourth Assessment Report
IPCC TAR IPCC Third Assessment Report
LCA Life Cycle Analysis
MtCO2 Million tonnes of CO2
WRI World Resources Institute
WtW Well to Wheel (LCA of vehicle fuels)
iv
Contents
Abstract ............................................................................................................................................ i
Acknowledgement .......................................................................................................................... ii
Glossary ......................................................................................................................................... iii
List of Tables and Figures.............................................................................................................. vi
1. Introduction ............................................................................................................................. 1
2. Literature Review .................................................................................................................... 2
2.1 Section Summary .................................................................................................................. 2
2.2 Physical Sciences .................................................................................................................. 2
2.2.1 Evidence of Global Warming ......................................................................................... 2
2.2.2 Anthropogenic Processes and Global Warming ............................................................. 4
2.2.3 Strengthened Greenhouse Effect .................................................................................... 5
2.2.4 Greenhouse Gases – Sources and Sinks ......................................................................... 5
2.3 Quantifying CO2 Emissions.................................................................................................. 7
2.3.1 CO2 and China ............................................................................................................... 7
2.3.2 Illustrating Potential Future Carbon Pathways ............................................................... 9
2.4 Road Transportation .............................................................................................................. 9
2.4.1 Current Status and Future Trends ................................................................................. 10
2.4.2 Mitigation Strategies ..................................................................................................... 11
2.4.3 Road Infrastructure ....................................................................................................... 12
3. The 12th
Five-Year-Plan ........................................................................................................ 14
4. Decoupling Carbon Emission from Vehicle Fleet Growth ................................................... 16
4.1 National Vehicle Ownership .......................................................................................... 16
4.2 Bottom-up Model and Scenario Design ......................................................................... 18
4.1.1 Model (National Transport CO2 Inventory) ................................................................. 18
4.1.2 Scenario Design ............................................................................................................ 22
4.3 Results – 2010 to 2030 ................................................................................................... 23
5. Decoupling Vehicle Population Growth from Rising Income .............................................. 27
v
5.1 Regional Vehicle Ownership ......................................................................................... 27
5.2 Beijing and Shanghai ..................................................................................................... 28
5.2.1 Travel Demand........................................................................................................ 28
5.2.2 Public Transportation .............................................................................................. 30
5.2.3 Policy ...................................................................................................................... 31
5.3 Provincial Vehicle Ownership Data and Municipal Policies in Beijing and Shanghai . 31
6. Summary and Discussion ...................................................................................................... 32
Appendix I – World Vehicle Ownership 2010 – 2030 ................................................................. 33
Appendix II – Scenario Design for Bottom-up Model ................................................................. 34
Bibliography ................................................................................................................................. 37
vi
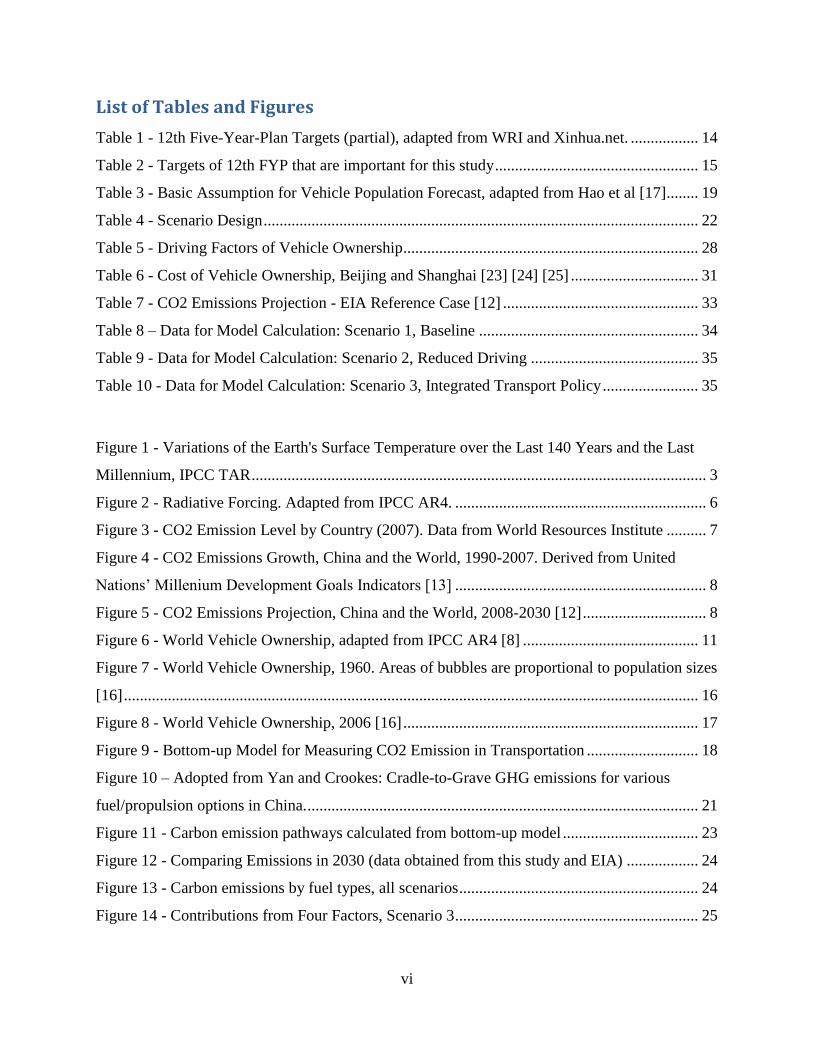
List of Tables and Figures
Table 1 - 12th Five-Year-Plan Targets (partial), adapted from WRI and Xinhua.net. ................. 14
Table 2 - Targets of 12th FYP that are important for this study ................................................... 15
Table 3 - Basic Assumption for Vehicle Population Forecast, adapted from Hao et al [17]........ 19
Table 4 - Scenario Design ............................................................................................................. 22
Table 5 - Driving Factors of Vehicle Ownership .......................................................................... 28
Table 6 - Cost of Vehicle Ownership, Beijing and Shanghai [23] [24] [25] ................................ 31
Table 7 - CO2 Emissions Projection - EIA Reference Case [12] ................................................. 33
Table 8 – Data for Model Calculation: Scenario 1, Baseline ....................................................... 34
Table 9 - Data for Model Calculation: Scenario 2, Reduced Driving .......................................... 35
Table 10 - Data for Model Calculation: Scenario 3, Integrated Transport Policy ........................ 35
Figure 1 - Variations of the Earth's Surface Temperature over the Last 140 Years and the Last
Millennium, IPCC TAR .................................................................................................................. 3
Figure 2 - Radiative Forcing. Adapted from IPCC AR4. ............................................................... 6
Figure 3 - CO2 Emission Level by Country (2007). Data from World Resources Institute .......... 7
Figure 4 - CO2 Emissions Growth, China and the World, 1990-2007. Derived from United
Nations’ Millenium Development Goals Indicators [13] ............................................................... 8
Figure 5 - CO2 Emissions Projection, China and the World, 2008-2030 [12] ............................... 8
Figure 6 - World Vehicle Ownership, adapted from IPCC AR4 [8] ............................................ 11
Figure 7 - World Vehicle Ownership, 1960. Areas of bubbles are proportional to population sizes
[16] ................................................................................................................................................ 16
Figure 8 - World Vehicle Ownership, 2006 [16] .......................................................................... 17
Figure 9 - Bottom-up Model for Measuring CO2 Emission in Transportation ............................ 18
Figure 10 – Adopted from Yan and Crookes: Cradle-to-Grave GHG emissions for various
fuel/propulsion options in China. .................................................................................................. 21
Figure 11 - Carbon emission pathways calculated from bottom-up model .................................. 23
Figure 12 - Comparing Emissions in 2030 (data obtained from this study and EIA) .................. 24
Figure 13 - Carbon emissions by fuel types, all scenarios ............................................................ 24
Figure 14 - Contributions from Four Factors, Scenario 3 ............................................................. 25
vii
Figure 15 - China Vehicle Ownership, by Provinces and Autonomous Cities. Data from CSY
1990-2009. Red: Beijing, Blue: Shanghai, Green: Other provinces/cities. .................................. 27
Figure 16 - Population Density, Beijing and Shanghai [24] [25] ................................................. 29
Figure 17 - Subway Route Density, Beijing and Shanghai [24] [25] ........................................... 30
Figure 18 - Bus Route Density, Beijing and Shanghai [24] [25] .................................................. 30
1
1. Introduction
In 2006, China surpassed US to become the biggest carbon dioxide (CO2) emitter in the world
[1]. Some studies suggest that China will at least double its CO2 emission by 2030 compared to
its emission level in 2005 [2] due to rising income level and rapid urbanization.
Many literature studies have focused on measuring the impact of consumption on CO2 emissions.
One recent study shows that consumer activities account for about 80% of the total carbon
emission in US [3], another study shows how different categories of consumption impact CO2
emissions in China [4]. However, little attention has been given to developing low-carbon
pathways for China’s rising mid- and upper-classes, although current consumption pattern is
already a contributor to high carbon emission [2]. This research gap will be addressed in this
thesis with a specific focus on transportation. The motivations behind this focus are: 1) it is more
desirable to understand one area well rather than briefly mention all consumption categories, and
2) transportation is a major carbon emitting sector,
2
2. Literature Review
2.1 Section Summary
This section summarizes the important work related to global warming, carbon emissions, and
transportation. Since this thesis spans across a number of distinct engineering and science
disciplines, the review is divided into three sub-sections to facilitate understanding: Physical
Sciences, Quantifying CO2 Emission, and Transportation. Physical Sciences section establishes
the foundation. Quantifying CO2 Emission explores a set of top-down and bottom-up
methodologies for accounting carbon emission. Transportation covers a set of transportation
related topics that have been discussed in current literature.
2.2 Physical Sciences
In this first chapter, a few fundamental questions are discussed – what is climate change is and
why is it an important issue? What has happened in the past century? What is the future of
climate change? Each question alone can take years to complete, therefore information presented
in this chapter is from credible scientific discoveries.
These discoveries validate the value of this thesis by stating that climate change attributed to
human activities is evident. Readers should also see how key objectives of this thesis emerge
from this chapter.
2.2.1 Evidence of Global Warming
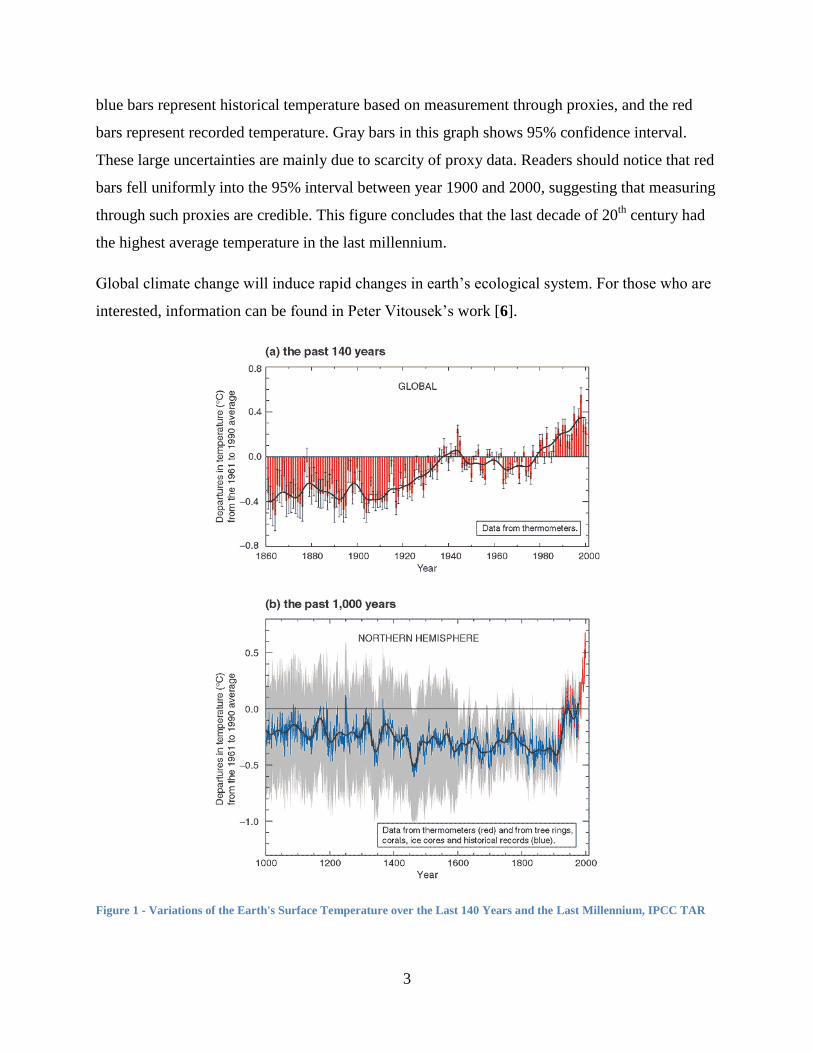
Temperature has been well documented globally in the past century. A figure is taken from IPCC
(Intergovernmental Panel on Climate Change) 1992 report to show the trend of average surface
temperature in the past 140 years and past millennium respectively [5].
Figure 1(a) (on next page) – Red bars show the Earth's surface temperature from year 1860 to
2000. The black whisker bars represent the 95% confidence interval. Uncertainties of data are
mainly due to data gaps, instrumental errors, bias corrections in ocean surface temperature data,
and adjustments for urbanization. In conclusion, the global average surface temperature
increased 0.6 ± 0.2°C between 1860 and 2000.
Figure 1(b) – Interestingly, scientists were also able to estimate the global surface temperature
through a set of proxies, namely tree rings, corals, ice cores, and other historical records. The
3
blue bars represent historical temperature based on measurement through proxies, and the red
bars represent recorded temperature. Gray bars in this graph shows 95% confidence interval.
These large uncertainties are mainly due to scarcity of proxy data. Readers should notice that red
bars fell uniformly into the 95% interval between year 1900 and 2000, suggesting that measuring
through such proxies are credible. This figure concludes that the last decade of 20th
century had
the highest average temperature in the last millennium.
Global climate change will induce rapid changes in earth’s ecological system. For those who are
interested, information can be found in Peter Vitousek’s work [6].
Figure 1 - Variations of the Earth's Surface Temperature over the Last 140 Years and the Last Millennium, IPCC TAR
4
2.2.2 Anthropogenic Processes and Global Warming
The next question is: to what extent are human activities causing global warming? Public
opinions are divided. There has been an on-going debate on whether human activities have
caused global warming. Arguments mainly concentrate in these areas: (1) whether scientific
consensus exists, (2) whether IPCC result can be viewed as the “standard”, (3) inaccuracy in
temperature measurements and variations in local temperatures, and (4) solar radiation variation.
This section does not examine all of these issues due to their complexity. However, the following
paragraphs do provide the readers an idea about the current scientific consensus.
IPCC 2001 report has stated that:
“An increasing body of observations gives a collective picture of a warming world and
other changes in the climate system... There is new and stronger evidence that most of the
warming observed over the last 50 years is attributable to human activities [7]”
In 2007, IPCC released another report with increased confidence in the causal relationship
between human activities and global warming. According to this report, human activities are
“very likely” – with 90% or greater probability – the main cause for global warming. It is
determined that global warming was characterized by 0.74 ± 0.18 °C increase in earth’s surface
temperature during the 20th
century [8], and it was largely anthropogenic.
IPCC’s statement represented not only opinions from a few elite scientists, but also a scientific
consensus. A paper (2010) in the Proceedings of the National Academy of Sciences of the United
States reviewed publication and citation data for 1,372 climate researchers and concluded [9]:
“(i) 97–98% of the climate researchers most actively publishing in the field support the
tenets of ACC (Anthropogenic Climate Change) outlined by the Intergovernmental Panel
on Climate Change, and (ii) the relative climate expertise and scientific prominence of
the researchers unconvinced of ACC are substantially below that of the convinced
researchers.”
Therefore, scientific community has a strong consensus that global warming since the mid-20th
century is mainly caused by human activities.
5
2.2.3 Strengthened Greenhouse Effect
The next question to ask is: how are anthropogenic activities causing global warming?
If the Earth is a perfect blackbody – absorbing and emitting all solar radiation – it would have
had a temperature of 5.3 degrees Celsius. To arrive at this result, first examine the Stefan-
Boltzmann equation:
Equation 1 - Stefan-Boltzmann Law
Variable refers to the amount of radiation per unit area this blackbody emits/absorbs, and is
a constant. Variable is the temperature of this perfect blackbody in Kelvins. The value of can
be calculated based on the known value of solar radiation density. If the Earth were a perfect
blackbody, temperature will turn out to be 5.3 degrees Celsius. Since the Earth is not a perfect
blackbody, this equation can be modified to show that Earth is about -18 °C. However, Earth’s
actual average temperature is about 33°C higher than that. Earth’s has an atmosphere. This layer
of gas atmosphere partially traps solar radiation, and the trapped radiation heats up the Earth’s
surface. This effect is referred to as the greenhouse effect.
Since water’s freezing point is lower than 15°C and surface temperature is a continuous function,
greenhouse effect enables water to exist as liquid and consequently supports all life forms on
earth.
In the past 300 years, humans have gone through several huge leaps in technology. With higher
industrial production intensity, higher population density, and more intense farming activities,
the Earth’s atmosphere is becoming denser and the greenhouse effect is strengthened. Thus the
average surface temperature is higher.
Having understood the concept in this section, one could see that “strengthened greenhouse
effect” is a more accurate term to explain global warming, thus the title of this section.
2.2.4 Greenhouse Gases – Sources and Sinks
The next step is to illustrate how human activities are strengthening greenhouse effect. IPCC’s
Fourth Assessment Report (AR4) stated that "changes in atmospheric concentrations of
greenhouse gases and aerosols, land cover and solar radiation alter the energy balance of the
6
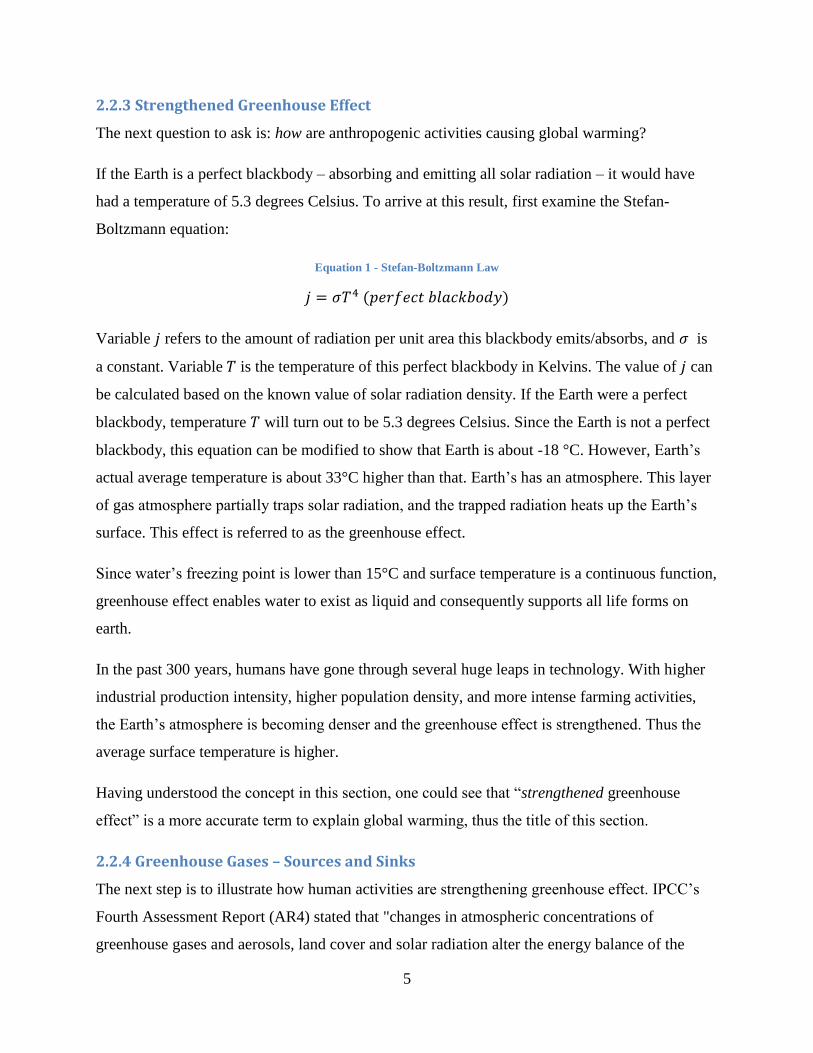
climate system". The figure below illustrates how different components of human activities
contribute to radiative forcing between year 1750 and 2005. Year 1750 is conveniently used in
literature as the beginning year of Industrial Revolution.
Ramaswamy et al. (2001) stated that radiative forcing (RF) is “the change in net (down minus up)
irradiance (solar plus longwave; in W m–2
) at the tropopause after allowing for stratospheric
temperatures to readjust to radiative equilibrium, but with surface and tropospheric temperatures
and state held fixed at the unperturbed values.” [8] Despite the complicated science behind this
phenomenon, a simple equation captures the relationship between Earth’s surface temperature
and radiative forcing:
Equation 2 - Temperature change and radiative forcing
According to scientific experiments [10] [11], change in temperature in Kelvin has
approximately the same numeric value of radiative forcing in Wm2. Equipped with this piece of
knowledge, one can more readily make sense of the following figure.
Figure 2 - Radiative Forcing. Adapted from IPCC AR4.
7
2.3 Quantifying CO2 Emissions
2.3.1 CO2 and China
From this point on, this thesis mainly focuses on the emission problem of carbon dioxide (CO2).
CO2 is the major cause of strengthened greenhouse effect both in the past and in the foreseeable
future. Readers can refer to the previous section and later discussion in this thesis to verify.
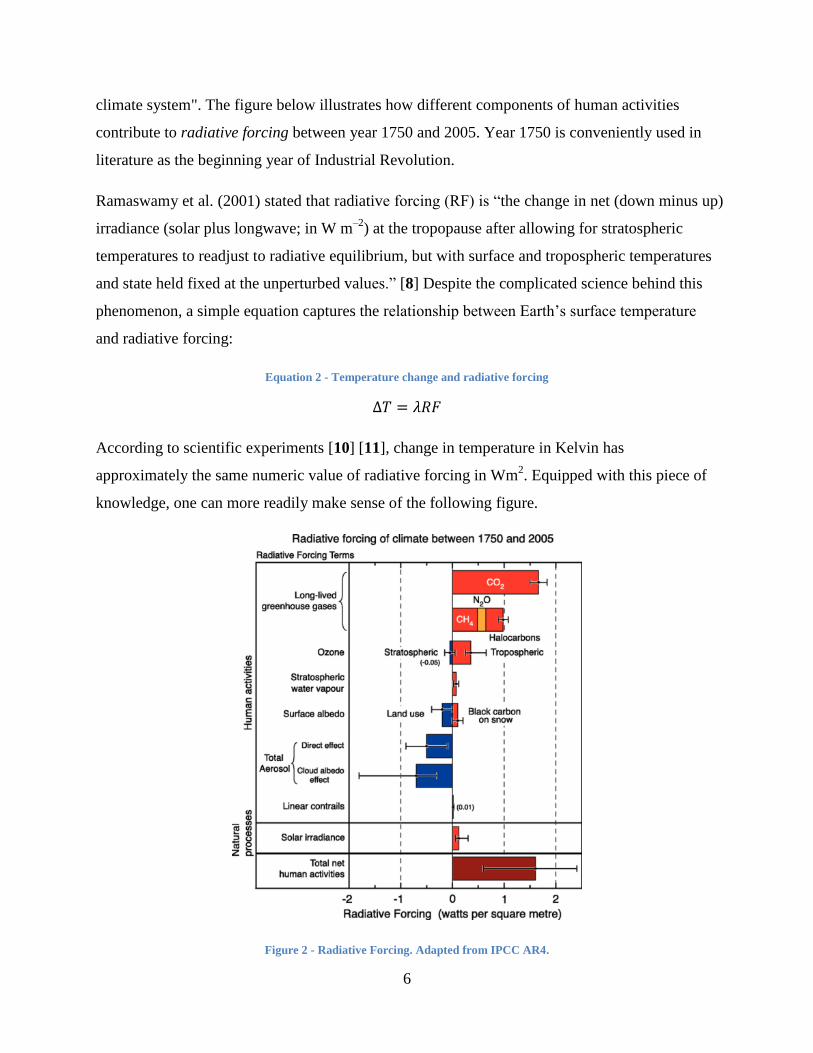
According to both World Resources Institute and World Bank, China surpassed United States to
become the top emitter in the world around 2006. The following chart on 2007 emission level is
based data obtained from World Resources Institute [12].
Figure 3 - CO2 Emission Level by Country (2007). Data from World Resources Institute
6,702.60
5,826.70
4,064.50
1,626.30 1,410.40 1,270.10 817.2 583.9 530.2 517.1
10186
CO2 Emission Level by Country (2007)
MtCO2e
8
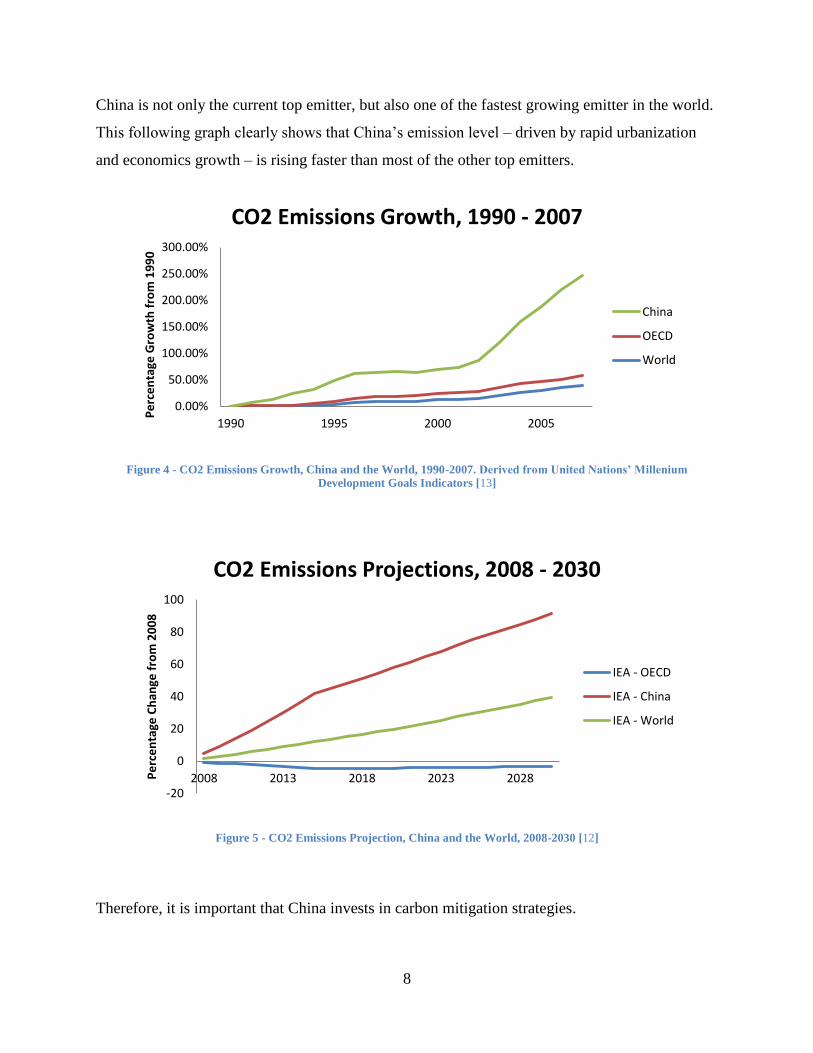
China is not only the current top emitter, but also one of the fastest growing emitter in the world.
This following graph clearly shows that China’s emission level – driven by rapid urbanization
and economics growth – is rising faster than most of the other top emitters.
Figure 4 - CO2 Emissions Growth, China and the World, 1990-2007. Derived from United Nations’ Millenium
Development Goals Indicators [13]
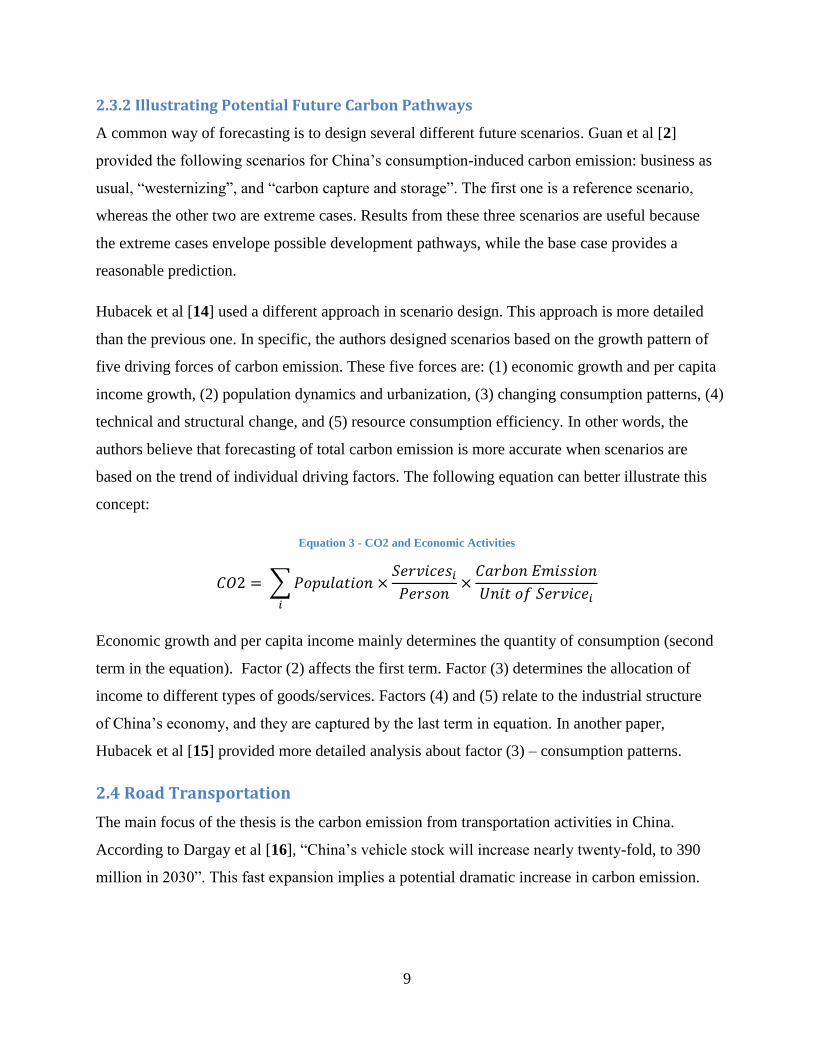
Figure 5 - CO2 Emissions Projection, China and the World, 2008-2030 [12]
Therefore, it is important that China invests in carbon mitigation strategies.
0.00%
50.00%
100.00%
150.00%
200.00%
250.00%
300.00%
1990 1995 2000 2005
Pe
rce
nta
ge G
row
th f
rom
19
90
CO2 Emissions Growth, 1990 - 2007
China
OECD
World
-20
0
20
40
60
80
100
2008 2013 2018 2023 2028Pe
rce
nta
ge C
han
ge f
rom
20
08
CO2 Emissions Projections, 2008 - 2030
IEA - OECD
IEA - China
IEA - World
9
2.3.2 Illustrating Potential Future Carbon Pathways
A common way of forecasting is to design several different future scenarios. Guan et al [2]
provided the following scenarios for China’s consumption-induced carbon emission: business as
usual, “westernizing”, and “carbon capture and storage”. The first one is a reference scenario,
whereas the other two are extreme cases. Results from these three scenarios are useful because
the extreme cases envelope possible development pathways, while the base case provides a
reasonable prediction.
Hubacek et al [14] used a different approach in scenario design. This approach is more detailed
than the previous one. In specific, the authors designed scenarios based on the growth pattern of
five driving forces of carbon emission. These five forces are: (1) economic growth and per capita
income growth, (2) population dynamics and urbanization, (3) changing consumption patterns, (4)
technical and structural change, and (5) resource consumption efficiency. In other words, the
authors believe that forecasting of total carbon emission is more accurate when scenarios are
based on the trend of individual driving factors. The following equation can better illustrate this
concept:
Equation 3 - CO2 and Economic Activities
∑
Economic growth and per capita income mainly determines the quantity of consumption (second
term in the equation). Factor (2) affects the first term. Factor (3) determines the allocation of
income to different types of goods/services. Factors (4) and (5) relate to the industrial structure
of China’s economy, and they are captured by the last term in equation. In another paper,
Hubacek et al [15] provided more detailed analysis about factor (3) – consumption patterns.
2.4 Road Transportation
The main focus of the thesis is the carbon emission from transportation activities in China.
According to Dargay et al [16], “China’s vehicle stock will increase nearly twenty-fold, to 390
million in 2030”. This fast expansion implies a potential dramatic increase in carbon emission.
10
2.4.1 Current Status and Future Trends
On the global level, transport relies almost entirely (95%) on petroleum. In 2004, transport was
“responsible for 23% of world energy-related GHG emissions with about three quarters coming
from road vehicles.” In addition, the GHG emission from transportation has increased at a rate
faster than any other energy intensive sector [8].
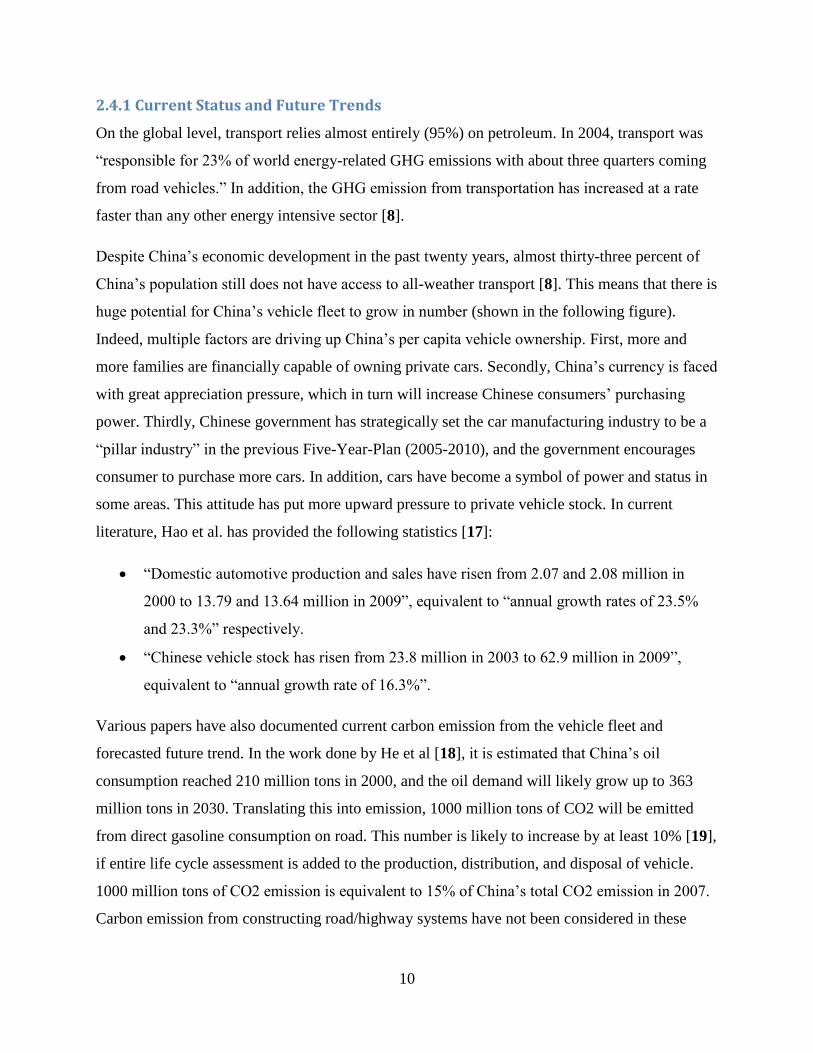
Despite China’s economic development in the past twenty years, almost thirty-three percent of
China’s population still does not have access to all-weather transport [8]. This means that there is
huge potential for China’s vehicle fleet to grow in number (shown in the following figure).
Indeed, multiple factors are driving up China’s per capita vehicle ownership. First, more and
more families are financially capable of owning private cars. Secondly, China’s currency is faced
with great appreciation pressure, which in turn will increase Chinese consumers’ purchasing
power. Thirdly, Chinese government has strategically set the car manufacturing industry to be a
“pillar industry” in the previous Five-Year-Plan (2005-2010), and the government encourages
consumer to purchase more cars. In addition, cars have become a symbol of power and status in
some areas. This attitude has put more upward pressure to private vehicle stock. In current
literature, Hao et al. has provided the following statistics [17]:
“Domestic automotive production and sales have risen from 2.07 and 2.08 million in
2000 to 13.79 and 13.64 million in 2009”, equivalent to “annual growth rates of 23.5%
and 23.3%” respectively.
“Chinese vehicle stock has risen from 23.8 million in 2003 to 62.9 million in 2009”,
equivalent to “annual growth rate of 16.3%”.
Various papers have also documented current carbon emission from the vehicle fleet and
forecasted future trend. In the work done by He et al [18], it is estimated that China’s oil
consumption reached 210 million tons in 2000, and the oil demand will likely grow up to 363
million tons in 2030. Translating this into emission, 1000 million tons of CO2 will be emitted
from direct gasoline consumption on road. This number is likely to increase by at least 10% [19],
if entire life cycle assessment is added to the production, distribution, and disposal of vehicle.
1000 million tons of CO2 emission is equivalent to 15% of China’s total CO2 emission in 2007.
Carbon emission from constructing road/highway systems have not been considered in these
11
studies. Since cement production is extremely carbon intensive [20], the total carbon emission
reported by He et al is likely underestimated.
Figure 6 - World Vehicle Ownership, adapted from IPCC AR4 [8]
2.4.2 Mitigation Strategies
Transportation carbon emission can be reduced by various means. Comparing existing mitigation
strategies can yield insights. Before reviewing papers about mitigation strategies, this equation is
designed to conceptually capture the various contributors of carbon emissions:
Equation 4 - CO2 from Transportation
∑∑
12
Wu et al [21] analyzed seven categories of emission control policies in Beijing, namely (1)
emission control on new vehicles; (2) emission control on in-use vehicles; (3) fuel quality
improvements; (4) alternative fuel and advanced vehicles; (5) economic policies; (6) public
transport; and (7) temporal traffic control measures. The study discovered that Beijing’s road
transportation emission increased from 1995 to 1998, but decreased from 1999 to 2009 due to
aggressive pursuit of technical efficiency. However, efficiency gain is bounded, and the
continued rapid growth of vehicle stock is a challenging problem.
In another two studies [22] [23], researchers discussed the unique challenges faced by Shanghai
policy-makers. Similar to Beijing, Shanghai has one of the highest income levels in China.
Shanghai is also home to a nascent automotive industry. The problem was further complicated
by the national government’s decision to use automobile industry to drive economic growth.
Such policy has put strong upward pressure on the level of motorization in Shanghai.
Yet Shanghai’s vehicle ownership remained remarkably low, especially compared with other
highly developed urban centres in China. The reasons can be summarized into (1) high
population density; (2) aggressively introduced competition into bus supply system; (3)
congestion already a problem with large number of 2-wheel vehicles; (4) high registration and
license fees.
These studies did not provide any quantitative analysis regarding Shanghai or Beijing’s vehicle
ownership. Chapter 5 will explore this topic based on information found in, for example, national
and municipal Statistical Yearbooks [24] [25].
A number of other studies also confirmed these discoveries about the driving forces and blocking
agents in private vehicle ownership [26] [27].
2.4.3 Road Infrastructure
Road infrastructure is an important foundation for transport development and economic
development in general. For inter-city transport, China’s total highway length and total
expressway length increased from 0.9 to 3.6 million km (1978-2007) and 0.1 to 53.9 million km
(1988-2007) respectively. China’s total urban road network length increased from 29,000 km to
246,000 km between 1980 and 2007, and total urban network area increased from 300 to 4200
km2
in the same period of time [28].
13
Despite the rapid construction of road transportation network, infrastructure change still could
not keep pace with the vehicle fleet growth. With vehicle fleet still expanding at a high rate, it is
unlikely that infrastructure construction will catch up. In fact, building more roads is not a long
term solution to congestion problem. The more extensive the road network is, the more people
will buy and drive their cars. This is especially true in most urban centres in China due to high
population densities [29].
Road infrastructure also has a strong link with CO2 emissions. Guan et al. calculated that capital
investment contributed to about half of China’s CO2 emissions in 2007, and 63% of it comes
from construction [2].
Therefore, carefully urban planning, restriction on private vehicle use, and promotion of public
transit will therefore result in carbon mitigation in three ways – reduction of construction,
reduction in use of private vehicles, and higher utilization rate of energy- and carbon-efficient
public transit system.
The next chapter examines China’s 12th
Five-Year-Plan Draft, released in March 2011. It
includes plans for tackling some of the environmental challenges discussed in this chapter.
14
3. The 12th Five-Year-Plan
A draft of the much anticipated 12th
Five-Year-Plan (FYP) was released on March 5th
, 2011 in
the National People’s Congress in China. One observation about this FYP is notable: not only
did this FYP mention climate change for the first time in the history of FYP’s, but it also put
climate change at the beginning of the environmental section.
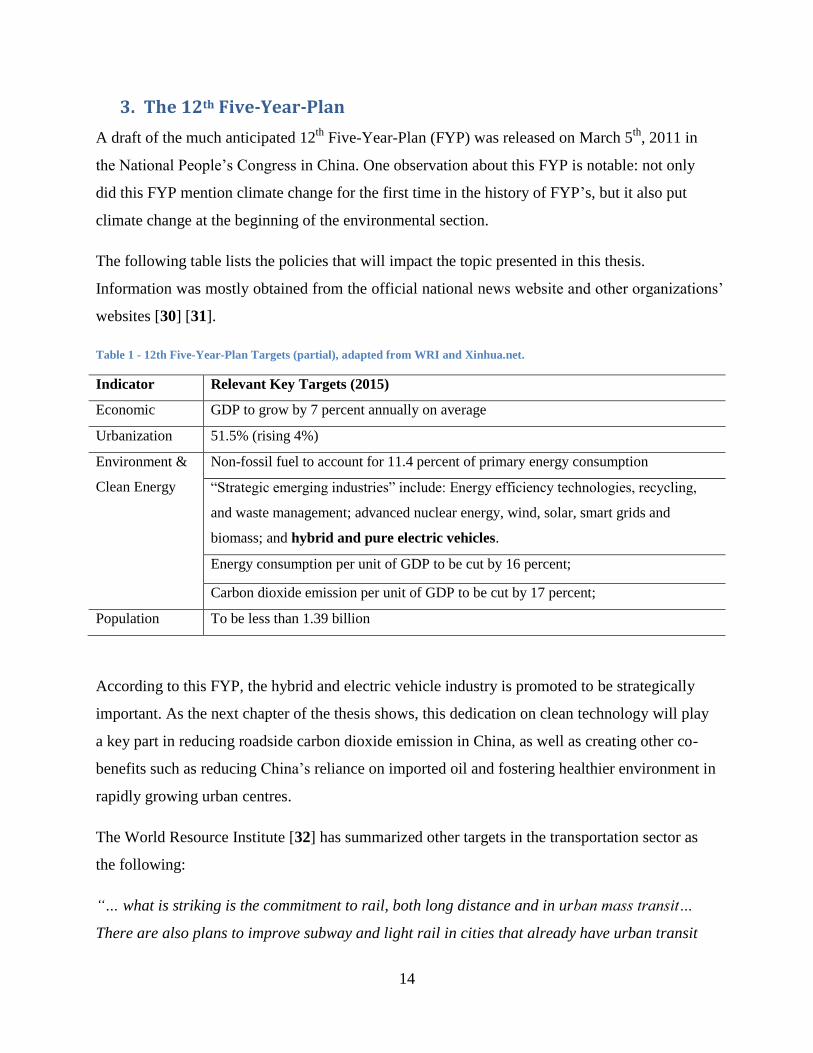
The following table lists the policies that will impact the topic presented in this thesis.
Information was mostly obtained from the official national news website and other organizations’
websites [30] [31].
Table 1 - 12th Five-Year-Plan Targets (partial), adapted from WRI and Xinhua.net.
Indicator Relevant Key Targets (2015)
Economic GDP to grow by 7 percent annually on average
Urbanization 51.5% (rising 4%)
Environment &
Clean Energy
Non-fossil fuel to account for 11.4 percent of primary energy consumption
“Strategic emerging industries” include: Energy efficiency technologies, recycling,
and waste management; advanced nuclear energy, wind, solar, smart grids and
biomass; and hybrid and pure electric vehicles.
Energy consumption per unit of GDP to be cut by 16 percent;
Carbon dioxide emission per unit of GDP to be cut by 17 percent;
Population To be less than 1.39 billion
According to this FYP, the hybrid and electric vehicle industry is promoted to be strategically
important. As the next chapter of the thesis shows, this dedication on clean technology will play
a key part in reducing roadside carbon dioxide emission in China, as well as creating other co-
benefits such as reducing China’s reliance on imported oil and fostering healthier environment in
rapidly growing urban centres.
The World Resource Institute [32] has summarized other targets in the transportation sector as
the following:
“… what is striking is the commitment to rail, both long distance and in urban mass transit…
There are also plans to improve subway and light rail in cities that already have urban transit
15
systems, building new systems in at least nine other cities, and making plans for six or more
cities.”
Although public transportation is not a key focus in this thesis, the development of public
transport systems inevitably influences the trajectory of carbon emission from private vehicle
usage. More details will be explored in the next chapter.
In the next chapter, a bottom-up model will be introduced in illustrating the future carbon
pathways of private transportation. Three scenarios will be introduced – one baseline scenario
and two carbon-saving scenarios. Key targets from the 12th
FYP influences the design of the two
carbon-saving scenarios.
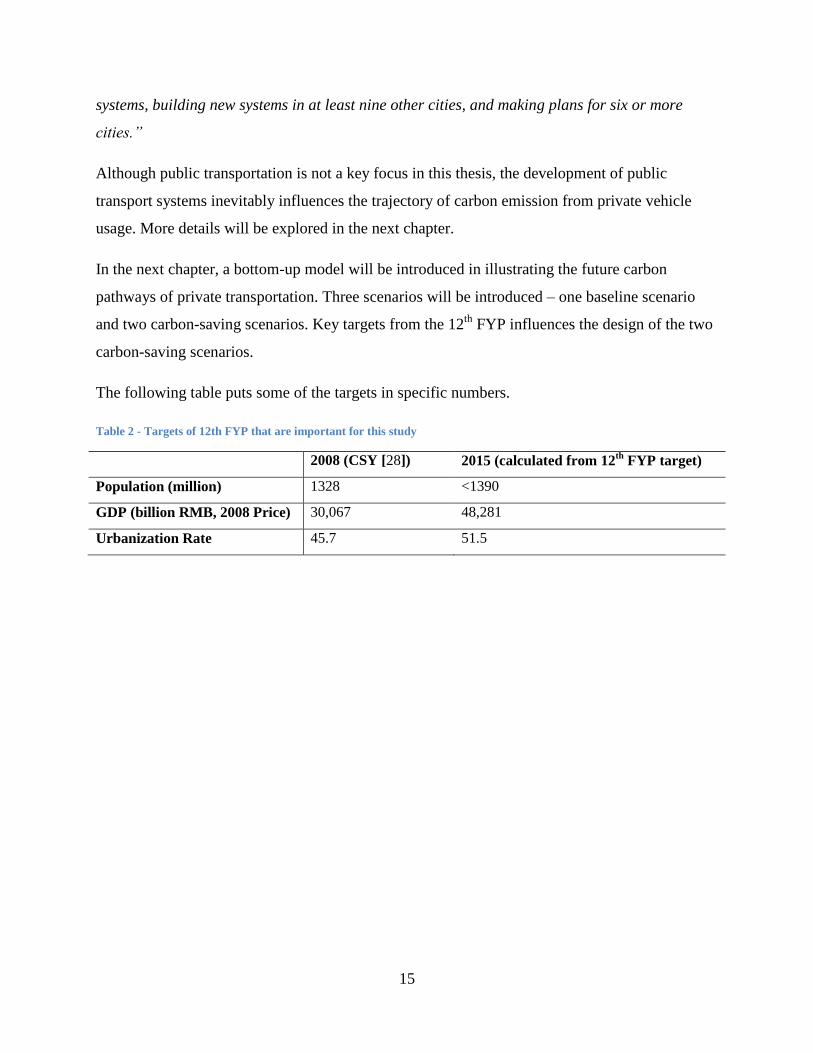
The following table puts some of the targets in specific numbers.
Table 2 - Targets of 12th FYP that are important for this study
2008 (CSY [28]) 2015 (calculated from 12th
FYP target)
Population (million) 1328 <1390
GDP (billion RMB, 2008 Price) 30,067 48,281
Urbanization Rate 45.7 51.5
16
4. Decoupling Carbon Emission from Vehicle Fleet Growth
After setting up the context (Chapter 2) and introducing high level goals from the 12th
FYP
(Chapter 3), this chapter explores a bottom-up model that quantifies China’s current (2010)
carbon emission from private transportation, and shows three different emission pathways from
2010 to 2030.
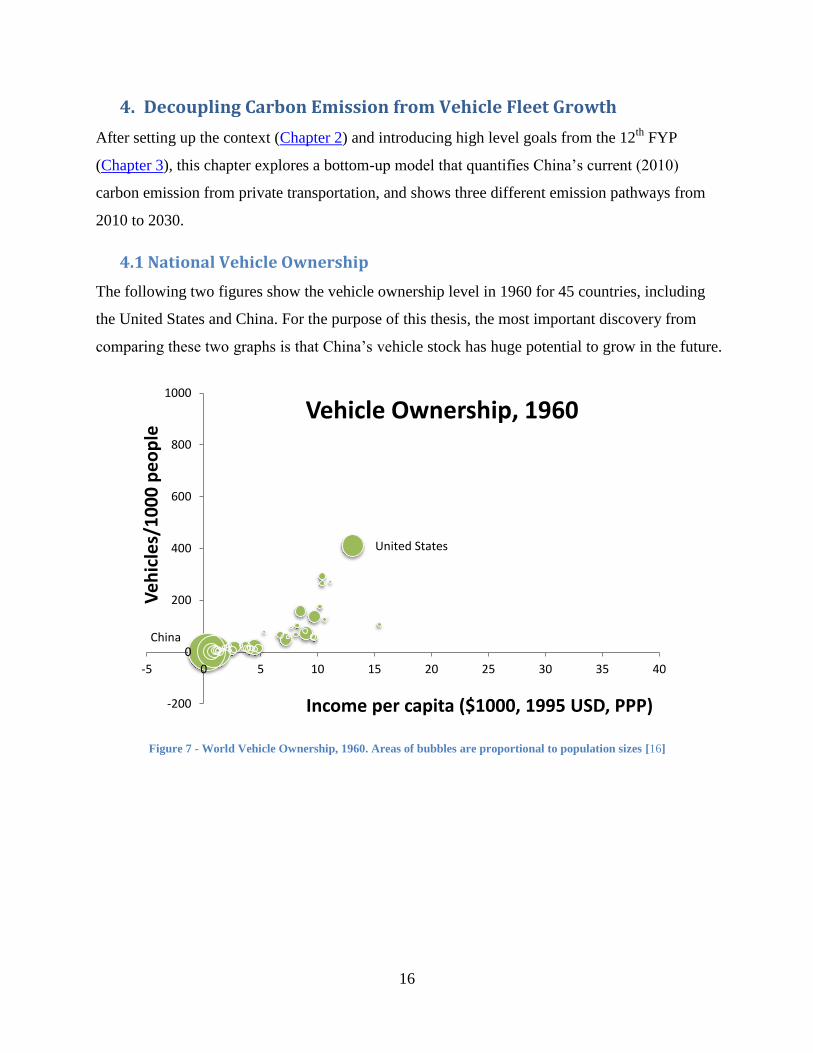
4.1 National Vehicle Ownership
The following two figures show the vehicle ownership level in 1960 for 45 countries, including
the United States and China. For the purpose of this thesis, the most important discovery from
comparing these two graphs is that China’s vehicle stock has huge potential to grow in the future.
Figure 7 - World Vehicle Ownership, 1960. Areas of bubbles are proportional to population sizes [16]
United States
China
-200
0
200
400
600
800
1000
-5 0 5 10 15 20 25 30 35 40
Ve
hic
les/
10
00
pe
op
le
Income per capita ($1000, 1995 USD, PPP)
Vehicle Ownership, 1960
17
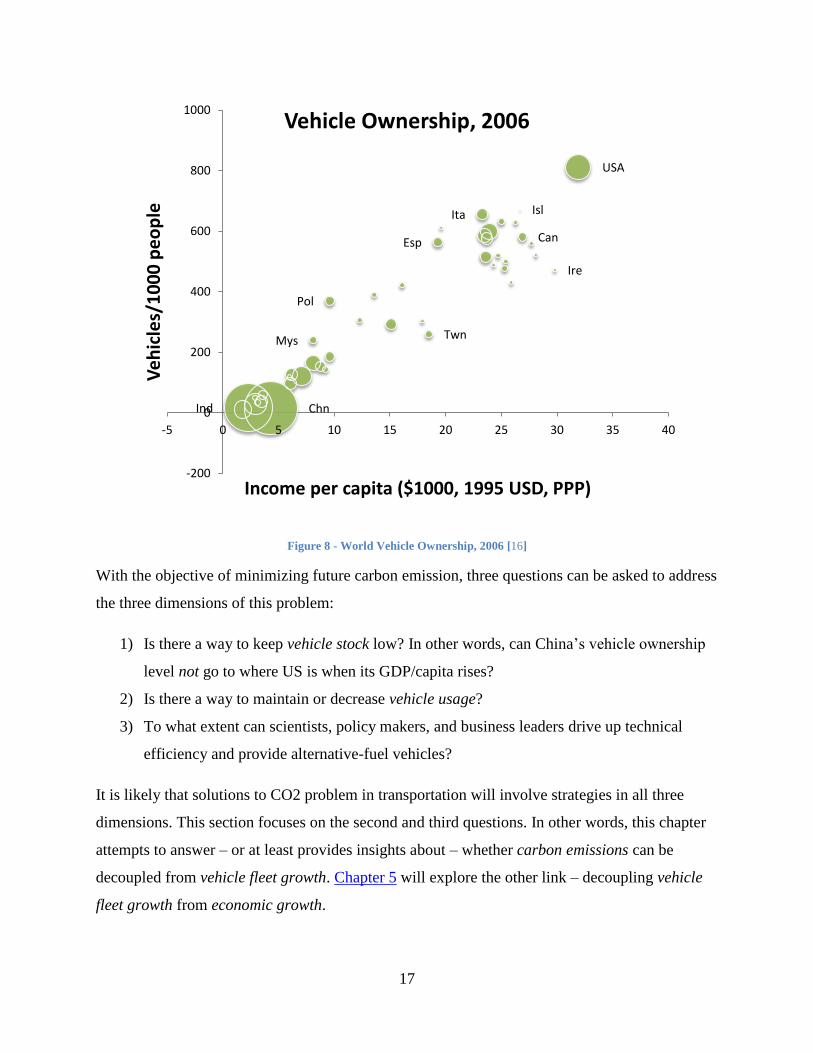
Figure 8 - World Vehicle Ownership, 2006 [16]
With the objective of minimizing future carbon emission, three questions can be asked to address
the three dimensions of this problem:
1) Is there a way to keep vehicle stock low? In other words, can China’s vehicle ownership
level not go to where US is when its GDP/capita rises?
2) Is there a way to maintain or decrease vehicle usage?
3) To what extent can scientists, policy makers, and business leaders drive up technical
efficiency and provide alternative-fuel vehicles?
It is likely that solutions to CO2 problem in transportation will involve strategies in all three
dimensions. This section focuses on the second and third questions. In other words, this chapter
attempts to answer – or at least provides insights about – whether carbon emissions can be
decoupled from vehicle fleet growth. Chapter 5 will explore the other link – decoupling vehicle
fleet growth from economic growth.
Can
USA
Esp
Ire
Isl Ita
Pol
Chn
Twn
Ind
Mys
-200
0
200
400
600
800
1000
-5 0 5 10 15 20 25 30 35 40
Ve
hic
les/
10
00
pe
op
le
Income per capita ($1000, 1995 USD, PPP)
Vehicle Ownership, 2006
18
4.2 Bottom-up Model and Scenario Design
A bottom-up model generally has the advantage of being able to provide more insights about
different components in a system. In this case, bottom-up model provides a more robust way of
analyzing how different factors contribute to total emission. On the other hand, bottom-up
approach usually suffers from the boundary problem. For this thesis, the bottom up model only
examines private transportation in China, and it does not capture emission embedded in
manufacturing these privately-owned vehicles. Carbon emission embedded in producing the
fuels is included (the so-called Well-to-Wheel approach). According to Hendrickson et al [33],
the manufacturing and delivery of cars are not major contributors of carbon dioxide emission.
Furthermore, since the thesis focuses on comparing different emission pathways within the same
bottom-up model, it is not significant to include the entire life-cycle emission of vehicles.
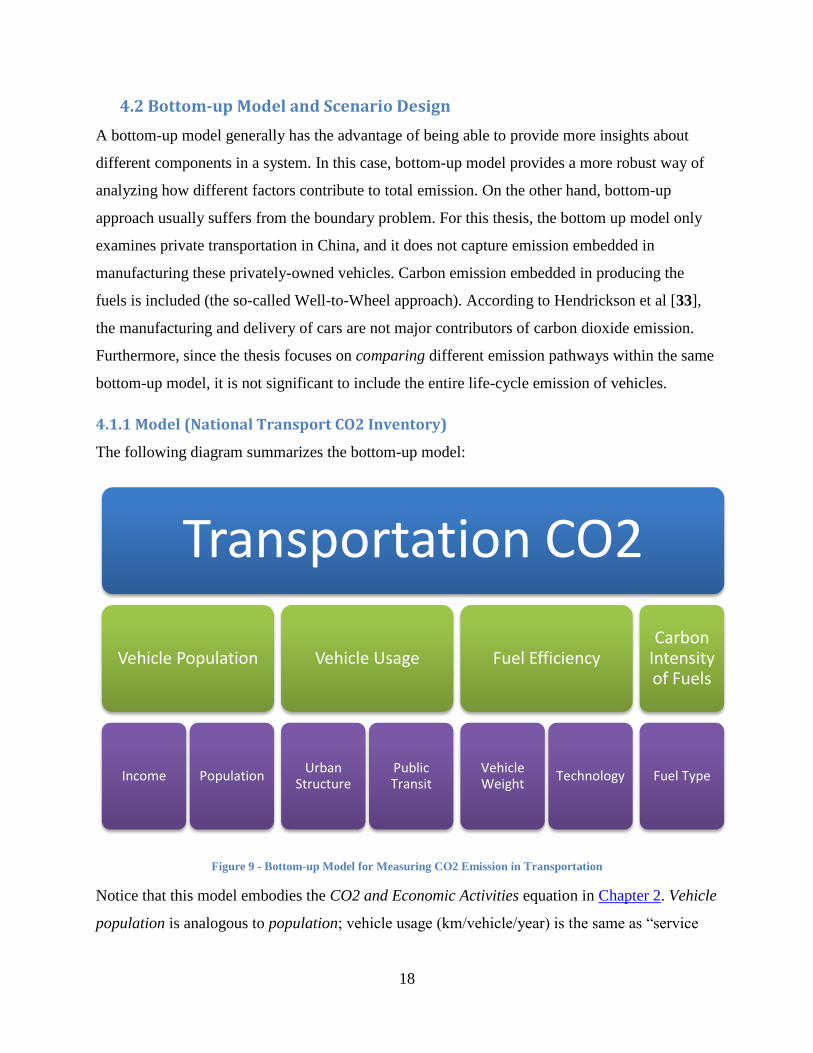
4.1.1 Model (National Transport CO2 Inventory)
The following diagram summarizes the bottom-up model:
Figure 9 - Bottom-up Model for Measuring CO2 Emission in Transportation
Notice that this model embodies the CO2 and Economic Activities equation in Chapter 2. Vehicle
population is analogous to population; vehicle usage (km/vehicle/year) is the same as “service
Transportation CO2
Vehicle Population
Income Population
Vehicle Usage
Urban Structure
Public Transit
Fuel Efficiency
Vehicle Weight
Technology
Carbon Intensity of Fuels
Fuel Type
19
per capita”; and fuel efficiency and carbon intensity of fuels correspond to carbon intensity/unit
of service.
Vehicle Population
In China Statistical Yearbook [28], private vehicles show up in two different places. Take CSY
2009 as an example. Section 15-27 of the Yearbook is dedicated to “Private Vehicle Ownership”.
In one dimension, vehicles are divided into “Passenger Vehicles” and “Trucks”. Within each of
the two categories, vehicles are further divided into four different subgroups according to vehicle
length. In another dimension, vehicles are sorted by the province in which they are registered.
Another place that shows private vehicle ownership is section 9-14 in CSY 2009. This section is
named “Ownership of Durable Consumer Goods per 100 Urban Households at Year-end by
Level of Income”. In this section, private vehicles are represented by “motorcycle”, “hand car”,
and “automobile”. There is another section dedicated to durable goods in rural households,
however, it does not mention the number of vehicles owned per house. Therefore, vehicle
ownership in rural households are extrapolated from urban household data.
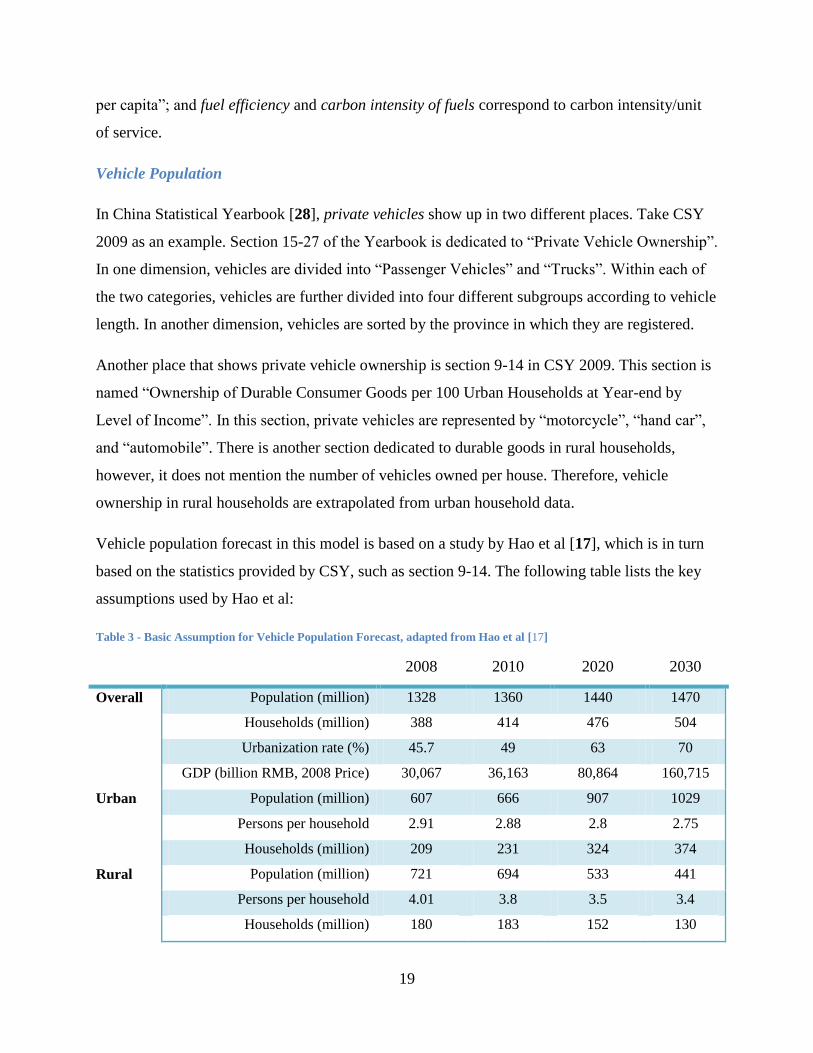
Vehicle population forecast in this model is based on a study by Hao et al [17], which is in turn
based on the statistics provided by CSY, such as section 9-14. The following table lists the key
assumptions used by Hao et al:
Table 3 - Basic Assumption for Vehicle Population Forecast, adapted from Hao et al [17]
2008 2010 2020 2030
Overall Population (million) 1328 1360 1440 1470
Households (million) 388 414 476 504
Urbanization rate (%) 45.7 49 63 70
GDP (billion RMB, 2008 Price) 30,067 36,163 80,864 160,715
Urban Population (million) 607 666 907 1029
Persons per household 2.91 2.88 2.8 2.75
Households (million) 209 231 324 374
Rural Population (million) 721 694 533 441
Persons per household 4.01 3.8 3.5 3.4
Households (million) 180 183 152 130
20
Notice that the assumptions for population, GDP, and urbanization rate by Hao et al. are close to
the 2015 targets set by 12th
FYP (chapter 3).
Based on these assumptions, and other socio-economic parameters obtained from CSY, Hao et al
estimated that the vehicle population by 2010, 2020, and 2030 are 30.19, 134.4, and 307.2
million respectively.
Vehicle Usage
Vehicle usage is not documented in CSYs. Despite the lack of data, the study still remains useful
if it has (1) different scenarios to capture the range of possible outcomes by 2030, and (2) base
the vehicle usage levels on realistic basis. Numbers in this study is based on two other Asian
countries – Korea (South) and Japan. More details are explored in the scenario design section.
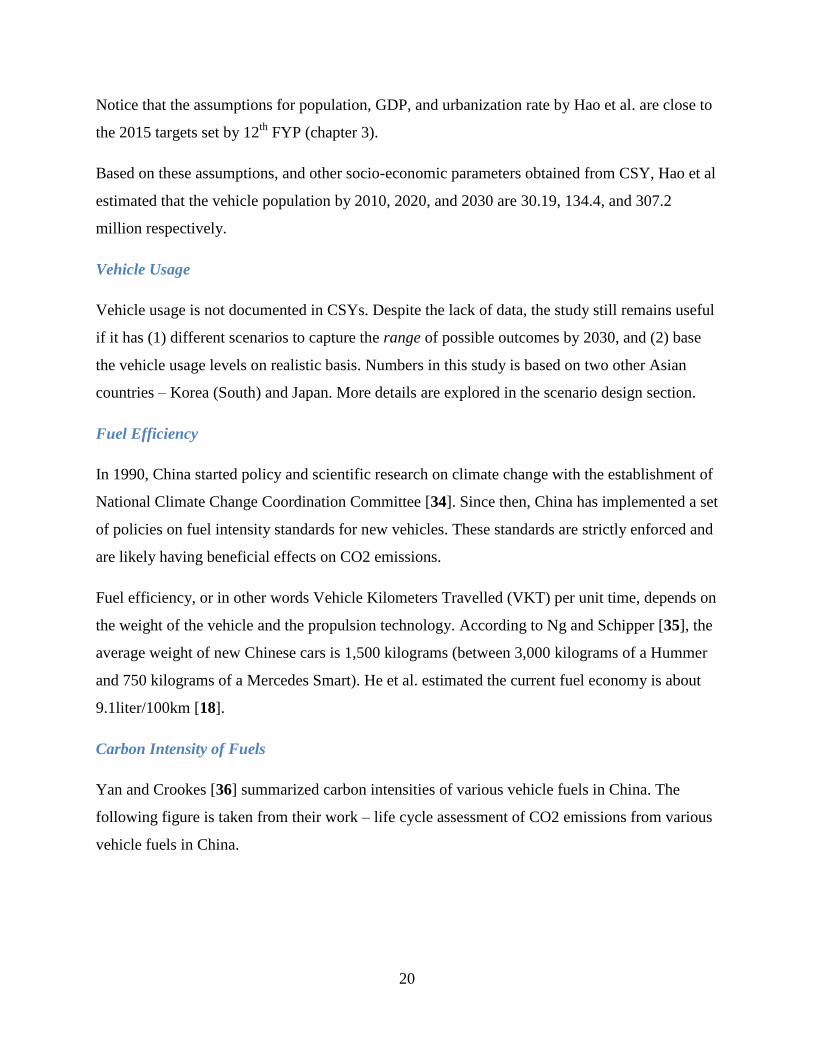
Fuel Efficiency
In 1990, China started policy and scientific research on climate change with the establishment of
National Climate Change Coordination Committee [34]. Since then, China has implemented a set
of policies on fuel intensity standards for new vehicles. These standards are strictly enforced and
are likely having beneficial effects on CO2 emissions.
Fuel efficiency, or in other words Vehicle Kilometers Travelled (VKT) per unit time, depends on
the weight of the vehicle and the propulsion technology. According to Ng and Schipper [35], the
average weight of new Chinese cars is 1,500 kilograms (between 3,000 kilograms of a Hummer
and 750 kilograms of a Mercedes Smart). He et al. estimated the current fuel economy is about
9.1liter/100km [18].
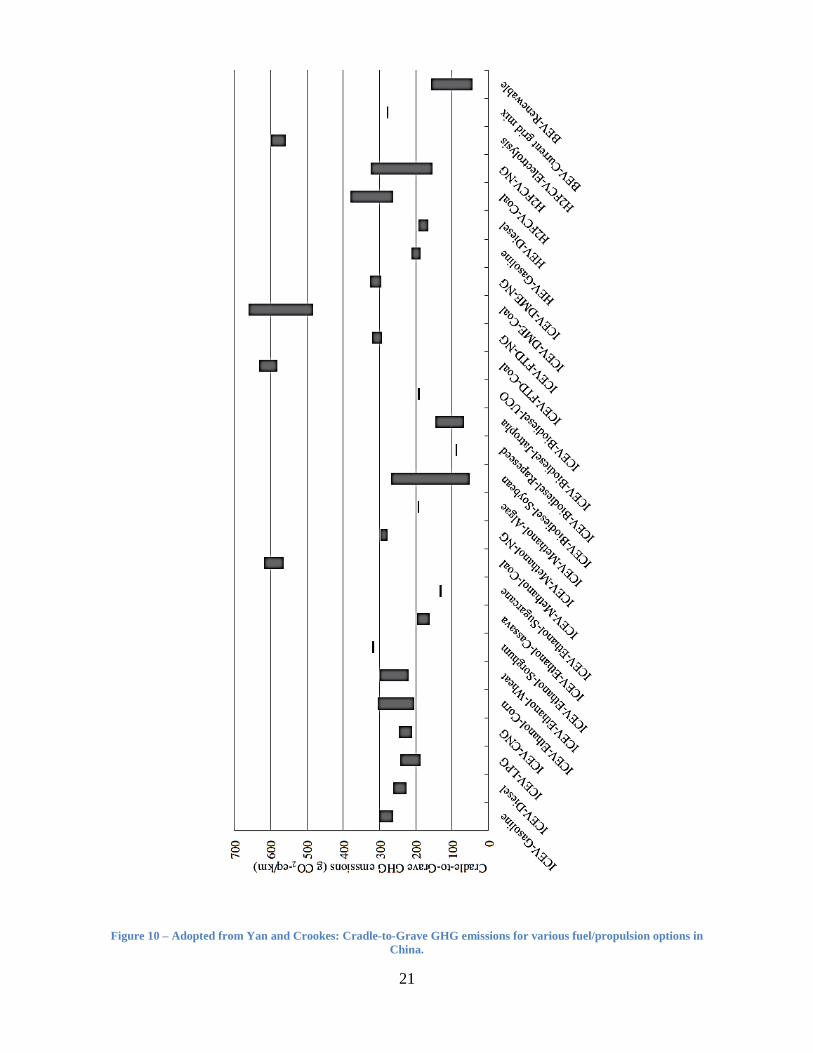
Carbon Intensity of Fuels
Yan and Crookes [36] summarized carbon intensities of various vehicle fuels in China. The
following figure is taken from their work – life cycle assessment of CO2 emissions from various
vehicle fuels in China.
21
Figure 10 – Adopted from Yan and Crookes: Cradle-to-Grave GHG emissions for various fuel/propulsion options in
China.
22
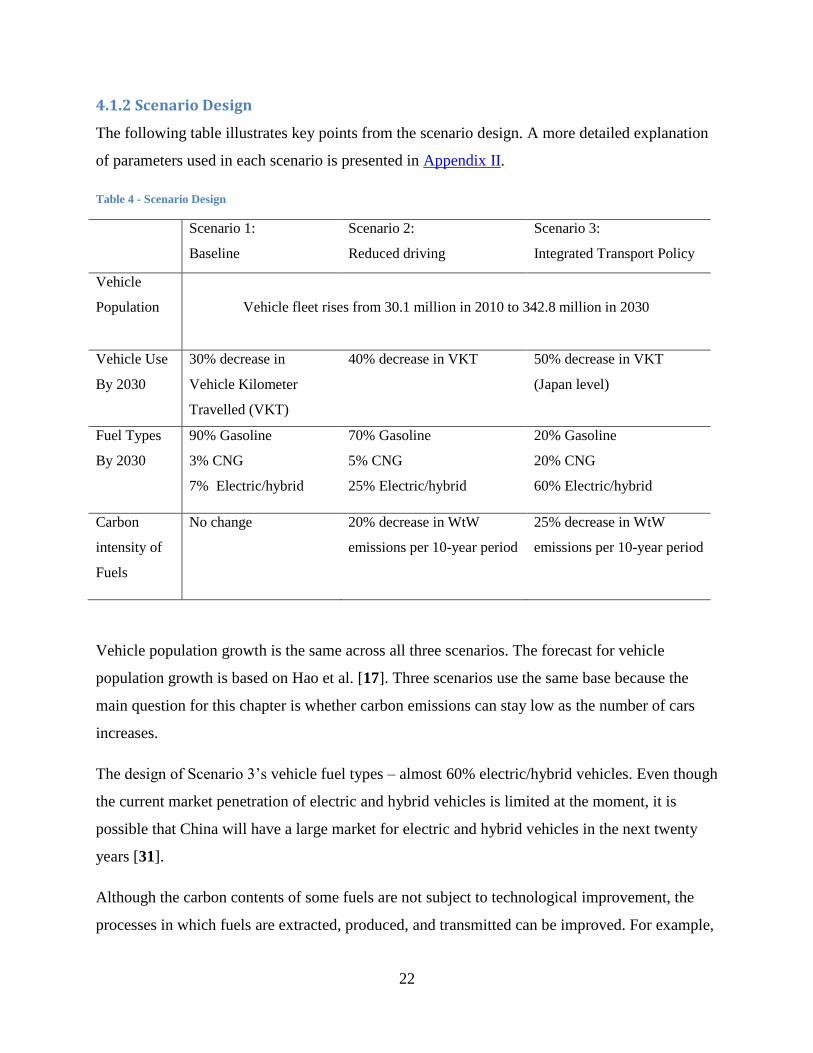
4.1.2 Scenario Design
The following table illustrates key points from the scenario design. A more detailed explanation
of parameters used in each scenario is presented in Appendix II.
Table 4 - Scenario Design
Scenario 1:
Baseline
Scenario 2:
Reduced driving
Scenario 3:
Integrated Transport Policy
Vehicle
Population
Vehicle fleet rises from 30.1 million in 2010 to 342.8 million in 2030
Vehicle Use
By 2030
30% decrease in
Vehicle Kilometer
Travelled (VKT)
40% decrease in VKT 50% decrease in VKT
(Japan level)
Fuel Types
By 2030
90% Gasoline
3% CNG
7% Electric/hybrid
70% Gasoline
5% CNG
25% Electric/hybrid
20% Gasoline
20% CNG
60% Electric/hybrid
Carbon
intensity of
Fuels
No change 20% decrease in WtW
emissions per 10-year period
25% decrease in WtW
emissions per 10-year period
Vehicle population growth is the same across all three scenarios. The forecast for vehicle
population growth is based on Hao et al. [17]. Three scenarios use the same base because the
main question for this chapter is whether carbon emissions can stay low as the number of cars
increases.
The design of Scenario 3’s vehicle fuel types – almost 60% electric/hybrid vehicles. Even though
the current market penetration of electric and hybrid vehicles is limited at the moment, it is
possible that China will have a large market for electric and hybrid vehicles in the next twenty
years [31].
Although the carbon contents of some fuels are not subject to technological improvement, the
processes in which fuels are extracted, produced, and transmitted can be improved. For example,
23
electric and hybrid vehicles take electricity as input, and the amount of carbon emission
embedded in electricity depends on how electricity is generated in China and distributed to the
charging stations. As China drops its overall carbon intensity [31], the WtW emissions will drop
as well.
The last thing to note is the 30% reduced driving in the baseline scenario. This is a likely case.
The big decrease is largely due to the fact that VKT for 2010 is calculated for all private vehicles
including taxis. Since taxis generally travel much more than family vehicles, VKT will likely
shrink as the percentage of taxis drops.
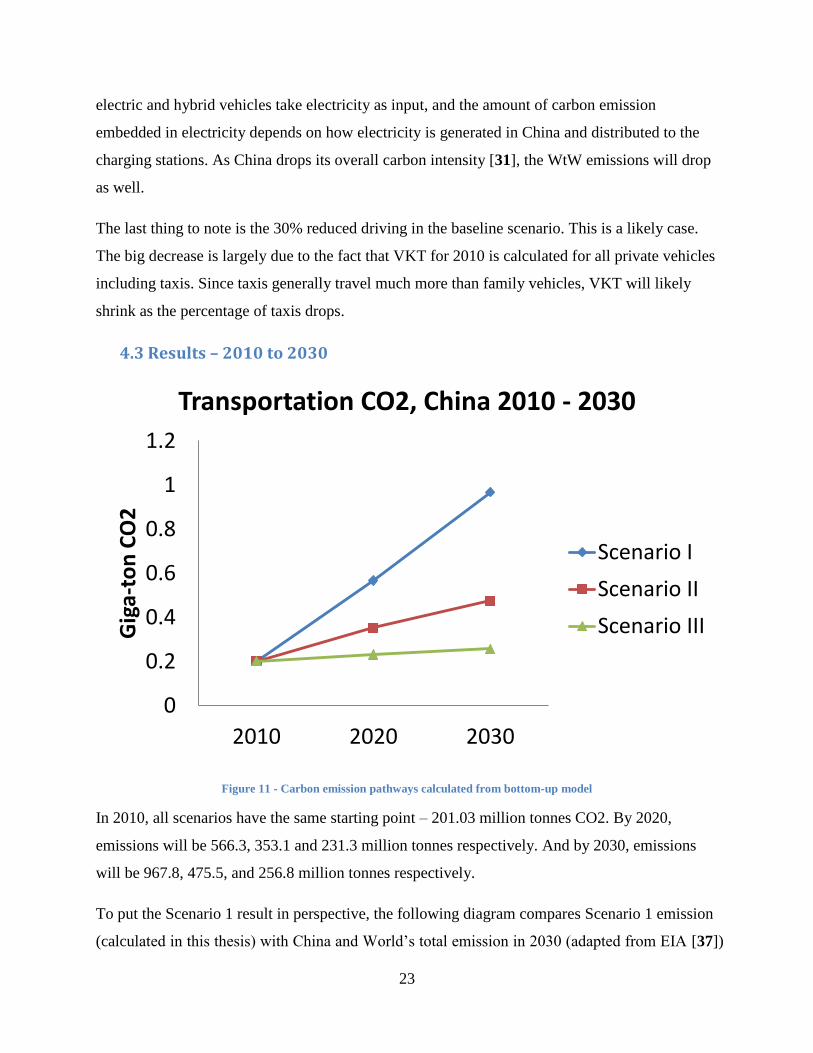
4.3 Results – 2010 to 2030
Figure 11 - Carbon emission pathways calculated from bottom-up model
In 2010, all scenarios have the same starting point – 201.03 million tonnes CO2. By 2020,
emissions will be 566.3, 353.1 and 231.3 million tonnes respectively. And by 2030, emissions
will be 967.8, 475.5, and 256.8 million tonnes respectively.
To put the Scenario 1 result in perspective, the following diagram compares Scenario 1 emission
(calculated in this thesis) with China and World’s total emission in 2030 (adapted from EIA [37])
0
0.2
0.4
0.6
0.8
1
1.2
2010 2020 2030
Gig
a-to
n C
O2
Transportation CO2, China 2010 - 2030
Scenario I
Scenario II
Scenario III
24
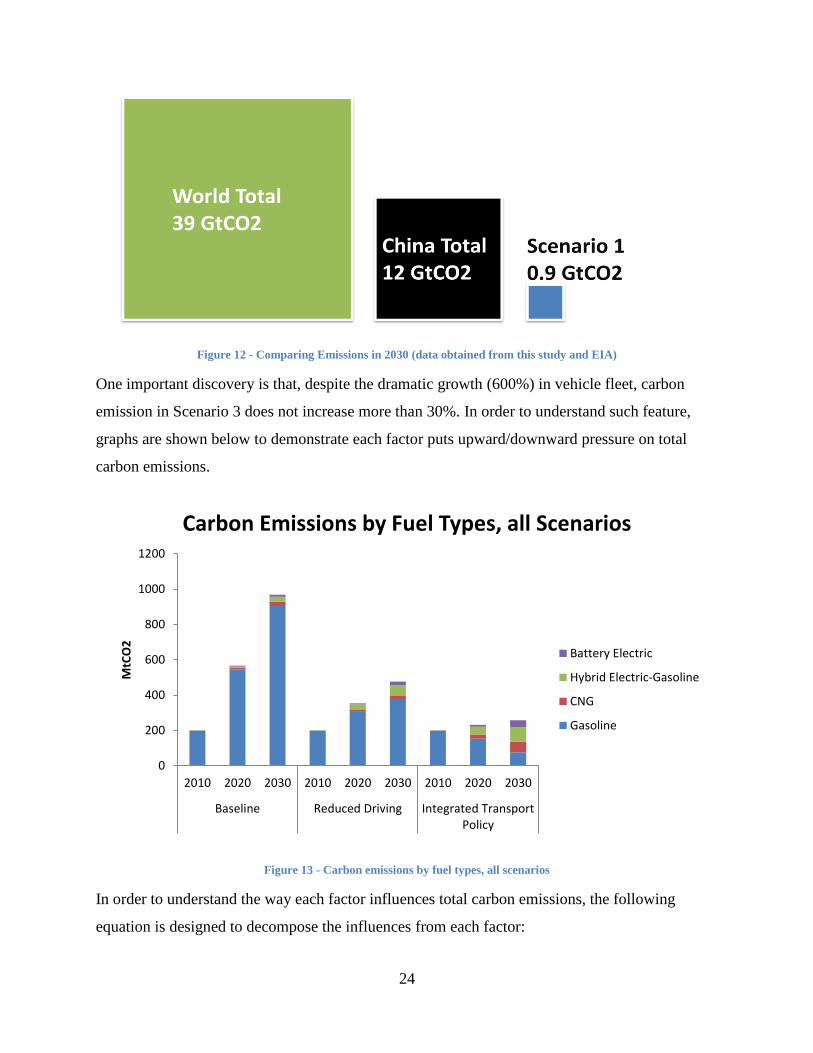
Figure 12 - Comparing Emissions in 2030 (data obtained from this study and EIA)
One important discovery is that, despite the dramatic growth (600%) in vehicle fleet, carbon
emission in Scenario 3 does not increase more than 30%. In order to understand such feature,
graphs are shown below to demonstrate each factor puts upward/downward pressure on total
carbon emissions.
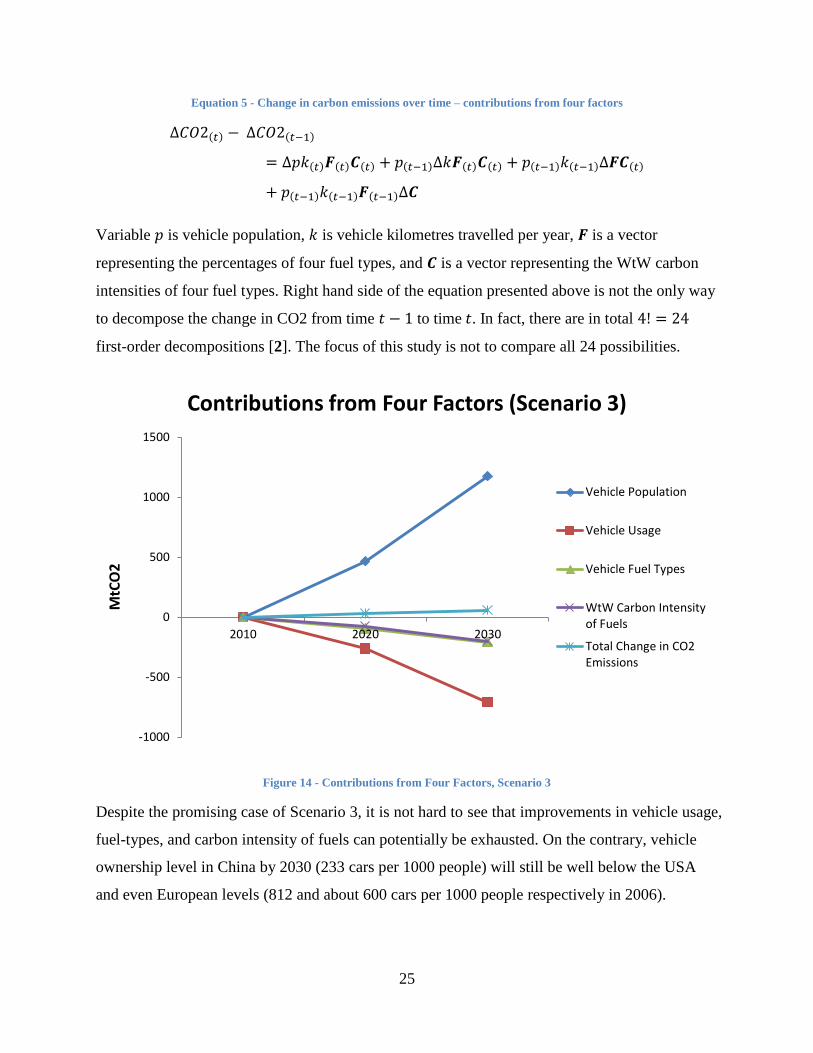
Figure 13 - Carbon emissions by fuel types, all scenarios
In order to understand the way each factor influences total carbon emissions, the following
equation is designed to decompose the influences from each factor:
0
200
400
600
800
1000
1200
2010 2020 2030 2010 2020 2030 2010 2020 2030
Baseline Reduced Driving Integrated TransportPolicy
MtC
O2
Carbon Emissions by Fuel Types, all Scenarios
Battery Electric
Hybrid Electric-Gasoline
CNG
Gasoline
25
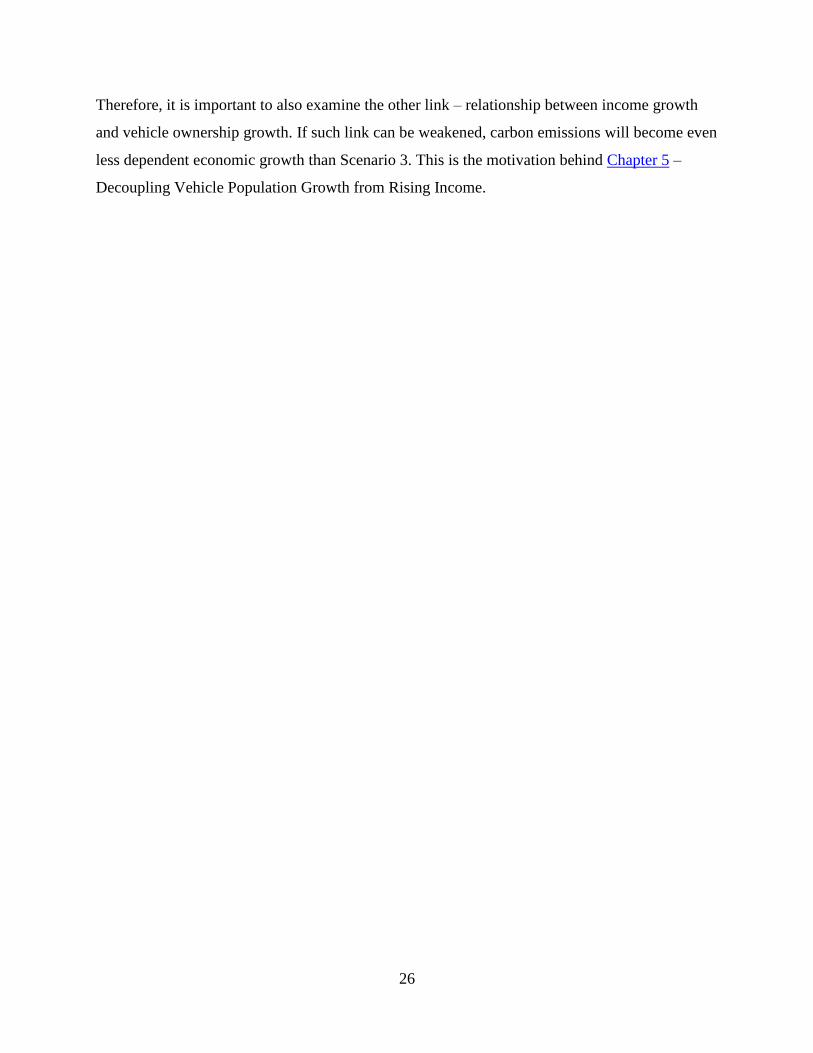
Equation 5 - Change in carbon emissions over time – contributions from four factors
Variable is vehicle population, is vehicle kilometres travelled per year, is a vector
representing the percentages of four fuel types, and is a vector representing the WtW carbon
intensities of four fuel types. Right hand side of the equation presented above is not the only way
to decompose the change in CO2 from time to time . In fact, there are in total
first-order decompositions [2]. The focus of this study is not to compare all 24 possibilities.
Figure 14 - Contributions from Four Factors, Scenario 3
Despite the promising case of Scenario 3, it is not hard to see that improvements in vehicle usage,
fuel-types, and carbon intensity of fuels can potentially be exhausted. On the contrary, vehicle
ownership level in China by 2030 (233 cars per 1000 people) will still be well below the USA
and even European levels (812 and about 600 cars per 1000 people respectively in 2006).
-1000
-500
0
500
1000
1500
2010 2020 2030
MtC
O2
Contributions from Four Factors (Scenario 3)
Vehicle Population
Vehicle Usage
Vehicle Fuel Types
WtW Carbon Intensityof Fuels
Total Change in CO2Emissions
26
Therefore, it is important to also examine the other link – relationship between income growth
and vehicle ownership growth. If such link can be weakened, carbon emissions will become even
less dependent economic growth than Scenario 3. This is the motivation behind Chapter 5 –
Decoupling Vehicle Population Growth from Rising Income.
27
5. Decoupling Vehicle Population Growth from Rising Income
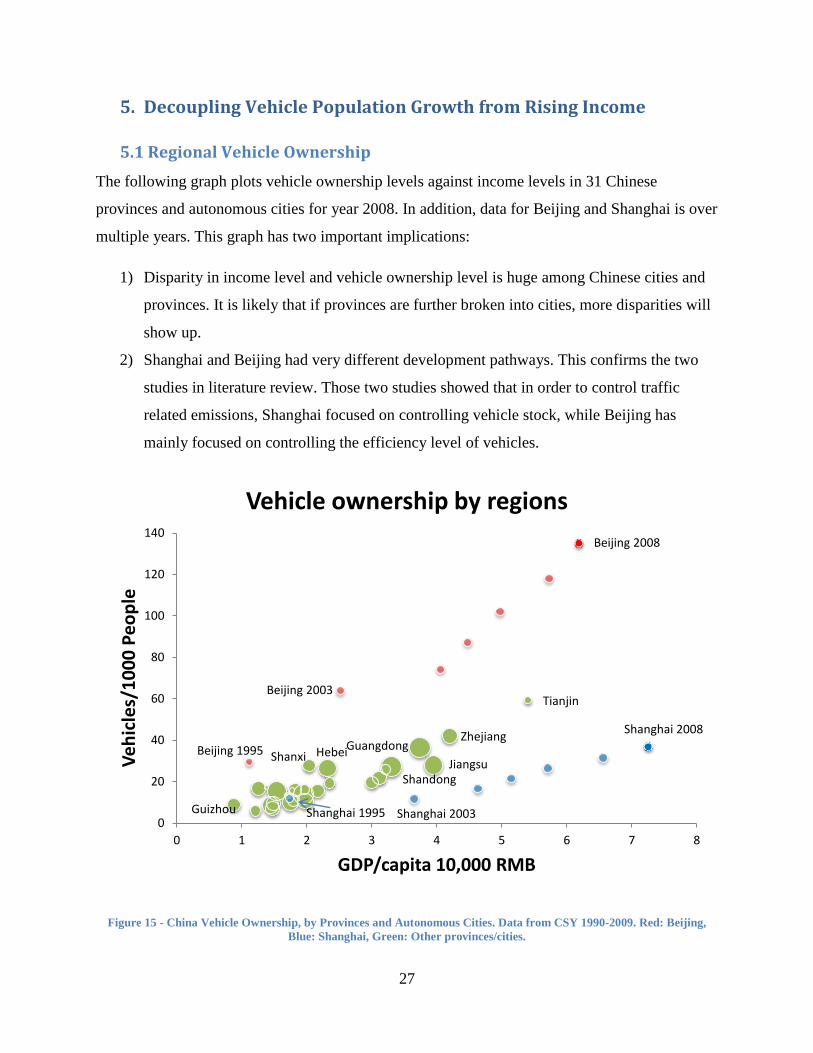
5.1 Regional Vehicle Ownership
The following graph plots vehicle ownership levels against income levels in 31 Chinese
provinces and autonomous cities for year 2008. In addition, data for Beijing and Shanghai is over
multiple years. This graph has two important implications:
1) Disparity in income level and vehicle ownership level is huge among Chinese cities and
provinces. It is likely that if provinces are further broken into cities, more disparities will
show up.
2) Shanghai and Beijing had very different development pathways. This confirms the two
studies in literature review. Those two studies showed that in order to control traffic
related emissions, Shanghai focused on controlling vehicle stock, while Beijing has
mainly focused on controlling the efficiency level of vehicles.
Figure 15 - China Vehicle Ownership, by Provinces and Autonomous Cities. Data from CSY 1990-2009. Red: Beijing,
Blue: Shanghai, Green: Other provinces/cities.
Tianjin
Hebei Shanxi Jiangsu
Zhejiang
Shandong
Guangdong
Guizhou Shanghai 2003
Shanghai 2008
Beijing 2003
Beijing 2008
0
20
40
60
80
100
120
140
0 1 2 3 4 5 6 7 8
Ve
hic
les/
10
00
Pe
op
le
GDP/capita 10,000 RMB
Vehicle ownership by regions
Beijing 1995
Shanghai 1995
28
The other provinces loosely form two clusters – one on the north-east side, and the other on the
south-west. The north-east group of provinces, such as Guangdong, Zhejiang, Jiangsu, and
Shandong, are mostly provinces on the coastal line. They constitute the so-called Eastern China
which has been the main focus of economic development in the past thirty years.
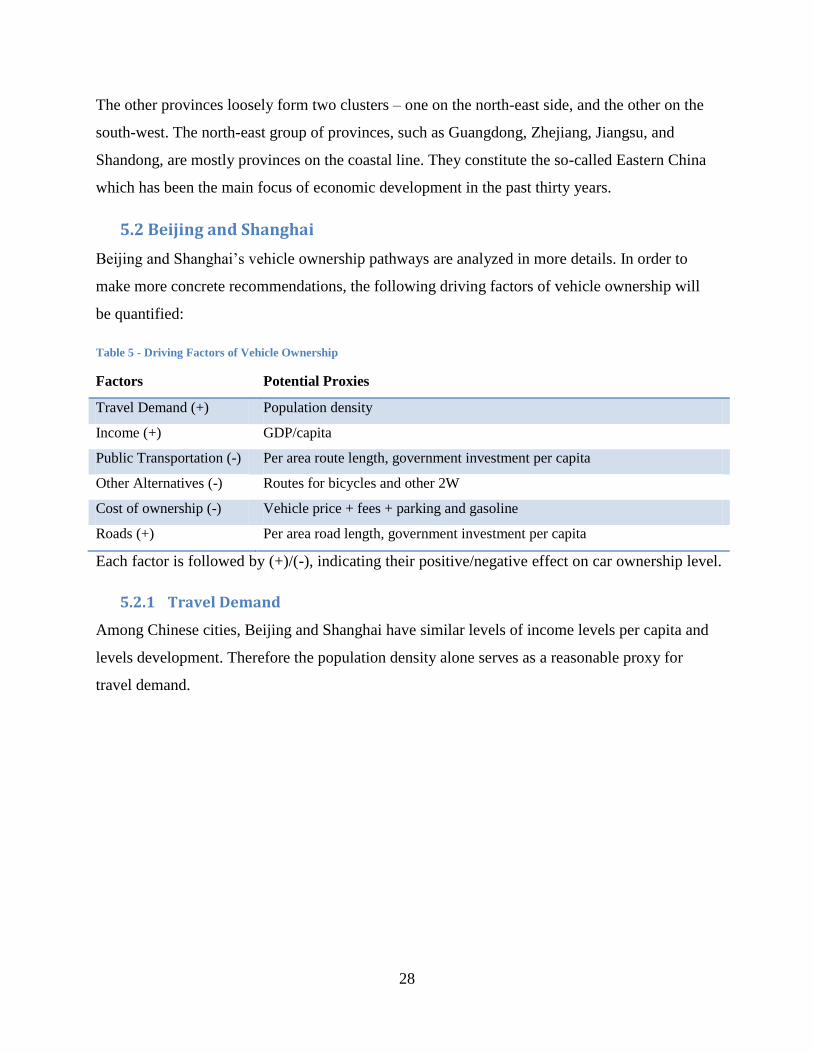
5.2 Beijing and Shanghai
Beijing and Shanghai’s vehicle ownership pathways are analyzed in more details. In order to
make more concrete recommendations, the following driving factors of vehicle ownership will
be quantified:
Table 5 - Driving Factors of Vehicle Ownership
Factors Potential Proxies
Travel Demand (+) Population density
Income (+) GDP/capita
Public Transportation (-) Per area route length, government investment per capita
Other Alternatives (-) Routes for bicycles and other 2W
Cost of ownership (-) Vehicle price + fees + parking and gasoline
Roads (+) Per area road length, government investment per capita
Each factor is followed by (+)/(-), indicating their positive/negative effect on car ownership level.
5.2.1 Travel Demand
Among Chinese cities, Beijing and Shanghai have similar levels of income levels per capita and
levels development. Therefore the population density alone serves as a reasonable proxy for
travel demand.
29
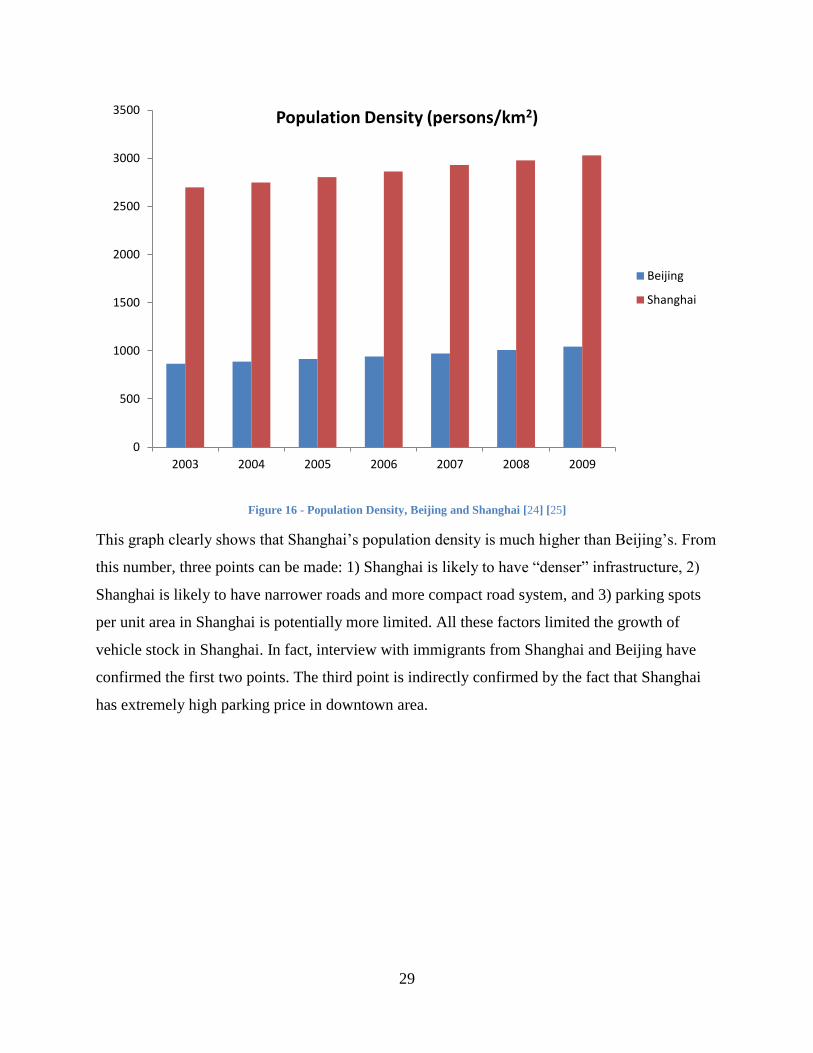
Figure 16 - Population Density, Beijing and Shanghai [24] [25]
This graph clearly shows that Shanghai’s population density is much higher than Beijing’s. From
this number, three points can be made: 1) Shanghai is likely to have “denser” infrastructure, 2)
Shanghai is likely to have narrower roads and more compact road system, and 3) parking spots
per unit area in Shanghai is potentially more limited. All these factors limited the growth of
vehicle stock in Shanghai. In fact, interview with immigrants from Shanghai and Beijing have
confirmed the first two points. The third point is indirectly confirmed by the fact that Shanghai
has extremely high parking price in downtown area.
0
500
1000
1500
2000
2500
3000
3500
2003 2004 2005 2006 2007 2008 2009
Population Density (persons/km2)
Beijing
Shanghai
30
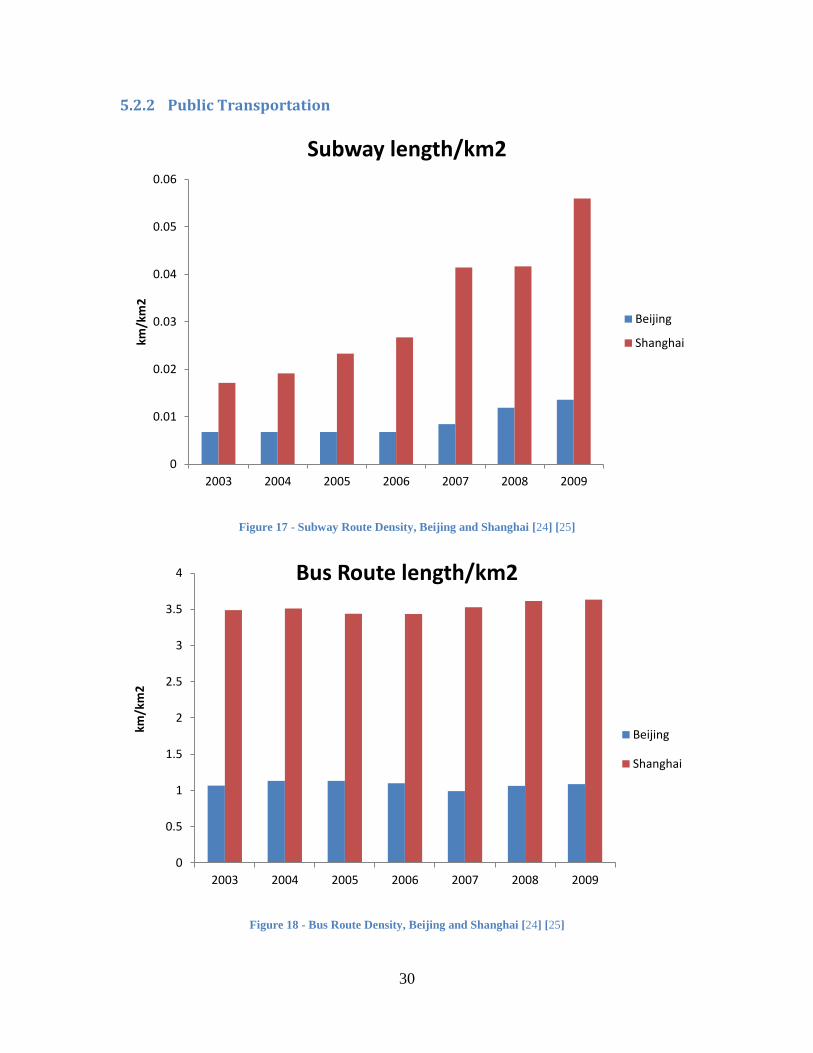
5.2.2 Public Transportation
Figure 17 - Subway Route Density, Beijing and Shanghai [24] [25]
Figure 18 - Bus Route Density, Beijing and Shanghai [24] [25]
0
0.01
0.02
0.03
0.04
0.05
0.06
2003 2004 2005 2006 2007 2008 2009
km/k
m2
Subway length/km2
Beijing
Shanghai
0
0.5
1
1.5
2
2.5
3
3.5
4
2003 2004 2005 2006 2007 2008 2009
km/k
m2
Bus Route length/km2
Beijing
Shanghai
31
Using public transit route length per km2 as a proxy, Shanghai and Beijing’s development of
public transit is quantified in the previous two graphs. Due to the lack of data, three questions
remain unaddressed. They are recommended as work for future research. The two major
challenges are (1) gathering a set of reliable data that reflects the public transport and private
transport development pathways in various cities, and (2) normalizing the data to eliminate
“noise” from the difference in urban structure.
1) No clear indication of causality;
2) No clear indication of the direction of causality;
3) Service length/area is not a perfect representation of public transit level. For example,
price and service frequency also affects people’s choice of whether to take public transit
or not.
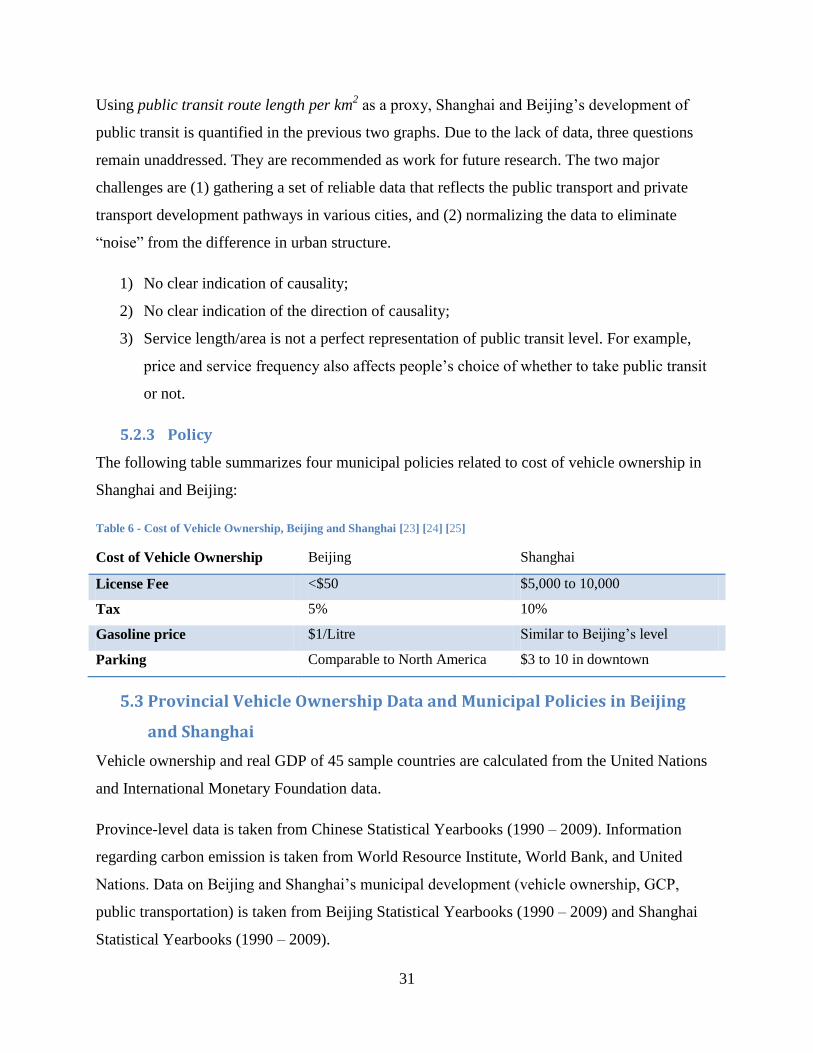
5.2.3 Policy
The following table summarizes four municipal policies related to cost of vehicle ownership in
Shanghai and Beijing:
Table 6 - Cost of Vehicle Ownership, Beijing and Shanghai [23] [24] [25]
Cost of Vehicle Ownership Beijing Shanghai
License Fee <$50 $5,000 to 10,000
Tax 5% 10%
Gasoline price $1/Litre Similar to Beijing’s level
Parking Comparable to North America $3 to 10 in downtown
5.3 Provincial Vehicle Ownership Data and Municipal Policies in Beijing
and Shanghai
Vehicle ownership and real GDP of 45 sample countries are calculated from the United Nations
and International Monetary Foundation data.
Province-level data is taken from Chinese Statistical Yearbooks (1990 – 2009). Information
regarding carbon emission is taken from World Resource Institute, World Bank, and United
Nations. Data on Beijing and Shanghai’s municipal development (vehicle ownership, GCP,
public transportation) is taken from Beijing Statistical Yearbooks (1990 – 2009) and Shanghai
Statistical Yearbooks (1990 – 2009).
32
6. Summary and Discussion
This thesis first presented a range of possible emission pathways in China’s private transport up
to 2030, and concluded that carbon emissions can be decoupled from vehicle fleet growth. Then
a case study analyzes how different Chinese cities have different vehicle fleet growth patterns.
The case study concludes that vehicle fleet growth can be decoupled from economic growth.
Any plausible solution to mitigating transportation emissions will likely address many different
areas. Specifically, emissions level is sensitive to (1) income levels and vehicle prices, (2)
vehicle registration and maintenance cost, (3) private vehicle usage and public transit
development, (4) fuel types, and (5) road system planning. Due to the long implementation
period of most urban policies such as those related to public transportation, fuel efficiency, road
infrastructure, cities and provinces must pay close attention to these factors at the planning phase.
Many other cities in developing countries face similar challenges from traffic capacity,
congestion, air pollution and carbon emission. However, Schipper [38] pointed out that even in
U.S. and European cities where congestion level is relatively low, CO2 externality (at $85/ton) is
still much less than the cost of congestion, accidents or local air pollution per km. Therefore,
future research that examines CO2 as a co-benefit of, for example, congestion reduction, would
provide a new perspective on carbon pathways.
China, among other developing countries, does not have the most mature data aggregation
system. For example, transportation activities are still grouped under “transportation and
communications” in China Statistical Yearbook. Travel distances are only included in an over-
aggregated section that includes national total of rail, road, and aviation travels. Consistent effort
needs to be put into improvement of managing statistical information.
33
Appendix I – World Vehicle Ownership 2010 – 2030
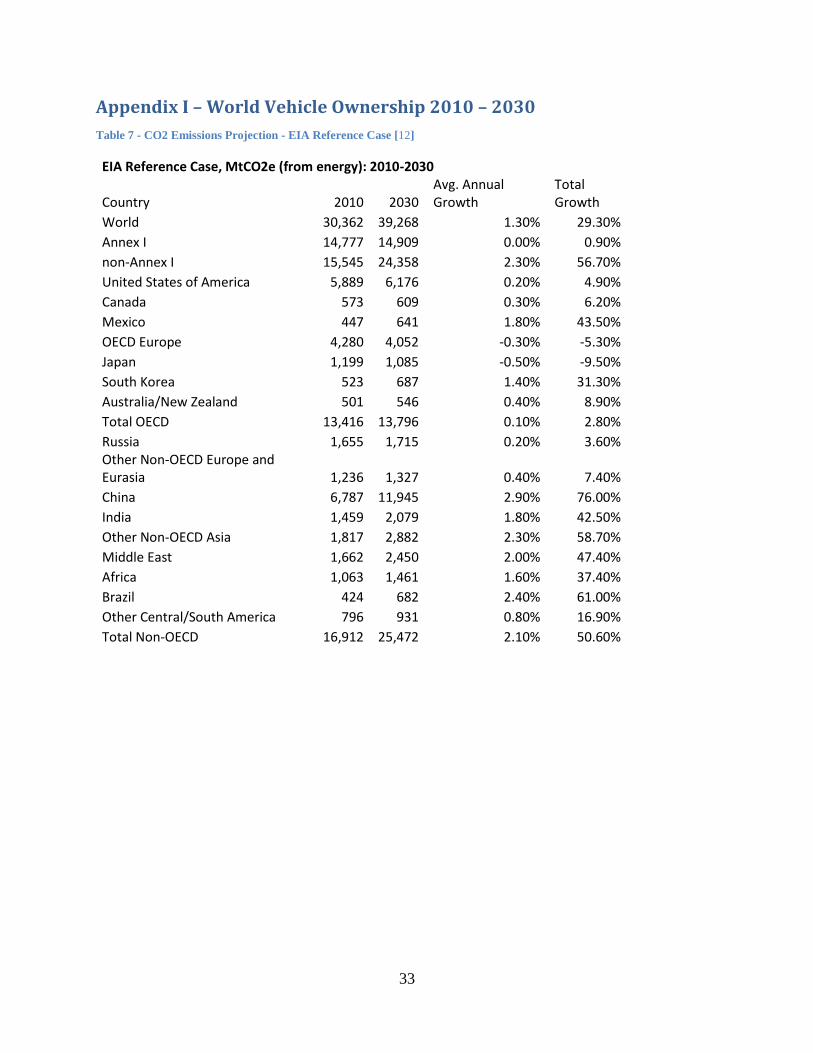
Table 7 - CO2 Emissions Projection - EIA Reference Case [12]
EIA Reference Case, MtCO2e (from energy): 2010-2030
Country 2010 2030 Avg. Annual Growth
Total Growth
World 30,362 39,268 1.30% 29.30% Annex I 14,777 14,909 0.00% 0.90% non-Annex I 15,545 24,358 2.30% 56.70% United States of America 5,889 6,176 0.20% 4.90% Canada 573 609 0.30% 6.20% Mexico 447 641 1.80% 43.50%
OECD Europe 4,280 4,052 -0.30% -5.30% Japan 1,199 1,085 -0.50% -9.50% South Korea 523 687 1.40% 31.30% Australia/New Zealand 501 546 0.40% 8.90% Total OECD 13,416 13,796 0.10% 2.80% Russia 1,655 1,715 0.20% 3.60% Other Non-OECD Europe and Eurasia 1,236 1,327 0.40% 7.40% China 6,787 11,945 2.90% 76.00% India 1,459 2,079 1.80% 42.50% Other Non-OECD Asia 1,817 2,882 2.30% 58.70%
Middle East 1,662 2,450 2.00% 47.40% Africa 1,063 1,461 1.60% 37.40% Brazil 424 682 2.40% 61.00% Other Central/South America 796 931 0.80% 16.90% Total Non-OECD 16,912 25,472 2.10% 50.60%
34
Appendix II – Scenario Design for Bottom-up Model
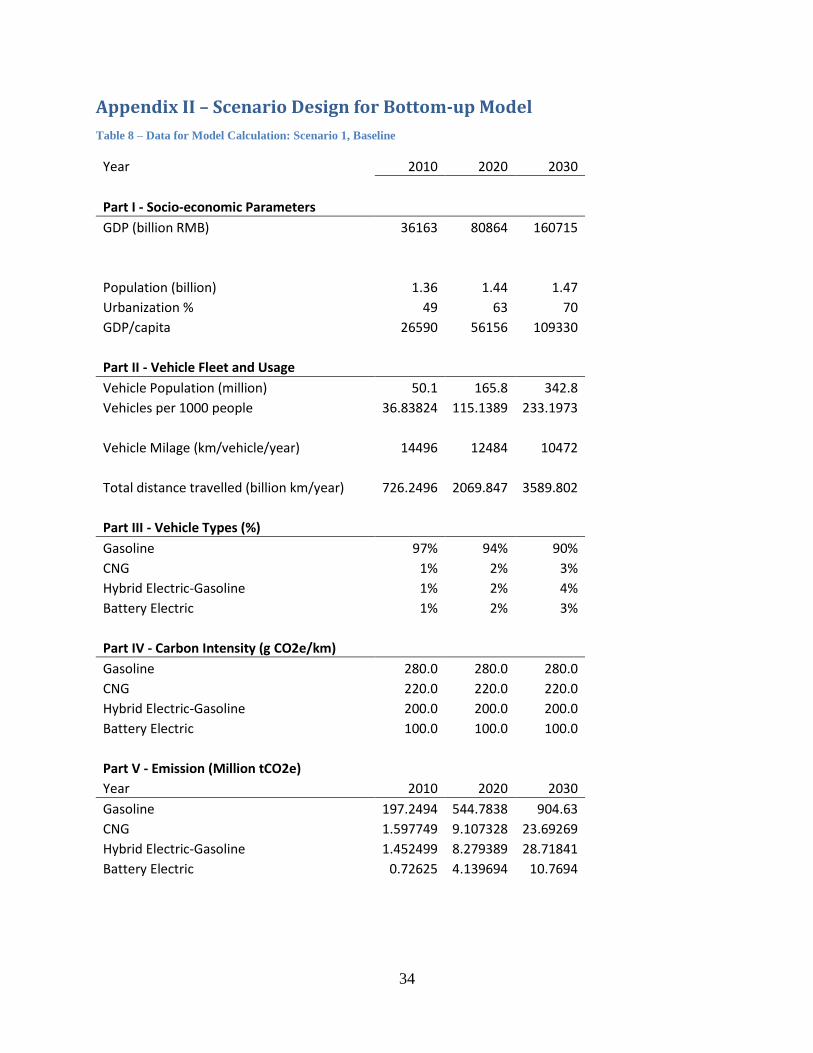
Table 8 – Data for Model Calculation: Scenario 1, Baseline
Year 2010 2020 2030
Part I - Socio-economic Parameters
GDP (billion RMB) 36163 80864 160715
Population (billion) 1.36 1.44 1.47 Urbanization % 49 63 70 GDP/capita 26590 56156 109330
Part II - Vehicle Fleet and Usage
Vehicle Population (million) 50.1 165.8 342.8 Vehicles per 1000 people 36.83824 115.1389 233.1973
Vehicle Milage (km/vehicle/year) 14496 12484 10472
Total distance travelled (billion km/year) 726.2496 2069.847 3589.802
Part III - Vehicle Types (%)
Gasoline 97% 94% 90%
CNG 1% 2% 3% Hybrid Electric-Gasoline 1% 2% 4% Battery Electric 1% 2% 3%
Part IV - Carbon Intensity (g CO2e/km)
Gasoline 280.0 280.0 280.0 CNG 220.0 220.0 220.0 Hybrid Electric-Gasoline 200.0 200.0 200.0 Battery Electric 100.0 100.0 100.0
Part V - Emission (Million tCO2e) Year 2010 2020 2030
Gasoline 197.2494 544.7838 904.63 CNG 1.597749 9.107328 23.69269 Hybrid Electric-Gasoline 1.452499 8.279389 28.71841 Battery Electric 0.72625 4.139694 10.7694
35
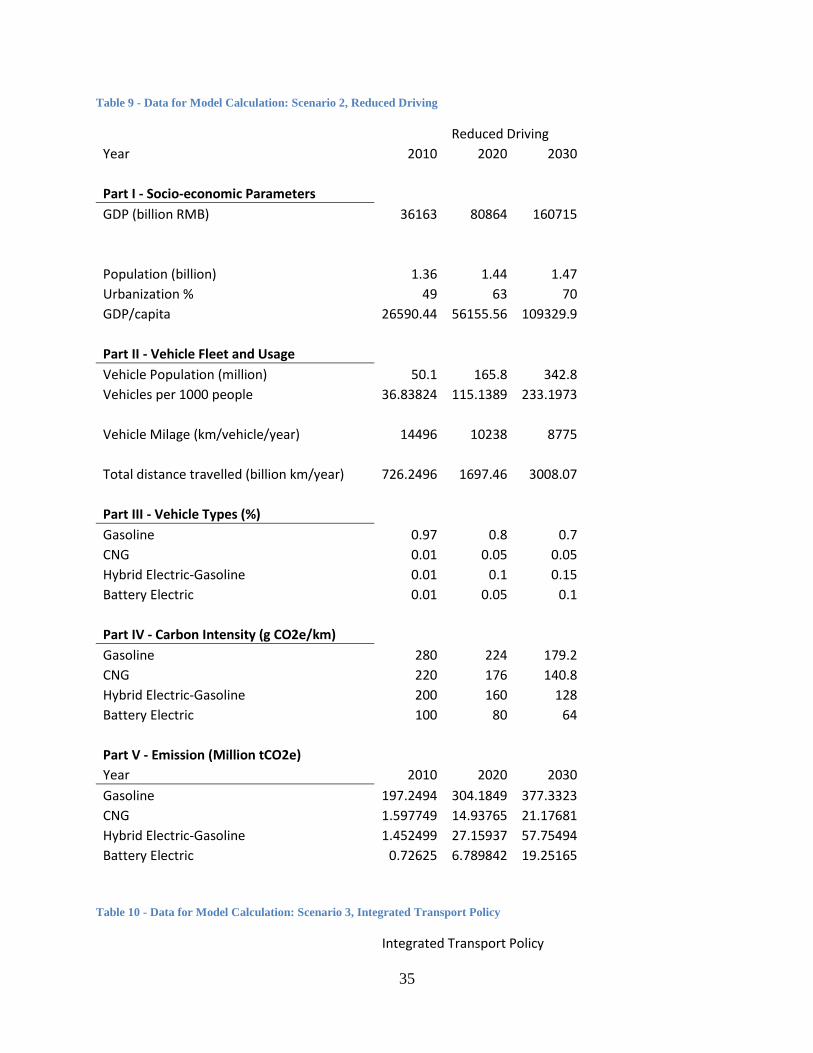
Table 9 - Data for Model Calculation: Scenario 2, Reduced Driving
Reduced Driving
Year 2010 2020 2030
Part I - Socio-economic Parameters GDP (billion RMB) 36163 80864 160715
Population (billion) 1.36 1.44 1.47 Urbanization % 49 63 70 GDP/capita 26590.44 56155.56 109329.9
Part II - Vehicle Fleet and Usage Vehicle Population (million) 50.1 165.8 342.8
Vehicles per 1000 people 36.83824 115.1389 233.1973
Vehicle Milage (km/vehicle/year) 14496 10238 8775
Total distance travelled (billion km/year) 726.2496 1697.46 3008.07
Part III - Vehicle Types (%) Gasoline 0.97 0.8 0.7
CNG 0.01 0.05 0.05 Hybrid Electric-Gasoline 0.01 0.1 0.15 Battery Electric 0.01 0.05 0.1
Part IV - Carbon Intensity (g CO2e/km) Gasoline 280 224 179.2
CNG 220 176 140.8
Hybrid Electric-Gasoline 200 160 128 Battery Electric 100 80 64
Part V - Emission (Million tCO2e) Year 2010 2020 2030
Gasoline 197.2494 304.1849 377.3323 CNG 1.597749 14.93765 21.17681 Hybrid Electric-Gasoline 1.452499 27.15937 57.75494 Battery Electric 0.72625 6.789842 19.25165
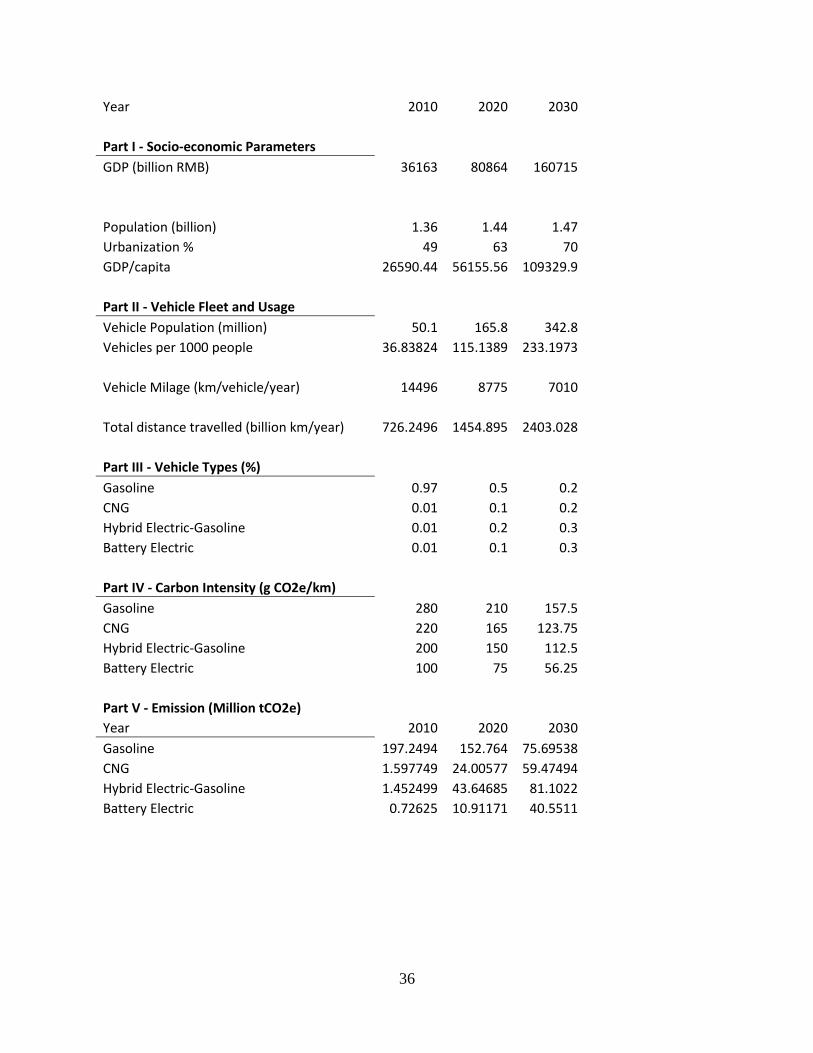
Table 10 - Data for Model Calculation: Scenario 3, Integrated Transport Policy
Integrated Transport Policy
36
Year 2010 2020 2030
Part I - Socio-economic Parameters GDP (billion RMB) 36163 80864 160715
Population (billion) 1.36 1.44 1.47 Urbanization % 49 63 70 GDP/capita 26590.44 56155.56 109329.9
Part II - Vehicle Fleet and Usage Vehicle Population (million) 50.1 165.8 342.8
Vehicles per 1000 people 36.83824 115.1389 233.1973
Vehicle Milage (km/vehicle/year) 14496 8775 7010
Total distance travelled (billion km/year) 726.2496 1454.895 2403.028
Part III - Vehicle Types (%) Gasoline 0.97 0.5 0.2
CNG 0.01 0.1 0.2 Hybrid Electric-Gasoline 0.01 0.2 0.3 Battery Electric 0.01 0.1 0.3
Part IV - Carbon Intensity (g CO2e/km) Gasoline 280 210 157.5
CNG 220 165 123.75 Hybrid Electric-Gasoline 200 150 112.5 Battery Electric 100 75 56.25
Part V - Emission (Million tCO2e) Year 2010 2020 2030
Gasoline 197.2494 152.764 75.69538 CNG 1.597749 24.00577 59.47494
Hybrid Electric-Gasoline 1.452499 43.64685 81.1022 Battery Electric 0.72625 10.91171 40.5511
37
Bibliography
[1] Netherlands Environmental Assessment Agency. (2010, October) PBL. [Online].
http://www.pbl.nl/en/dossiers/Climatechange/moreinfo/Chinanowno1inCO2emissionsUS
Ainsecondposition.html
[2] D. Guan, K. Hubacek, C. L. Weber, G. P. Peters, and D. M. Reiner, "The drivers of
Chinese CO2 emissions from 1980 to 2030," Global Environmental Change, vol. 18, no.
4, pp. 626-634, 2008.
[3] Shui Bin and Hadi Dowlatabadi, "Consumer lifestyle approach to US energy use and the
related CO2 emissions," Energy Policy, vol. 18, no. 2, pp. 197-208, 2005.
[4] Klaus Hubacek, Dabo Guan, and A. Barua, "Changing lifestyles and consumption patterns
in developing countries: A scenario analysis for China and India," Futures, vol. 39, no. 9,
pp. 1084-1096, 2007.
[5] International Panel on Climate Change, "Third Assessment Report," International Panel on
Climate Change, 2001.
[6] Peter M. Vitousek, "Beyond Global Warming: Ecology and Global Change," Ecology, vol.
75, pp. 1861-1876, 1994.
[7] International Panel on Climate Change. (2001) IPCC Third Assessment Report. [Online].
http://www.grida.no/publications/other/ipcc_tar/?src=/climate/ipcc_tar/wg1/index.htm
[8] International Panel on Climate Change. (2007) IPCC Fourth Assessment Report. [Online].
http://www.ipcc.ch/
[9] William R. L. Anderegga, James W. Prallb, Jacob Haroldc, and Stephen H. Schneider,
"Expert credibility in climate change," in Proceedings of the National Academy of
Sciences of the United States, 2010, pp. 12107-12109.
[10] Sherwood B. Idso, "CO2-induced global warming: a skeptic’s view of potential climate,"
38
Climate Research, vol. 10, pp. 69-82, April 1998.
[11] Nir J. Shaviv, "On climate response to changes in the cosmic ray flux and radiative
budget," Journal of Geophysical Research, vol. 110, Jan 2004.
[12] World Resources Institute. (2010) Climate Analysis indicators Tool. [Online].
http://cait.wri.org/
[13] United Nations. (2011) Millenium Development Goals Indicators - Carbon dioxide
emissions (CO2), metric tons of CO2 per capita (UNFCCC). [Online].
http://unstats.un.org/unsd/mdg/SeriesDetail.aspx?srid=752
[14] Klaus Hubacek, Dabo Guan, John Barrett, and Thomas Wiedmann, "Environmental
implications of urbanization and lifestyle change in China: Ecological and Water
Footprints," Journal of Clearner Production, vol. 17, pp. 1241-1248, 2009.
[15] Klaus Hubacek, Dabo Guan, and Anamika Barua, "Changing lifestyles and consumption
patterns in developing countries: A scenario analysis for China and India," Futures, vol.
39, pp. 1084-1096, 2007.
[16] Joyce Dargay, Dermot Gately, and Martin Sommer, "Vehicle Ownership and Income
Growth, Worldwide: 1960-2030," Energy Journal, vol. 28, no. 4, 2007.
[17] Han Hao, Hewu Wang, and Ran Yi, "Hybrid Modelling of China’s Vehicle Ownership and
Projection through 2050," Energy, 2010.
[18] Kebin He et al., "Oil consumption and CO2 emissions in China’s road transport: current
status, future trends, and policy implications," Energy Policy, vol. 33, pp. 1499-1507,
2005.
[19] Carnegie Mellon University Green Design Institute. (2010) Economic Input-Output Life-
Cycle-Assessment Tool. [Online]. http://www.eiolca.net/
[20] Jay S. Gregg, Robert J. Andres, and Gregg Marland, "China: Emissions pattern of the
39
world leader in CO2 emissions from fossil fuel consumption and cement production,"
Geophysical Research Letters, vol. 35, 2008.
[21] "On-Road Vehicle Emission Control in Beijing: Past, Present, and Future," Environmental
Science & Technology, vol. 45, no. 1, pp. 147-153, 2011.
[22] Hongchang Zhou and Daniel Sperling, "Transportation in Developing Countries:
Greenhouse Gas Scenarios for Shanghai, China," Pew Center on Global Climate Change,
2001.
[23] Qing Shen, "Urban Transportation in Shanghai, China: Problems and Planning
Implications," International Journal of Urban and Regional Research, vol. 21, no. 4, pp.
589-606, Dec 1997.
[24] Beijing Bureau of Statistics. (1990-2010) Beijing Statistical Information Net. [Online].
http://www.bjstats.gov.cn/
[25] Shanghai Bureau of Statistics. (1990-2010) Shanghai Bureau of Statistics. [Online].
http://www.stats-sh.gov.cn
[26] David A. Hensher, "Imbalance in Australia’s Public Transit and Car," Transport Policy,
vol. 5, pp. 193-204, 1998.
[27] Walter Hook and Michael Replogle, "Japan, China, and Indonesia – Public Transportation
and Private Vehicles," Land Use Policy, vol. 13, no. 1, pp. 68-84, 1996.
[28] Chinese National Bureau of Statistics. (1990-2010) Chinese Statistical Yearbook. [Online].
http://www.stats.gov.cn/english/statisticaldata/yearlydata/
[29] Haiyan Chen, Beisi Jia, and S.S.Y. Lau, "Sustainable urban form for Chinese compact
cities: Challenges of a rapid urbanized economy," Habitat International, vol. 32, no. 1, pp.
28-40, March 2008.
[30] Shasha Deng. (2011, March) Xinhua Net. [Online].
40
http://news.xinhuanet.com/english2010/china/2011-03/05/c_13762230.htm
[31] Jiabao Wen, "REPORT ON THE WORK OF THE GOVERNMENT," The Eleventh
National People's Congress, China, Beijing, Report to the Congress 2011.
[32] World Resource Institute. (2011, March) WRI Official Website. [Online].
http://www.wri.org/stories/2011/03/how-does-chinas-12th-five-year-plan-address-energy-
and-environment
[33] Chris T. Hendrickson, Lester B. Lave, and H. Scott Matthews, Environmental life cycle
assessment of goods and services: an input-output approach. Washington DC, United
States of America: RFF Press, 2006.
[34] Chuan Qin and Baoxia Zhu. (2004, November) China Daily. [Online].
http://www.chinadaily.com.cn/english/doc/2004-11/17/content_392361.htm
[35] Wei-Shiuen Ng and Lee Schipper, "China Motorization Trends: Policy Options in a World
of Transport Challenges," World Resource Institute, ISBN 1-56973-601-4, 2005.
[36] Xiaoyu Yan and Roy J. Crookes, "Energy demand and emissions from road transportation
vehicles in China," Progress in Energy and Combustion Science, vol. 36, no. 6, pp. 651-
676, December 2010.
[37] Energy Information Administration, "International Energy Outlook 2010," U.S.
Department of Energy, Washington D.C., DOE/EIA-0484(2010), 2010.
[38] Lee Schipper, Herbert Fabian, and James Leather, "Transport and Carbon Dioxide
Emissions: Forecasts, Options Analysis, and Evaluation," Asian Development Bank,
Mandaluyong City, ADB Sustainable Development Working Paper Series ISSN 2071-
9450, 2009.
[39] International Panel on Climate Change. (2006) IPCC Guidelines for National Greenhouse
Gas Inventories. [Online]. http://www.ipcc-nggip.iges.or.jp/public/2006gl/index.html
41
[40] Glen P. Peters, Christopher L. Weber, Dabo Guan, and Klaus Hubacek, "China's Growing
CO2 Emissions - A Race between Increasing Consumption and Efficiency Gains,"
Environmental Science & Technology, vol. 41, no. 17, pp. 5939-5944, 2007.
[41] Arnold Tukker and Bart Jansen, "Environmental Impacts of Products – A Detailed Review
of Studies," Journal of Industrial Ecology, vol. 10, no. 3, pp. 159-182, 2006.