Embed Size (px)
Citation preview
Laboratoire Interdisciplinaire sur l’Organisation Nanométrique et Supramoléculaire
DIRECTION DES SCIENCES DE LA MATIERE
IRAMIS
PySaxs A Python module and GUI for
SAXS data treatment Olivier Taché
Collaborative work with :
O. Spalla, A. Thill, D. Sen, D. Carrière, F. Testard
Olivier Taché / 29-08-2011 Python for Physics
Outline
2
Context :
CEA-LIONS
Small Angle X-Rays Scattering
SAXS at LIONS
SAXS data treatment
What is pySAXS ?
User Interface : GuiSAXS
plots
data treatment
fitting by models
Olivier Taché / 29-08-2011 Python for Physics
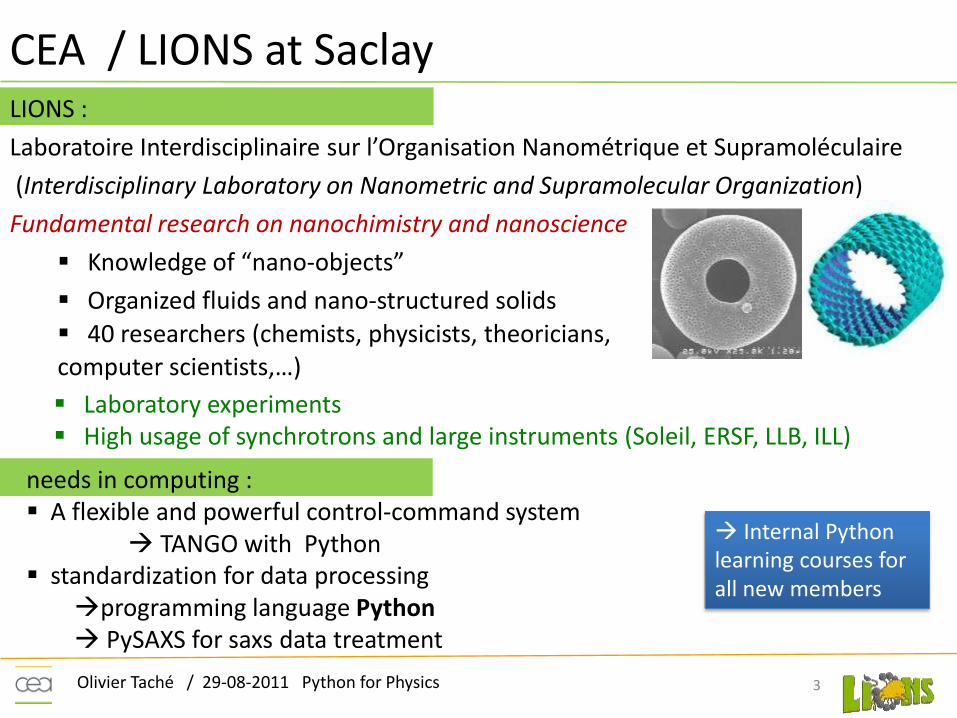
needs in computing : A flexible and powerful control-command system
TANGO with Python standardization for data processing
programming language Python PySAXS for saxs data treatment
CEA / LIONS at Saclay LIONS :
Laboratoire Interdisciplinaire sur l’Organisation Nanométrique et Supramoléculaire
(Interdisciplinary Laboratory on Nanometric and Supramolecular Organization)
Fundamental research on nanochimistry and nanoscience
Knowledge of “nano-objects”
Organized fluids and nano-structured solids
40 researchers (chemists, physicists, theoricians, computer scientists,…)
3
Laboratory experiments High usage of synchrotrons and large instruments (Soleil, ERSF, LLB, ILL)
Internal Python learning courses for all new members
Olivier Taché / 29-08-2011 Python for Physics
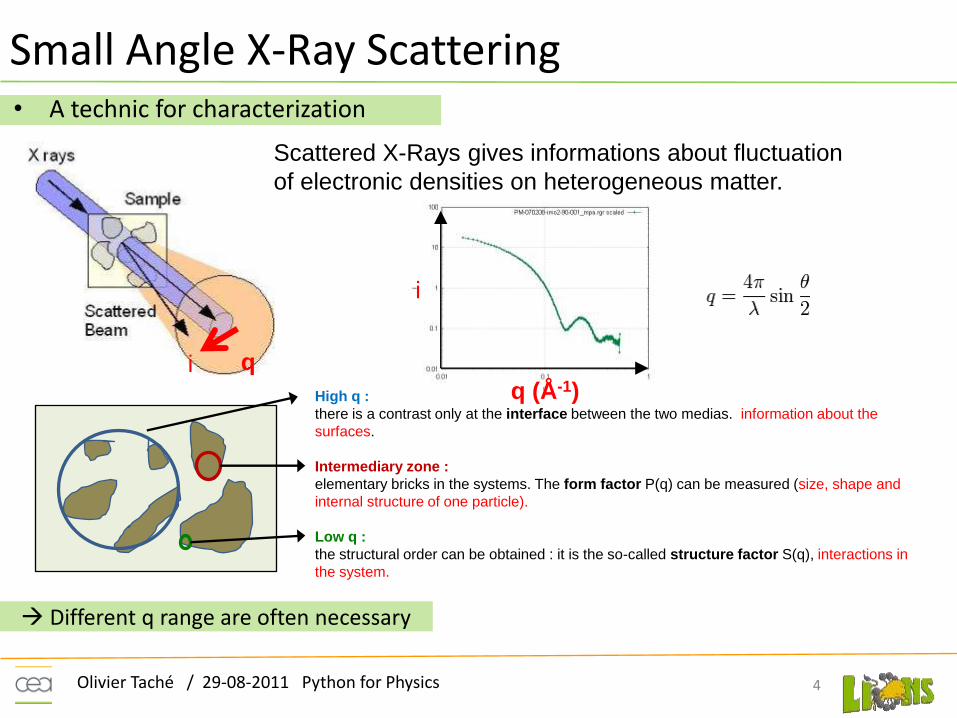
Small Angle X-Ray Scattering • A technic for characterization
4
High q :
there is a contrast only at the interface between the two medias. information about the
surfaces.
Intermediary zone :
elementary bricks in the systems. The form factor P(q) can be measured (size, shape and
internal structure of one particle).
Low q :
the structural order can be obtained : it is the so-called structure factor S(q), interactions in
the system.
q i
Scattered X-Rays gives informations about fluctuation
of electronic densities on heterogeneous matter.
i
q (Å-1)
Different q range are often necessary
Olivier Taché / 29-08-2011 Python for Physics
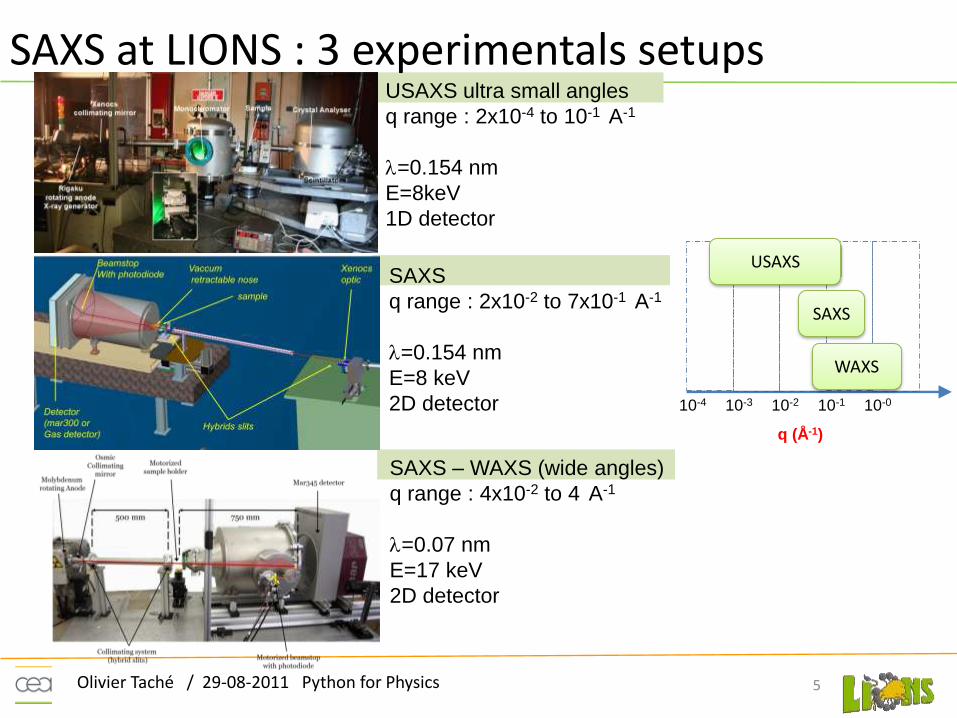
SAXS at LIONS : 3 experimentals setups
5
SAXS
q range : 2x10⁻² to 7x10⁻¹ A-1
=0.154 nm
E=8 keV
2D detector
SAXS – WAXS (wide angles)
q range : 4x10⁻² to 4 A-1
=0.07 nm
E=17 keV
2D detector
USAXS ultra small angles
q range : 2x10⁻⁴ to 10-1 A-1
=0.154 nm
E=8keV
1D detector
10-4 10-3 10-2 10-1 10-0
USAXS
SAXS
WAXS
q (Å-1)
Olivier Taché / 29-08-2011 Python for Physics
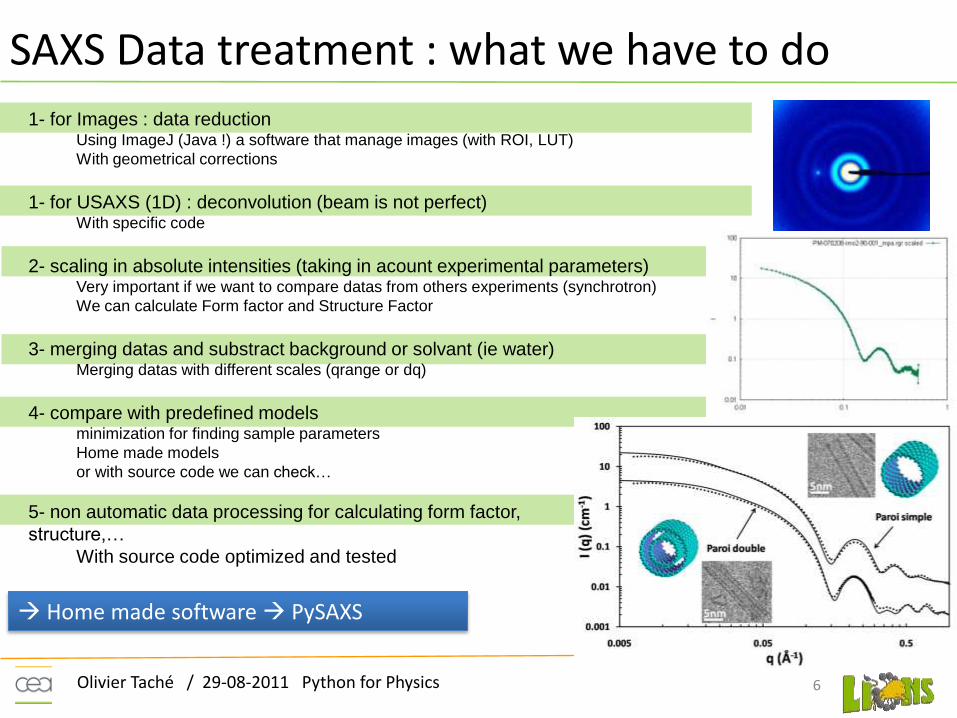
SAXS Data treatment : what we have to do
6
1- for Images : data reduction Using ImageJ (Java !) a software that manage images (with ROI, LUT)
With geometrical corrections
1- for USAXS (1D) : deconvolution (beam is not perfect) With specific code
2- scaling in absolute intensities (taking in acount experimental parameters) Very important if we want to compare datas from others experiments (synchrotron)
We can calculate Form factor and Structure Factor
3- merging datas and substract background or solvant (ie water) Merging datas with different scales (qrange or dq)
4- compare with predefined models minimization for finding sample parameters
Home made models
or with source code we can check…
5- non automatic data processing for calculating form factor,
structure,…
With source code optimized and tested
Home made software PySAXS
Olivier Taché / 29-08-2011 Python for Physics
Other softwares ?
Other SAXS data treatment softwares :
– Sasfit : for neutron, C language
– SOLEIL : foxtrot (integrated with the hardware)
– Igor routines (not free, code source)
– Matlab routines (not free, code source)
– BioXtas (python with a similar wxPython GUI)
With python, researchers can validate and modify the source code
With GuiSAXS, standard users can analyze easily datas
7
Olivier Taché / 29-08-2011 Python for Physics
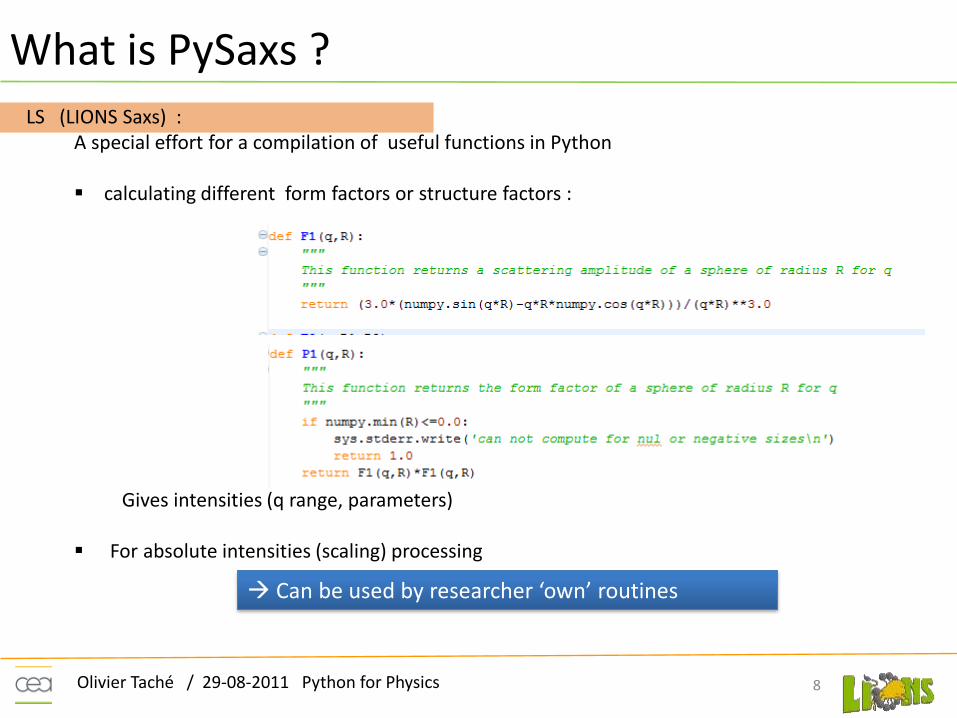
What is PySaxs ?
8
LS (LIONS Saxs) : A special effort for a compilation of useful functions in Python
calculating different form factors or structure factors :
Gives intensities (q range, parameters)
For absolute intensities (scaling) processing
Can be used by researcher ‘own’ routines
Olivier Taché / 29-08-2011 Python for Physics
What is PySaxs ?
9
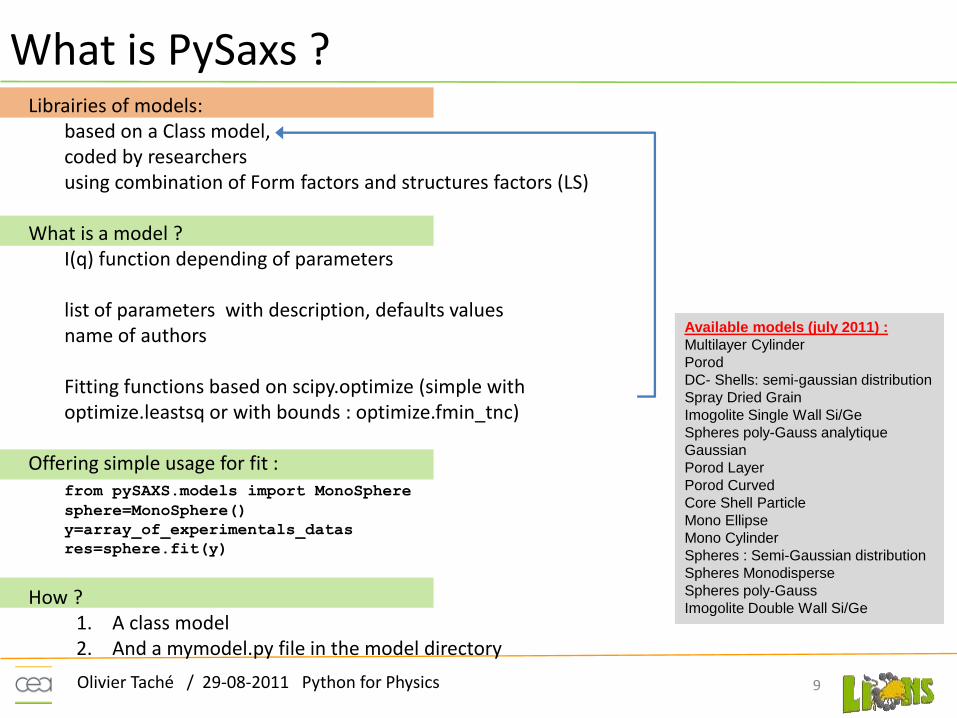
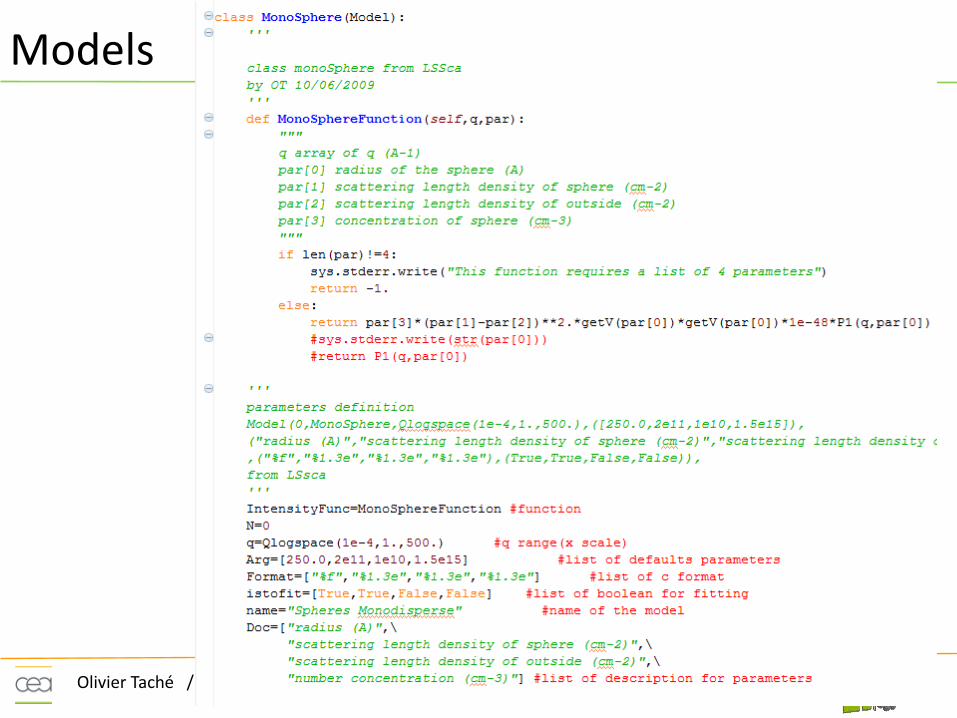
Librairies of models: based on a Class model, coded by researchers using combination of Form factors and structures factors (LS) What is a model ? I(q) function depending of parameters list of parameters with description, defaults values name of authors Fitting functions based on scipy.optimize (simple with
optimize.leastsq or with bounds : optimize.fmin_tnc) Offering simple usage for fit : from pySAXS.models import MonoSphere
sphere=MonoSphere()
y=array_of_experimentals_datas
res=sphere.fit(y)
How ?
1. A class model 2. And a mymodel.py file in the model directory
Available models (july 2011) :
Multilayer Cylinder
Porod
DC- Shells: semi-gaussian distribution
Spray Dried Grain
Imogolite Single Wall Si/Ge
Spheres poly-Gauss analytique
Gaussian
Porod Layer
Porod Curved
Core Shell Particle
Mono Ellipse
Mono Cylinder
Spheres : Semi-Gaussian distribution
Spheres Monodisperse
Spheres poly-Gauss
Imogolite Double Wall Si/Ge
Olivier Taché / 29-08-2011 Python for Physics
Models
10
Olivier Taché / 29-08-2011 Python for Physics
What is PySaxs ?
11
A graphic user interface : GuiSAXS no satisfaisant interface for data treatment and data manipulation
• import data from experiments (text file) • scaling • compare • substraction or manipulation datas with different scales • correct plotting tool (log scale) • gnuplot and matplotlib • modeling
• informations about data treatment
Using wxPython : Not a real choice Works on windows and linux No IDE : all the code is made by « hand » as much as possible : generic dialog boxes
Olivier Taché / 29-08-2011 Python for Physics
GuiSAXS
12
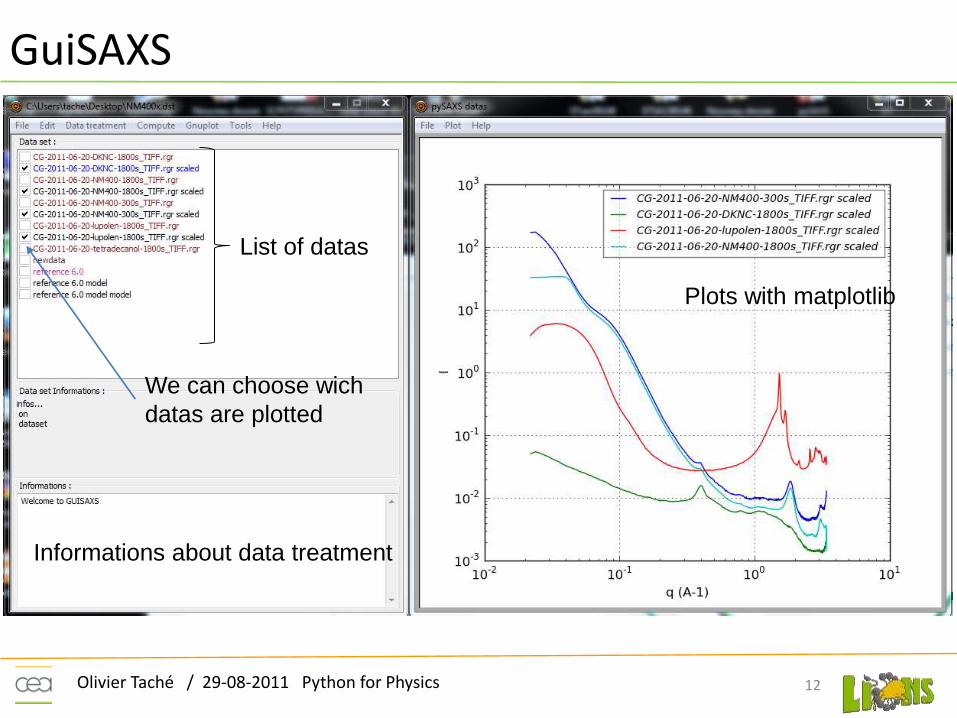
List of datas
We can choose wich
datas are plotted
Plots with matplotlib
Informations about data treatment
Olivier Taché / 29-08-2011 Python for Physics
GuiSAXS
13
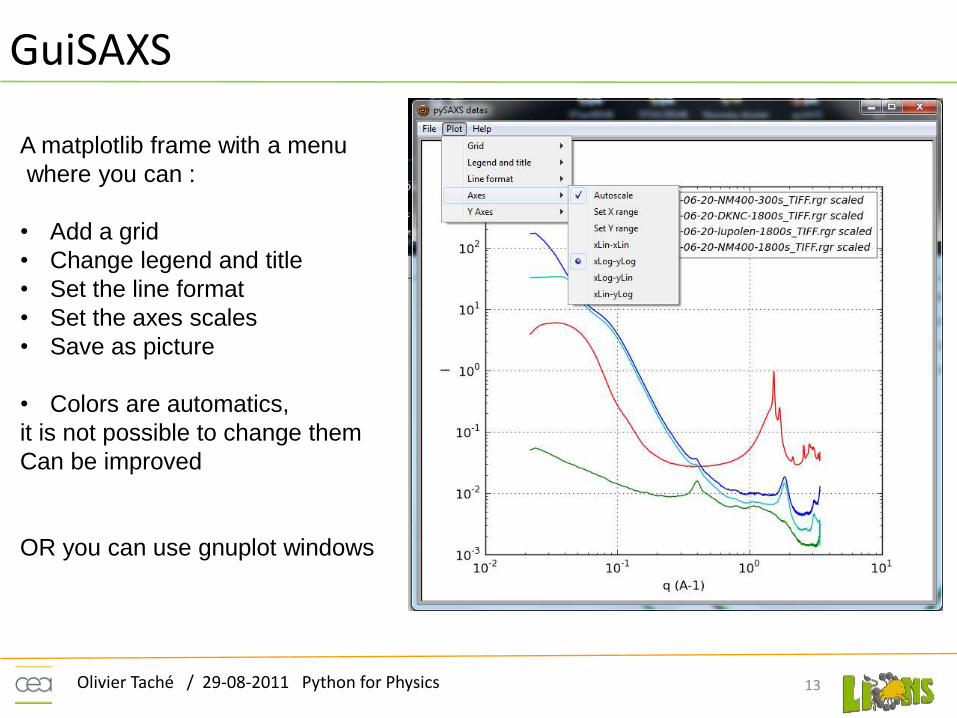
A matplotlib frame with a menu
where you can :
• Add a grid
• Change legend and title
• Set the line format
• Set the axes scales
• Save as picture
• Colors are automatics,
it is not possible to change them
Can be improved
OR you can use gnuplot windows
Olivier Taché / 29-08-2011 Python for Physics
GuiSAXS : data manipulation
14
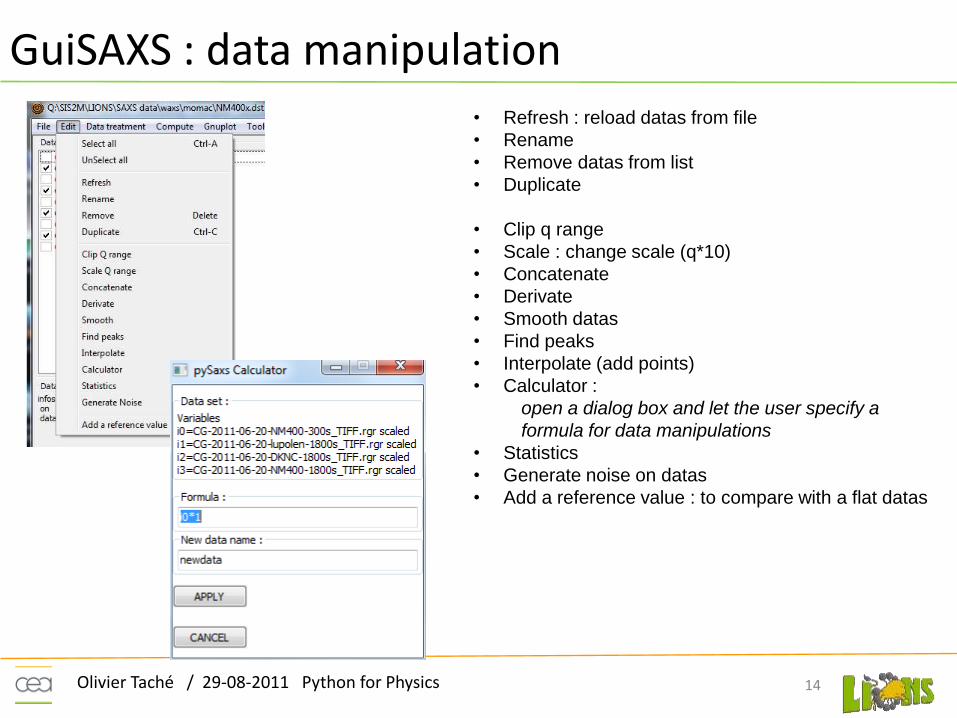
• Refresh : reload datas from file
• Rename
• Remove datas from list
• Duplicate
• Clip q range
• Scale : change scale (q*10)
• Concatenate
• Derivate
• Smooth datas
• Find peaks
• Interpolate (add points)
• Calculator :
open a dialog box and let the user specify a
formula for data manipulations
• Statistics
• Generate noise on datas
• Add a reference value : to compare with a flat datas
Olivier Taché / 29-08-2011 Python for Physics
GuiSAXS : data scaling
15
edt
CqI
ij 1.
1.
.)(
0
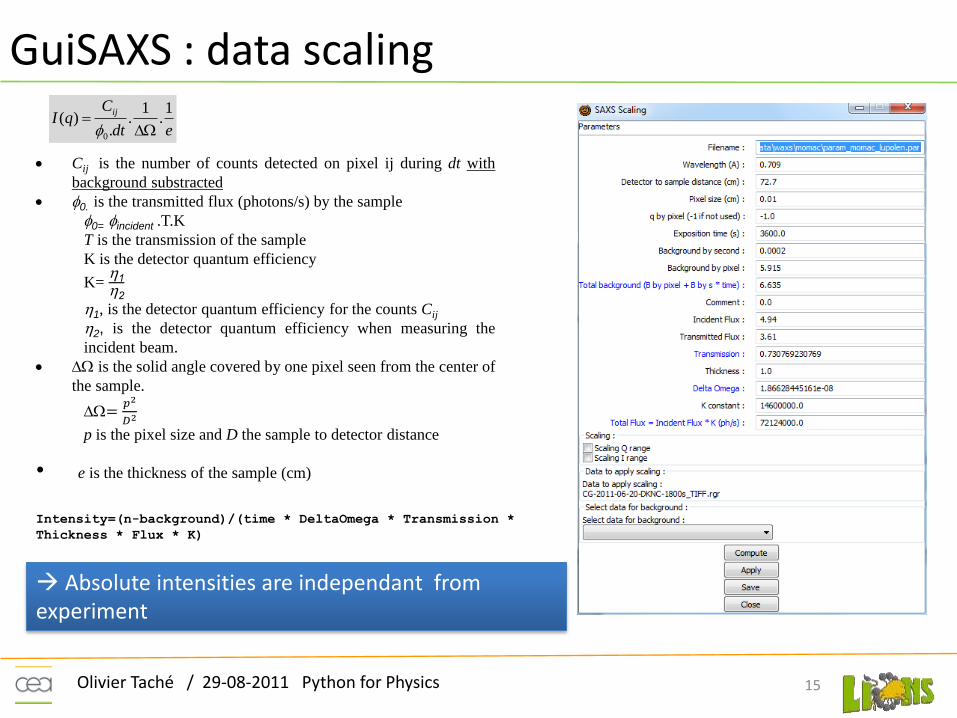
Cij is the number of counts detected on pixel ij during dt with
background substracted
0. is the transmitted flux (photons/s) by the sample
0= incident .T.K
T is the transmission of the sample
K is the detector quantum efficiency
K= 12
1, is the detector quantum efficiency for the counts Cij
2, is the detector quantum efficiency when measuring the
incident beam.
is the solid angle covered by one pixel seen from the center of
the sample.
=𝑝2
𝐷2
p is the pixel size and D the sample to detector distance
• e is the thickness of the sample (cm)
Intensity=(n-background)/(time * DeltaOmega * Transmission *
Thickness * Flux * K)
Absolute intensities are independant from experiment
Olivier Taché / 29-08-2011 Python for Physics
Data substraction
16
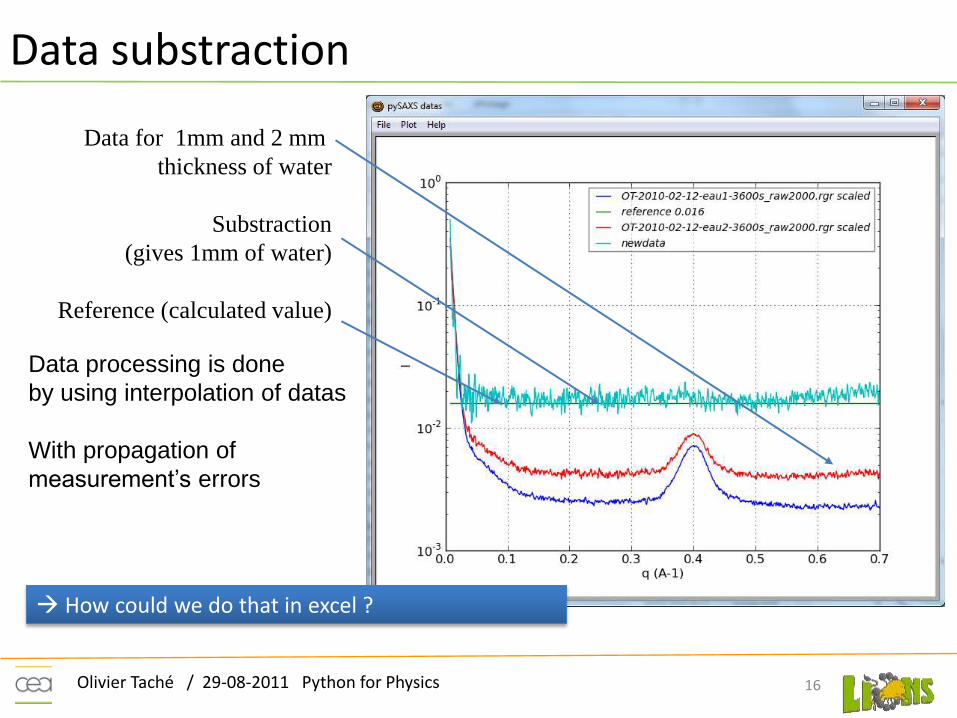
Data for 1mm and 2 mm
thickness of water
Substraction
(gives 1mm of water)
Reference (calculated value)
Data processing is done
by using interpolation of datas
With propagation of
measurement’s errors
How could we do that in excel ?
Olivier Taché / 29-08-2011 Python for Physics
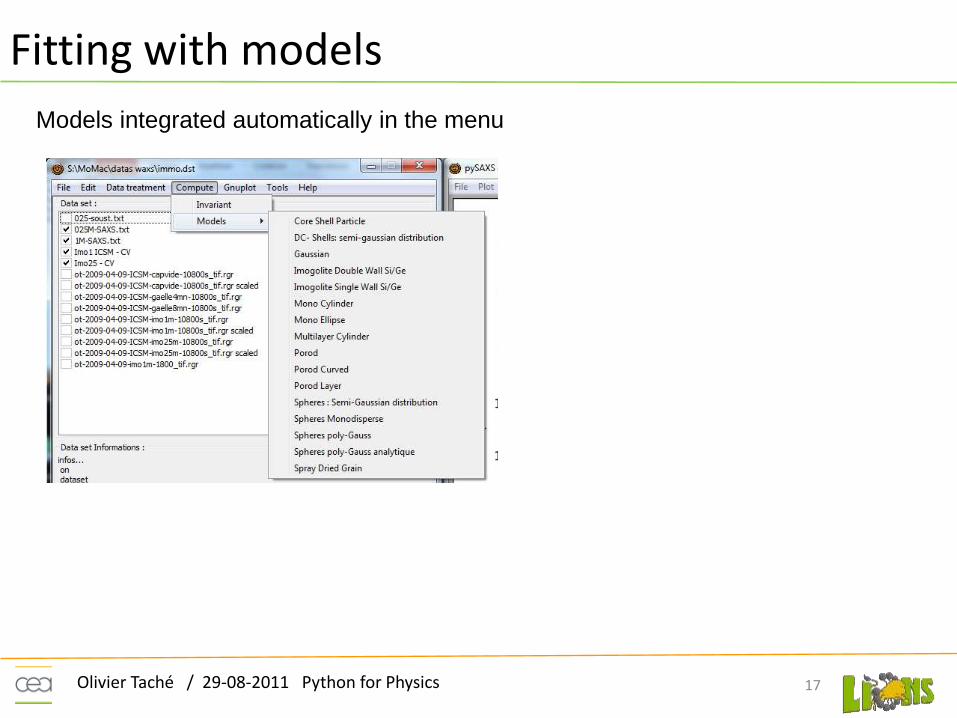
Fitting with models
17
Models integrated automatically in the menu
Olivier Taché / 29-08-2011 Python for Physics
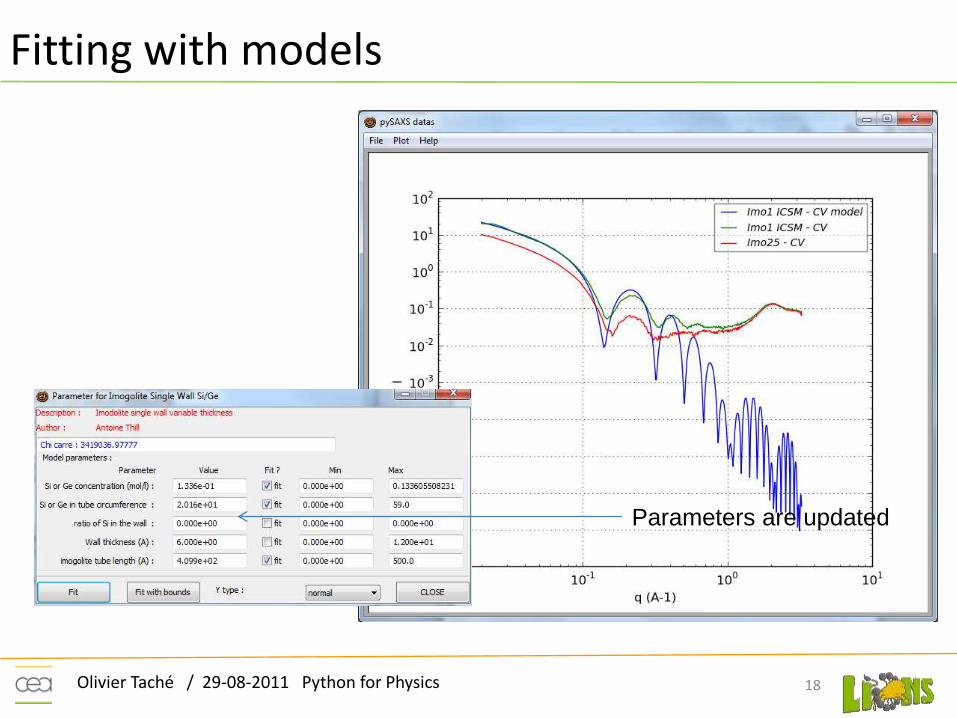
Fitting with models
18
Parameters are updated
Olivier Taché / 29-08-2011 Python for Physics
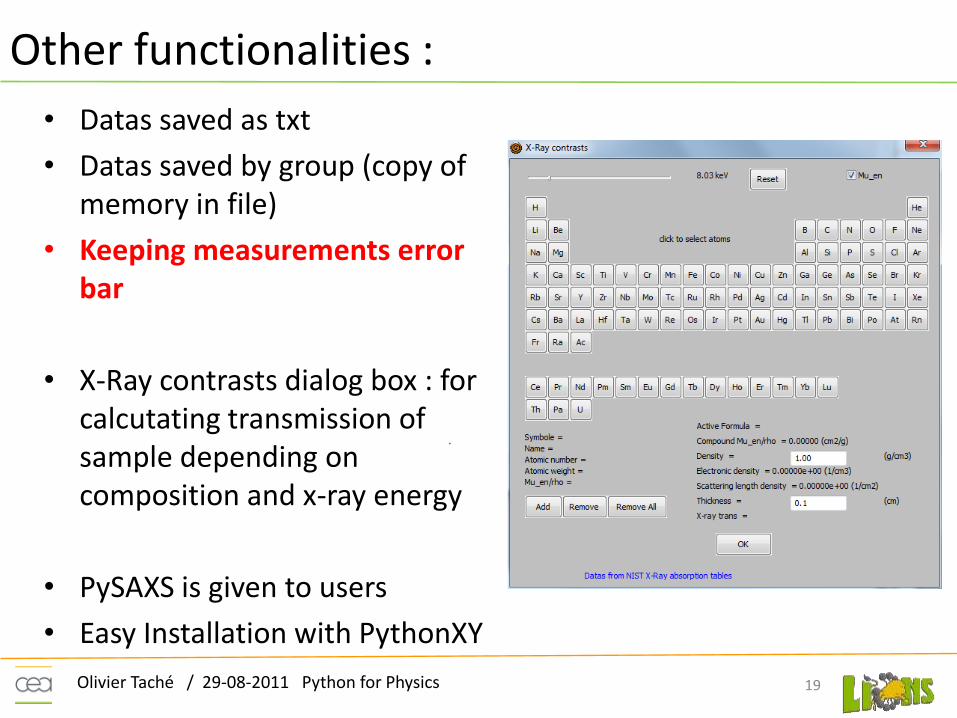
Other functionalities :
• Datas saved as txt
• Datas saved by group (copy of memory in file)
• Keeping measurements error bar
• X-Ray contrasts dialog box : for calcutating transmission of sample depending on composition and x-ray energy
• PySAXS is given to users
• Easy Installation with PythonXY
19
Olivier Taché / 29-08-2011 Python for Physics
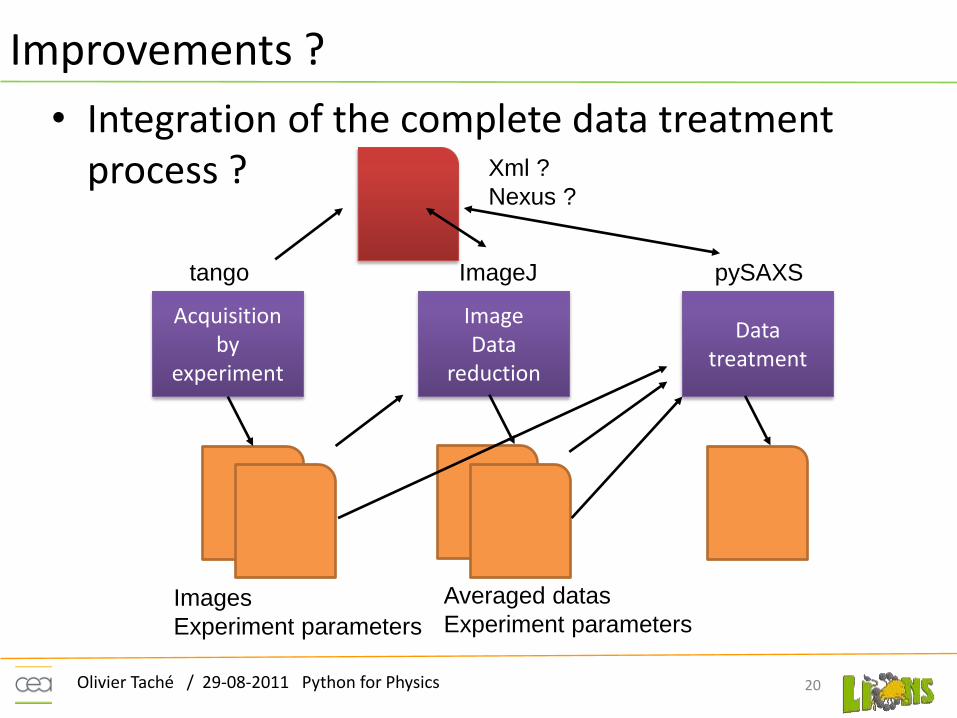
Improvements ?
• Integration of the complete data treatment process ?
20
Acquisition by
experiment
Images
Experiment parameters
Image Data
reduction
Data treatment
Averaged datas
Experiment parameters
tango ImageJ pySAXS
Xml ?
Nexus ?


![DIDI-HUBERMAN G. Image Matiere Immanence [Entr]](https://img.pdfslide.us/doc/110x75/577cc3b31a28aba71196e790/didi-huberman-g-image-matiere-immanence-entr.jpg)