Embed Size (px)
Citation preview

JOURNAL OF GEOPHYSICAL RESEARCH, VOL. ???, XXXX, DOI:10.1002/,
PYSAT: Python Satellite Data Analysis Toolkit
R. A. Stoneback , A. G. Burrell , J. Klenzing, M. D. Depew
R. A. Stoneback, W. B. Hanson Center for Space Sciences, 800 W. Campbell Rd. WT 15,
Richardson, TX 75080, USA. ([email protected])
A. G. Burrell, W. B. Hanson Center for Space Sciences, 800 W. Campbell Rd. WT 15,
Richardson, TX 75080, USA.
J. Klenzing, Space Weather Lab / Code 674, Goddard Space Flight Center, Greenbelt, MD,
USA
M. D. Depew, W. B. Hanson Center for Space Sciences, 800 W. Campbell Rd. WT 15,
Richardson, TX 75080, USA.
1W. B. Hanson Center for Space Sciences,
Physics Department, University of Texas at
Dallas, Richardson, Texas.
D R A F T April 22, 2018, 5:35pm D R A F T

X - 2 STONEBACK ET AL.: PYSAT
Abstract. A common problem in space science data analysis is combin-1
ing complementary data sources that are provided and analyzed in differ-2
ent formats and programming languages. The Python Satellite Data Anal-3
ysis Toolkit (pysat) addresses this issue by providing an open source toolkit4
that implements the general process of space science data analysis, from be-5
ginning to end, in an instrument independent manner. This toolkit uses an6
Instrument object that enables systematic analysis of science data from a7
variety of platforms within a single interface. Basic functions such as down-8
loading, loading, and cleaning are included for all supported instruments. Com-9
mon analysis routines are also included, which are instrument and data source10
independent. A nano-kernel is used to provide instrument independence, it11
is attached to the Instrument object and mediates the systematic and ar-12
bitrary modification of loaded data. Pysat uses the nano-kernel to improve13
the rigor of time series analysis, support on-the-fly orbit determination, and14
cleanly span file breaks. Pysat’s functions and higher level scientific analy-15
sis features are validated through the use of unit testing. Further adoption16
by the community provides a set of scientific results produced by a common17
core, constituting a distributed heritage that supports the validity of the un-18
derlying processing and scientific output. These features are used to demon-19
strate consistency between derived electron density profiles and measured20
ion drifts, particularly downward ion drifts in the afternoon hours during ex-21
treme solar minimum. Pysat builds upon open source Python software that22
is freely available and encourages community driven development.23
D R A F T April 22, 2018, 5:35pm D R A F T

STONEBACK ET AL.: PYSAT X - 3
1. Introduction
The study of the geospace environment requires a wide variety of measurement tech-24
niques and a large number of measurement platforms. The quantity of data itself can be a25
problem due to the variety of file formats and the unique characteristics of the underlying26
data. These practical difficulties hinder scientific advancement and result in duplicated27
efforts, as individual scientists or research groups create their own tools to solve old prob-28
lems. The scale and impact of these duplicated efforts has become intolerable now that29
the geospace community has begun to take a system science approach, which requires inte-30
grating measurements from multiple platforms to understand the environment as a whole31
[CEDAR, 2010; Gil et al , 2016]. Thus, there is a need for a framework to accommodate32
these varied data sets in an open and reproducible manner, while enabling versatility to33
pursue various avenues of scientific investigation.34
To support these goals, a variety of open source python packages have been released. Py-35
Glow collects a variety of space science models in one place, simplifies installation, and pro-36
vides a python interface [Duly et. al., 2013]. Apexpy [Mereen et al , 2018] and AACGMv237
[Burrell and Meeren, 2018] provide interfaces to magnetic field models. OCBPy is a38
Python module that converts between AACGM coordinates and a magnetic coordinate39
system that adjusts latitude and local time relative to the Open Closed field line Boundary40
(OCB) [Burrell and Chisham, 2018]. DaViTPy [DaViTPy , 2012] provides a suite of tools41
designed to support the Super Dual Auroral Radar Network (SuperDARN) [Greenwald42
et al., 1995; Chisham et al., 2007]. GeoData [Swoboda et al , 2016] is an API for obtain-43
ing and visualizing space science data, with current support for ground based systems.44
D R A F T April 22, 2018, 5:35pm D R A F T

X - 4 STONEBACK ET AL.: PYSAT
The Madrigal database, a repository of many space science measurements, has a python45
interface [Rideout , 2004]. SpacePy [Morely et al , 2010] includes a variety of tools to sup-46
port space science, a partial list includes field line tracing, file format support, coordinate47
conversions, superposed epoch analysis support, and time support functions. pysatCDF48
[Stoneback and Depew , 2018] provides a python interface to NASA CDF libraries and ad-49
ditional functionality to format this data for coupling with pysat. To simplify installation50
the NASA CDF source code is included within pysatCDF and compiled automatically51
using standard community tools. A pure python implementation for CDF reading and52
writing without the use of the NASA C library is under development [Harter and Liu,53
2018].54
The Python Satellite Data Analysis Toolkit (pysat) presented here is an open source55
software package that handles the tedious details of file and data handling with a consistent56
front end, allowing researchers to focus on the unique aspects of their scientific research.57
Pysat’s design evolved through years of data analysis using a variety of space and ground58
based platforms and data types to enable the versatility required to address scientific59
questions within a single interface. The generalized treatment of data sets and processing60
by pysat provides the common ground needed to integrate many python package and61
sources of data and into a cohesive whole that enables system science.62
Pysat support begins with assisting users in obtaining data. Each instrument supported63
by pysat includes routines to download data from appropriate public locations, organize64
the files on the local computer, and clean the data.65
Pysat handles both data and metadata, data about the loaded data, with support for66
handling files of differing metadata standards in a consistent and robust manner. Even67
D R A F T April 22, 2018, 5:35pm D R A F T

STONEBACK ET AL.: PYSAT X - 5
within the same file standard, differing capitalization (case) may be found across files68
from different teams. Pysat handles metadata in a case preserving manner that is also69
case-insensitive, enabling ease of use.70
To enable the custom processing required by novel scientific investigations pysat includes71
funcitonality that mediates the application of custom functions upon data as it loaded.72
This design pattern ensures the availability of the newly processed parameters across all73
levels of pysat, with no additional effort required by the user.74
To ease data distribution, routines have been created that transparently write a pysat75
Instrument object to disk in a netCDF4 file, as well as load that file and produce the same76
pysat Instrument object. These routines are written to be consistent with a combined77
netCDF4 and NASA CDAWeb standard employed by the upcoming NASA ICON mission.78
The validity of pysat functions and instrument independent analysis is verified through79
the use of unit testing. Automated tests have been developed that test instrument support80
routines, assisting new users in developing new instrument routines, while also ensuring81
that these routines continue to work. In addition to isolated unit tests that verify specific82
outputs from isolated functions, simulated instruments have been developed to support83
the testing of pysat and associated functions as users would interact with the system. As84
changes are committed to pysat, the test suite is automatically run, ensuring validity and85
compatibility throughout the development process.86
These features support the development and use of instrument independent analysis87
routines allowing users to focus on the unique aspects of their research project. Pysat’s88
openness to community development also provides a place for researchers to disseminate89
their analysis routines used in their work. The application of an instrument independent90
D R A F T April 22, 2018, 5:35pm D R A F T

X - 6 STONEBACK ET AL.: PYSAT
seasonal bin averaging routine is demonstrated here as an example of one such routine,91
using remote measurements from COSMIC [Yue et al., 2010] and in situ measurements92
from C/NOFS [de La Beaujardire et. al., 2004]. Despite the large difference in measure-93
ment type and data format, the same seasonal routine is used on both platforms. This94
demonstrates geophysical consistency between the platforms. The use of seasonal bin95
averaging is widespread in space science data analysis, thus pysat’s validated instrument96
independent implementation of this technique could assist many scientific studies using97
the same underlying code.98
2. Instrument Object
The core functionality of pysat lies in the Instrument object. The intent of the In-99
strument object is to offer a single interface for interacting with science data that is100
independent of measurement platform. The layer of abstraction presented by the Instru-101
ment object is required for instrument independent analysis procedures, but it can also102
make science data analysis simpler and more rigorous.103
As a simple metaphor, a software object is like a box with buttons. Inside the box the104
object stores required data and the buttons on the box call methods that understand how105
to interact with the data and produce the desired products. The pysat Instrument object106
follows this guideline by storing science data within an object that also includes a number107
of basic functions designed to load, modify, and analyze the data over arbitrary periods.108
Data is stored internally in a Python Data Analysis Library (pandas) DataFrame, a format109
chosen due to its time based array indexing and its ability to align multiple data products.110
The pandas DataFrame is capable of storing higher dimensional objects, enabling mixed111
dimensionality data sets [McKinney , 2010].112
D R A F T April 22, 2018, 5:35pm D R A F T

STONEBACK ET AL.: PYSAT X - 7
Pysat supports one data set per Instrument object, where a data set is defined as having113
a single platform, instrument, measurement type, and satellite identifier, as appropriate.114
Though the particulars of the files and data differ greatly between missions, the interface to115
the data through the Instrument object remains constant. As an example, consider how to116
initialize Instrument objects for magnetometer data from the Vector Electric Field Instru-117
ment (VEFI) or electron data from the Planar Langmuir Probe (PLP) that flew onboard118
the Communications/Navigation Outage Forecasting System (C/NOFS), thermal plasma119
measurement from the Ion Velocity Meter (IVM) also on C/NOFS; Global Positioning120
Signals (GPS) from the Constellation Observing System for Meteorology, Ionosphere, and121
Climate (COSMIC) satellites, or high-level, ground-based radar measurements from the122
northern hemispheric portion of Super Dual Auroral Radar Network (SuperDARN):123
vefi = pysat.Instrument(platform=’cnofs’, name=’vefi’, tag=’dc_b’)124
ivm = pysat.Instrument(platform=’cnofs’, name=’ivm’)125
cosmic = pysat.Instrument(platform=’cosmic2013’, name=’gps’, tag=’ionprf’)126
darn = pysat.Instrument(platform=’superdarn’, name=’grdex’, tag=’north’)127
Note how each instrument requires a different level of specificity based on the division128
of data products within each mission. The full list of supported instruments is available129
directly in python by inspecting the submodules, as well as within the pysat documenta-130
tion. Details about the options available for each instrument are stored directly within131
the code through a python commenting standard called a docstring. These docstrings are132
automatically collected and presented in the pysat documentation, reflecting the current133
state of the instrument suite. The pysat documentation is integrated with a continuous134
documentation service and is automatically generated as versions are released.135
D R A F T April 22, 2018, 5:35pm D R A F T

X - 8 STONEBACK ET AL.: PYSAT
For each instrument, pysat looks for supporting routines that understand the unique136
qualities of the data set and handles the translation into a pysat compatible format. When137
no existing routines are available, they may be added to pysat. However, if no pysat138
specific support exists but there are already existing packages to support the loading of139
a data set, this functionality does not need to be recreated. For example, support for140
SuperDARN is fundamentally enabled by DaViT Python Project routines, which obtain141
and load the SuperDARN files.142
Pysat support for some public data sources may be generalized. In these cases adding143
a new instrument to pysat may only involve little effort. Routines have been created144
for NASA’s CDAWeb Common Data Format (CDF) and included with pysat. Pysat’s145
support of C/NOFS’ IVM, VEFI, PLP, and NASA’s OMNI data sets are all driven by146
these routines. The only differences in pysat’s support for each instrument are the cleaning147
routines, public data locations, and filename details.148
Though the particulars of VEFI magnetometer data, IVM plasma parameters, COS-149
MIC atmospheric measurements, and SuperDARN backscatter measurements are very150
different, the processes for high level operations on these data are the same. Data for any151
Instrument may be obtained from data servers intended for public distribution and stored152
locally by using the ’download’ function, and data may be loaded for each instrument153
using the ’load’ function. There are multiple options available when instantiating objects154
and when loading data that are fully explained in the pysat documentation, but outside155
the scope of this document.156
As mentioned previously, pysat uses the pandas DataFrame to store information inter-157
nally. The DataFrame is similar to a spreadsheet, possessing labeled columns and rows.158
D R A F T April 22, 2018, 5:35pm D R A F T

STONEBACK ET AL.: PYSAT X - 9
Pysat labels labels columns by the data name and rows by date and time. When opera-159
tions are performed on the underlying data, row indices are aligned before performing the160
operation. The loaded data may be accessed at the object level using strings. Support161
for slicing and other operations is included.162
For the one dimensional measurements in time, each column in the pandas DataFrame163
is a simple indexed array of numbers. However, the pandas DataFrames also support164
general collections of objects, used here to support higher dimensional data structures,165
such as the two dimensional electron density profiles from COSMIC. This is shown below166
for the first four elements of a COSMIC electron density profile. Note that the profile for167
this single time is also indexed by altitude.168
In[]: cosmic[0,’profiles’]169
Out[]:170
ELEC_dens GEO_lat171
MSL_alt172
59.592628 34801.515625 49.295200173
62.223614 31884.595703 49.303425174
64.850388 32775.335938 49.311638175
67.472939 29608.988281 49.319843176
2.1. MetaData
Maintaining information about the data set is important. Pysat has built-in support to177
keep track of metadata, stored in a Meta object attached to the Instrument object. Meta-178
data may be accessed by name at the object level, similar to standard data. Metadata179
may be assigned when data is assigned, or as needed. By default, units, name, notes,180
D R A F T April 22, 2018, 5:35pm D R A F T

X - 10 STONEBACK ET AL.: PYSAT
description, plot label, axis label, fill value, and plot scaling (linear vs log) are always181
tracked by the Instrument object, though arbitrary additional parameters may be added.182
When writing to a file, these metadata parameters are translated into a mixed standard183
spanning file requirements for the netCDF4 files as well as the International Solar Terres-184
trial Physics (ISTP) standard employed by NASA’s CDAWeb. Parameters that may be185
determined through simple inspection of the data are not tracked.186
To help maintain compatibility with multiple standards, the pysat Meta object allows187
for user specified string labels to identify particular metdata types (fill, units, notes).188
As an example for fill values, netCDF4 files should use ’ FillValue’ while ISTP specifies189
’FillVal’. Case is preserved for these labels however data access is case-insensitive, thus190
’units’ works in code even if the label is strictly ’Units’. Label independent access is also191
provided, thus users can use attributes attached to the pysat Meta object to access the192
desired metadata type without specifying the string used to label those values.193
2.2. Modifying Data
Frequently, data sets need to be modified before a larger analysis may be completed.194
Instrument specific modifications are handled in pysat by a nano-kernel with a custom195
processing queue. Functions may be added to the queue as needed, and whenever new196
data is loaded the nano-kernel will apply the ordered functions before making the data197
available to the user. This configuration ensures that the newly calculated data has198
the same properties and availability as parameters that are native to the file. A data199
cleaning example is shown below. This code segment selects only VEFI magnetometer200
measurements made at times when the magnetic torque rods on the spacecraft, used for201
momentum control, were not contaminating the magnetic field environment.202
D R A F T April 22, 2018, 5:35pm D R A F T

STONEBACK ET AL.: PYSAT X - 11
# define function to remove flagged values203
def filter_vefi(vefi):204
idx, = np.where(vefi[’B_flag’]==0)205
vefi.data = vefi[idx, :]206
return207
# add custom function to instrument208
vefi.custom.add(filter_vefi, ’modify’)209
Once added, this function will filter the available VEFI data, modifying it in place,210
every time vefi.load is called.211
2.3. Data Flow
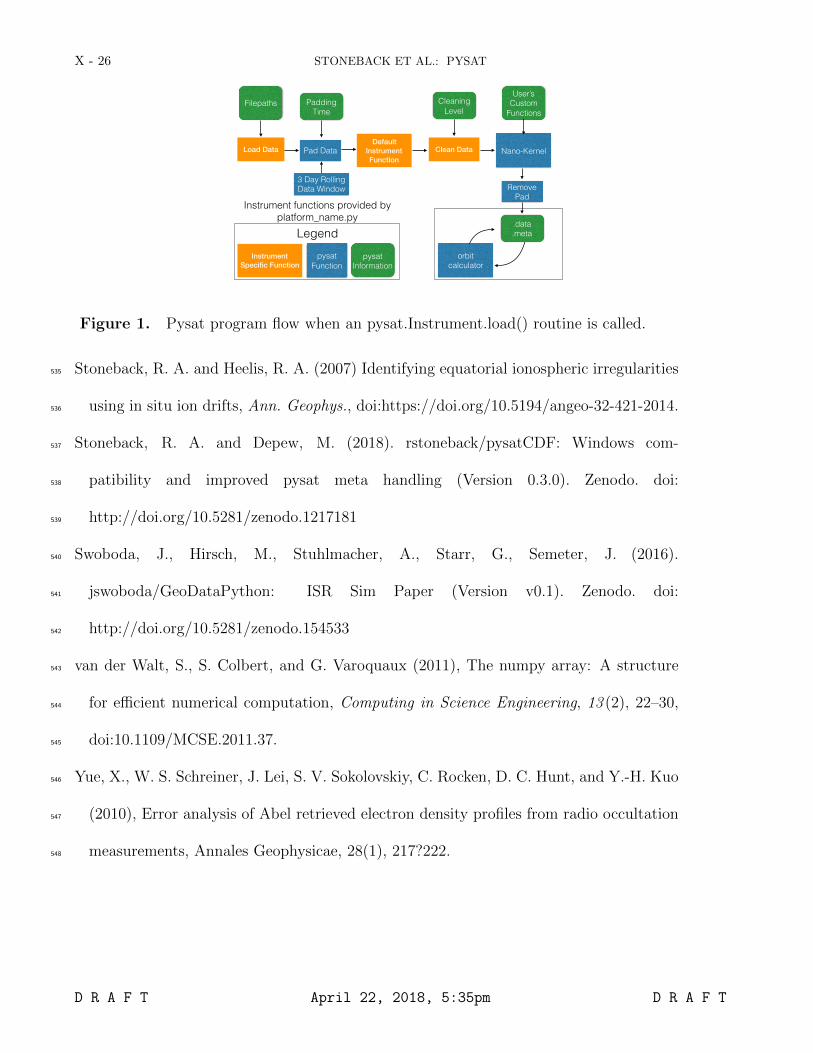
The full data flow through the Instrument object when a load call is invoked is shown in212
Figure 1. Instrument specific functions (purple) translate the specifics of the given data213
set into a format suitable for pysat. Options and other parameters provided by the user214
are supplied as needed, shown in green. Pysat invokes the instrument specific functions215
as needed to provide the user with data in the desired form. Functions handled by pysat216
are shown in blue.217
3. Generalized Space Science Solutions
Pysat builds upon the consistent object interface across data sets to enable generalized218
solutions for space science data analysis and visualization. At a basic level, all analysis219
routines that use the pysat Instrument object gain some independence from the particulars220
of the analyzed data. For example, string based data access makes it easy to support221
programmatic use of data. This and other pysat features allow many analytical processes222
D R A F T April 22, 2018, 5:35pm D R A F T

X - 12 STONEBACK ET AL.: PYSAT
to be generalized. Several examples of pysat generalized solutions to common space science223
data problems are discussed in this section.224
3.1. Recreating Continuous Data from Files
Measurements of continuous processes by scientific instruments are eventually divided225
into chunks and stored separately on a file system. These file boundaries can interfere226
with calculations, particularly for those times near the file edges. For example, consider227
a simple centered smoothing filter that averages a set number of measurements in time.228
The start and end of the time series will not have enough samples to obtain the result.229
To handle this problem, as well as the possibility of data gaps, a user must choose how to230
balance the quality and coverage of the output.231
Pysat offers a solution to the problem of file breaks in a data set that requires no specific232
support by any user supplied routine. When activated, pysat maintains an internal data233
buffer that spans three files/days, depending upon user selected parameters. Each time234
a user loads data, pysat centers the data buffer on the requested time, downselects from235
this full buffer the requested data plus a user specified amount of data padding, applies236
any user directed custom functions, and then removes the padded data before making the237
full results available to the user (see Figure 1). This solution does not fix the calculation238
everywhere, but rather pushes the boundaries where the calculation degrades outside the239
desired time range and then removes the degraded calculations.240
The resulting output is equivalent to a continuous data set, barring measurement gaps.241
The time period for this padding is arbitrary up to a maximum additional file or day.242
While this limits the maximum continuous data period available for a time based calcula-243
tion, shorter period calculations may be applied without error over an effectively infinite244
D R A F T April 22, 2018, 5:35pm D R A F T
STONEBACK ET AL.: PYSAT X - 13
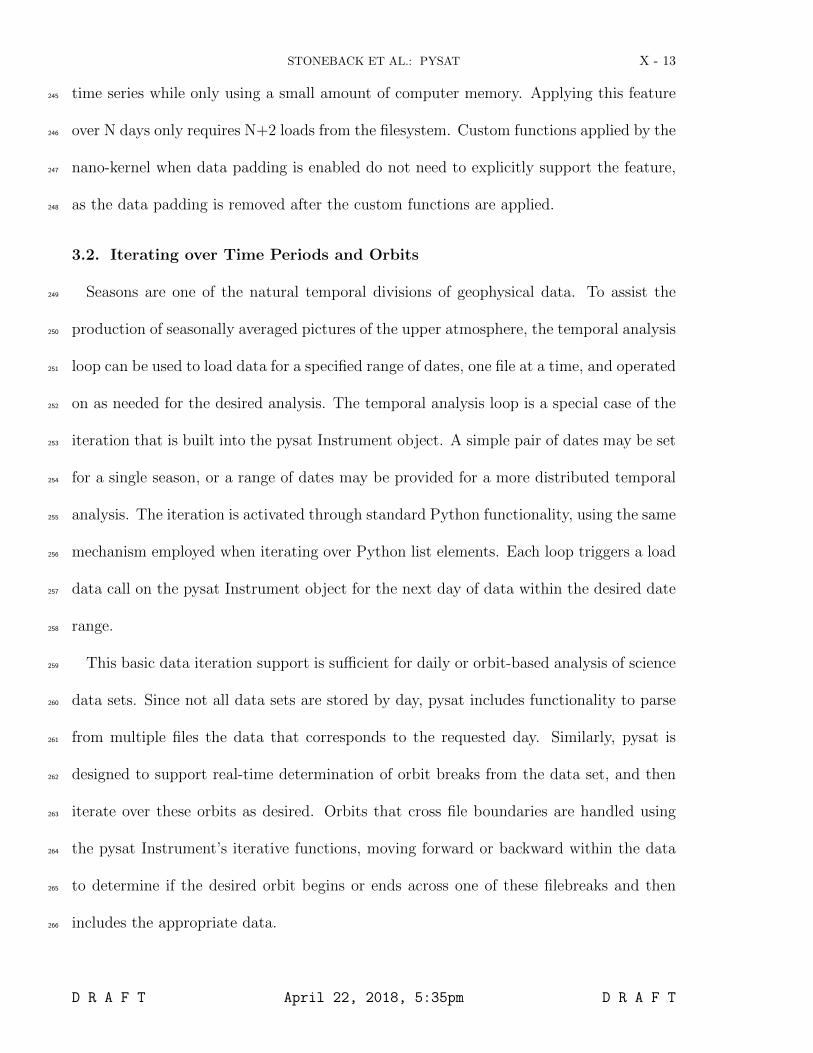
time series while only using a small amount of computer memory. Applying this feature245
over N days only requires N+2 loads from the filesystem. Custom functions applied by the246
nano-kernel when data padding is enabled do not need to explicitly support the feature,247
as the data padding is removed after the custom functions are applied.248
3.2. Iterating over Time Periods and Orbits
Seasons are one of the natural temporal divisions of geophysical data. To assist the249
production of seasonally averaged pictures of the upper atmosphere, the temporal analysis250
loop can be used to load data for a specified range of dates, one file at a time, and operated251
on as needed for the desired analysis. The temporal analysis loop is a special case of the252
iteration that is built into the pysat Instrument object. A simple pair of dates may be set253
for a single season, or a range of dates may be provided for a more distributed temporal254
analysis. The iteration is activated through standard Python functionality, using the same255
mechanism employed when iterating over Python list elements. Each loop triggers a load256
data call on the pysat Instrument object for the next day of data within the desired date257
range.258
This basic data iteration support is sufficient for daily or orbit-based analysis of science259
data sets. Since not all data sets are stored by day, pysat includes functionality to parse260
from multiple files the data that corresponds to the requested day. Similarly, pysat is261
designed to support real-time determination of orbit breaks from the data set, and then262
iterate over these orbits as desired. Orbits that cross file boundaries are handled using263
the pysat Instrument’s iterative functions, moving forward or backward within the data264
to determine if the desired orbit begins or ends across one of these filebreaks and then265
includes the appropriate data.266
D R A F T April 22, 2018, 5:35pm D R A F T

X - 14 STONEBACK ET AL.: PYSAT
This combination of features makes it straightforward to make an orbit by orbit plot267
for any of the satellite missions supported by pysat. A simple code example for plotting268
the entirety of the VEFI data set by orbit is shown below, while the results are shown in269
Figure 2. For this particular example the orbits are set to begin and end at 0◦ geographic270
longitude.271
# instantiate instrument with desired orbit breakdown272
orbit_info = {’index’:’longitude’, ’kind’:’longitude’}273
vefi = pysat.Instrument(platform=’cnofs’, name=’vefi’, tag=’dc_b’,274
clean_level=None, orbit_info=orbit_info)275
# iterate over dataset, orbit by orbit276
for count, vefi in enumerate(vefi.orbits):277
# One orbit of data is now accessible via vefi.data278
# To ensure data gaps do not have a line drawn across the gap,279
# resample data onto constant 1 second cadence, filling in gaps with NaN280
vefi.data = vefi.data.resample(’1S’, fill_method=’ffill’,281
limit=1, label=’left’ )282
# data is ready to be plotted283
3.3. Instrument Independent Seasonal Analysis
Pysat functionality has been used to develop several seasonal analysis routines that are284
instrument and iteration independent. An example using a pysat occurrence probability285
routine is shown, reproducing the fundamental processing used to obtain published results286
by Stoneback and Heelis [2014]. Note that the pysat analysis covers all of the data loading,287
iteration, and analysis. No specific support for VEFI was included in the routine. The288
D R A F T April 22, 2018, 5:35pm D R A F T

STONEBACK ET AL.: PYSAT X - 15
routine calculates the number of times a given value exceeds a supplied threshold at289
least once per temporal period (day, file, or orbit), divided by the number of times a290
given spatial bin is visited per temporal period. As a demonstration, the probability of291
a positive perturbation in the meridional component of the geomagnetic field by orbit is292
shown over a week for VEFI in Figure 3.293
To help ensure the plotted data is geophysical, the VEFI torque rod exclusion function294
introduced earlier is attached to a VEFI pysat object. This function selects data when295
magnetic torquers on C/NOFS were idle. The torque rod firings interfered with the296
electromagnetic measurements and are generally located near the magnetic equator. The297
reduction in counts in Figure 3(b) along the magnetic equator demonstrates that the298
custom function is properly selecting data. The code to produce Figure 3 follows:299
# instantiate instrument with desired orbit breakdown300
orbit_info = {’index’:’longitude’, ’kind’:’longitude’}301
vefi = pysat.Instrument(platform=’cnofs’, name=’vefi’, tag=’dc_b’,302
clean_level=None, orbit_info=orbit_info)303
# add custom torque rod filter function to instrument304
vefi.custom.add(filter_vefi, ’modify’)305
# set time limits on data analysis306
start = pysat.datetime(2010,5,9)307
stop = pysat.datetime(2010,5,15)308
# download data for specified time period309
vefi.download(start, stop)310
# perform probability calculation. Any data added by custom functions is311
D R A F T April 22, 2018, 5:35pm D R A F T

X - 16 STONEBACK ET AL.: PYSAT
# available within routine below312
ans = ssnl.occur_prob.by_orbit2D(vefi, [0,360,144], ’longitude’,313
[-13,13,104], ’latitude’, [’dB_mer’], [0.], returnBins=True)314
# a dictionary object with keys corresponding315
# to data labels is returned316
# results are ready for plotting317
Pysat also includes generalized seasonal analysis routines that support averaging mul-318
tiple instrument parameters of various dimensionality over a season. Here we use this319
functionality to average both IVM and COSMIC data, enabling comparisons between the320
average distributions of ion density and ion drift. The same general process used to ob-321
tain the VEFI occurrence probability is used; both IVM and COSMIC pysat objects are322
instantiated and passed along to the seasonal pysat routines for analysis. The COSMIC323
data set does not come with location information in geomagnetic coordinates, or with324
information on the topside scale height, so these parameters are calculated using custom325
functions and applied to the data set automatically using the nano-kernel functionality.326
The nano-kernel functionality ensures that the custom COSMIC parameters are available327
for averaging within the seasonal bin averaging routine.328
Figure 4 includes ion drift measurements from IVM and electron density profile param-329
eters from COSMIC, seasonally averaged over apex longitude and local time. The use330
of apex longitude organizes the data based upon the apex location of the geomagnetic331
field line at the measurement location. IVM derived vertical ion drifts are at the top332
followed by the COSMIC derived ion density maximum, height of the density maximum,333
and the thickness of the density distribution. This ion drift average displays downward334
D R A F T April 22, 2018, 5:35pm D R A F T

STONEBACK ET AL.: PYSAT X - 17
afternoon ion drifts, a characteristic of the ionosphere during very low solar activity levels335
Stoneback et al [2011]. These ion drifts employ a geophysically motivated calibration to336
appropriately set the zero ion drift level used when translating raw IVM measurements337
to geophysical ion drifts [Stoneback et al , 2011].338
In the late afternoon and evening sector, longitudinal and local time variations in the339
meridional ion drift recorded by IVM have equivalent variations in the altitude of the340
density maximum recorded by COSMIC. A strong correlation between drifts and density341
is not expected during the morning through afternoon as plasma production from sunlight342
is a dominant driver of density. In the late afternoon and evening hours, when plasma343
production and loss processes are small or nearly equal, redistribution of the plasma to344
different altitudes through transport by ion drifts are expected to have a measurable345
impact upon the ionosphere. The results in Figure 4 between 15 - 24 local time have346
a strong apparent correlation between areas with upward (downward) ion drifts and an347
increase (decrease) in the height of the density maximum across all longitudes.348
The full electron density profiles from COSMIC are shown in Figure 5 and correspond349
to the first four longitude sectors (0◦ − 60◦) in Figure 4. The first two longitude sectors350
(top panel) have upward slants in the bottomside density distribution at night, consistent351
with the upward drifts after sunset in Figure 4. In contrast, the bottom two panels, show352
longitudes associated with downward drifts in the evening and have flat bottomside ion353
distributions at night. These changes in the bottomside density profiles are consistent354
with the meridional plasma drift, because a negative drift moves plasma to lower altitude355
field lines with higher neutral densities, where loss processes rise exponentially. This effec-356
tively produces a minimum viable altitude for the nighttime ionosphere. The consistency357
D R A F T April 22, 2018, 5:35pm D R A F T

X - 18 STONEBACK ET AL.: PYSAT
demonstrated between IVM and COSMIC measurements provides supporting evidence358
that both platforms are reporting measurements with geophysical significance that have359
been analyzed in a consistent and appropriate manner. The same generalized seasonal360
analysis code was used for both IVM and COSMIC. The complete code to produce these361
figures is included in the pysat repository under demos.362
3.4. Validating Results
To validate space science results, both the code and the underlying data must be tested.363
A suite of unit tests have been developed to help ensure robust performance of pysat and364
its features. These tests initialize the system in a known state, perform a limited set of365
operations, and then compare the result of those operations against a known output. The366
pysat development repository is connected to a continuous integration service, which runs367
the test suite after every change to the codebase. Currently, 460 unit tests cover 82% of368
pysat’s code, as determined using standard community tools. Basic tests cover options for369
instantiating the pysat Instrument object and its handling of data, metadata, and files.370
To facilitate the testing of pysat features that require science data, such as the nano-371
kernel support, orbit-by-orbit iteration, and instrument independent analysis functions,372
testing instrument platforms are also included. These pysat test instruments operate like373
a normal pysat Instrument object. However, the typical load routines that read science374
data from the filesystem are replaced with a basic simulation of satellite motion. Signals375
representing the large scale periodic features of local time, longitude, latitude, altitude,376
etc. are generated. These routines produce infinite continuous streams of reproducible377
data that may be used as known inputs in a unit testing framework.378
D R A F T April 22, 2018, 5:35pm D R A F T

STONEBACK ET AL.: PYSAT X - 19
The general process of determining orbits from a random science data set faces a number379
of data and file issues. Accounting for these variables, along with the various input options380
that can be selected, required a significant testing suite. Iterating by orbit requires, in part,381
determining where orbit breaks occur, completing orbits across file breaks, accounting for382
data gaps, and ensuring consistent orbit numbering. To cover all of these options a383
general class of orbit tests were created that produced a wide range of data and file gaps.384
Each problem type is expanded upon to ensure coverage for edge and pathological cases.385
This whole suite of tests is then run using each type of orbit pysat supports (local time,386
longitude, latitude, orbit number), ensuring that loading or processing data by orbit will387
not affect the scientific analysis.388
Unit tests have also been developed to monitor the instrument specific routines that389
download, load, and clean science data as part of the pysat process. Each run of the unit390
testing suite downloads, loads, and cleans test days for pysat supported instruments using391
data obtained from the appropriate public data source. General pysat compliance is also392
checked, assisting users developing code to support new instruments. Some instruments393
have to be excluded from parts of the testing process, as access to the data sources requires394
authentication.395
3.5. Creating Data for Distribution
Creating data sets suitable for distribution has remained a challenge. Files that are easy396
to put together lack the metadata for a self-supporting specification of the data. Formats397
that are capable of storing a wide variety of data, formats, and metadata generally require398
significant effort to provide this information. Pysat approaches this issue on two fronts.399
Pysat includes metadata by default. Thus, as a routine to create a dataset is written,400
D R A F T April 22, 2018, 5:35pm D R A F T

X - 20 STONEBACK ET AL.: PYSAT
both the data and metadata may be specified naturally. Following best coding practices,401
the data specification work is distributed across the whole development effort.402
When a pysat Instrument object loads data both the instrument data and metadata403
are pulled from the file and attached to the pysat Instrument object. File routines have404
been created to reverse this process and transparently store a pysat object to disk as a405
netCDF. As many different data schemes may be stored within pysat, a translation layer406
has been developed that stores the data in the netCDF in a format intuitive to humans.407
A complementary netCDF load routine is also included with pysat, making it possible408
to recover the original pysat Instrument object state without any additional processing.409
Recovery back to the original pysat object relies upon a variable naming pattern, and410
thus is not guaranteed for non-pysat netCDFs.411
4. Future Possibilities
Pysat provides a systematic and versatile framework for the arbitrary modification and412
analysis of data. A selection of instruments and analyses are included that currently413
reflect the research interests of the authors. The list is not exhaustive. Since instrument414
data types ranging from in situ satellite data, satellite based remote sensing data, and415
ground based data have already been successfully integrated into pysat, a wide range of416
instruments are expected to be supported without significant changes to pysat’s structure.417
With community support, the full range of space science data sets could be available from a418
single, consistent interface. Additional analysis types, such as superposed epoch analysis,419
can also be added to pysat.420
Pysat’s support for test instruments and inclusion of unit testing provides a mechanism421
to validate analysis code. Details of exhaustive test procedures are not typically included422
D R A F T April 22, 2018, 5:35pm D R A F T

STONEBACK ET AL.: PYSAT X - 21
in scientific publications, limiting the ability of the audience to audit the analysis. Adop-423
tion of open source analyses such as pysat by the community provides a verifiable code424
standard that minimizes both the effort required by the author, as well as the innate425
level of trust required by the reader. The sum total of publications based upon pysat426
code provides a heritage base that supports future publications. This can be of particular427
importance for analyses that produce controversial results.428
Pysat’s structure enables a common ground and a single interface for all space science429
data sets. This does not preclude the development and use of instrument specific packages,430
as desired by the community. In these situations pysat can and will make use of the431
instrument specific tools when adding support for that instrument. In most cases, a thin432
translation layer from the native data format to the pandas DataFrame will provide the433
majority of the required functionality. A pair of functions that translate the data back434
and forth between standards would even enable the use of instrument specific processing435
functions from within pysat. While the instrument specific package may be optimal for436
primary instrument users, outside users could utilize the standard interface provided by437
pysat and still benefit from the creation of the instrument specific tools.438
The range of file management features required to support pysat also provide an under-439
lying basis for a CubeSat data processing system. While Explorer-level missions supported440
by NASA typically have enough funds to produce a dedicated software ecosystem to sup-441
port the processing of data, funding levels typically employed for CubeSats are insufficient442
for this level of software development. Pysat provides a foundation for file and data pro-443
cessing management that reduces the workload required to create a system capable of444
delivering upon the science goals of the mission. If leading CubeSat missions are willing445
D R A F T April 22, 2018, 5:35pm D R A F T

X - 22 STONEBACK ET AL.: PYSAT
to use pysat for this purpose as well as contribute code back to the repository, this com-446
munity resource could increase both the dollar and science efficiency of future CubeSat447
missions.448
The functions provided by pysat constitute the underlying functionality needed to drive449
a Graphical User Interface (GUI) for easy visualization of data. In this scenario if a user450
finds something interesting visually and wanted to complete a more rigorous analysis451
the exact same tools would be available at the command line, providing continuity for452
scientific analysis. Given that user interface requirements can differ significantly based453
upon the analysis or instrument type, a range of specialized GUIs all powered by the same454
underlying pysat code would be ideal.455
Functionality provided by pysat also supports the creation of a Constellation object, a456
heterogenous collection of pysat Instrument objects. This abstraction will allow custom457
collections of instruments to be operated upon as a whole. As the processing required458
for each instrument within the constellation could be unique, custom functions may be459
attached to the Constellation object and applied to individual instruments automatically.460
Analysis functions and orbit determination on the constellation level are also planned.461
5. Conclusion
Pysat provides a systematic process for custom analysis of science data sets. The462
pysat Instrument object enables a complex flow for each user request of data, providing463
for an arbitrary relationships between the requested and archived data. This processing464
flow is used to solve problems associated with multiple data sets, data distribution in465
files, accurate time-series calculations, orbit determination, data modification, and the466
calculation of new scientific products. The combination of the pysat Instrument object,467
D R A F T April 22, 2018, 5:35pm D R A F T

STONEBACK ET AL.: PYSAT X - 23
pandas DataFrame, and this computational versatility enables instrument independent468
analysis and simplifies the comparison of results across data sets. These features are469
expected to be sufficient to enable integration of data sets across space science into a470
single common platform.471
The adoption of unit testing across the package provides a verification chain to ensure472
results are robust. Tests are applied to the Instrument object as well as the higher order473
analysis routines (seasonal bin averaging, etc.) The public availability of both the code474
and the tests provides a mechanism for verifiable and reproducible science. Should pysat475
be adopted by the wider community, additional validation is gained as scientists use and476
individually verify the tools as part of their own research. Thus, scientific papers that477
incorporate pysat not only benefit from the heritage established by previous use, each new478
use of pysat also provides validation that the outputs provided by pysat are scientifically479
valid.480
Pysat is being used as a foundational framework for ground station processing of IVM481
measurements for the upcoming ICON and COSMIC-2 missions. While work is still482
underway, pysat has been integrated by both CDAAC and the Berkeley ground software483
system in anticipation of these missions. The data flow generated by these missions will484
provide a strong heritage that future missions and science data analyses can build upon.485
Acknowledgments. Supported by NSF grant 125908 and NASA grant NNX10AT02G.486
The data used in this article may be obtained at:487
CDAWeb: http://cdaweb.gsfc.nasa.gov488
CDF Library: http://cdf.gsfc.nasa.gov.489
CDAAC: http://cosmic-io.cosmic.ucar.edu/cdaac/index.html490
D R A F T April 22, 2018, 5:35pm D R A F T

X - 24 STONEBACK ET AL.: PYSAT
pysat : https://github.com/rstoneback/pysat491
pysatCDF : https://github.com/rstoneback/pysatCDF492
DaViTpy : https://github.com/vtsuperdarn/davitpy493
494
References
Burrell, A., Meeren, C., Laundal, K. (2018, April 5). aacgmv2: v2.4.1 (Version 2.4.1).495
Zenodo. http://doi.org/10.5281/zenodo.1212695496
Burrell, A., Chisham, G.. (2018, February 19). aburrell/ocbpy: Beta Release (Version497
0.2b1). Zenodo. http://doi.org/10.5281/zenodo.1217177498
CEDAR: The New Dimension499
Chisham, G. et al. (2007), A decade of the Super Dual Auroral Radar Network (Super-500
DARN): scientific achievements, new techniques and future directions, Surv. Geophys.,501
28(1), 33?109, doi:10.1007/s10712-007-9017-8.502
(2012) Data and Visualization Toolkit-Python for SuperDARN,503
https://github.com/vtsuperdarn/davitpy504
de La Beaujardire, O. et. al. (2004), C/NOFS: a mission to forecast scintilla-505
tions, Journal of Atmospheric and Solar-Terrestrial Physics ,66(17):1573?1591, doi:506
10.1016/j.jastp.2004.07.030507
Duly, T., et al (2013), PyGlow: Upper atmosphere climatological models in Python,508
https://github.com/timduly4/pyglow509
Gil, Y., et al. (2016), Toward the Geoscience Paper of the Future: Best practices for510
documenting and sharing research from data to software to provenance, Earth and511
D R A F T April 22, 2018, 5:35pm D R A F T

STONEBACK ET AL.: PYSAT X - 25
Space Science, 3, 388?415, doi:10.1002/2015EA000136.512
Greenwald, R. A. et al. (1995), DARN/SUPERDARN, Space Sci Rev, 71(1-4), 761?796,513
doi:10.1007/BF00751350.514
Harter, B. and Liu, M., https://github.com/MAVENSDC/cdflib515
Hunter, J. (2007), Matplotlib: A 2d graphics environment, Computing in Science Engi-516
neering, 9 (3), 90–95, doi:10.1109/MCSE.2007.55.517
Jones, E., T. Oliphant, P. Peterson, et al. (2001–), SciPy: Open source scientific tools for518
Python, [Online; accessed 2016-02-19].519
McKinney, W. (2010), Data structures for statistical computing in python, Proceedings of520
the 9th Python in Science Conference, edited by S. van der Walt and J. Millman, 51 –521
56.522
Meeren, C., Burrell, A. G., and Laundal, K. (2018, April 6). apexpy: ApexPy Version523
1.0.3 (Version 1.0.3). Zenodo. http://doi.org/10.5281/zenodo.1214207524
Morley, S., Welling, D., Koller, J., Larsen, B., Henderson, M., Niehof, J., SpacePy - A525
Python-based Library of Tools for the Space Sciences, Proceedings of the 9th Python in526
Science Conference, edited by S. van der Walt and J. Millman, 39 – 45.527
Prez, F., and B. Granger (2007), iPython: A system for interactive scientific computing,528
Computing in Science Engineering, 9 (3), 21–29, doi:10.1109/MCSE.2007.53.529
Rideout, B. (2004), Open Madrigal Initiative, http://madrigal.haystack.edu/madrigal/madDownload.html530
Stoneback, R. A., R. A. Heelis, A. G. Burrell, W. R. Coley, B. G. Fejer, and E.531
Pacheco (2011), Observations of quiet time vertical ion drift in the equatorial iono-532
sphere during the solar minimum period of 2009, J. Geophys. Res., 116, A12327, doi:533
10.1029/2011JA016712.534
D R A F T April 22, 2018, 5:35pm D R A F T
X - 26 STONEBACK ET AL.: PYSAT
Load Data Clean DataDefault
Instrument Function
Nano-Kernel
Cleaning Level
FilepathsUser’s
Custom Functions
orbit calculator
Instrument Specific Function
pysat Function
pysat Information
Legend
Instrument functions provided by platform_name.py
Pad Data
Remove Pad
Padding Time
.data .meta
3 Day Rolling Data Window
Figure 1. Pysat program flow when an pysat.Instrument.load() routine is called.
Stoneback, R. A. and Heelis, R. A. (2007) Identifying equatorial ionospheric irregularities535
using in situ ion drifts, Ann. Geophys., doi:https://doi.org/10.5194/angeo-32-421-2014.536
Stoneback, R. A. and Depew, M. (2018). rstoneback/pysatCDF: Windows com-537
patibility and improved pysat meta handling (Version 0.3.0). Zenodo. doi:538
http://doi.org/10.5281/zenodo.1217181539
Swoboda, J., Hirsch, M., Stuhlmacher, A., Starr, G., Semeter, J. (2016).540
jswoboda/GeoDataPython: ISR Sim Paper (Version v0.1). Zenodo. doi:541
http://doi.org/10.5281/zenodo.154533542
van der Walt, S., S. Colbert, and G. Varoquaux (2011), The numpy array: A structure543
for efficient numerical computation, Computing in Science Engineering, 13 (2), 22–30,544
doi:10.1109/MCSE.2011.37.545
Yue, X., W. S. Schreiner, J. Lei, S. V. Sokolovskiy, C. Rocken, D. C. Hunt, and Y.-H. Kuo546
(2010), Error analysis of Abel retrieved electron density profiles from radio occultation547
measurements, Annales Geophysicae, 28(1), 217?222.548
D R A F T April 22, 2018, 5:35pm D R A F T

STONEBACK ET AL.: PYSAT X - 27
Figure 2. Sample orbit figure using VEFI data, where the interp flag reflects times when
spacecraft operations could interfere with measurements.
D R A F T April 22, 2018, 5:35pm D R A F T

X - 28 STONEBACK ET AL.: PYSAT
Figure 3. Seasonal occurrence probability demo using VEFI data. The location of the magnetic
equator may be seen in the lower data counts for the data distribution.
D R A F T April 22, 2018, 5:35pm D R A F T

STONEBACK ET AL.: PYSAT X - 29
Figure 4. Comparison of seasonal averages of IVM meridional ion drifts (top) and averages of
COSMIC profiles covering NmF2, hmF2, and topside scale height.
D R A F T April 22, 2018, 5:35pm D R A F T

X - 30 STONEBACK ET AL.: PYSAT
Figure 5. Seasonal average of COSMIC electron density profiles.
D R A F T April 22, 2018, 5:35pm D R A F T