Embed Size (px)
Citation preview

Jakkamsetti et al., Sci. Transl. Med. 11, eaan0457 (2019) 20 February 2019
S C I E N C E T R A N S L A T I O N A L M E D I C I N E | R E S E A R C H A R T I C L E
1 of 16
P Y R U V A T E D E H Y D R O G E N A S E D E F I C I E N C Y
Brain metabolism modulates neuronal excitability in a mouse model of pyruvate dehydrogenase deficiencyVikram Jakkamsetti1,2*, Isaac Marin-Valencia1,2,3*, Qian Ma1,2*, Levi B. Good1,2†, Tyler Terrill1,2, Karthik Rajasekaran1,2, Kumar Pichumani4‡, Chalermchai Khemtong4,5, M. Ali Hooshyar6, Chandrasekhar Sundarrajan1,2, Mulchand S. Patel7, Robert M. Bachoo2,8, Craig R. Malloy4,5,8, Juan M. Pascual1,2,9,10,11§
Glucose is the ultimate substrate for most brain activities that use carbon, including synthesis of the neurotransmitters glutamate and aminobutyric acid via mitochondrial tricarboxylic acid (TCA) cycle. Brain metabolism and neuronal excitability are thus interdependent. However, the principles that govern their relationship are not always intuitive because heritable defects of brain glucose metabolism are associated with the paradoxical coexistence, in the same individual, of episodic neuronal hyperexcitation (seizures) with reduced basal cerebral electrical activity. One such prototypic disorder is pyruvate dehydrogenase (PDH) deficiency (PDHD). PDH is central to metabolism because it steers most of the glucosederived flux into the TCA cycle. To better understand the pathophysiology of PDHD, we generated mice with brainspecific reduced PDH activity that paralleled salient human disease features, including cerebral hypotrophy, decreased amplitude electroencephalogram (EEG), and epilepsy. The mice exhibited reductions in cerebral TCA cycle flux, glutamate content, spontaneous, and electrically evoked in vivo cortical field potentials and gamma EEG oscillation amplitude. Episodic decreases in gamma oscillations preceded most epileptiform discharges, facilitating their prediction. Fastspiking neuron excitability was decreased in brain slices, contributing to in vivo action potential burst prolongation after whisker pad stimulation. These features were partially reversed after systemic administration of acetate, which augmented cerebral TCA cycle flux, glutamatedependent synaptic transmission, inhibition and gamma oscillations, and reduced epileptiform discharge duration. Thus, our results suggest that dysfunctional excitability in PDHD is consequent to reduced oxidative flux, which leads to decreased neuronal activation and impaired inhibition, and can be mitigated by an alternative metabolic substrate.
INTRODUCTIONThe mammalian brain avidly consumes glucose (1). Most of this glucose serves as a carbon and energy source for neural excitation via oxidation in the mitochondrial tricarboxylic acid (TCA) cycle (fig. S1A) (2). Before entry into the cycle, glucose-derived pyruvate must be transformed into acetyl coenzyme A (acetyl-CoA) in a re-action catalyzed by the mitochondrial enzyme pyruvate dehydro-genase (PDH) (3). This reaction is ubiquitous in almost all tissues, but in the brain, metabolism of acetyl-CoA by the TCA cycle yields the neurotransmitters glutamate and -aminobutyric acid (GABA) as
additional byproducts, sustaining and balancing most synaptic ac-tivity (4). As expected from the centrality of this process, disorders of brain glucose metabolism are associated with disrupted excitabil-ity. Clinical manifestations include decreased cerebral cortical ac-tivity [reduced background activity in the electroencephalogram (EEG)] interrupted by paroxysms of hyperexcitability (seizures) (5). A glucose oxidation disorder that exemplifies these characteristics is PDH deficiency (PDHD) (6). PDH is a multisubunit complex. Although genetically heterogeneous, most patients with PDHD harbor deleterious mutations in the PDH -subunit gene (PDHA1), which are transmissible in an X-linked fashion (6). From a clinical perspective, PDHD is predominantly an encephalopathy that usually manifests at birth or early infancy as intractable epilepsy with a re-duced amplitude basal EEG in the setting of cerebral hypotrophy and neurobehavioral arrest or maldevelopment (6). However, despite these well-established aspects, how impaired glucose oxidation leads to the divergent phenomena of generally decreased excitation to-gether with sporadically increased excitability is mostly unknown. Furthermore, whether this abnormal excitability primarily results from structural brain abnormalities (not only principally global hy-potrophy but also white matter or basal ganglia lesions in a form of the disease termed Leigh syndrome) or from a functional (metabolic or excitability) deficit is also not completely understood. Studies in wild-type rodent brain slices revealed a robust link between mito-chondrial metabolism and the activity of parvalbumin-positive fast-spiking inhibitory interneurons located in the cerebral cortex, suggesting that some neurons are particularly susceptible to meta-bolic failure that can result in disinhibition (7). However, further in-sights into disorders such as PDHD have been very limited, in part,
1Rare Brain Disorders Program, University of Texas Southwestern Medical Center, Dallas, TX 75390, USA. 2Department of Neurology and Neurotherapeutics, Univer-sity of Texas Southwestern Medical Center, Dallas, TX 75390, USA. 3Laboratory of Developmental Neurobiology, The Rockefeller University, New York, NY 10065, USA. 4Advanced Imaging Research Center, University of Texas Southwestern Med-ical Center, Dallas, TX 75390, USA. 5Department of Radiology, University of Texas Southwestern Medical Center, Dallas, TX 75390, USA. 6Department of Mathematical Sciences, The University of Texas at Dallas, Richardson, TX 75080, USA. 7Depart-ment of Biochemistry, SUNY Buffalo, Buffalo, NY 14203, USA. 8Department of Inter-nal Medicine, University of Texas Southwestern Medical Center, Dallas, TX 75390, USA. 9Department of Physiology, University of Texas Southwestern Medical Center, Dallas, TX 75390, USA. 10Department of Pediatrics, University of Texas Southwestern Medical Center, Dallas, TX 75390, USA. 11Eugene McDermott Center for Human Growth & Development / Center for Human Genetics, University of Texas South-western Medical Center, Dallas, TX 75390, USA.*These authors contributed equally to this work.†Present address: Department of Biomedical Engineering, Louisiana Tech University, Ruston, LA 71272, USA.‡Present address: Department of Neurosurgery, Houston Methodist Hospital and Research Institute, Houston, Houston, TX 77030, USA.§Corresponding author. Email: [email protected]
Copyright © 2019 The Authors, some rights reserved; exclusive licensee American Association for the Advancement of Science. No claim to original U.S. Government Works
by guest on May 12, 2020
http://stm.sciencem
ag.org/D
ownloaded from

Jakkamsetti et al., Sci. Transl. Med. 11, eaan0457 (2019) 20 February 2019
S C I E N C E T R A N S L A T I O N A L M E D I C I N E | R E S E A R C H A R T I C L E
2 of 16
due to a paucity of animal models and of methodology for the inves-tigation of metabolic and electrophysiological activities, which are not well recapitulated in simple organisms or in vitro. Thus, we set out to elucidate the mechanistic link between impaired glucose oxidation and aberrant neurophysiology in PDHD by circumvent-ing some of these limitations in the mouse while making correlative observations in patients where possible.
To this effect, we generated a brain-specific Pdha1 knockdown mouse model (PDHD) driven by a human glial fibrillary acidic protein–Cre recombinase (hGFAP-Cre) promoter that took advan-tage of another mouse with loxP sites flanking exon 8 of Pdha1 (8). The promoter selection aimed to selectively induce reduced PDH activity in neurons and astrocytes (9). These PDHD mice exhibited decreased cerebral glutamate concentration but normal GABA con-tent. EEG recordings from the mice and patients with PDHD con-firmed globally decreased basal electrical activity. In brain slices that included PDHD mouse somatosensory cortex, the excitability of fast- spiking neurons was reduced, permitting the occurrence of un-checked, repetitive excitatory discharges. This provided the ratio-nale for analyzing EEG spectral properties in mice and patients with PDHD, which revealed that epileptiform events were preceded by a brief decrease in gamma oscillation amplitude, which, together with concurrent cortical hypoactivation, facilitated their predic-tion minutes before they occurred. To address the reversibility of these findings, we aimed to fuel the TCA cycle downstream of PDH by systemically administering acetate. Acetate is metabolized by acetyl-CoA synthetase to form acetyl-CoA, which enters the brain TCA cycle within minutes of an intraperitoneal injection (10). After acetate administration, glutamatergic synaptic transmission and gamma oscillations were enhanced, in conjunction with an attenuation of fast-spike (FS) neuron dysfunction and a reduction in epilepti-form discharge duration. These findings indicate that the dysfunc-tional excitability characteristic of PDHD reflects, at least in part, a functional deficit of glutamatergic neurotransmission and impaired inhibition that might be mitigated by acetate.
RESULTSGlutamate content is reduced in the PDHD mouseTo minimize the impact of global somatic metabolic dysfunction on the brain, we generated brain-specific Pdha1-deficient mice using hGFAP-Cre as promoter. As expected from the X linkage of the hu-man disease, PDHD was lethal in male mice, with maximum survival at postnatal day 28 (P28) (fig. S1B). Thus, we studied P16 to P25 male mice. The selective targeting of brain Pdha1 was confirmed by poly-merase chain reaction (PCR) of brain, liver, heart, and skeletal muscle genomic DNA (Fig. 1A). The fluorescence intensity of a Pdha1 exon 8 DNA fragment [800 base pairs (bp)] from PDHD mouse brain was 0.06 ± 0.02 of control (n = 4, P < 0.0001, one-sample t test). The expression of Pdha1 was reduced by 51% in PDHD cortex compared to control (Fig. 1B) and decreased by 61 and 38% in neurons and astrocytes, respectively (fig. S2, A to E). This decreased expression correlated with a reduced activity of the PDH complex in the PDHD mouse brain, which exhibited a residual active (de-phosphorylated) activity of 55% and a total (active dephosphorylated and inactive phospho rylated) activity of 32% relative to control (Fig. 1C). These values approximate those often found in tissues from patients with more severe disease (11). As also described in affected individuals, PDHD mice manifested failure to thrive (fig. S3,
A and B) microencephaly (fig. S3C), cortical atrophy, and hypo-plasia of the corpus callosum (fig. S3, D to F).
To characterize brain metabolism in PDHD, we first determined the abundance of several substrates and byproducts relevant to glu-cose oxidation by mass spectrometry. Similar to a common finding in the cerebrospinal fluid of patients with PDHD (12), the metabo-lite alanine, which is upstream the PDH reaction, was more abundant in the PDHD mouse brain compared to control animals, although lactate was not elevated (Fig. 1D). With respect to metabolites down-stream of PDH, PDHD was characterized by reduced brain glutamate (Fig. 1D). The concentration of additional metabolites such as the amino acids glutamine and GABA, TCA cycle intermediates, and CoA derivatives was preserved in the PDHD mouse brain, indicating that glutamate metabolism is predominantly affected in the disease (Fig. 1D). These values, obtained from whole-brain samples, were unlikely to be influenced by systemic metabolic dysfunction because plasma glucose and lactate concentrations were similar in control and PDHD mice, as expected from the selective brain targeting of the mutation (table S1). As further discussed below, only plasma aceto-acetate, a ketone body, was increased in PDHD, whereas no differ-ence was observed in -hydroxybutyrate or acetate. Given the marked reduction in PDH activity accomplished in the model and the func-tion of this essential enzyme, these results suggest that the PDHD brain may have expanded substrate utilization beyond glucose, suc-cessfully preserving downstream metabolism except for glutamate.
Glucose metabolism is impaired in PDHD cortexTo further study glucose oxidation and related TCA cycle flux in PDHD, we performed 13C nuclear magnetic resonance (NMR) spec-troscopy in flash-frozen brain samples after 13C substrate infusions in otherwise undisturbed mice (13). [U-13C]glucose was administered intraperitoneally (2 mg/g of body weight) to awake animals after a 5-hour fast, and brain and blood samples were obtained 1 hour later. Plasma [U-13C]glucose enrichment was similar in both groups (en-richment fraction: control, 45.8 ± 1.8%; PDHD, 50 ± 1.6%; P > 0.05, unpaired two-tailed Student’s t test; fig. S4A), whereas glucose con-centration was greater in PDHD (enrichment fraction: control, 9.2 ± 0.7 mM; PDHD, 15.7 ± 1.8 mM; P < 0.01, unpaired two-tailed Student’s t test; fig. S4A). NMR spectra from cerebral cortex sam-ples revealed increased abundance of 13C metabolites upstream of PDH such as lactate and alanine in PDHD (LAC3 and ALA3 in Fig. 2A) compatible with their increased 13C enrichment or concen-tration compared to control (Fig. 2B). In contrast, the downstream metabolite 13C-glutamate displayed low abundance, which may analogously stem from decreased total glutamate concentration or from diminished 13C enrichment (Fig. 2B, right) secondary to heightened unlabeled substrate utilization. In agreement with the latter, [1,2-13C]acetyl-CoA enrichment was about 40% reduced in the PDHD cortex (P < 0.01) (Fig. 2B, left), which, in the context of the similar plasma [U-13C]glucose enrichment measured in PDHD and control, suggests that unlabeled substrates were avidly metabolized by the PDHD cortex independently of PDH (fig. S4B).
Isotopomer analysis of cortex glutamate C4, glutamine C4, and GABA C2 expanded these findings (Fig. 2C and table S2). In control tissue, these isotopomers displayed increased resonance quartets (Q) relative to spectral doublets (D45 for glutamate and glutamine C4 and D12 for GABA C2) compared to PDHD, as reflected in a lower control doublet/quartet ratio. This implies that both TCA cycle flux and the synthetic rate of glucose-derived glutamate, glutamine, and
by guest on May 12, 2020
http://stm.sciencem
ag.org/D
ownloaded from

Jakkamsetti et al., Sci. Transl. Med. 11, eaan0457 (2019) 20 February 2019
S C I E N C E T R A N S L A T I O N A L M E D I C I N E | R E S E A R C H A R T I C L E
3 of 16
GABA were decreased in PDHD because the generation of a spec-tral quartet requires two or more sequential TCA cycles, whereas the spectral doublet is generated in the first cycle completed (13). Furthermore, the [U-13C]glucose-derived spectral doublets (D45 for glutamate and glutamine C4 and D12 for GABA C2) were greater in PDHD (Fig. 2C), suggesting that any available glucose-derived acetyl-CoA was effectively metabolized by the TCA cycle. In addition, low-abundance spectral multiplets such as singlets (S) and doublet D34 likely arose from naturally abundant 13C-containing molecules or from multiple cycles of the tracer through the TCA cycle, respec-
tively (table S2). Because glucose-derived glutamate and GABA are primarily synthesized by neurons and glucose-derived glutamine is generated in astrocytes (13–15), these results also suggest that glu-cose oxidation by both putative neuronal and astrocyte TCA cycles was reduced.
Acetate is a preferred substrate over glucose in the PDHD brainThe reduced enrichment of 13C–acetyl-CoA derived from [U-13C]glucose in the PDHD mouse cortex suggested that alternative (nonlabeled)
***
**
43
42
Cortex
Contro
l
PDHD
1.5
0.0
0.5
1.0
Contro
l
PDHD
Control
0
5
10
15 ***
Glutamate0
2
4
Glutamine0
1
2
3
4
5
GABA0.00
0.05
0.10
0.15 ***
0.00
0.05
0.10
Citrate
0.0
0.1
0.2
0.3
0.4
0.00
0.02
0.04
0.06
0.00
0.05
0.10
0.15
0.20
Alanine
Succinate
FumarateMalate
0
2
4
6
8
10
Acetyl-CoA0
1
2
3
4
5
Succinyl-CoA0
1
2
3
4
Malonyl-CoA0.00
0.05
0.10
0.15
Propionyl-CoA
0.15
PDHD-Cre+ Control-Cre–
B L H M + +/– – B L H M
800
700
400
350
B C
D
µmol
/g
nmol
/g
A
µmol
/g
0
1
2
3
4
5
Lactate
PDHDCon
trol
PDHD
Pdha1
Cre
Pdha
1β-
Act
in
Control PDHD
PDH
/β-a
ctin
2.0
1.5
1.0
0.5
0.0Ac
tive
PDH
(mU
/mg
of p
rote
in)
0.20
0.15
0.10
0.05
0.00
0.25
Tota
l PD
H
(mU
/mg
of p
rote
in)
Fig. 1. Characterization of the PDHD mouse. (A) Genotyping of the Pdha1 locus in brain (B), liver (L), heart (H), and skeletal muscle (M) of male offspring produced from mating a Pdha1flox8/flox8 female with an hGFAP-Cre male. Top gel: Genotyping of wild-type (WT; 700 bp), floxed (800 bp), and null (400 bp) allele of Pdha1. Bottom gel: PCR of Cre transgene (350 bp). +, +/−, and − represent Pdha1flox8/flox8, Pdha1flox8/wt, and Pdha1wt/wt, respectively. (B) Qualitative and quantitative expression of Pdha1 in cortex of PDHD and control males by Western blotting (n = 4 mice per group). (C) Active and total PDH enzymatic activity in brain of PDHD and control males (n = 8 mice per group). (D) Concentration of metabolites in forebrain from both mouse groups (n = 6 mice per group) determined by gas chromatography–mass spectrometry (GC-MS). Data represent means ± SEM. Statistical differences were determined using two-tailed Student’s t test. *P < 0.05, **P < 0.01, and ***P < 0.001.
by guest on May 12, 2020
http://stm.sciencem
ag.org/D
ownloaded from

Jakkamsetti et al., Sci. Transl. Med. 11, eaan0457 (2019) 20 February 2019
S C I E N C E T R A N S L A T I O N A L M E D I C I N E | R E S E A R C H A R T I C L E
4 of 16
substrates might be robustly metabolized independently of PDH. Thus, [1,2-13C]acetate (an immediate precursor of acetyl-CoA that bypasses PDH) and [1,6-13C]glucose were coinjected to illustrate not only substrate preference but also the putative metabolic compart-ment (or cell type: neuron or astrocyte) where oxidation occurred. The rationale was that these substrates are differentially oxidized across compartments: Neurons preferentially oxidize glucose (16), whereas astrocytes metabolize both acetate and glucose (17). Oxida-tion of [1,2-13C]acetate and [1,6-13C]glucose gives rise to differen-tially labeled acetyl-CoA molecules: [1,2-13C]acetate to [1,2-13C]acetyl-CoA and [1,6-13C]glucose to [2-13C]acetyl-CoA (15). Then, in the course of the TCA cycle, carbon 2 of acetyl-CoA transitions to carbon 4 of glutamate and glutamine. Consequently, C4 gluta-mate and C4 glutamine spectra can report this aspect of metabolic compartmentalization.
Analogous to [U-13C]glucose injections, [1,2-13C]acetate and [1,6-13C]glucose were administered intraperitoneally at the same dose (2 mg/g of body weight) to awake mice after a 5-hour fast,
followed by collection of cortex and blood samples 1 hour later. The plasma concentration of glucose and acetate was similar in both groups [glucose: 13.1 ± 2.2 mM (control) and 18.5 ± 2.5 mM (PDHD); ace-tate: 1.1 ± 0.1 mM (control) and 2.5 ± 1.2 mM (PDHD); P > 0.05, unpaired two-tailed Student’s t test; table S7, sheet “Related_to_Fig. 3_in_text”]. Plasma glucose enrichment was also similar [28.1 ± 1% (control) and 30.7 ± 1.2% (PDHD); P > 0.05, unpaired two-tailed Student’s t test; table S7, sheet “Related_to_Fig. 3_in_text”). In contrast with [U-13C]glucose injections, lactate and alanine reso-nance amplitudes (LAC3 and ALA3 in Fig. 3A) were similar in PDHD cortex spectra. Lactate concentration in the PDHD cortex decreased from 5.55 ± 0.28 mol/g after [U-13C]glucose administration (Fig. 2B) to 3.97 ± 0.27 mol/g after [1,2-13C]acetate and [1,6-13C]glucose in-jection (P < 0.01, unpaired two-tailed Student’s t test) (Fig. 3B). Alanine decreased from 2.26 ± 0.19 mol/g (Fig. 2B) to 0.99 ± 0.09 mol/g (Fig. 3B) (P < 0.001, unpaired two-tailed Student’s t test). In con-trast, the administration of [1,6-13C]glucose and [1,2-13C]acetate to control did not result in a change in lactate or alanine levels relative
BA
Fasting
0 (hours) 5
[U-13C]gluc (2 mg/g)
1 (hour)Sac Cortex
Taurine C1 GAB
A2
ASP3
GLN
2
55 50 45 40 35 30 25 20ppm
Control
GLU
2
ASP2 G
ABA4
GLU
4
GLN
4
GLU
3G
LN3
GAB
A3
NAA
3
LAC
3
ALA3
C
PDHD
LAC
3
Taurine C1
GAB
A2
ASP3GLN
2G
LU2
ASP2
GAB
A4
GLU
4
GLN
4
GLU
3G
LN3
GAB
A3
NAA
3
ALA3
ALA2
****
0
20
40
60
Lactate Alanine
[1,2-13C]Ac-CoA
**
*2
4
6
8
10
LactateAlanine
Glutamate0
*
*
Q0.0
0.2
0.4
0.6
0.8
1.0 GABA C2
Frac
tiona
l am
ount
**
**
Q0.0
0.2
0.4
0.6
0.8
1.0 Glutamate C4
Frac
tiona
l am
ount
13C
enr
ich
(%)
µmol
/g o
f bra
in
Control
PDHD
Control
PDHD
****
**
0
2
4
6
Rat
io (D
/Q)
D45 Q
**
**
0.0
0.2
0.4
0.6
0.8
1.0 Glutamine C4
Frac
tiona
l am
ount
55 50 45 40 35 30 25 20ppm
D45
D12 GLU GLN GABA
Fig. 2. Metabolism of [U-13C]glucose in the cerebral cortex. (A) 13C NMR spectrum of control and PDHD mouse cortex (control, n = 7; PDHD, n = 5). For comparison, the height of taurine C1 spectrum was equalized in both spectra because taurine is not enriched by 13C-glucose and its concentra-tion was not different between groups (control, 16.35 ± 0.51 mol/g of brain; PDHD, 14.16 ± 1.06 mol/g of brain). (B) 13C enrichment and concentration
of metabolites in control and PDHD cortex estimated by 1H NMR spectroscopy in all the samples in (A) (control, n = 7; PDHD, n = 5). (C) Isotopomer analysis of glutamate C4, glutamine C4, and GABA C2 in PDHD and control cortex using the spectra from all the samples in (A) (control, n = 7; PDHD, n = 5). GLU, glutamate; GLN, glutamine; ASP, aspartate; ALA, alanine; NAA, N-acetylaspartate; LAC, lactate; Ac-CoA, acetyl-CoA. C#, carbon labeled in position. These abbreviations also apply to Fig. 3. Data indicate mean ± SEM. Differences were determined by a two-tailed Student’s t test. *P < 0.05; **P < 0.01; ***P < 0.001.
by guest on May 12, 2020
http://stm.sciencem
ag.org/D
ownloaded from

Jakkamsetti et al., Sci. Transl. Med. 11, eaan0457 (2019) 20 February 2019
S C I E N C E T R A N S L A T I O N A L M E D I C I N E | R E S E A R C H A R T I C L E
5 of 16
to [U-13C]glucose administration [lactate, 4.77 ± 0.29 mol/g and 3.95 ± 0.3 mol/g, respectively; alanine, 0.67 ± 0.04 mol/g and 0.56 ± 0.04 mol/g, respectively; P > 0.05, unpaired two-tailed Student’s t test) (Figs. 2B and 3B). Overall, these data indicate that acetate spares glucose utilization by the PDHD brain, resulting in reduced accumulation of lactate and alanine.
Isotopomer analysis of glutamate and glutamine C4 shed further light into these results. In control, their spectra were dominated by multiplets derived from [1,6-13C]glucose [singlet (S) and doublet D34], whereas in PDHD, multiplets arising from [1,2-13C]acetate metabolism [doublet D45 and quartet (Q)] were more prominent (fig. S4C and table S3). This further suggests that, in contrast with control, the PDHD brain preferentially consumes acetate relative to glucose (Fig. 3C). This was also reflected in the 13C labeling of acetyl- CoA. Whereas enrichment of metabolites upstream from PDH (lac-tate and alanine) was similar between PDHD and control (Fig. 3B), PDHD cortex samples exhibited greater enrichment of [1,2-13C]acetyl- CoA (derived from [1,2-13C]acetate), whereas control sam-ples displayed higher enrichment of [2-13C]acetyl-CoA (derived from
[1,6-13C]glucose) (Fig. 3B and fig. S4C). Despite this avid oxidation of acetate by the PDHD brain, the concentration of glutamate mea-sured by 1H NMR after administration of [1,2-13C]acetate and [1,6-13C]glucose to PDHD did not significantly change relative to that after [U-13C]glucose injection (7.01 ± 0.24 mol/g and 6.59 ± 0.39 mol/g, respectively; P > 0.05, unpaired two-tailed Student’s t test), remaining lower than in control (Figs. 2B and 3B).
We next quantitatively estimated acetate oxidation relative to glucose oxidation using the glutamate and glutamine spectra obtained after administration of [1,2-13C]acetate and [1,6-13C]glucose. Two- compartment metabolic models are useful for such a computation. The models conventionally describe metabolism in terms of puta-tive neuron and astrocyte compartments based on enzymatic studies (15, 18). To this effect, we carried out an isotopomer analysis of glu-tamate and glutamine C4 (Fig. 3C) to calculate the acetate:glucose oxidative ratio from single 13C NMR spectra (Fig. 3B) in the putative astrocyte compartment, which is where acetate is metabolized (18). The acetate:glucose oxidative ratio in PDHD was close to four, in contrast to control, where it approached unity (Fig. 3D and table S4).
***
**
***
***
Fasting
0 (hours) 5
[1,2-13C]acet + [1,6-13C]gluc
1 (hour)Sac Cortex
D
CA
B
55 50 45 40 35 30 25 20
55 50 45 40 35 30 25 20
Taurine C1
GA
BA
2
AS
P3
AS
P2
GLU
2G
LN2
GLN
3
GA
BA
3
NA
A3G
AB
A4
GLU
4
GLN
4
GLU
3
LAC
3
ALA
3
Taurine C1
GA
BA
2
AS
P3
AS
P2
GLU
2G
LN2
GLN
3
GA
BA
3
NA
A3
GA
BA
4
GLU
4
GLN
4
GLU
3
LAC
3
ALA
3
Control
PDHD
31.5 31.5
Q D45 D34
0.8
Glutamate C4
Control
PDHD
***
******
Glutamine C4
***
******
D34 D34
D45 D45
[1,6-13C]glucose
[1,2-13C]acetate
34.034.5
Q Q
Q
D45D45
S
Q Q
D34 D
34
Q
34.034.5
Frac
tiona
l am
ount
Frac
tiona
l am
ount
ppm
ppm
Control PDHD
***
13C
enr
ich(
%)
Ace
tate
/glu
cose
µmol
/g
0
10
20
30
40
1
2
3
4
5
0
2
4
6
8
10
0
Glutamate C4
Glutamine C4
Control
PDHD
Q
D45
S
S
Q
D34
Q Q
D45
SQ Q
D34
Lactate Alanine[2-13C]Ac-CoA
ControlPDHDLactate Alanine
Glutamate
Control PDHD
[1,2-13C]Ac-CoA
0.6
0.4
0.2
0
0.8
0.6
0.4
0.2
0Q D45 D34
Fig. 3. Metabolism of [1,6-13C]glucose and [1,2-13C]acetate in the cerebral cortex. (A) Representative 13C NMR spectra of control and PDHD mouse cortex (n = 10). The blue and red bands represent the expanded regions shown (D). For illustra-tion purposes, the amplitude of taurine C1 was equated in both spectra because taurine is not enriched by neither 13C-acetate ([1,2-13C]acet) nor 13C-glucose ([1,6-13C]gluc), and its concentra-
tion was not different between groups (control, 15.3 ± 0.5 mol/g of brain; PDHD, 16.4 ± 0.6 mol/g of brain). (B) 13C metabolite enrichment and concentration in cortex from PDHD and control (n = 10 in each group). (C) 13C NMR spectra and isotopomer analysis of glutamate C4 and glutamine C4 in PDHD and control. (D) Acetate:glucose oxidative ratio in cortex from PDHD and control mice. Values indicate means ± SEM. Differences were determined with a two-tailed Student’s t test. **P < 0.01 and ***P < 0.001.
by guest on May 12, 2020
http://stm.sciencem
ag.org/D
ownloaded from

Jakkamsetti et al., Sci. Transl. Med. 11, eaan0457 (2019) 20 February 2019
S C I E N C E T R A N S L A T I O N A L M E D I C I N E | R E S E A R C H A R T I C L E
6 of 16
This also supports the notion that alternative substrates such as acetate are vigorously oxidized by the PDHD brain downstream of PDH, sup-porting TCA cycle flux in the context of impaired glucose oxidation.
EEG oscillation amplitude is reduced in human PDHDGiven the previous findings affecting neurotransmitter metabolism, we characterized cortical activation, a correlate of which is the EEG, a global record of cerebral cortical electrical activity. Synchronous cortical synaptic activity is the primary EEG generator (19). Sponta-neous voltage oscillations are a prominent feature of the EEG and reflect the summation of alternating depolarization and hyperpolar-ization of postsynaptic dendrites, which is primarily driven by glu-tamatergic activation (leading to cation influx into the cell) and its return current (caused by compensatory opposite-polarity passive ion flux) (19). Thus, decreased glutamate in PDHD may lead to im-paired cortical activation manifest as reduced amplitude EEG oscil-
lations. To examine this possibility, we used EEG from patients with PDHD and age-matched healthy controls (fig. S5A). The amplitude of EEG oscillations (represented as EEG power) was reduced in three of five genetically confirmed patients with PDHD (Fig. 4, A and B, and fig. S5, B to D). Control subjects, but not patients with PDHD, displayed robust 10- to 15-Hz and 25- to 30-Hz oscillations (arrows in Fig. 4B and fig. S5B and analysis in fig. S5, C and D) (20, 21). Co-herence, or synchrony of the EEG waveform recorded between elec-trodes symmetrically positioned from both hemispheres (22), was decreased in patients with PDHD for lower-frequency oscillations (1 to 25 Hz) but not for higher-frequency oscillations (25 to 50 Hz) (Fig. 4B and fig. S5, B to D), suggesting a possible reduction of func-tional connectivity across the brain. In one patient with PDHD, EEG power and coherence were lower across all EEG electrodes rel-ative to a control subject for all oscillation frequencies (fig. S6). Fur-thermore, oscillation epoch periodicity, reflective of cortical electrical
C3 C4
C4
C3PDHD patient EEG
Control human EEG
C4
C3
A B
PDHD mouse LFP
Control mouse LFPLayer
2/3
4/5
2/3
4/5
C
2/3
4/5
Frequency (Hz)4 7 14 30 50
0.1
100
1
Control
PDHD
1
10
D
Frequency (Hz)4 7 14 30 50
0.1
100
1
1
10
4 7 14 30 500
1
1
Coh
eren
ce
Frequency (Hz)
0.4
0.2
0.6
0.8
0
5
10
15
20
0
1
2
3
4
5 * *
0
1
2
0.0
0.5
1.0
1.5 * ***
0.0
0.4
0.8
Pow
er (µ
V2 /
Hz)
DeltaTheta
AlphaBeta Low
gamma
0.0
0.5
1.0
1.5
2.0
0.0
0.4
0.8 *
0
1
2
3 ***
0
5
10
20
25
15
*
0
2
4
5
1
3
DeltaTheta
AlphaBeta Low
gamma
** ** *
0
0.4
0.8
0
0.2
0.4
0.6
Coh
eren
ce
**
0
0.2
0.4
0.6
0
0.4
0.6
0.2
0.0
0.4
0.8
0.6
0.2
DeltaTheta
AlphaBeta Low
gamma
Cortex layer 4/5 Coherence
between cortex layers
Cortex layer 2/3
LFP
pow
er (µ
V2 /
Hz)
500 10 20 30 400
1
0.8
0.6
0.4
0.2
4 7 15 30 501 4 7 15 30 5010.1
1
10
0.1
1
10
EEG power at C4 Coherence
between C3 and C4
EEG power at C3
EE
G p
ower
(µV
2 /H
z)
Coh
eren
ce
III
I, II
VI
III
I
VI
II
III
III
VI
Frequency (Hz) Frequency (Hz) Frequency (Hz)
EEG from < 5-month-old subjects
Hz
Oscillationepoch
periodicityII,IIII
VI
0 50
0.04
0
E
Fig. 4. Spontaneous cortical electrical activity in human and mouse PDHD. (A) Top: Location of human EEG electrodes. Middle and bottom: Recordings (band-pass filtered 20 to 50 Hz) from a 16-week-old healthy infant control (control human EEG) and a 10-week-old patient with PDHD (PDHD patient EEG). Scale bar, 50 ms/10 V. (B) Human EEG power spectra and coherence in patients with PDHD (patients >5 months old are depicted in fig. S5B). Black arrows indicate peaks in EEG power spectra in a control subject. Roman numerals refer to human subject indexed in fig. S5A. Inset: Periodicity of epochs/bursts of mid- and high-frequency oscillations in a control (blue) and in patients with PDHD (additional details are in fig. S7, A to C). (C) Top: In vivo spontaneous local field potential (LFP) recorded in the mouse somatosensory cortex. Middle and bottom: Example recordings (band-pass filtered 10 to 50 Hz). Scale bar, 25 ms/200 V. (D) Top: Average LFP power (thick line) in PDHD (n = 13 sites, 13 mice) compared to littermate controls (n = 10 sites, 10 mice). Flanking thinner lines reflect SEM. Bottom: Average power spectra within each frequency band. The lower-upper limits of each frequency band are shown in the x axis of the power-frequency graph above. (E) Coherence between recordings in layers 2/3 and 4/5 in PDHD (n = 13 sites, 13 mice) compared to control (n = 10 sites, 10 mice). Data indicate means ± SEM. Statistical differences were determined using two-tailed Student’s t test and Mann-Whitney U test. *P < 0.05, **P < 0.01, and ***P < 0.001.
by guest on May 12, 2020
http://stm.sciencem
ag.org/D
ownloaded from
Jakkamsetti et al., Sci. Transl. Med. 11, eaan0457 (2019) 20 February 2019
S C I E N C E T R A N S L A T I O N A L M E D I C I N E | R E S E A R C H A R T I C L E
7 of 16
fluctuations (23, 24), was absent in the patients [Fig. 4B (inset) and fig. S7, A to C]. Thus, patients with PDHD present alterations in brain connectivity at multiple frequencies that may reflect decreased neu-ronal activation (23, 24).
In vivo cortical activation and gamma oscillations are decreased in the PDHD mouseWe next used a depth extracellular laminar electrode array to record spontaneous and evoked in vivo activity in the mouse somatosensory cortex to shed light on the reduced EEG power and coherence iden-tified in PDHD (Fig. 4C). We focused on layers 2/3 and 4/5 of the barrel cortex because they participate in whisker somatosensation and are well suited for the investigation of excitability after metabolic or synaptic manipulation (25, 26). Efferent thalamic somatosensory input to cortical layer 4 is modulated by inhibitory synapses that constrict the receptor field of each barrel (27). Signals also propagate to layers 2/3, which are similarly endowed with robust inhibitory neurons. The integrity of this cortical inhibition is reflected in a spontaneous 40-Hz LFP oscillation that is particularly dependent on energy metabolism (7) and on the synaptic connectivity between excitatory and inhibitory neurons (28). Before recording EEG activity, we histologically confirmed the preservation of a cortical laminar structure in PDHD and verified dendritic arborization in all layers
using microtubule-associated protein 2 staining (fig. S8A). Elec-trode placement was confirmed by electrolytic lesion after recording (fig. S8A).
Cortical LFPs arise from summed dendritic input consequent to synaptic activation (19), and their oscillatory patterns covary with the EEG, reflecting alternating depolarizing and hyperpolarizing synaptic activity (19). The amplitude of synaptic activation in PDHD (reflected in power spectral density) was reduced for theta, alpha, and gamma oscillatory frequency bands in layers 2/3 and 4/5, with ab-sence of the normally prominent gamma oscillation at 40 Hz (Fig. 4D). Functional connectivity (reflected in coherence) was also reduced between layers 2/3 and 4/5 for all oscillatory frequencies except those in the beta band (Fig. 4E).
Cortical oscillatory input may originate in presynaptic neurons situated outside the cortex (29), whereas the spectra of glutamate and other metabolites detected by NMR or mass spectrometry arise from the brain structures sampled. To investigate local cortical syn-aptic transmission (including its pre- and postsynaptic components), we recorded in vivo local field excitatory postsynaptic potentials (fEPSPs) in layer 2/3 in response to deeper electrical stimulation 300 m below (0.2-ms biphasic current step, 0 to 40 A; Fig. 5A). PDHD mice displayed reduced synaptic activation relative to con-trol for 30 to 40 A stimulation intensities (Fig. 5B and fig. S8B),
******
dB
−35
0
0.0250.05 0.5 1 5
Interstimulus interval (s)
Pai
red-
puls
e ra
tio (m
ean
LFP
2 to
6/L
FP1)
0
0.25M
ultiu
nit s
pike
s/s
0.10
0.20
0.15
0.05
0
4
*
Mul
tiuni
t bur
sts
> 3
s
3
2
1
Control
A B C
D E
500 µVLeft
cortex
Rightcortex
10 s
Freq
uenc
y(H
z)
0
50
Awake mouse epidural EEGIntracortical spontaneous action potentials
Intracortical-evoked LFP
Stimulation current (µA)
LFP
am
plitu
de (m
V)
0.6
0.8
1.0
1.2
0 10 20 30 400
100
200
300
400
*******
ms
mV
–100
–200
0 2/3
0 20 40
Residual stimulusartifact
PDHD1 s
0.2mV
0.1
Fig. 5. Local evoked response and paroxysmal epileptiform activity in PDHD mouse cortex. (A) LFP evoked in layer 2/3 by local microstimulation 300 m below the recording electrode. (B) Amplitudes of LFPs evoked in layer 2 after stimulation in layer 4 for a range of currents (input/output curve) in PDHD (n = 6 recording sites, 3 mice) and control (n = 7 sites, 6 mice). (C) Paired-pulse ratios [LFP evoked for second to sixth stimulus/LFP evoked for the first stimulus in a train (mean LFP2 to 6/LFP1)] in PDHD (n = 8 sites, four mice) and control (n = 7 sites, four mice). (D) Recordings from layer 2/3 barrel cortex illustrating paroxysmal epileptiform bursts of action potentials in PDHD (PDHD, 7 sites and 7 mice; control, 13 sites and 13 mice). Left: Example multiunit action potential recording traces from control and PDHD cortex (trace within dotted box is expanded below). Middle and right: Group average of multiunit spike firing rate and number of multiunit spike bursts greater than 3 s. (E) EEG recording from a subdural electrode placed over the barrel cortex of an awake PDHD mouse. Raw EEG traces (top) and spectrogram (bottom) depicting paroxysmal epileptiform activity. dB, decibels. Data indicate means ± SEM. Statistical differences were determined using two-tailed Student’s t test. *P < 0.05, **P < 0.01, and ***P < 0.001.
by guest on May 12, 2020
http://stm.sciencem
ag.org/D
ownloaded from

Jakkamsetti et al., Sci. Transl. Med. 11, eaan0457 (2019) 20 February 2019
S C I E N C E T R A N S L A T I O N A L M E D I C I N E | R E S E A R C H A R T I C L E
8 of 16
suggesting defective local synaptic function. However, disruption of passive axonal electrical conduction could also impair synaptic re-cruitment after stimulation and similarly constrain fEPSP generation. To limit the potential impact of passive axonal electrical conduction on fEPSP comparisons, we discarded recordings from stimulation strengths that elicited limited or no response and compared only responses in which any passive axonal membrane deficits had been overcome. We normalized the responses obtained from each mouse by defining zero current strength as the stimulation intensity that reached two times the threshold (with threshold defined as the minimum current that evoked a fEPSP). After this procedure, we also observed a reduction in evoked LFP activation for 15 and 20 A above two times the threshold in PDHD (fig. S8C). To examine whether this failure of synaptic activation was associated with presynaptic dys-function [including diminished neurotransmitter release probability (30)], we examined paired-pulse response ratios (short-term plasticity) in layer 2/3 synapses in response to deeper, rapid electrical stimulation (300 m below; Fig. 5C and fig. S8D). In PDHD, the paired-pulse depression elicited by rapid stimulation rates characteristic of control was absent, a finding compatible with decreased neurotransmitter release probability.
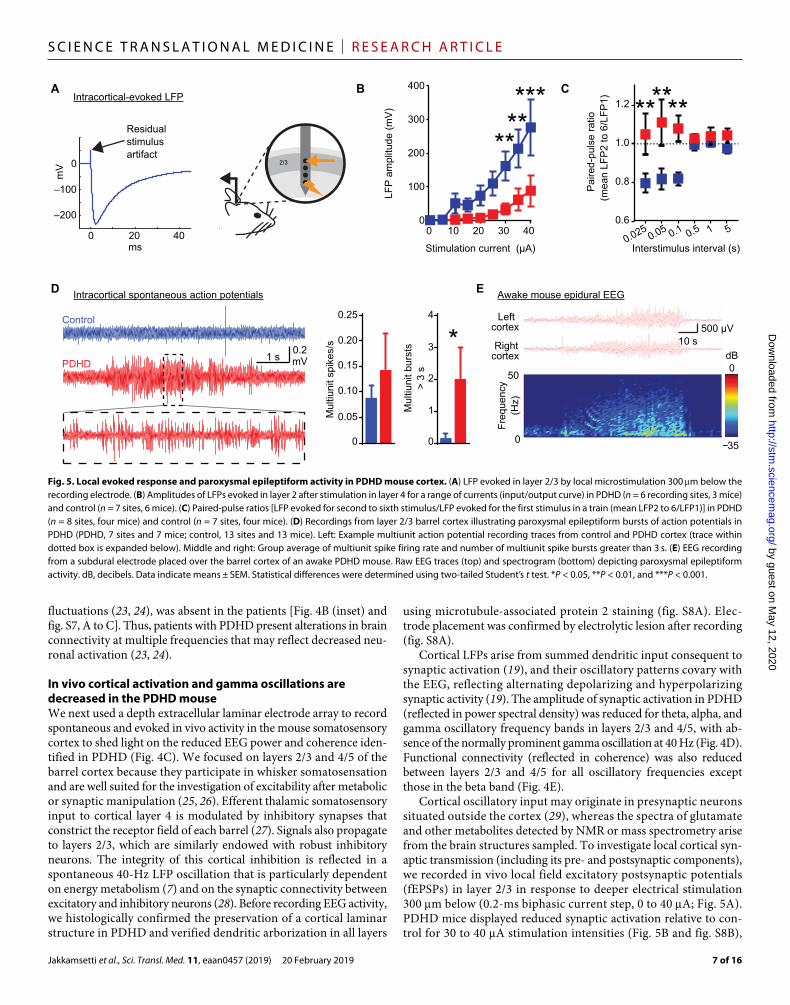
PDH mice display seizures in conjunction with inhibitory failure in vivoAction potential recordings from the barrel cortex of anesthetized and unstimulated mice revealed intermittent epileptiform activity (Fig. 5D). Because anesthesia can modify epileptiform discharges, we characterized them using EEG in 12 awake PDHD mice (fig. S8E). These recordings showed brief paroxysmal epileptiform events (sharp deflections of >200 V, at >3 Hz, for 0.5 to 10 s; fig. S8E) and more prolonged epileptiform discharges that occurred during behavior-ally observable seizures (Fig. 5E and movie S1). In a subset of five mice that underwent additional video-EEG recording, some of the EEG epileptiform events were associated with behavioral changes that were scored with a modified Racine’s scale (fig. S8F, movie S1, and tables S5) (31). As noted above, this epileptiform activity oc-curred in the context of reduced background cortical activation. We reasoned that this paradox could be resolved if local inhibition was impaired and failed to effectively counteract spontaneous excitatory fluctuations. An important source of local inhibition comes from fast-spiking, parvalbumin-positive cortical neurons, which display an unusually robust metabolic rate (32) and may thus be particularly affected by defective energy metabolism. These neurons are required for feed-forward inhibition, and their impairment can lead to seizures (33). To examine the influence of inhibition on neuronal firing in PDHD, we analyzed whisker pad–evoked single-unit activity in the contralateral cortex after multiunit sorting (Fig. 6A and fig. S9, A to D) (34). Using control population data (Fig. 6B), a post-stimulus time histogram (PSTH) of a single-unit firing containing 100 trials revealed that single units were precise in their timing after stimulation, display-ing low jitter or high precision (with precision defined as the inverse of jitter), fired about 15 ms after whisker pad stimulation (PSTH peak latency), ended their firing within 25 ms after stimulation (end latency), and fired within 20 ms (PSTH duration). In PDHD, evoked single- unit firing was imprecise (displaying higher jitter), with substantially increased PSTH peak, end latencies, and duration relative to control (Fig. 6, A and B), supporting the notion that, once activated, PDHD neurons fired later and for longer periods than control.
To compare the properties of putative cortical excitatory and in-hibitory neurons, we characterized individual action potential time
course. Using this procedure, we estimated the contribution of pu-tative parvalbumin-containing inhibitory neurons (narrow putative FS) relative to putative excitatory neurons [broad putative regular spike (RS)] (Fig. 6C and fig. S9, E and F) (35). In PDHD, both RS and FS neurons exhibited less precise firing (more jitter) and fired longer than control (increased “end latency” time; # in Fig. 6C). However, RS neurons generally terminated firing after FS neurons did as man-ifested by the greater end latency of RS neurons (* in Fig. 6C). There was no difference in jitter, peak latency, or duration between RS and FS neurons in PDHD mice. Analysis of RS and FS recordings made with the same electrode revealed that RS neurons continued to fire later and for longer intervals than FS neurons in PDHD (Fig. 6D). FS neuron firing was temporally closely associated with RS neuron firing in control (fig. S10A), whereas PDHD displayed less synchro-nization. Furthermore, firing of an FS neuron was associated with the suppression of RS neuron firing in control but not in PDHD (fig. S10, A and B).
We further characterized inhibition using intracellular record-ing in brain slices. Because PDHD brain slices obtained under a va-riety of standard conditions at P21 to P25 contained many nonviable neurons, we used P16 to P18 mice under modified slicing condi-tions (see Supplementary Methods).
These recordings revealed a decrease in FS neuron action poten-tial frequency in response to current injection relative to control (Fig. 6E). The simplest explanation of this phenomenon is that de-fective energy metabolism affected neuronal input resistance by promoting ion channel opening, expediting the loss of injected cur-rent and resulting in failure to reach action potential threshold. In agreement with this, PDHD FS neurons exhibited reduced input resistance compared to control (Fig. 6F). Furthermore, the mini-mum current required to elicit an action potential (rheobase) was greater in PDHD FS neurons (fig. S11B). In contrast, PDHD RS neurons displayed higher input resistance and increased spike fre-quency after 25-, 75-, and 125-pA current injections but not for the remaining current steps (Fig. 6, E and F), indicating that dysfunc-tional RS neurons can also contribute to the generation of epilep-tiform discharges. In addition, there was no change in resting membrane potential in PDHD (fig. S11C). However, for any indi-vidual neuron, even a small change in resting membrane potential would affect rheobase and, to a lesser degree, action potential gen-eration for current steps above rheobase. Thus, we normalized the recordings obtained from each neuron by reassigning zero current strength to the stimulation current at rheobase. This normalization procedure had no effect on the previous findings in FS or RS neu-rons (fig. S11D, left and right), supporting the notion that abnormal firing in PDHD is independent of any resting membrane potential changes. In separate experiments, we allowed more prolonged cell dialysis through the recording pipette without added adenosine 5′-triphosphate (ATP), guanosine 5′-triphosphate (GTP), or phos-phocreatine. We reasoned that if input resistance is related to me-tabolism as suggested above, then their relation would become more patent in PDHD neurons as the cytoplasm is depleted and devoid of energy substrate compensation. In contrast to control (fig. S12, left), PDHD neurons were more susceptible to dialysis as reflected in their reduction in input resistance over 4 min, with FS neurons displaying a more pronounced decrease (fig. S12, middle and right). These findings, together with the above NMR results, support the notion that decreased TCA cycle flux in PDHD is associated with impaired inhibition.
by guest on May 12, 2020
http://stm.sciencem
ag.org/D
ownloaded from
Jakkamsetti et al., Sci. Transl. Med. 11, eaan0457 (2019) 20 February 2019
S C I E N C E T R A N S L A T I O N A L M E D I C I N E | R E S E A R C H A R T I C L E
9 of 16
*
0
200
400
600
Inpu
t res
ista
nce
(Moh
m)
*Control
PDHD
RS FS
E Ex vivo intracellular evoked action potentials
*******
0 100 200 300Injected current steps (pA)
0
20
40
60
80
Act
ion
pote
ntia
ls/s
******Fast-spike neuron
0 100 200 3000
10
20
30
40
* **
Injected current steps (pA)
Regular-spike neuron
−150 0 150 300
0.5
0
0.5
Time from trough (µS)
Nor
mal
ized
am
plitu
de
450
Regularspike
Narrow/fastspike
Spike width
(PD
HD
/Con
trol)
× 10
0
Jitter Peaklatency
Endlatency
C
Duration
D
Sam
e si
te re
cord
ing:
RS
– F
S
Peaklatency
−3
−2
−1
0
1
2
3
4 *
−4−2
02468
1012 **
Endlatency
0
100
200
300
400# #
0
50
100
150
200
250#
#
0
50
100
150
200
250
300#
##
*
100
200
300
400#
#
P = 0.09
−4
−2
0
2
4
6
8
10 **
Duration
0
Control PDHDWhisker pad–evoked regular-and fast-spike units
RS
RS
FS
FS
250ms
100mV
Control PDHD
125 pA
0
20
40
60
80
100
Tria
l #
0 10 20 300
0.1
0.2
Spi
kes/
s
Peak
End
Duration
0 10 20 30 40 50 60 70Time relative to stimulation (ms)
A
0
5
10
15
20 **
STD
of s
pike
late
ncy
****
0
10
20
30
ms
Peaklatency
0
20
40
60
80
1 00****End
latency
ms
0
20
40
60
80
100
ms
****Duration
BWhisker pad–evoked action potentialsControl PDHDControl PDHD
F
Jitter
Fig. 6. Whisker pad–evoked single-unit firing and associated inhibition in PDHD mice. (A) Left: Experi-mental design and example single-unit waveforms. The average waveform (darker color) is superimposed on 100 waveforms (lighter color). Scale bar, 500 s/0.1 mV. Right: Example dot-raster plots depicting action potentials induced by whisker pad stimulation with the PSTH below. (B) Single-unit group data from control (n = 13 units, five mice) and PDHD (n = 10, four mice) illustrating jitter, peak latency, end latency, and dura-tion of action potentials. (C) Left: Waveforms of broad regular spiking (putative excitatory) and narrow spik-ing (putative fast-spiking inhibitory) indicating the parameters (trough-to-peak time and half-widths) used to classify spikes into RS or FS. Right: Bar charts show RS (n = 11, black) and FS (n = 7, green) single units from PDHD mice normalized to the mean of the corresponding group in control. (D) RS and FS recorded simulta-neously from the same electrode (schematic on acetate:glucose) in PDHD mice (n = 10 RS to FS pairs) and control (n = 4 RS to FS pairs). (E) Left: Diagram of narrow-tip (high-resistance) whole-cell patch clamp record-
ing and traces obtained in response to a 125-pA step current in control (blue) and PDHD (red) neurons. Right: Population average for a number of action potentials elicited by current steps in regular-spiking (control, n = 9 cells, 7 mice; PDHD, n = 17 cells, 13 mice) and fast-spiking (control, n = 22 cells, 12 mice, PDHD n = 26 cells, 15 mice) cells from PDHD and control mice. (F) Population average input resistance in PDHD (n = 14 cells, 12 mice) and in control fast-spiking neurons (n = 8 cells, 7 mice) and regular-spiking neurons (PDHD, n = 16 cells, 10 mice; controls, n = 13 cells, 8 mice). Data indicate means ± SEM. Statistical differences were determined using two-tailed Student’s t test and two-way analysis of variance (ANOVA) with correction for multiple comparisons by controlling the false discovery rate with the Bengamini-Krieger-Yekutieli method. *P < 0.05, **P < 0.01, and ****P < 0.0001.
by guest on May 12, 2020
http://stm.sciencem
ag.org/D
ownloaded from

Jakkamsetti et al., Sci. Transl. Med. 11, eaan0457 (2019) 20 February 2019
S C I E N C E T R A N S L A T I O N A L M E D I C I N E | R E S E A R C H A R T I C L E
10 of 16
Gamma oscillation power decreases precede epileptiform eventsThe above results are compatible with reduced inhibitory neuron ac-tivity in PDHD. Because local inhibition integrity is reflected in gamma oscillations, we investigated the evolution of gamma oscilla-tions in relation to epileptiform activity in EEG recordings from awake mice. In these recordings, we observed a decrease in gamma wave amplitude (power) before epileptiform events (fig. S13, A and B). This suggests that impaired inhibition may contribute to the develop-ment of epileptiform activity in PDHD. We thus hypothesized that, within a mouse, preictal EEG oscillatory frequency power could aid seizure prediction. Several parameters, including the magnitude of gamma power change and frequency band power of preictal and interictal EEG segments, were compared for each mouse by means of a data- driven machine learning algorithm (Fig. 7A). For two parameters, for example, gamma- and beta-band power (Fig. 7B), a support vector machine classifier trained on a subset of the data was used to determine a data-driven decision boundary (or hyperplane for multidimensional data) between pre- and interictal states (see Materials and Methods). This boundary was used to categorize EEG
data not used for classifier training (cross-validation), yielding perform-ance measures. The addition of dimensions, for example, addition of delta power as a feature, helped to better discern the separation of the two distinct pre- and interictal classes [Fig. 7B (right) and fig. S13C]. The incorporation of six dimensions (EEG power for delta, theta, alpha, beta, and gamma frequencies and gamma-frequency change in power over time) resulted in robust classifier performance measures for all mice studied, including an average of 97% specificity when detecting a preictal EEG segment 30 s before a seizure (Fig. 7, C and D). The sensitivity and accuracy of the prediction was greater than 90%, with a positive predictive value and area under the curve greater than 0.95 and an average misclassification rate of less than 0.06. Using this method, we attempted to further extend ictal predictions by analyz-ing several minutes of preictal recording. Preictal EEG segments spanning 3.5 to 4 min immediately preceding an ictal event were suc-cessfully classified with >95% specificity, 89% sensitivity, a positive predictive value and an area under the curve ≥ 0.95, and an average misclassification rate of 0.1 (Fig. 7D).
We next investigated the accuracy of these predictions in geneti-cally confirmed patients with PDHD using clinical EEG recordings.
0.4 0.5 0.6 0.7 0.8 0.9 1 1.1 1.2 1.3Gamma power (relative to average of random EEG segment)
0.5
0.6
0.7
0.8
0.9
1
1.1
1.2
1.3
Bet
a po
wer
(rel
ativ
e to
ave
rage
of r
ando
m E
EG
seg
men
t)
Decision boundary
–60– to –30–s preictal EEGInterictal 30–s EEGSupport vectors
210
1
0
2
0 0.5 1 1.5Gamma power (normalized)
Del
ta p
ower
(nor
m.)
Beta power
(norm
.)
0 0.1 0.2 0.3 0.4 0.5 0.6 0.7 0.8 0.9 1False-positive rate (1–specificity)
0
0.1
0.2
0.3
0.4
0.5
0.6
0.7
0.8
0.9
1
True
-pos
itive
rate
(sen
sitiv
ity)
Area under curve = 0.985Sensitivity = 94%Specificity = 96 %Accuracy = 95%Positive predictive value = 0.97Misclassification rate (10-fold cross-validation) = 0.0313
Receiver operating characteristic curveC
BA Machine learning protocol
Raw EEG
Preprocessing and feature selection(e.g., normalized gamma power)
Hyperparameter optimization(e.g., linear/gaussian/polynomial
decision boundary)
Support vector machine trained on learning set
Cross-validate on test set,compute misclassification rate
30times
D
10 times
Mouse # 1
Performance –60 to –30 s –240 to –210 s
parameter preictal EEG preictal EEG
Sensitivity (%) 92.8 ± 3.3 89.14 ± 7.8
Specificity (%) 97.8 ± 1.5 96 ± 4
Accuracy (%) 97.7 ± 2.2 92.6 ± 5.8
Positive pred. value 0.97 ± 0.01 0.95 ± 0.01
Area under curve 0.98 ± 0.01 0.97 ± 0.03
Misclassification rate 0.057 ± 0.03 0.102 ± 0.06
Machine learning performance metrics
Fig. 7. Machine learning algorithm using a support vector for ictal prediction in PDHD mice. (A) Outline of a machine learning algorithm with 10-fold cross-validation for ictal prediction. (B) Left: Two-dimensional (2D) example scatter plot of normalized (norm.) gamma and beta power for mouse preictal events contrasted with power of interictal EEG segments over 2 hours. Right: 3D scatter plot of the same data. (C) Receiver operating characteristic curve of analysis on data from (B). (D) Classifier per-formance measures for group data (n = 5 PDHD mice).
by guest on May 12, 2020
http://stm.sciencem
ag.org/D
ownloaded from

Jakkamsetti et al., Sci. Transl. Med. 11, eaan0457 (2019) 20 February 2019
S C I E N C E T R A N S L A T I O N A L M E D I C I N E | R E S E A R C H A R T I C L E
11 of 16
These patients had been diagnosed and clinically characterized by us in the context of standard medical care provision (table S6). The ep-ileptiform discharges recorded in all five patients with PDHD exam-ined were preceded by a marked preictal reduction in gamma power that became noticeable as early as several minutes before each ictal event (fig. S13D and S14, A to D). Recording intervals containing a gamma power change that was <80% of baseline for the subjects in figs. S13E and S14 (A to C) and a gamma power that was <90% of baseline for the subject fig. S14D were identified as distinct from in-terictal baseline EEG segments and classified as preictal with a mis-classification rate lower than 0.05 (figs. S13E and S14, A to C). These results suggest that EEG features such as depression of gamma pow-er might be useful in anticipating epileptiform discharges in PDHD.
PDHD metabolism and excitability are responsive to alternative fueling by acetateAs shown above, inhibitory dysfunction in PDHD is associated with reduced cerebral metabolic flux, including neurotransmitter pro-duction. To further probe the interrelation between metabolism and excitability and to explore an approach that could mitigate their dys-function, we took advantage of alternative metabolic reactions and assessed the outcome of enhancing them with alternate substrate in PDHD mice. We thus used acetate to fuel metabolism independent-ly of PDH and asked whether abnormal excitability was due to fixed (including structural) changes or to reversible (or primarily meta-bolic) dysfunction. After a 5-hour fast, spontaneous basal LFP oscilla-tions were recorded and then monitored after intraperitoneal acetate injection (2 mg/g of body weight, matching the conditions used in the NMR experiments above). Acetate enhanced PDHD cortical ac-tivation (Fig. 8, A and B), with every oscillation-frequency bin dis-playing increased power. Maximum augmentation occurred 45 to 60 min after administration (Fig. 8, A and B). Coherence analysis demonstrated enhancement of delta and theta frequencies by acetate (Fig. 8C). In separate experiments, acetate potentiated local synaptic transmission in PDHD as assayed by in vivo intracortical stimula-tion and recording. Although the enhancement of locally evoked fEPSP amplitude in response to acetate exhibited variability, the fEPSP slope [a measure of synaptic conductance (36)] was increased from 35 to 55 min after acetate injection (fig. S15A). In addition, there was a decrease in in vivo paired-pulse response ratios from 50 to 55 min after acetate injection (fig. S15, B and C), suggesting that acetate en-hanced synaptic vesicle release probability. In brain slices, acetate stimulated spontaneous glutamatergic excitatory postsynaptic cur-rents in PDHD RS and FS neurons but not in control (fig. S16, A and B). Because acetate augmented gamma oscillation power, we next asked whether acetate modulated inhibitory activity. In PDHD RS and FS neurons, acetate countered the loss of input resistance observed in the absence of pipette ATP, GTP, and phosphocreatine (fig. S17, A and B). This dilution of intracellular solution also predictably atten-uated firing rate (fig. S17C), but acetate also moderated this phe-nomenon in FS neurons (fig. S17D). We next examined the impact of acetate injection on spontaneous epileptiform discharges in nine awake PDHD mice after a 2-hour recording baseline. Acetate cur-tailed the duration of epileptiform events in the first 30 min after injection without affecting the number of events. Their durations re-turned to baseline in the second 30-min interval after acetate injection (fig. S18, A to C). Vehicle injections did not affect epileptiform event numbers or durations (fig. S19, A and B). In a subset of mice that re-ceived concurrent video recording, acetate reduced the number and
the duration of EEG-defined epileptiform events that coincided with video-detected behavioral changes for the first 30 min after injection (fig. S19C). These findings indicate that these abnormalities are func-tional and modifiable by alternative metabolic fueling.
To elucidate the metabolic changes associated with acetate mod-ulation of cortical activity in PDHD, we performed NMR isotopomer analysis of glutamate and GABA after administration of [1,2-13C]acetate and [1,6-13C]glucose. Under isotopic steady-state conditions, the labeling pattern of glutamate and GABA in the normal brain is similar because GABA originates from glutamate through a single decarboxylation reaction (15). Figure 8D illustrates a spectrum from glutamate C4 and GABA C2, which constitute the carbons primarily labeled from [1,2-13C]acetate and [1,6-13C]glucose. In control cere-bral cortex, the distribution of singlets and doublets was, as expected, proportionally similar for glutamate C4 and GABA C2 such that the multiplets derived from [1,6-13C]glucose (singlets, doublet D34 in glutamate C4, and doublet D23 in GABA C2) were proportionally greater than the multiplets originating from [1,2-13C]acetate (quartet D45 in glutamate C4 and D12 in GABA C2). The quartet resonance was only observed in glutamate C4 probably because of the low abun-dance of 13C-GABA. In PDHD, the labeling pattern differed for both isotopomers. Specifically, acetate-derived multiplets were more prom-inent in glutamate C4 compared to GABA C2. In addition, the overall abundance of glutamate C4 was greater than that of GABA C2 in PDHD mice injected with [1,2-13C]acetate and [1,6-13C]glucose rel-ative to [U-13C]glucose. These findings indicate that, although GABA receives a greater contribution from 13C acetate in PDHD compared to control (table S3), this is less relative to the contribution of acetate to glutamate in PDHD. Together, the combined results from NMR and electrophysiology suggest that acetate increases cortical activation by primarily enhancing glutamatergic synaptic activity.
DISCUSSIONWe investigated how defective glucose oxidation disrupts cortical excitation in the PDHD brain and tested whether this could be re-versed by an alternate energy substrate that is metabolized down-stream of PDH. We found a functionally relevant association between impaired glucose oxidation and decreased amounts of glutamate (but not of GABA), presynaptic excitatory failure, diminished spontaneous electrophysiological activity, impaired inhibition, and paroxysmal epileptiform discharges in the PDHD cortex. A gradual reduction of gamma activity and cortical activation occurred in anticipation of EEG epileptiform events in mice and patients with PDHD, which may be valuable for seizure prediction. Bypassing PDH with acetate enhanced glutamate neurotransmission, attenuated depressed FS neuron firing, increased gamma power, and temporarily reduced ep-ileptiform discharge duration in PDHD mice. Together, these data indicate that the excitability dysfunction characteristic of PDHD is at least partially dependent on metabolic fuel source (rather than fixed) and thus amenable to metabolic modification.
The metabolic phenotype of the PDHD mouse brain is character-ized by additional features. As expected from a restricted conversion of pyruvate into acetyl-CoA in PDHD, the upstream metabolite ala-nine accumulates, whereas [U-13C]glucose oxidation through the TCA cycle is impaired. Brain glutamate abundance was reduced, sug-gesting a particular dependence of this metabolite on oxidative flux. This is compatible with estimates that glutamatergic neurons consume three to five times more glucose than GABA-synthesizing neurons (37),
by guest on May 12, 2020
http://stm.sciencem
ag.org/D
ownloaded from

Jakkamsetti et al., Sci. Transl. Med. 11, eaan0457 (2019) 20 February 2019
S C I E N C E T R A N S L A T I O N A L M E D I C I N E | R E S E A R C H A R T I C L E
12 of 16
which, if correct, can make the former more susceptible to glucose oxidative defects. In addition to decreased net synthesis of glucose- derived glutamate, the elevated production of alanine noted can also account for the reduced glutamate content. Glutamate cedes an ami-no group to pyruvate during the production of alanine, a reaction
that has been postulated to be more robust in glutamatergic than in GABAergic neurons (38).
The deficient glucose oxidation characteristic of the PDHD brain is counterbalanced by enhanced compensatory consumption of al-ternative metabolic substrates that bypass PDH. A first indication of
1 4 7 15 30 50
Pow
er (m
V2 /
Hz)
Frequency (Hz)
Baseline
1 hr after acetate ip
800
150
–10Min
chan
ge(%
)
Low gamma
1 4 7 15 30 50
100
101
102
Frequency (Hz)
Baseline
1 hr after acetate ip100
101
102
80400
Acetate ip
Low gamma
BetaAlphaThetaDelta
8040010 10Change
(%)
0
200
–200
Min Min
Control PDHD
Low gamma
BetaAlphaThetaDelta
80400 8040010 10Change
(%)
0
100
–100
Min Min
Control PDHD
B Group average LFP power
C Group average LFP coherence
= P < 0.05
PDHD
34.5 34.2 33.9
Q
D45
D34
S
Glutamate C4
35.3 35.1 34.9
D12
D23
S
GABA C2
Baseline
1 hr
Delta (1 to 4 Hz)
Low gamma (30 to 50 Hz)
Baseline
1 hr
2/3
4/5
2/3
4/5
2/3
2/3
Layer
A
PDHDControl
[1,2-13C]glucose
[1,2-13C]acetate
GABA C2
D23
D12
S
35.3 35.1 34.9
Glutamate C4
Control
Q
D34
D45
S
Q
Q
34.5 34.2 33.9
D
13C-gluc 13C-acet
0
20
40
60
80
100
% 1
3 C a
rea
Control
NDND
Glut. C4 GABA C2
PDHD
******
0
20
40
60
80
100
% 1
3 C a
rea
Glut. C4 GABA C2
0
2
4
6
813 C-gluc
13 C-acet
*
Glu
t. C
4/G
AB
A C
2
Control PDHD
13 C-gluc+
LFP power after acetate ipFig. 8. Acetate enhancement of cor tical activation and glutamate 13C labeling in PDHD mice. (A) Top: Spontaneous LFP re-cordings from a low (delta frequency) and higher frequency bin (low gamma) before and 1 hour (hr) after an intraperitoneal (ip) injection (2 mg/g of body weight) of sodium acetate. Bottom: LFP power after acetate in a PDHD mouse. Inset: Temporal profile of gamma power after acetate administration (injected at 10 min). (B and C) LFP power and coherence mean percentage change (com-pared to pre- acetate baseline) for all mice (PDHD, n = 5; control, n = 5) after acetate (black arrow). Black lines in (C) and (D) enclose statis-tically significant regions (P < 0.05). (D) Repre-sentative spectra of glutamate C4 (glut. C4) and GABA C2 from PDHD and control mice. The contribution of 13C-acetate (13C-acet) [(area D45 + area Q)/total area] and 13C-glucose (13C-gluc)] [(area S + area D34)/total area] was calculated for both isotopomers. The graphs immediately below represent the contribu-tion of acetate and glucose to glutamate and GABA in control (top) and PDHD mice (middle). The bottom graph depicts the contribution to glutamate:GABA ratio from acetate and glucose in control and PDHD mice. Data repre-sent mean ± SEM. Statistical dif ferences were determined using two- tailed Student’s t test. *P < 0.05 and ***P < 0.001.
by guest on May 12, 2020
http://stm.sciencem
ag.org/D
ownloaded from

Jakkamsetti et al., Sci. Transl. Med. 11, eaan0457 (2019) 20 February 2019
S C I E N C E T R A N S L A T I O N A L M E D I C I N E | R E S E A R C H A R T I C L E
13 of 16
this phenomenon was noticeable after [U-13C]glucose administra-tion. The enrichment of [1,2-13C]acetyl-CoA derived from [U-13C]glucose was 40% reduced in PDHD cortex relative to control, sug-gesting that robust unlabeled substrate oxidation has occurred, lead-ing to unlabeled acetyl-CoA production and resulting dilution of its 13C pool. Further evidence was provided by the combined adminis-tration of [1,2-13C]acetate, a direct precursor of acetyl-CoA, and [1,6-13C]glucose. In agreement with alternative consumption, the ox-idation of acetate relative to glucose was stimulated, indicating that acetate is an important substrate for the PDHD cortex. Using these data, we estimate (18) that the acetate:glucose oxidative ratio in PDHD cortex is four times greater than control. Such a shift in brain substrate preference has a precedent in the adaptation to chronic ketosis (39), which is achieved in the medical setting by augmenting hepatic ketone body production via fat oxidation (40). Nevertheless, as discussed be-low, the PDHD mice were euglycemic, not ketotic, and did not mani-fest lactic acidemia as is often observed in human PDHD (15), implying that the substrate preference shift is largely mediated by intrinsic cere-bral metabolic adaptation.
The modulation of electrical activity by acetate in PDHD reveals further aspects of brain metabolism-excitability coupling. In a back-ground of impaired oxidative metabolism and decreased spontaneous cortical excitation, acetate preferentially labeled glutamate over GABA and enhanced spontaneous LFP power. This enhanced glutamatergic neurotransmission occurred without increased glutamate levels. This probably stems from not only the relatively small amount of acetate infused but also from the biochemical principle that acetate cannot provide net carbon to replenish TCA cycle metabolic intermediates. Although the two carbons of [1,2-13C]acetate enter the TCA cycle and label intermediates and derivatives such as glutamate, two carbons are also lost during each cycle (in the form of CO2), such that acetate does not support the net synthesis of glutamate or other TCA cycle–derived metabolites. Instead, acetate likely is used in PDHD as an en-ergy substrate in glutamatergic and GABAergic neurons, sustaining glutamate release and recycling and thus enhancing glutamatergic synaptic transmission.
Despite the brain targeting of the PDHD mouse mutation, the plasma ketone bodies acetoacetate and -hydroxybutyrate, which are byproducts of ketogenic diets used to treat epilepsy, could reduce excitability. Plasma acetoacetate was increased in PDHD compared to control, whereas -hydroxybutyrate was unchanged. However, this is unlikely to significantly affect excitability because, although acetoacetate can decrease synaptic vesicle release probability (41), the plasma concentration observed in PDHD is associated with only a ~5% reduction in calcium current amplitude related to release probability (42).
Numerous epilepsies are associated with increased glutamatergic activity, which heightens cortical excitability (43). In PDHD, the ap-parently paradoxical coexistence of reduced glutamate with epilepti-form activity can be explained by neuronal inhibitory failure, which permits excessive excitatory neuron activity. However, the assign-ment of the observed firing patterns to excitatory (RS) and inhibitory neurons (FS) is not unequivocal and consequently remains putative (44–46). With this caveat, the basis for postulating neuronal inhibito-ry failure are fourfold: (i) intrinsic FS neuron abnormalities such as decreased input resistance, increased rheobase, and reduced firing rates; (ii) desynchronization of putative excitatory-inhibitory neuron firing (FS inhibitory neurons usually fire within 2 ms of an excitatory neuron (47), whereas neuronal jitter in PDHD degrades this mecha-
nism); (iii) attenuation of gamma oscillations, which require FS neu-ron firing (48) and abate before the onset of epileptiform discharges; and (iv) unrestrained putative excitatory neuron firing, which is con-gruent with the hypoexcitability of FS neurons in PDHD.
The special metabolic features of FS neurons may make them par-ticularly prone to failure in PDHD independently of reduced presyn-aptic excitatory drive. Inhibitory neurons are endowed with a robust metabolism such that mitochondrial dysfunction suppresses gamma oscillations by preferentially affecting them (7, 32). In addition to supporting ionic gradients, TCA cycle–derived compounds such as ATP modulate excitability (49). This modulation may be more pro-nounced in inhibitory neurons, which contain three times more ATP- sensitive potassium channels than excitatory neurons (50). ATP promotes channel closing, raising cell input resistance (51). In PDHD, dilution of intracellular contents in the absence of added ATP, GTP, and phos-phocreatine results in rapid loss of input resistance. Acetate, which primarily serves as energy fuel and is avidly consumed by inhibitory neurons, attenuates this loss and preserves firing.
In contrast with FS cells, cortical RS neurons are modestly hyper-excitable in response to current injection in PDHD. This is compatible with increased hyperpolarization-activated cyclic nucleotide– gated (HCN) channel closing. HCN subunits HCN1 and HCN2 are densely located in the dendrites of cortical excitatory neurons (52) such that depletion of the channel agonist cyclic adenosine 3′,5′- monophosphate, derived from ATP, may lead to decreased HCN opening, raising input resistance and excitability in PDHD.
The EEG power spectrogram from patients with PDHD lacks normally prominent spectral peaks. Furthermore, it also lacks nor-mal transient oscillation epochs. However, total EEG power is not decreased in all patients, and this is not correlated with any obvious clinical features (table S6). One explanation is that EEG power, al-though influenced by metabolism, is readily contaminated by broad-band indiscriminate seizure activity, which is variable across patients. Spectral peak amplitude and periodic epoch activity, on the other hand, arise from more frequency-specific and consistent rhythmic activity, and their measurement is thus less contaminated by variable, chaotic seizures and is consequently more uniformly disrupted in pa-tients with PDHD.
In conclusion, the simplest interpretive framework that accounts for all the results is that basal synaptic excitation is depressed in the PDHD cortex, but upon action potential stimulation, the conjunc-tion of slightly overexcitable RS with hypoexcitable FS neuronal activity leads to the generation of prolonged bursts of excitatory ac-tion potentials that can propitiate epileptiform events (fig. S20). This ultimately stems from reduced brain glutamate metabolic flux and impaired inhibition, which are nevertheless fuel dependent and can thus be partially reversed with an alternative substrate (53, 54), afford-ing an opportunity for therapeutic restitution.
This conclusion is subject to limitations. First, NMR assays used P21 to P25 mice. Although in vivo electrophysiology, including in-tracortical LFPs and single-unit and EEG studies, was conducted in P21 to P25 mice, brain slice whole-cell patch clamp experiments used P16 to P18 mice. There is a developmental increase in pyruvate oxidation (55), TCA cycle, and related neurotransmitter fluxes (56) in rodents. Therefore, the P16 to P18 data may underestimate the magnitude of metabolism-related neuronal dysfunction expected at P21 to P25, including deficits in input resistance, neuronal firing, spontaneous excitatory postsynaptic currents and their responsive-ness to metabolic augmentation. Next, although we inferred, on the
by guest on May 12, 2020
http://stm.sciencem
ag.org/D
ownloaded from

Jakkamsetti et al., Sci. Transl. Med. 11, eaan0457 (2019) 20 February 2019
S C I E N C E T R A N S L A T I O N A L M E D I C I N E | R E S E A R C H A R T I C L E
14 of 16
basis of whole-cell patch clamp recordings, that cortical layer 4/5 neu-rons with apical dendrites and adapting broad-width action potentials were predominantly excitatory, whereas neurons with nonadapting, narrower-width and deeper afterhyperpolarization were principally inhibitory, their assignment is not unambiguous as noted above (44–46). Last, we studied a small number of patients with PDHD as a result of their rarity and reduced life span.
MATERIALS AND METHODSStudy designData sources from mice included 13C NMR assays of metabolites, in vitro assays of enzyme activity, and in vivo and brain slice record-ings of neuronal activity. Human data included EEG recordings and clinical features of patients with a genetic diagnosis of PDHD. For mouse experiments, pilot data from three or four samples per group provided an estimate of SD and effect magnitude, which, together with a power of 0.8 and P < 0.05, guided sample sizes using the MATLAB function sampsizepwr (MathWorks Inc.). Control and PDHD mice from the same litter were randomly selected for experiments. Repli-cates and statistical tests are cited with each result. All procedures were approved by the University of Texas Southwestern Medical Center Institutional Animal Care and Use Committee and Institutional Re-view Board. Data analysis was blind and performed concurrently on control and experimental data with the same MATLAB scripts and parameters. No data, including outlier values, were excluded. All the raw data are provided in table S7.
Statistical analysisPrism 6.0 (Graphpad Software) was used for all statistical analyses, including independent Student’s t test assuming equal variances un-less otherwise specified, paired sample t test for comparing changes in the same mouse, Mann-Whitney U test if the data had a nonpara-metric distribution, one-sample t test testing if the data mean was significantly different from the value of zero, and two-way ANOVA (correction for multiple comparisons controlled false discovery rate with the method of Bengamini-Krieger-Yekutieli). The value of al-pha (significance level) was set at 0.05, and all tests of significance were two sided. All data are expressed as means ± SEM.
SUPPLEMENTARY MATERIALSwww.sciencetranslationalmedicine.org/cgi/content/full/11/480/eaan0457/DC1MethodsFig. S1. Glucose metabolism schema and survival curves of patients and mice with PDHD.Fig. S2. Expression of PDH in the mouse somatosensory cortex.Fig. S3. Phenotype of PDHD mice.Fig. S4. Glucose metabolism in PDHD mice.Fig. S5. EEG in patients with PDHD.Fig. S6. Patient with PDHD EEG (patient I).Fig. S7. EEG oscillation epochs in patients with PDHD.Fig. S8. Cortical layering, evoked LFP, and baseline EEG in PDHD mice.Fig. S9. Sorting of multiunit action potentials into single units and separation into broad- and fast-spiking neuronal origin.Fig. S10. In vivo RS neuron discharge relative to fast-spiking activity.Fig. S11. Brain slice intracellular recordings illustrating cell discrimination, rheobase, and firing.Fig. S12. Neuronal input resistance under energetic substrate deprivation.Fig. S13. EEG gamma power in relation to epileptiform events in PDHD.Fig. S14. Gamma power in relation to epileptiform events in additional patients with PDHD.Fig. S15. Acetate modulation of evoked LFPs in vivo.Fig. S16. Acetate modulation of spontaneous excitatory postsynaptic currents.Fig. S17. Modulation of input resistance and firing with acetate.Fig. S18. Acetate modulation of EEG epileptiform events in awake mice.
Fig. S19. EEG epileptiform events in awake mice with vehicle injections.Fig. S20. Representation of glucose oxidation and excitability coupling in relation to PDH activity.Table S1. Plasma metabolite concentration.Table S2. Isotopomer analysis of [U-13C]glucose NMR spectra from cerebral cortex NMR spectra.Table S3. Isotopomers derived from [1,2-13C]acetate and [1,6-13C]glucose in cerebral cortex NMR spectra.Table S4. Metabolic model analysis of glutamate and glutamine C4 multiplets from [1,6-13C]glucose and [1,2-13C]acetate cerebral cortex spectra.Table S5. Modified Racine’s scale.Table S6. Key clinical features of patients with PDHD.Table S7. Raw data (provided as a separate Excel file).Movie S1. PDHD mouse video-EEG recording of epileptiform events.References (57–75)
REFERENCES AND NOTES 1. K. Norberg, B. K. Siesjö, Quantitative measurement of blood flow and oxygen
consumption in the rat brain. Acta Physiol. Scand. 91, 154–164 (1974). 2. J. E. Cremer, Amino acid metabolism in rat brain studied with 14C-labelled glucose.
J. Neurochem. 11, 165–185 (1964). 3. S. Korkes, J. R. Stern, I. Gunsalus, S. Ochoa, Enzymatic synthesis of citrate from pyruvate
and oxalacetate. Nature 166, 439–440 (1950). 4. R. J. Haslam, H. A. Krebs, The metabolism of glutamate in homogenates and slices of
brain cortex. Biochem. J. 88, 566–578 (1963). 5. J. M. Pascual, J. Campistol, A. Gil-Nagel, Epilepsy in inherited metabolic disorders.
Neurologist 14, S2–S14 (2008). 6. M. Tondo, I. Marin-Valencia, Q. Ma, J. M. Pascual, in Rosenberg's Molecular and Genetic
Basis of Neurological and Psychiatric Disease (Fifth Edition) (Elsevier, 2015), pp. 291–297. 7. R. G. Whittaker, D. M. Turnbull, M. A. Whittington, M. O. Cunningham, Impaired
mitochondrial function abolishes gamma oscillations in the hippocampus through an effect on fast-spiking interneurons. Brain 134, e180 (2011).
8. M. T. Johnson, S. Mahmood, S. L. Hyatt, H.-S. Yang, P. D. Soloway, R. W. Hanson, M. S. Patel, Inactivation of the murine pyruvate dehydrogenase (Pdha1) gene and its effect on early embryonic development. Mol. Genet. Metab. 74, 293–302 (2001).
9. L. M. L. Chow, J. Zhang, S. J. Baker, Inducible Cre recombinase activity in mouse mature astrocytes and adult neural precursor cells. Transgenic Res. 17, 919–928 (2008).
10. G. Frost, M. L. Sleeth, M. Sahuri-Arisoylu, B. Lizarbe, S. Cerdan, L. Brody, J. Anastasovska, S. Ghourab, M. Hankir, S. Zhang, D. Carling, J. R. Swann, G. Gibson, A. Viardot, D. Morrison, E. L. Thomas, J. D. Bell, The short-chain fatty acid acetate reduces appetite via a central homeostatic mechanism. Nat. Commun. 5, 3611 (2014).
11. K. P. Patel, T. W. O’Brien, S. H. Subramony, J. Shuster, P. W. Stacpoole, The spectrum of pyruvate dehydrogenase complex deficiency: Clinical, biochemical and genetic features in 371 patients. Mol. Genet. Metab. 106, 385–394 (2012).
12. L. De Meirleir, W. Lissens, R. Denis, J.-L. Wayenberg, A. Michotte, J.-M. Brucher, E. Vamos, E. Gerlo, I. Liebaers, Pyruvate dehydrogenase deficiency: Clinical and biochemical diagnosis. Pediatr. Neurol. 9, 216–220 (1993).
13. I. Marin-Valencia, L. B. Good, Q. Ma, F. M. Jeffrey, C. R. Malloy, J. M. Pascual, High-resolution detection of 13C multiplets from the conscious mouse brain by ex vivo NMR spectroscopy. J. Neurosci. Methods 203, 50–55 (2012).
14. F. Cruz, S. Cerdán, Quantitative 13C NMR studies of metabolic compartmentation in the adult mammalian brain. NMR Biomed. 12, 451–462 (1999).
15. I. Marin-Valencia, L. B. Good, Q. Ma, C. R. Malloy, M. S. Patel, J. M. Pascual, Cortical metabolism in pyruvate dehydrogenase deficiency revealed by ex vivo multiplet 13C NMR of the adult mouse brain. Neurochem. Int. 61, 1036–1043 (2012).
16. G. Öz, D. A. Berkich, P.-G. Henry, Y. Xu, K. LaNoue, S. M. Hutson, R. Gruetter, Neuroglial metabolism in the awake rat brain: CO2 fixation increases with brain activity. J. Neurosci. 24, 11273–11279 (2004).
17. R. A. Waniewski, D. L. Martin, Preferential utilization of acetate by astrocytes is attributable to transport. J. Neurosci. 18, 5225–5233 (1998).
18. I. Marin-Valencia, M. A. Hooshyar, K. Pichumani, A. D. Sherry, C. R. Malloy, The ratio of acetate-to-glucose oxidation in astrocytes from a single 13C NMR spectrum of cerebral cortex. J. Neurochem. 132, 99–109 (2015).
19. G. Buzsáki, C. A. Anastassiou, C. Koch, The origin of extracellular fields and currents—EEG, ECoG, LFP and spikes. Nat. Rev. Neurosci. 13, 407–420 (2012).
20. L. Cornelissen, S.-E. Kim, P. L. Purdon, E. N. Brown, C. B. Berde, Age-dependent electroencephalogram (EEG) patterns during sevoflurane general anesthesia in infants. eLife 4, e06513 (2015).
21. O. G. Jenni, A. A. Borbély, P. Achermann, Development of the nocturnal sleep electroencephalogram in human infants. Am. J. Physiol.Regul. Integr. Comp. Physiol. 286, R528–R538 (2004).
by guest on May 12, 2020
http://stm.sciencem
ag.org/D
ownloaded from

Jakkamsetti et al., Sci. Transl. Med. 11, eaan0457 (2019) 20 February 2019
S C I E N C E T R A N S L A T I O N A L M E D I C I N E | R E S E A R C H A R T I C L E
15 of 16
22. O. Pogarell, S. Teipel, G. Juckel, L. Gootjes, T. Möller, K. Bürger, G. Leinsinger, H.-J. Möller, U. Hegerl, H. Hampel, EEG coherence reflects regional corpus callosum area in Alzheimer’s disease. J. Neurol. Neurosurg. Psychiatry 76, 109–111 (2005).
23. F. van Ede, A. J. Quinn, M. W. Woolrich, A. C. Nobre, Neural oscillations: Sustained rhythms or transient burst-events? Trends Neurosci. 41, 415–417 (2018).
24. G. Buzsáki, X.-J. Wang, Mechanisms of gamma oscillations. Annu. Rev. Neurosci. 35, 203–225 (2012).
25. N. Cholet, L. Pellerin, E. Welker, P. Lacombe, J. Seylaz, P. Magistretti, G. Bonvento, Local injection of antisense oligonucleotides targeted to the glial glutamate transporter GLAST decreases the metabolic response to somatosensory activation. J. Cereb. Blood Flow Metab. 21, 404–412 (2016).
26. J. R. Gibson, A. F. Bartley, S. A. Hays, K. M. Huber, Imbalance of neocortical excitation and inhibition and altered UP states reflect network hyperexcitability in the mouse model of fragile X syndrome. J. Neurophysiol. 100, 2615–2626 (2008).
27. M. J. Higley, D. Contreras, Cellular mechanisms of suppressive interactions between somatosensory responses in vivo. J. Neurophysiol. 97, 647–658 (2007).
28. V. S. Sohal, J. R. Huguenard, Inhibitory coupling specifically generates emergent gamma oscillations in diverse cell types. Proc. Natl. Acad. Sci. U.S.A. 102, 18638–18643 (2005).
29. M. Castelo-Branco, S. Neuenschwander, W. Singer, Synchronization of visual responses between the cortex, lateral geniculate nucleus, and retina in the anesthetized cat. J. Neurosci. 18, 6395–6410 (1998).
30. D. Fioravante, W. G. Regehr, Short-term forms of presynaptic plasticity. Curr. Opin. Neurobiol. 21, 269–274 (2011).
31. Y. Ihara, Y. Tomonoh, M. Deshimaru, B. Zhang, T. Uchida, A. Ishii, S. Hirose, Retigabine, a Kv7.2/Kv7.3-channel opener, attenuates drug-induced seizures in knock-in mice harboring Kcnq2 mutations. PLOS ONE 11, e0150095 (2016).
32. O. Kann, I. E. Papageorgiou, A. Draguhn, Highly energized inhibitory interneurons are a central element for information processing in cortical networks. J. Cereb. Blood Flow Metab. 34, 1270–1282 (2014).
33. J. T. Paz, J. R. Huguenard, Microcircuits and their interactions in epilepsy: Is the focus out of focus? Nat. Neurosci. 18, 351–359 (2015).
34. D. N. Hill, S. B. Mehta, D. Kleinfeld, Quality metrics to accompany spike sorting of extracellular signals. J. Neurosci. 31, 8699–8705 (2011).
35. J. F. Mitchell, K. A. Sundberg, J. H. Reynolds, Differential attention-dependent response modulation across cell classes in macaque visual area V4. Neuron 55, 131–141 (2007).
36. D. Johnston, S. M.-S. Wu, in Foundations of Cellular Neurophysiology (MIT press, 1994). 37. J. M. N. Duarte, R. Gruetter, Glutamatergic and GABAergic energy metabolism measured
in the rat brain by 13C NMR spectroscopy at 14.1 T. J. Neurochem. 126, 579–590 (2013). 38. H. S. Waagepetersen, I. J. Bakken, O. M. Larsson, U. Sonnewald, A. Schousboe,
Comparison of lactate and glucose metabolism in cultured neocortical neurons and astrocytes using 13C-NMR spectroscopy. Dev. Neurosci. 20, 310–320 (1998).
39. M. Yudkoff, Y. Daikhin, I. Nissim, O. Horyn, A. Lazarow, B. Luhovyy, S. Wehrli, I. Nissim, Response of brain amino acid metabolism to ketosis. Neurochem. Int. 47, 119–128 (2005).
40. Y. Zhang, S. Zhang, I. Marin-Valencia, M. A. Puchowicz, Decreased carbon shunting from glucose toward oxidative metabolism in diet-induced ketotic rat brain. J. Neurochem. 132, 301–312 (2015).
41. N. Juge, J. A. Gray, H. Omote, T. Miyaji, T. Inoue, C. Hara, H. Uneyama, R. H. Edwards, R. A. Nicoll, Y. Moriyama, Metabolic control of vesicular glutamate transport and release. Neuron 68, 99–112 (2010).
42. A. Kadowaki, N. Sada, N. Juge, A. Wakasa, Y. Moriyama, T. Inoue, Neuronal inhibition and seizure suppression by acetoacetate and its analog, 2-phenylbutyrate. Epilepsia 58, 845–857 (2017).
43. M. J. During, D. D. Spencer, Extracellular hippocampal glutamate and spontaneous seizure in the conscious human brain. Lancet 341, 1607–1610 (1993).
44. L. M. Frank, E. N. Brown, M. A. Wilson, A comparison of the firing properties of putative excitatory and inhibitory neurons from CA1 and the entorhinal cortex. J. Neurophysiol. 86, 2029–2040 (2001).
45. L. Woloszyn, D. L. Sheinberg, Effects of long-term visual experience on responses of distinct classes of single units in inferior temporal cortex. Neuron 74, 193–205 (2012).
46. J. Courtin, F. Chaudun, R. R. Rozeske, N. Karalis, C. Gonzalez-Campo, H. Wurtz, A. Abdi, J. Baufreton, T. C. M. Bienvenu, C. Herry, Prefrontal parvalbumin interneurons shape neuronal activity to drive fear expression. Nature 505, 92–96 (2014).
47. S. J. Cruikshank, T. J. Lewis, B. W. Connors, Synaptic basis for intense thalamocortical activation of feedforward inhibitory cells in neocortex. Nat. Neurosci. 10, 462–468 (2007).
48. V. S. Sohal, F. Zhang, O. Yizhar, K. Deisseroth, Parvalbumin neurons and gamma rhythms enhance cortical circuit performance. Nature 459, 698–702 (2009).
49. J. R. Martínez-François, M. C. Fernández-Agüera, N. Nathwani, C. Lahmann, V. L. Burnham, N. N. Danial, G. Yellen, BAD and KATP channels regulate neuron excitability and epileptiform activity. eLife 7, e32721 (2018).
50. C. Zawar, T. Plant, C. Schirra, A. Konnerth, B. Neumcke, Cell-type specific expression of ATP-sensitive potassium channels in the rat hippocampus. J. Physiol. 514, 327 (1999).
51. C. Nichols, W. Lederer, M. Cannell, ATP dependence of KATP channel kinetics in isolated membrane patches from rat ventricle. Biophys. J. 60, 1164–1177 (1991).
52. M. M. Shah, Cortical HCN channels: Function, trafficking and plasticity. J. Physiol. 592, 2711–2719 (2014).
53. T. S. McDonald, K. N. Tan, M. P. Hodson, K. Borges, Alterations of hippocampal glucose metabolism by even versus uneven medium chain triglycerides. J. Cereb. Blood Flow Metab. 34, 153–160 (2014).
54. T. S. McDonald, M. Puchowicz, K. Borges, Impairments in oxidative glucose metabolism in epilepsy and metabolic treatments thereof. Front. Cell. Neurosci. 12, 274 (2018).
55. D. Wilbur, M. Patel, Development of mitochondrial pyruvate metabolism in rat brain. J. Neurochem. 22, 709–715 (1974).
56. G. M. Chowdhury, A. B. Patel, G. F. Mason, D. L. Rothman, K. L. Behar, Glutamatergic and GABAergic neurotransmitter cycling and energy metabolism in rat cerebral cortex during postnatal development. J. Cereb. Blood Flow Metab. 27, 1895–1907 (2007).
57. N. H. Jeoung, P. Wu, M. A. Joshi, J. Jaskiewicz, C. B. Bock, A. A. Depaoli-Roach, R. A. Harris, Role of pyruvate dehydrogenase kinase isoenzyme 4 (PDHK4) in glucose homoeostasis during starvation. Biochem. J. 397, 417–425 (2006).
58. A. Kumar, A. Prakash, S. Dogra, Centella asiatica attenuates D-galactose-induced cognitive impairment, oxidative and mitochondrial dysfunction in mice. Int. J. Alzheimers Dis. 2011, 347569 (2011).
59. M. S. Patel, L. G. Korotchkina, in Oxidative Stress Biomarkers and Antioxidant Protocols (Springer, 2002), pp. 255–263.
60. R. S. Kombu, H. Brunengraber, M. A. Puchowicz, Analysis of the citric acid cycle intermediates using gas chromatography-mass spectrometry. Methods Mol. Biol. 708, 147–157 (2011).
61. E. A. Maher, I. Marin-Valencia, R. M. Bachoo, T. Mashimo, J. Raisanen, K. J. Hatanpaa, A. Jindal, F. M. Jeffrey, C. Choi, C. Madden, D. Mathews, J. M. Pascual, B. E. Mickey, C. R. Malloy, R. J. DeBerardinis, Metabolism of [U-13C]glucose in human brain tumors in vivo. NMR Biomed. 25, 1234–1244 (2012).
62. C. A. Schneider, W. S. Rasband, K. W. Eliceiri, NIH image to ImageJ: 25 years of image analysis. Nat. Methods 9, 671–675 (2012).
63. C. R. Malloy, J. R. Thompson, F. M. Jeffrey, A. D. Sherry, Contribution of exogenous substrates to acetyl coenzyme A: Measurement by 13C NMR under non-steady-state conditions. Biochemistry 29, 6756–6761 (2002).
64. R. Q. Quiroga, Z. Nadasdy, Y. Ben-Shaul, Unsupervised spike detection and sorting with wavelets and superparamagnetic clustering. Neural Comput. 16, 1661–1687 (2004).
65. L. F. McNair, R. Kornfelt, A. B. Walls, J. V. Andersen, B. I. Aldana, J. D. Nissen, A. Schousboe, H. S. Waagepetersen, Metabolic characterization of acutely isolated hippocampal and cerebral cortical slices using [U-13C]glucose and [1,2-13C] acetate as substrates. Neurochem. Res. 42, 810–826 (2017).
66. S. zur Nedden, S. Hawley, N. Pentland, D. G. Hardie, A. S. Doney, B. G. Frenguelli, Intracellular ATP influences synaptic plasticity in area CA1 of rat hippocampus via metabolism to adenosine and activity-dependent activation of adenosine A1 receptors. J. Neurosci. 31, 6221–6234 (2011).
67. L. O. Trussell, M. B. Jackson, Dependence of an adenosine-activated potassium current on a GTP-binding protein in mammalian central neurons. J. Neurosci. 7, 3306–3316 (1987).
68. S.-P. Wang, D. Zhou, Z. Yao, S. Satapati, Y. Chen, N. A. Daurio, A. Petrov, X. Shen, D. Metzger, W. Yin, A. R. Nawrocki, G. J. Eiermann, J. Hwa, C. Fancourt, C. Miller, K. Herath, T. P. Roddy, D. Slipetz, M. D. Erion, S. F. Previs, D. E. Kelley, Quantifying rates of glucose production in vivo following an intraperitoneal tracer bolus. Am. J. Physiol. Endocrinol. Metab. 311, E911–E921 (2016).
69. J. M. Duarte, R. A. Cunha, R. A. Carvalho, Different metabolism of glutamatergic and GABAergic compartments in superfused hippocampal slices characterized by nuclear magnetic resonance spectroscopy. Neuroscience 144, 1305–1313 (2007).
70. C. R. Malloy, A. D. Sherry, F. M. Jeffrey, Evaluation of carbon flux and substrate selection through alternate pathways involving the citric acid cycle of the heart by 13C NMR spectroscopy. J. Bio. Chem. 263, 6964–6971 (1988).
71. F. M. Jeffrey, I. Marin-Valencia, L. B. Good, A. A. Shestov, P.-G. Henry, J. M. Pascual, C. R. Malloy, Modeling of brain metabolism and pyruvate compartmentation using 13C NMR in vivo: Caution required. J. Cereb. Blood Flow Metab. 33, 1160–1167 (2013).
72. A. B. Patel, R. A. de Graaf, D. L. Rothman, K. L. Behar, G. F. Mason, Evaluation of cerebral acetate transport and metabolic rates in the rat brain in vivo using 1H-[13C]-NMR. J. Cereb. Blood Flow Metab. 30, 1200–1213 (2010).
73. G. M. I. Chowdhury, M. Gupta, K. M. Gibson, A. B. Patel, K. L. Behar, Altered cerebral glucose and acetate metabolism in succinic semialdehyde dehydrogenase-deficient mice: Evidence for glial dysfunction and reduced glutamate/glutamine cycling. J. Neurochem. 103, 2077–2091 (2007).
74. D. K. Deelchand, A. A. Shestov, D. M. Koski, K. Uğurbil, P.-G. Henry, Acetate transport and utilization in the rat brain. J. Neurochem. 109 (suppl. 1), 46–54 (2009).
75. N. Cullen, P. L. Carten, Electrophysiological actions of acetate, a metabolite of ethanol, on hippocampal dentate granule neurons: Interactions with adenosine. Brain Res. 588, 49–57 (1992).
by guest on May 12, 2020
http://stm.sciencem
ag.org/D
ownloaded from

Jakkamsetti et al., Sci. Transl. Med. 11, eaan0457 (2019) 20 February 2019
S C I E N C E T R A N S L A T I O N A L M E D I C I N E | R E S E A R C H A R T I C L E
16 of 16
Acknowledgments: We thank The Once Upon a Time Foundation for supporting this work and E. Kavalali, J. Gibson, and J. Meeks for advice on electrophysiological experiments. Funding: The study was supported by NIH grants NS077015 and NS102588 to J.M.P., Southwestern NMR Center grant EB015908 to C.R.M., and Mouse Metabolic Phenotypic Center at Case Western Reserve University grant DK076174 to H. Brunengraber. Author contributions: All authors contributed to the experimental design, data interpretation, and critical revision of the manuscript. In addition, Q.M. was responsible for the Cre-lox Pdha1 knockdown mouse model and immunohistochemistry, mouse survival analysis, and enzyme assay. V.J. was responsible for mouse in vivo and brain slice electrophysiology, machine learning, and human EEG analyses. I.M.-V. was responsible for GC-MS, NMR, and Western blotting. L.B.G. contributed to mouse EEG recording and analysis. T.T. contributed to in vivo mouse electrophysiological recording and human survival analysis. K.P., C.K., and M.A.H. contributed to NMR data acquisition and analysis. C.S. contributed to human EEG analysis. V.J., I.M.-V., Q.M., and J.M.P. wrote sections of the manuscript. J.M.P. was responsible for study conception, funding acquisition, project administration and supervision, and final
manuscript redaction. Competing interests: The authors declare that they have no competing interests. Data and materials availability: The flox-PDH mouse is available from Jackson Laboratories (Pdha1tm1Ptl). All the data for this study are present in the main text or in the Supplementary Materials.
Submitted 2 March 2017Resubmitted 25 September 2018Accepted 31 January 2019Published 20 February 201910.1126/scitranslmed.aan0457
Citation: V. Jakkamsetti, I. Marin-Valencia, Q. Ma, L. B. Good, T. Terrill, K. Rajasekaran, K. Pichumani, C. Khemtong, M. A. Hooshyar, C. Sundarrajan, M. S. Patel, R. M. Bachoo, C. R. Malloy, J. M. Pascual, Brain metabolism modulates neuronal excitability in a mouse model of pyruvate dehydrogenase deficiency. Sci. Transl. Med. 11, eaan0457 (2019).
by guest on May 12, 2020
http://stm.sciencem
ag.org/D
ownloaded from
dehydrogenase deficiencyBrain metabolism modulates neuronal excitability in a mouse model of pyruvate
Malloy and Juan M. PascualChalermchai Khemtong, M. Ali Hooshyar, Chandrasekhar Sundarrajan, Mulchand S. Patel, Robert M. Bachoo, Craig R. Vikram Jakkamsetti, Isaac Marin-Valencia, Qian Ma, Levi B. Good, Tyler Terrill, Karthik Rajasekaran, Kumar Pichumani,
DOI: 10.1126/scitranslmed.aan0457, eaan0457.11Sci Transl Med
Administration of acetate, an alternative metabolic substrate, restored TCA activity and reduced seizure duration.tricarboxylic acid (TCA) cycle flux and decreased excitability in a population of putative inhibitory neurons.human disease. The authors found that seizure activity was mediated by reduction of the mitochondrial
. developed a mouse model of PDHD recapitulating the neurological symptoms of theet alissue, Jakkamsetti However, the mechanisms responsible for the increased brain excitability are mostly unknown. To address thissymptoms of PDHD are predominantly neurological, and patients develop intractable epilepsy early in infancy.
Pyruvate dehydrogenase deficiency (PDHD) is a rare disorder caused by altered glucose metabolism. TheAn alternative energy source for PDHD
ARTICLE TOOLS http://stm.sciencemag.org/content/11/480/eaan0457
MATERIALSSUPPLEMENTARY http://stm.sciencemag.org/content/suppl/2019/02/15/11.480.eaan0457.DC1
CONTENTRELATED
http://stm.sciencemag.org/content/scitransmed/10/443/eaar3796.fullhttp://stm.sciencemag.org/content/scitransmed/9/413/eaao4583.fullhttp://stm.sciencemag.org/content/scitransmed/9/419/eaal2332.fullhttp://stm.sciencemag.org/content/scitransmed/10/454/eaar2718.full
REFERENCES
http://stm.sciencemag.org/content/11/480/eaan0457#BIBLThis article cites 72 articles, 11 of which you can access for free
PERMISSIONS http://www.sciencemag.org/help/reprints-and-permissions
Terms of ServiceUse of this article is subject to the
registered trademark of AAAS. is aScience Translational MedicineScience, 1200 New York Avenue NW, Washington, DC 20005. The title
(ISSN 1946-6242) is published by the American Association for the Advancement ofScience Translational Medicine
of Science. No claim to original U.S. Government WorksCopyright © 2019 The Authors, some rights reserved; exclusive licensee American Association for the Advancement
by guest on May 12, 2020
http://stm.sciencem
ag.org/D
ownloaded from