Embed Size (px)
Citation preview
Pyramids and Texture
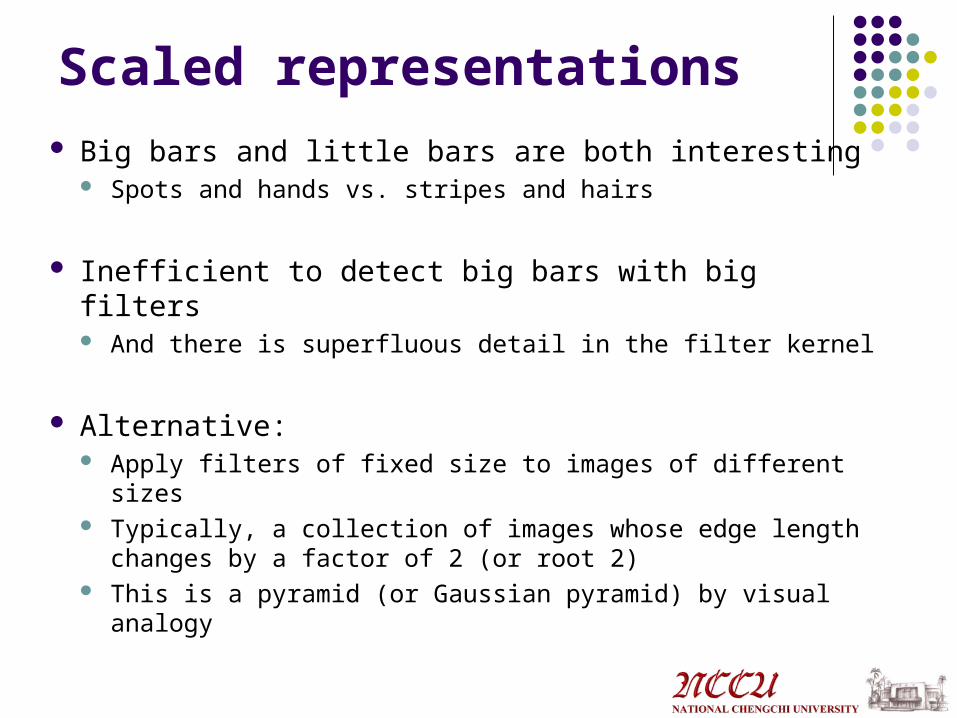
Scaled representations
Big bars and little bars are both interesting Spots and hands vs. stripes and hairs
Inefficient to detect big bars with big filters And there is superfluous detail in the filter kernel
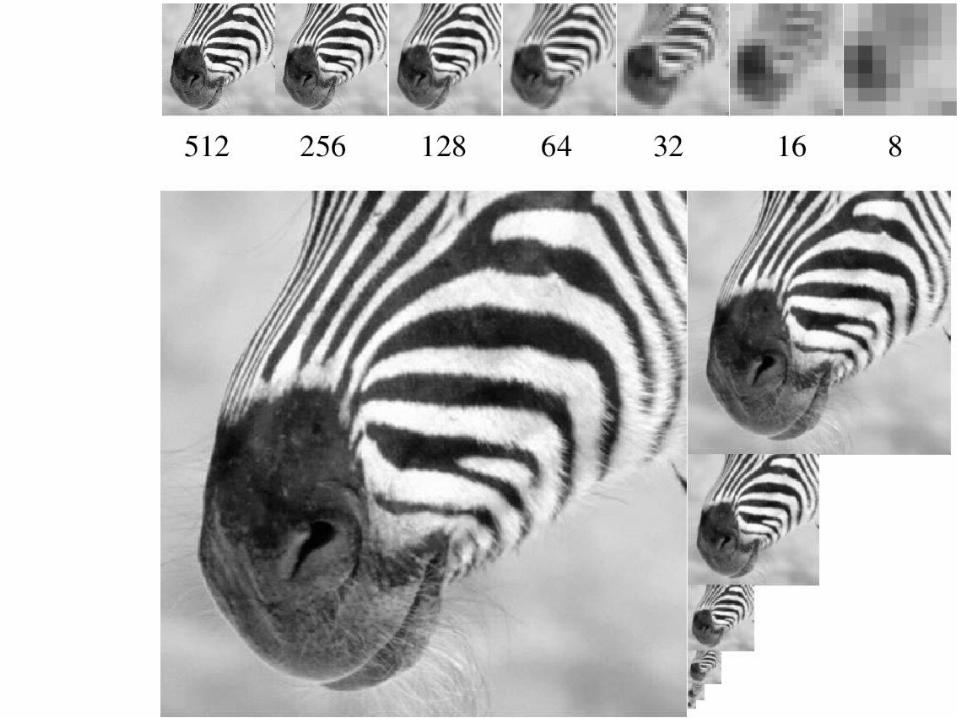
Alternative: Apply filters of fixed size to images of different sizes Typically, a collection of images whose edge length
changes by a factor of 2 (or root 2) This is a pyramid (or Gaussian pyramid) by visual analogy

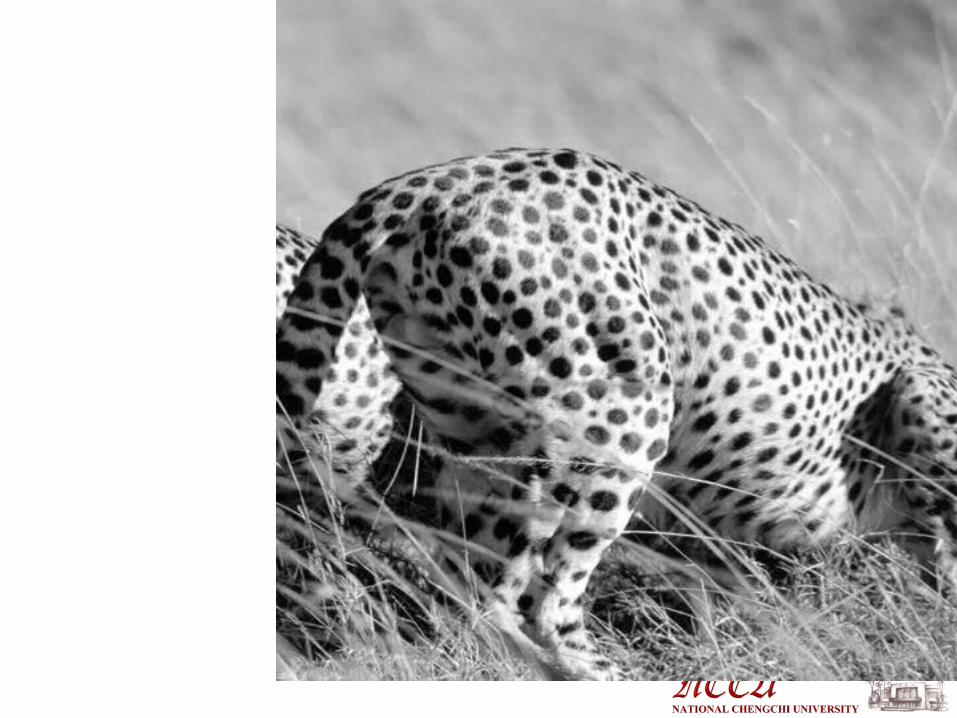
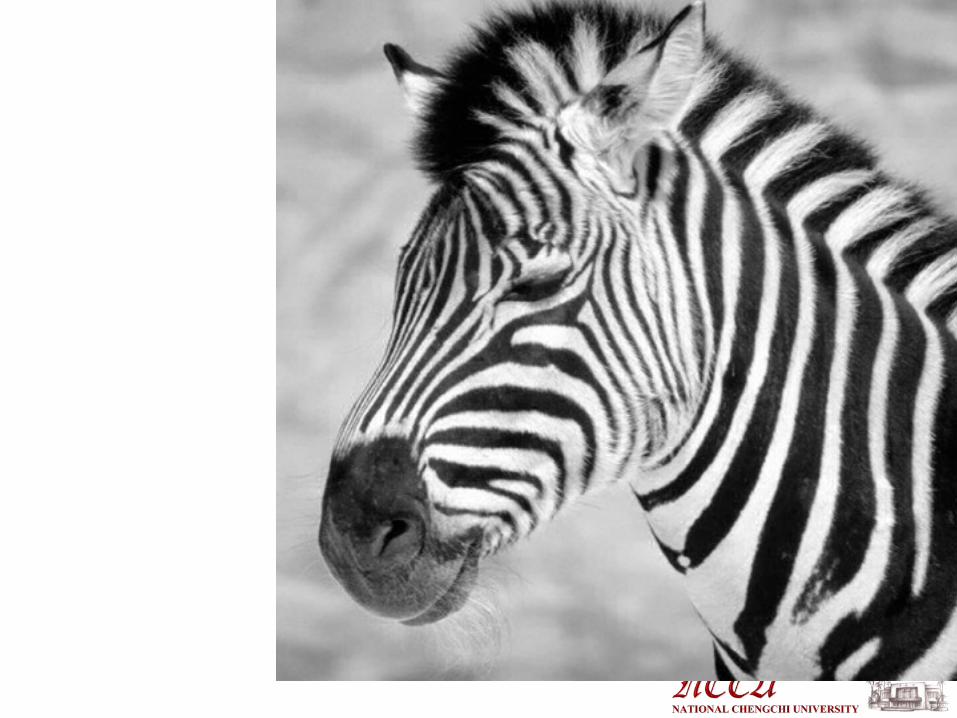
A bar in the big images is a hair on the zebra’s nose; in smaller images, a stripe; in the smallest, the animal’s nose
Aliasing
Can’t shrink an image by taking every second pixel
If we do, characteristic errors appear In the next few slides Typically, small phenomena look bigger; fast
phenomena can look slower Common phenomenon
Wagon wheels rolling the wrong way in movies Checkerboards misrepresented in ray tracing Striped shirts look funny on color television
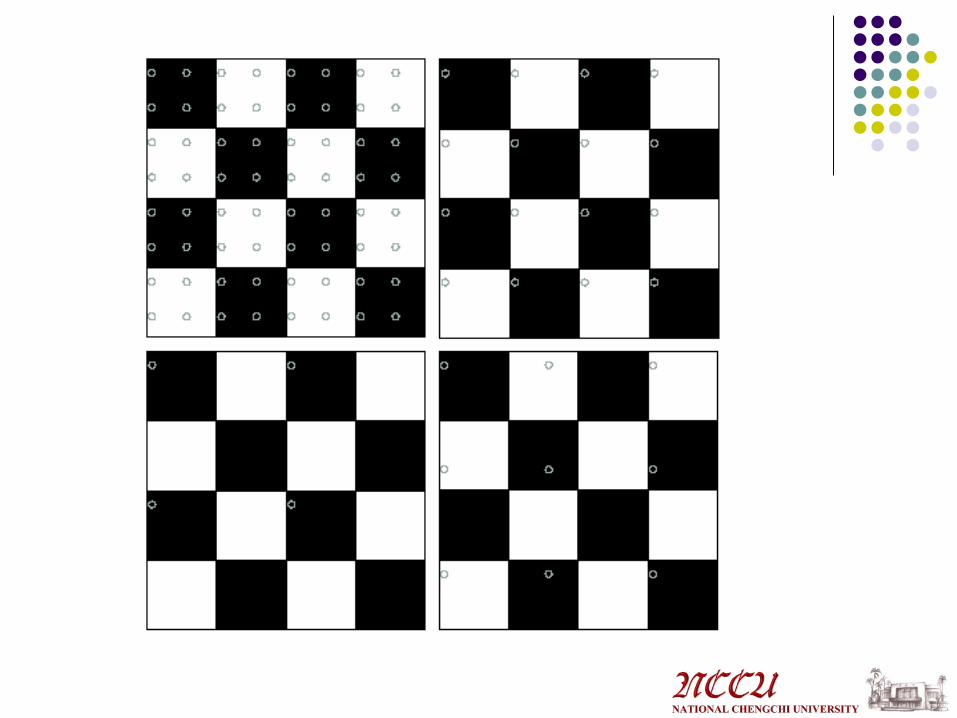
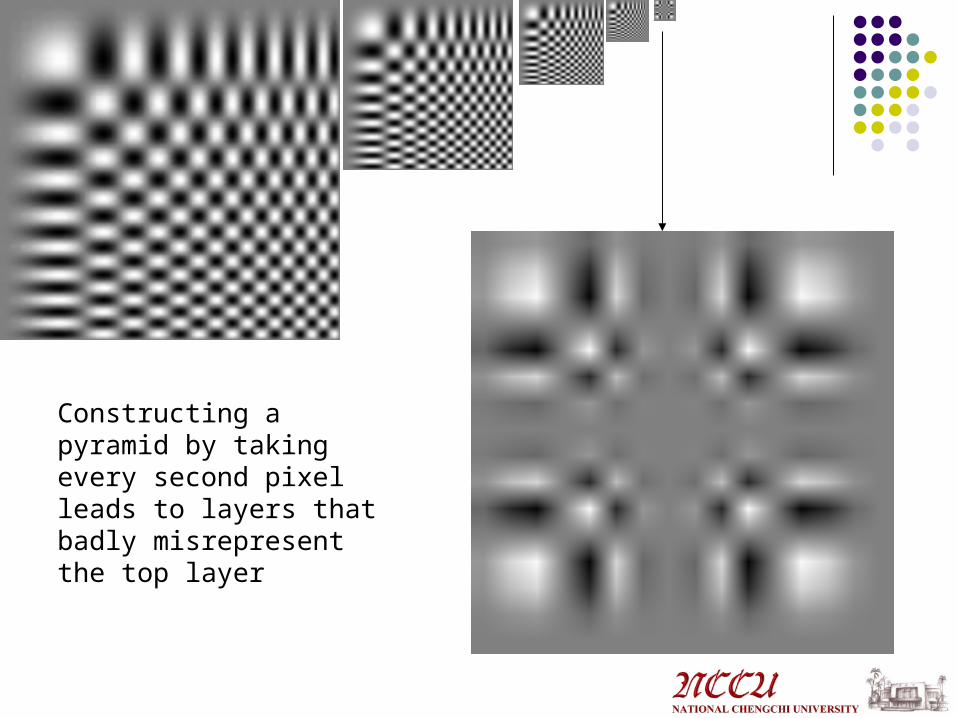
Constructing a pyramid by taking every second pixel leads to layers that badly misrepresent the top layer

Open questions
What causes the tendency of differentiation to emphasize noise?
In what precise respects are discrete images different from continuous images?
How do we avoid aliasing?
General thread: a language for fast changes
The Fourier Transform
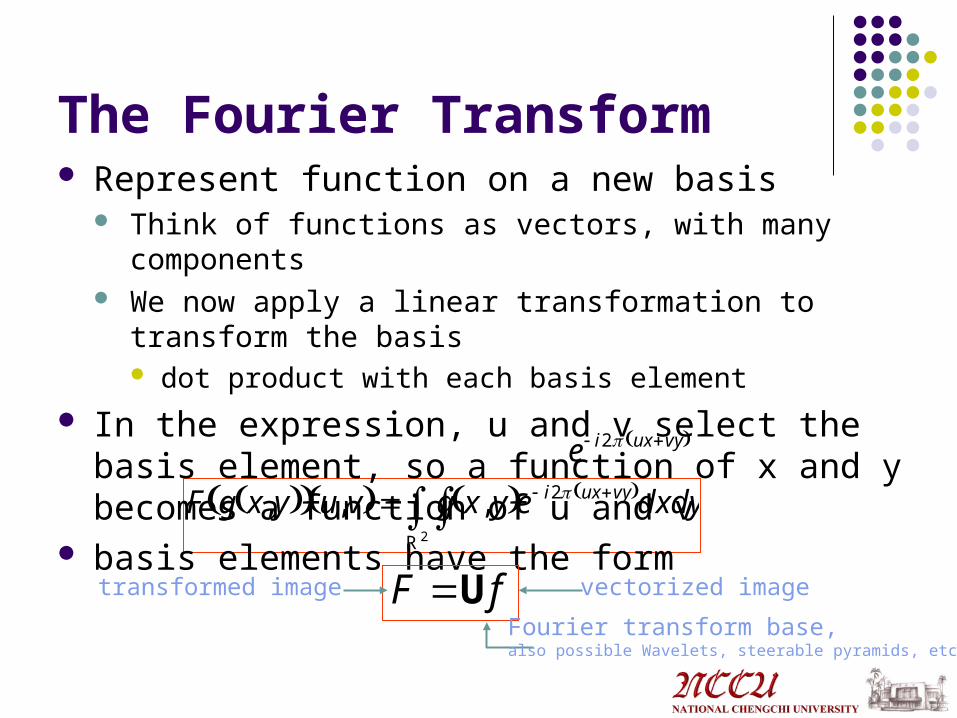
F g x,y u,v g x, y e i2 uxvy dxdyR 2
The Fourier Transform Represent function on a new basis
Think of functions as vectors, with many components We now apply a linear transformation to transform the basis
dot product with each basis element
In the expression, u and v select the basis element, so a function of x and y becomes a function of u and v
basis elements have the form
e i2 uxvy
fF U vectorized image
Fourier transform base,also possible Wavelets, steerable pyramids, etc.
transformed image
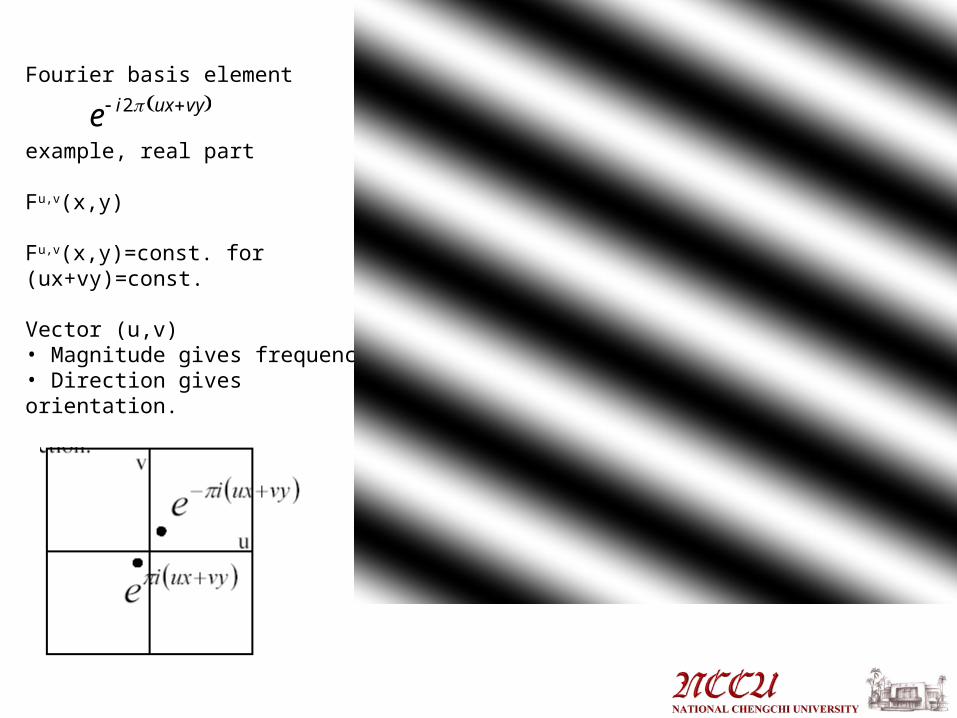
Fourier basis element
example, real part
Fu,v(x,y)
Fu,v(x,y)=const. for (ux+vy)=const.
Vector (u,v)• Magnitude gives frequency• Direction gives orientation.
e i2 uxvy
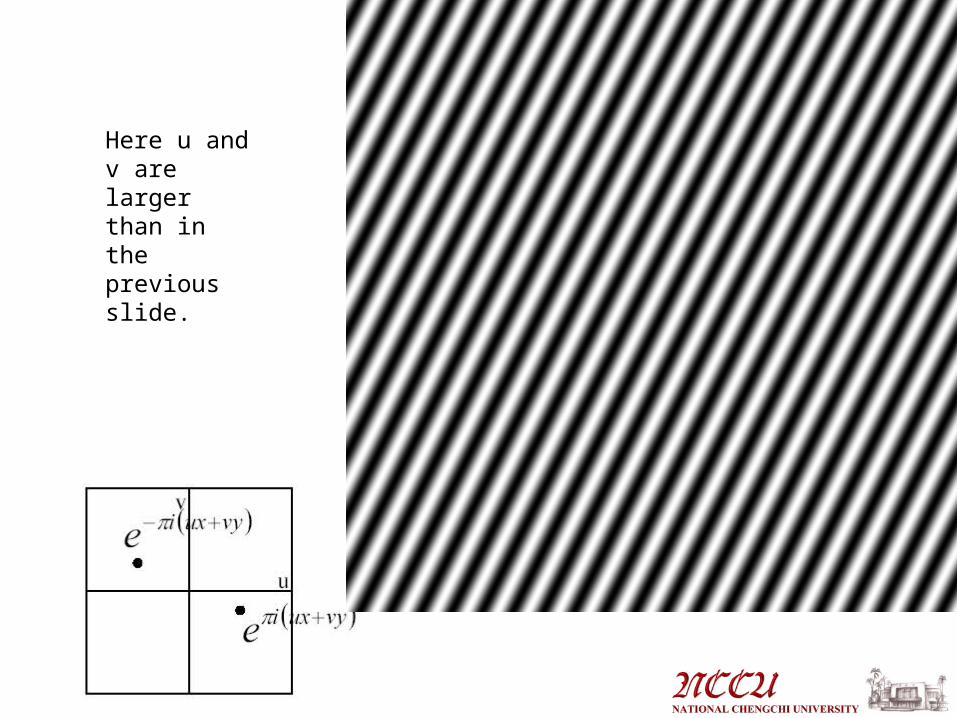
Here u and v are larger than in the previous slide.
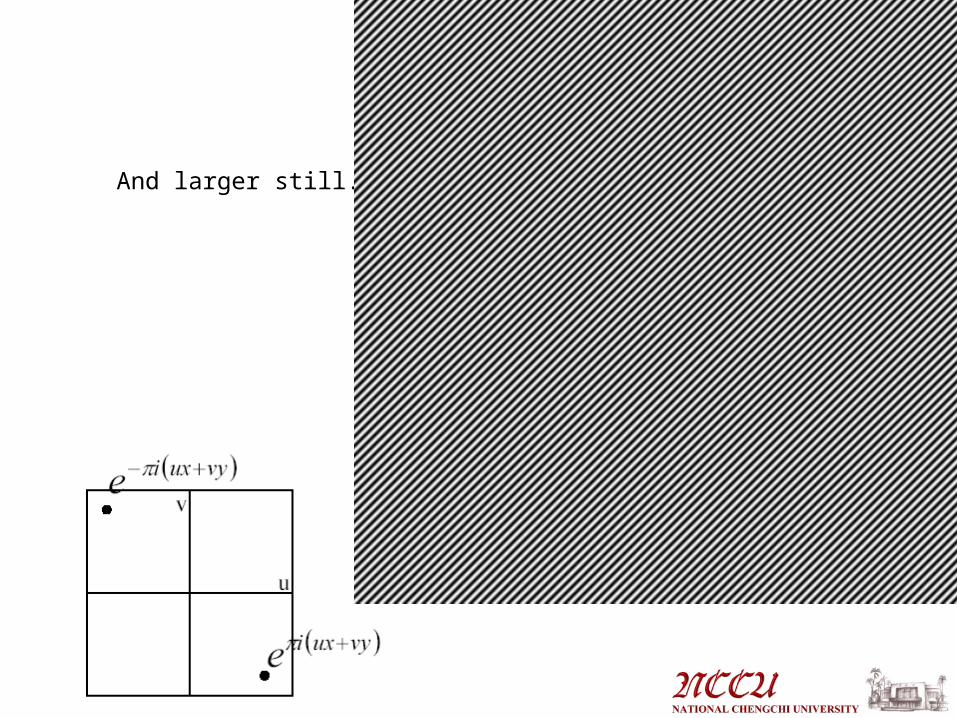
And larger still...
Phase and Magnitude
Fourier transform of a real function is complex difficult to plot, visualize instead, we can think of the phase and magnitude of the
transform
Phase is the phase of the complex transform Magnitude is the magnitude of the complex transform Curious fact
all natural images have about the same magnitude transform hence, phase seems to matter, but magnitude largely doesn’t
Demonstration Take two pictures, swap the phase transforms, compute the
inverse - what does the result look like?
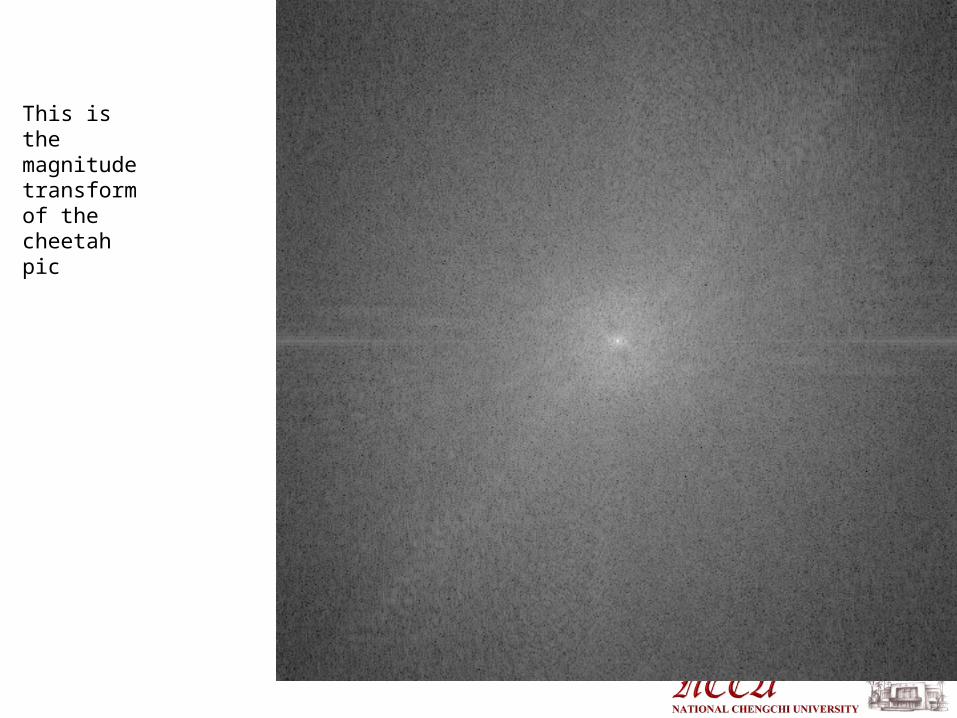
This is the magnitude transform of the cheetah pic
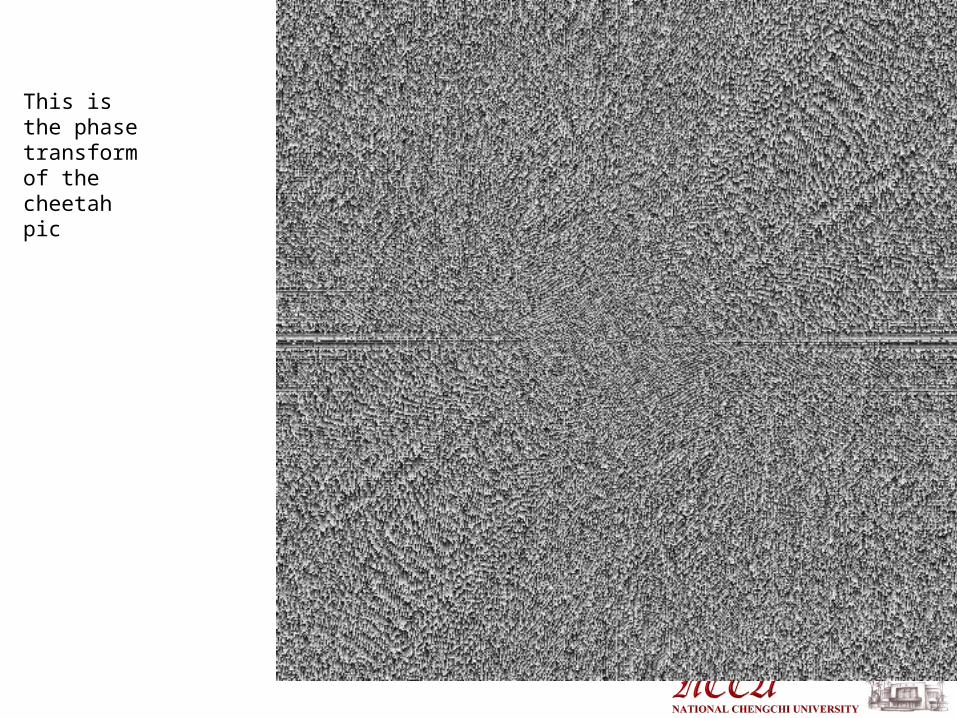
This is the phase transform of the cheetah pic
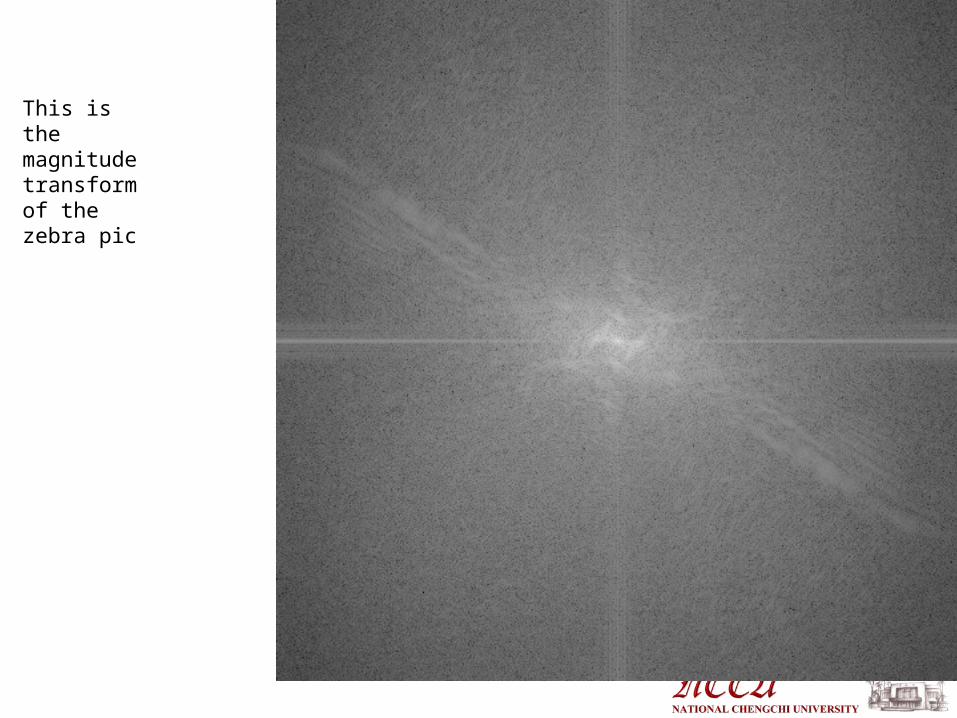
This is the magnitude transform of the zebra pic
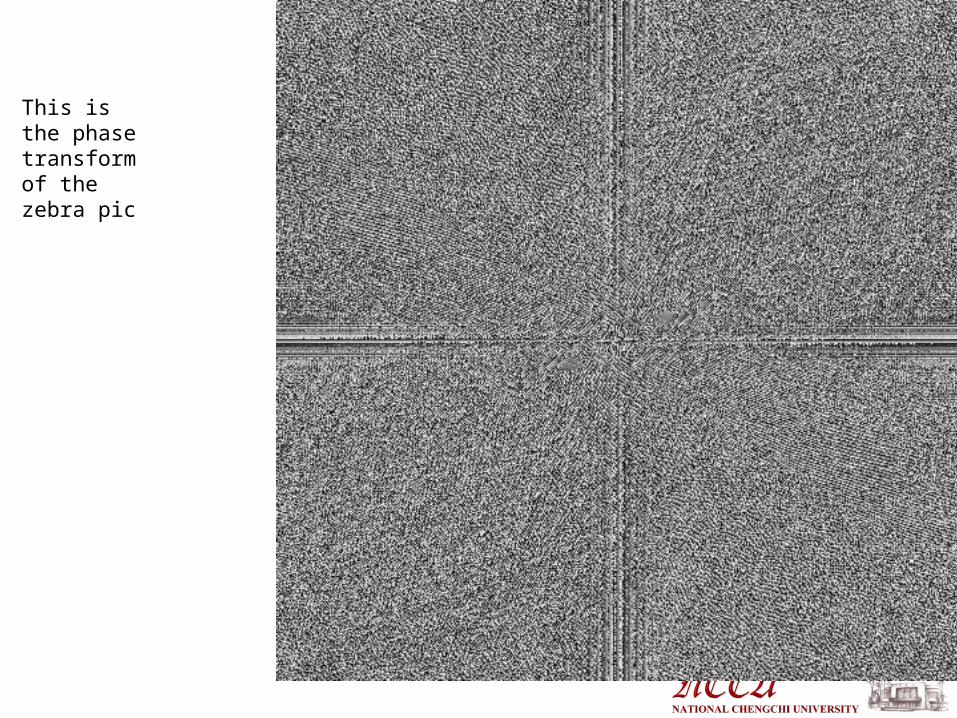
This is the phase transform of the zebra pic
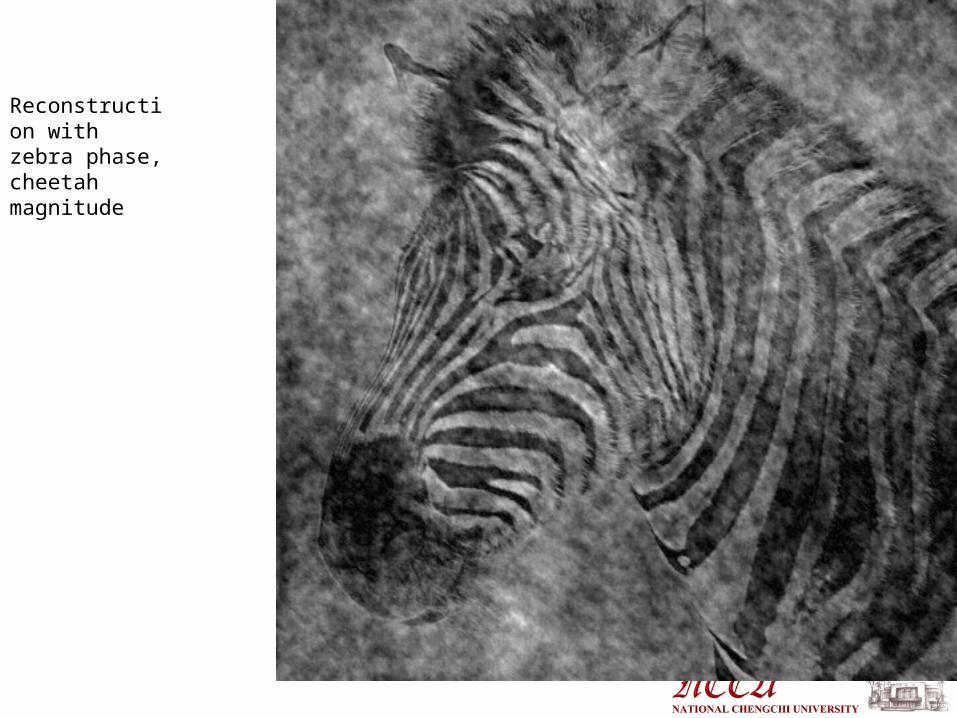
Reconstruction with zebra phase, cheetah magnitude
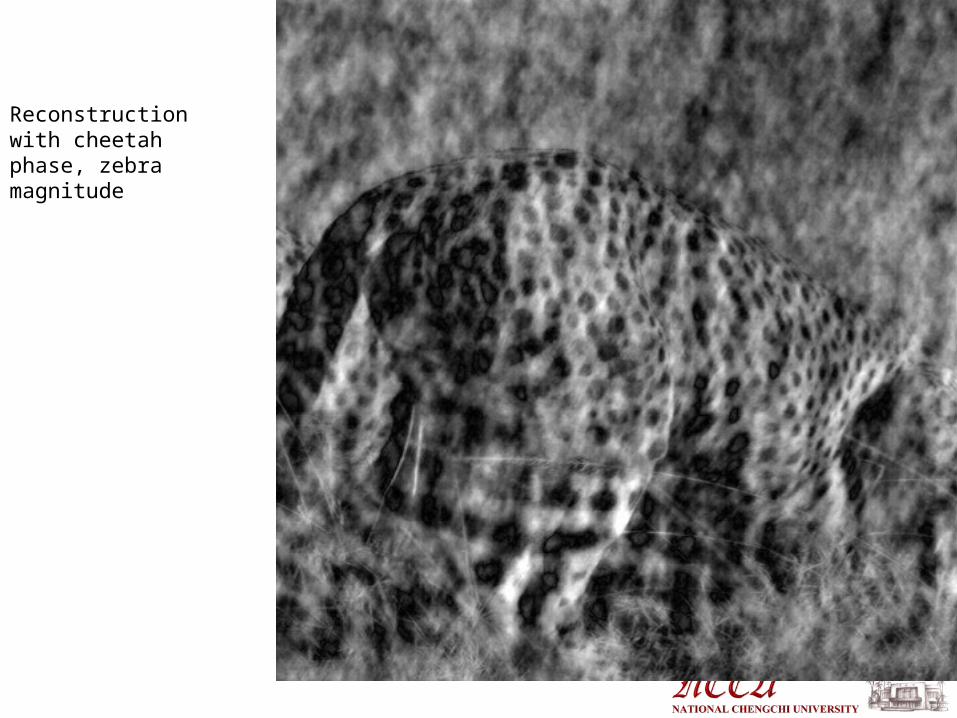
Reconstruction with cheetah phase, zebra magnitude
Smoothing as low-pass filtering The message of the FT is that high frequencies lead
to trouble with sampling. Solution: suppress high frequencies before sampling
multiply the FT of the signal with something that suppresses high frequencies
or convolve with a low-pass filter
A filter whose FT is a box is bad, because the filter kernel has infinite support
Common solution: use a Gaussian multiplying FT by Gaussian is equivalent to convolving image
with Gaussian.
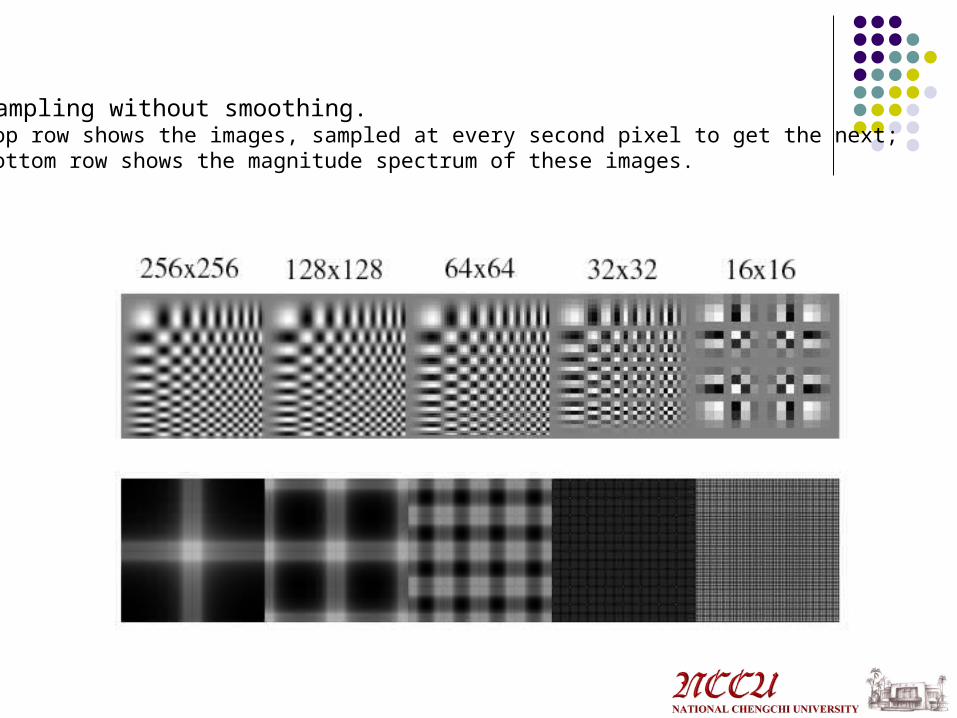
Sampling without smoothing. Top row shows the images, sampled at every second pixel to get the next; bottom row shows the magnitude spectrum of these images.
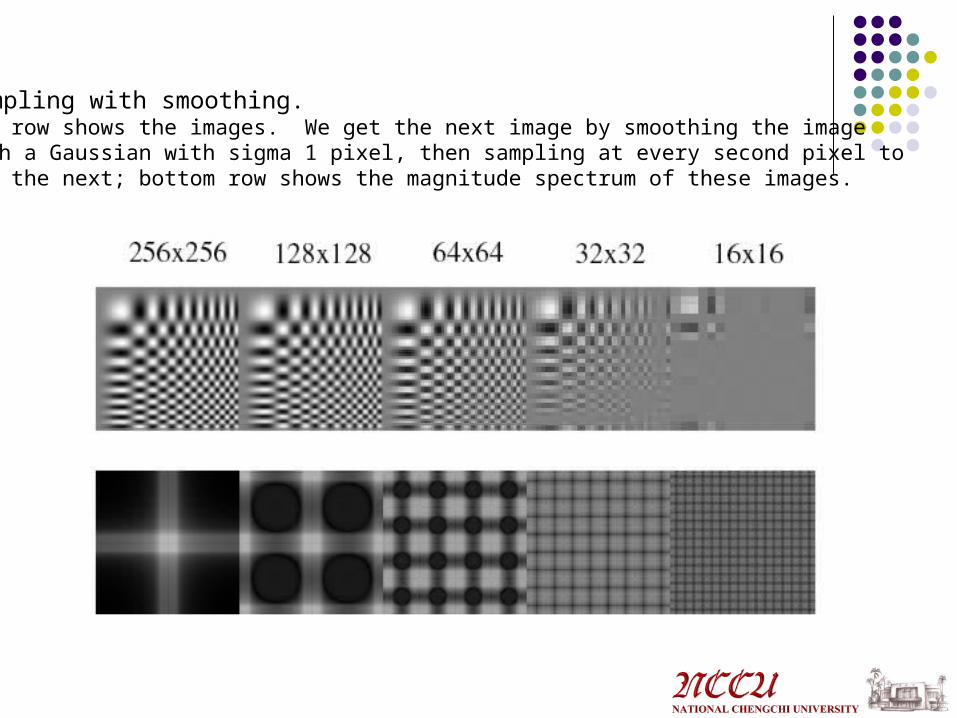
Sampling with smoothing. Top row shows the images. We get the next image by smoothing the image with a Gaussian with sigma 1 pixel, then sampling at every second pixel to get the next; bottom row shows the magnitude spectrum of these images.
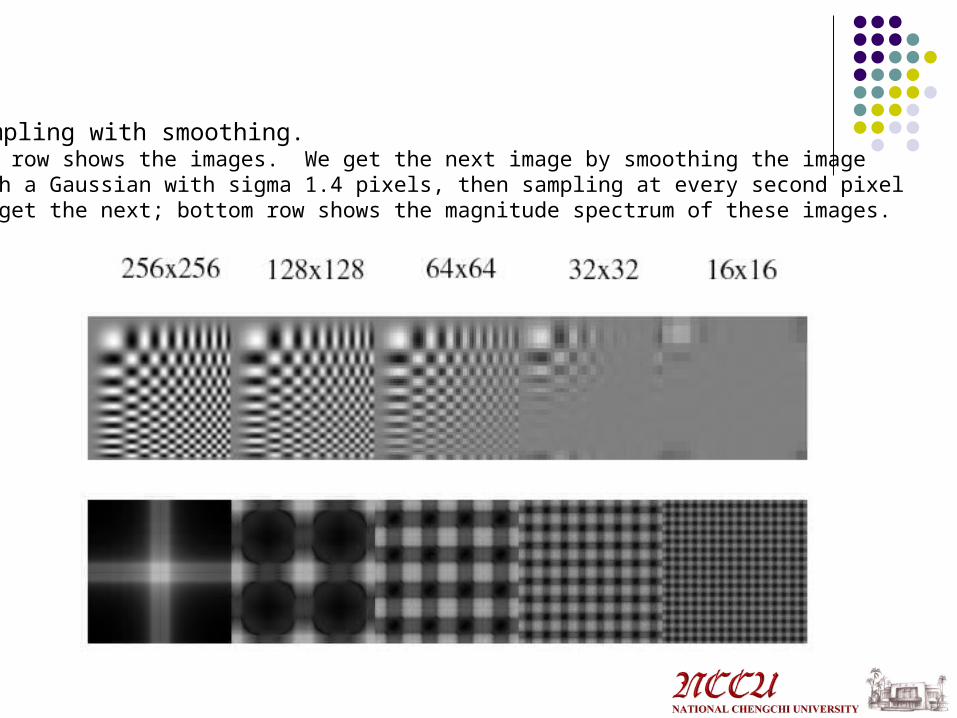
Sampling with smoothing. Top row shows the images. We get the next image by smoothing the image with a Gaussian with sigma 1.4 pixels, then sampling at every second pixel to get the next; bottom row shows the magnitude spectrum of these images.
Applications of scaled representations
Search for correspondence look at coarse scales, then refine with finer scales
Edge tracking a “good” edge at a fine scale has parents at a
coarser scale Control of detail and computational cost in
matching e.g. finding stripes terribly important in texture representation
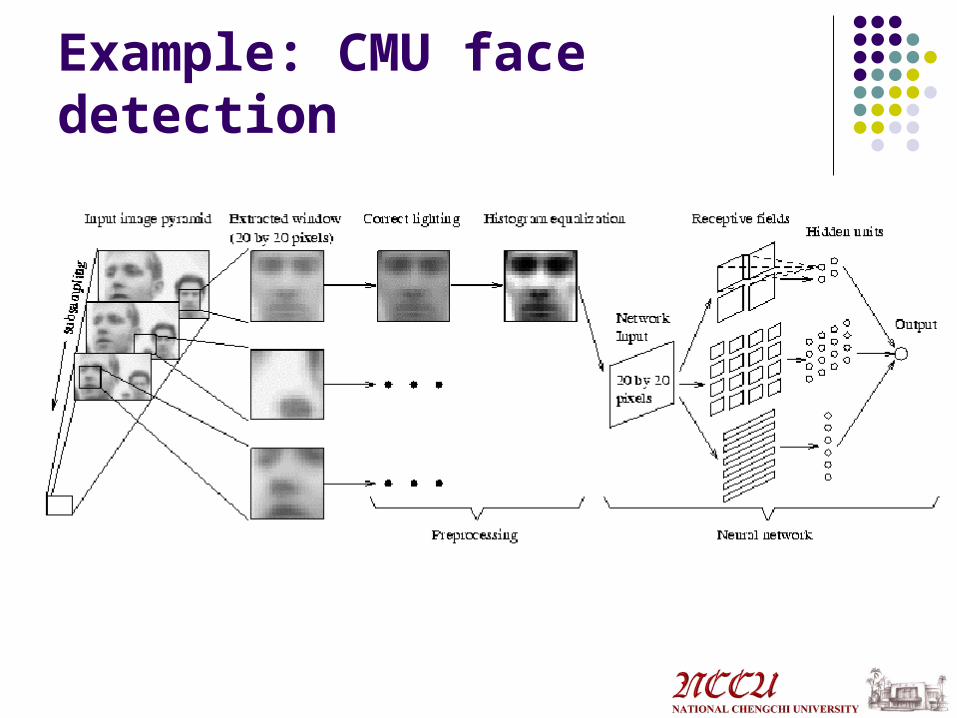
Example: CMU face detection
The Gaussian pyramid
Smooth with gaussians, because a gaussian*gaussian=another gaussian
Synthesis smooth and sample
Analysis take the top image
Gaussians are low pass filters, so representation is redundant

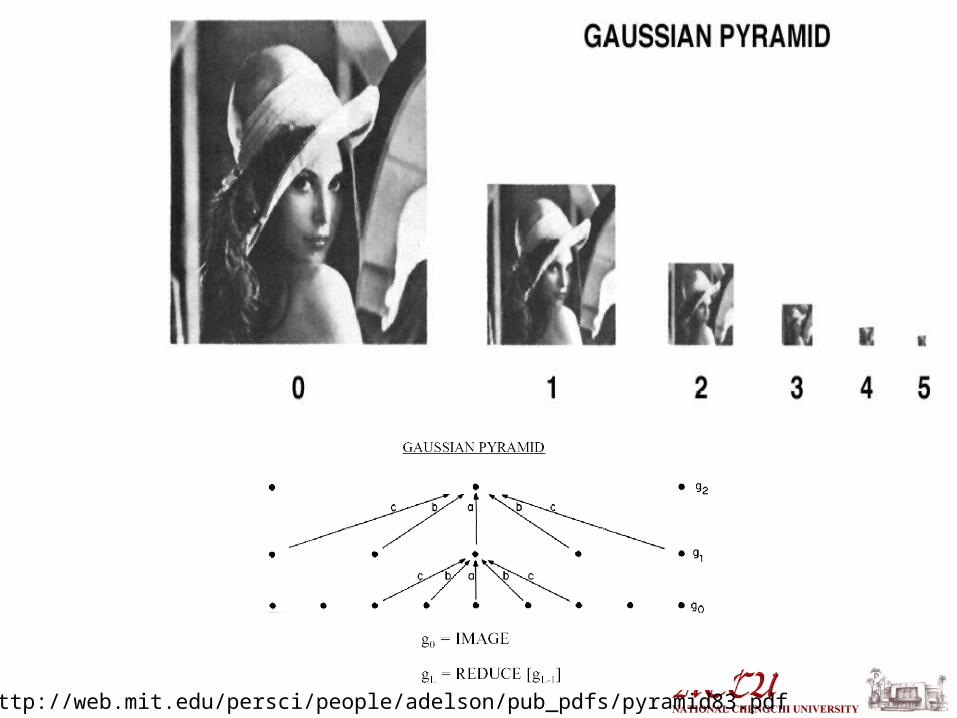
http://web.mit.edu/persci/people/adelson/pub_pdfs/pyramid83.pdf
Texture
Key issue: representing texture Texture based matching
little is known Texture segmentation
key issue: representing texture Texture synthesis
useful; also gives some insight into quality of representation
Shape from texture will skip discussion
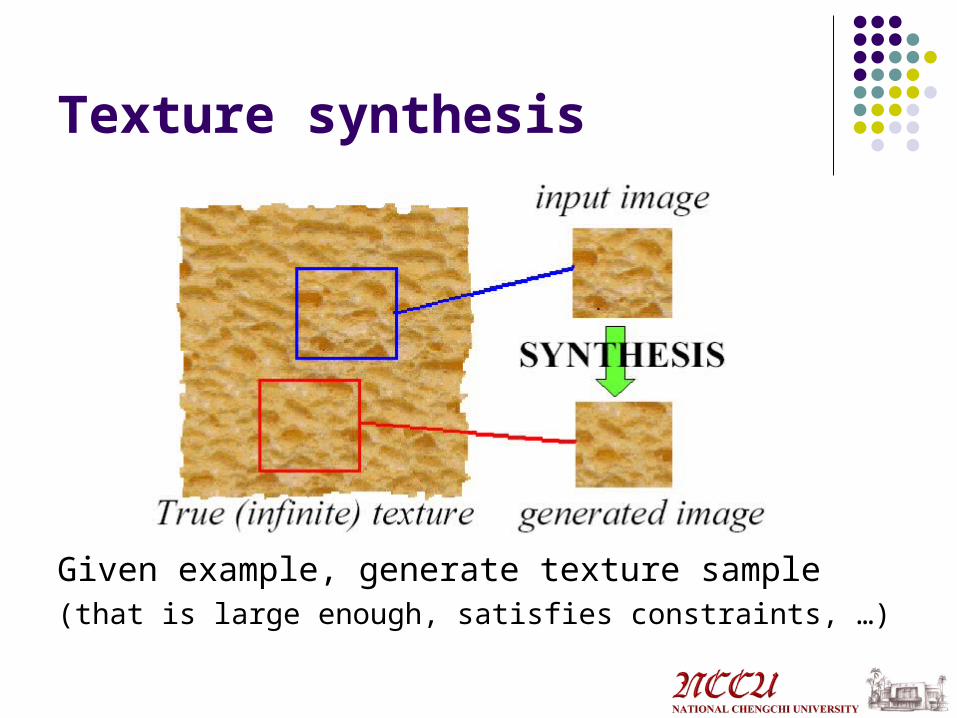
Texture synthesis
Given example, generate texture sample(that is large enough, satisfies constraints, …)
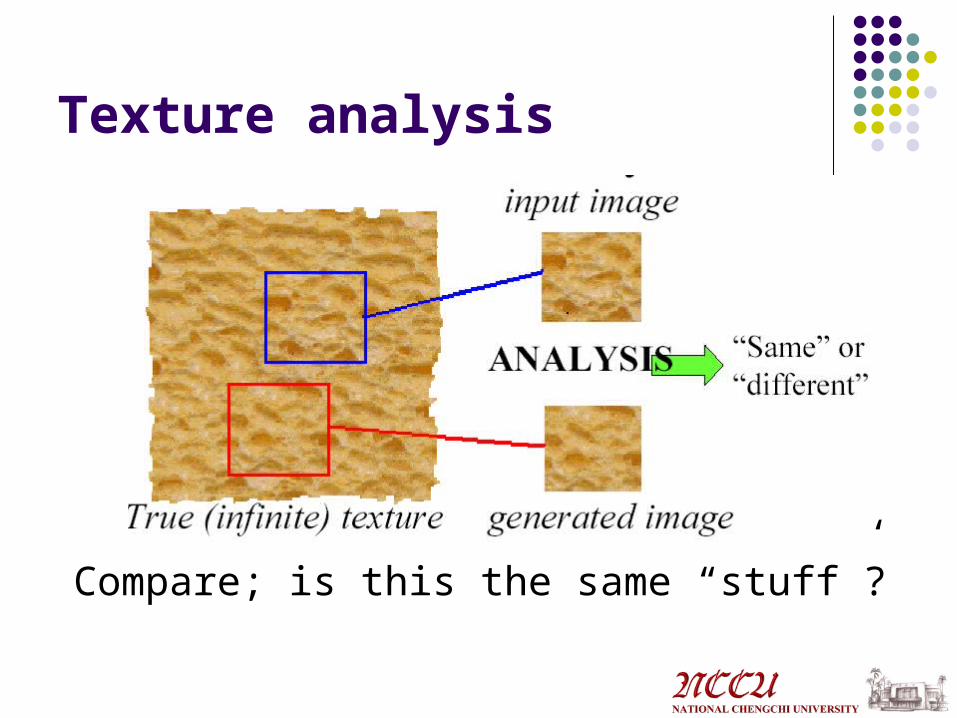
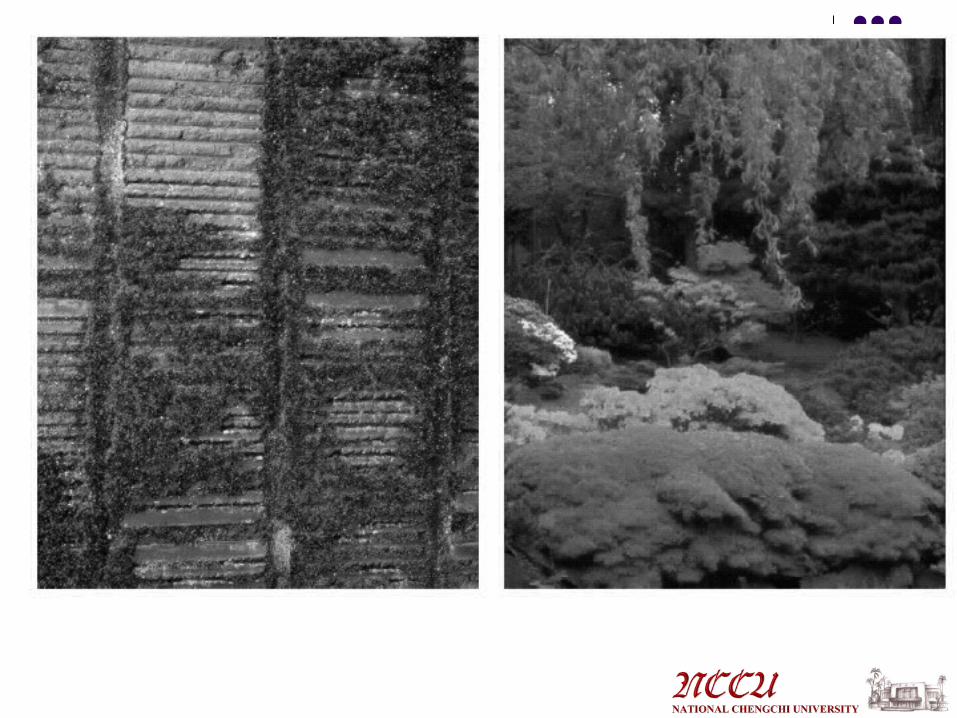
Texture analysis
Compare; is this the same “stuff”?
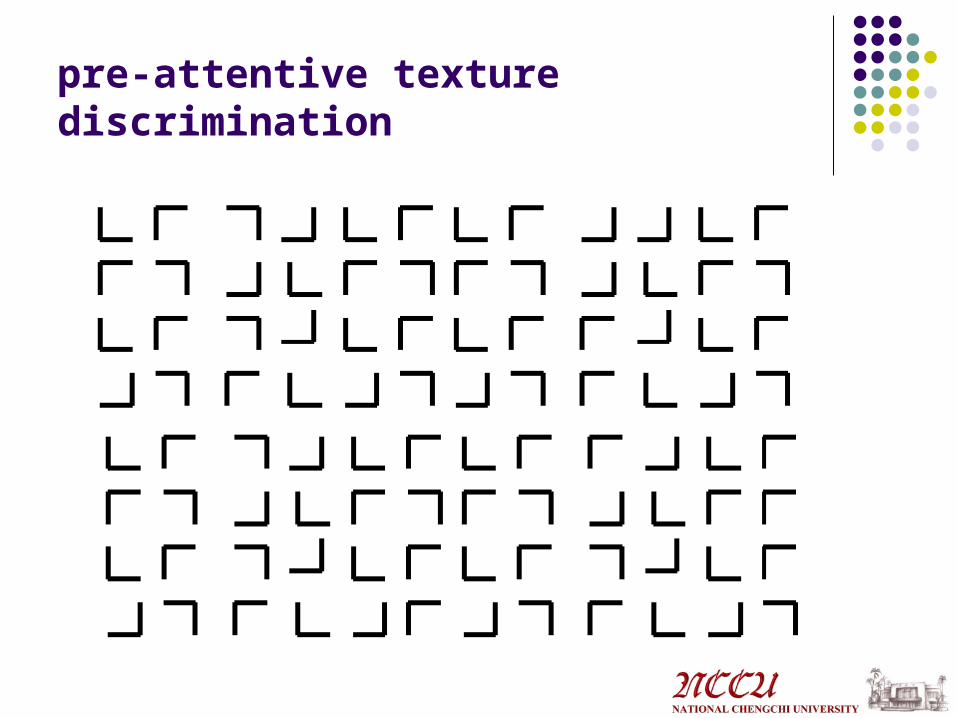
pre-attentive texture discrimination
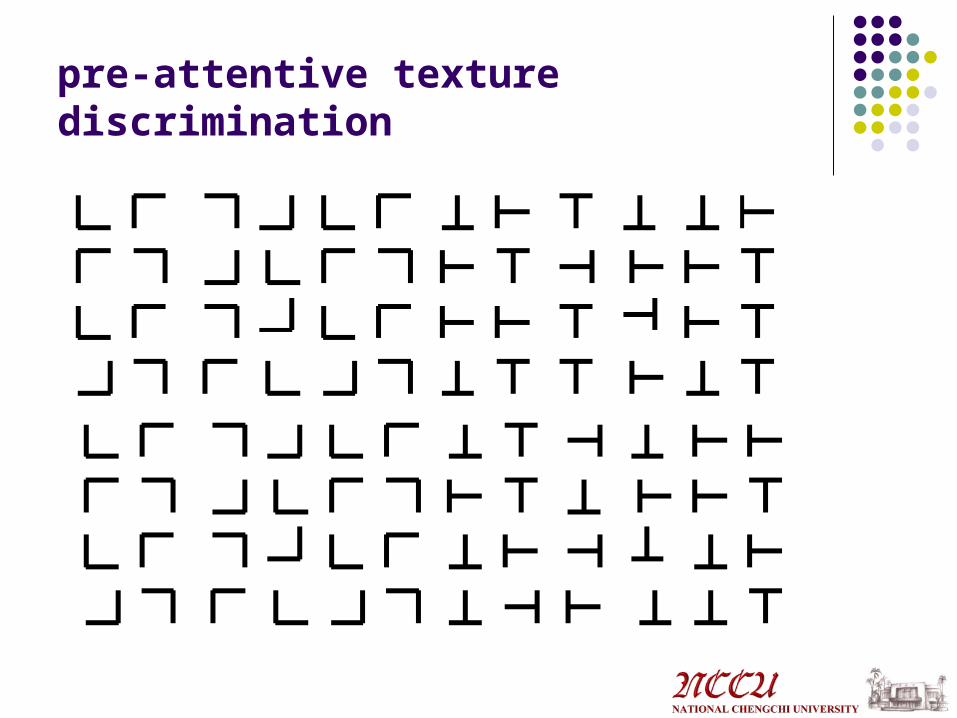
pre-attentive texture discrimination

pre-attentive texture discrimination
same or not?
pre-attentive texture discrimination
pre-attentive texture discrimination
same or not?
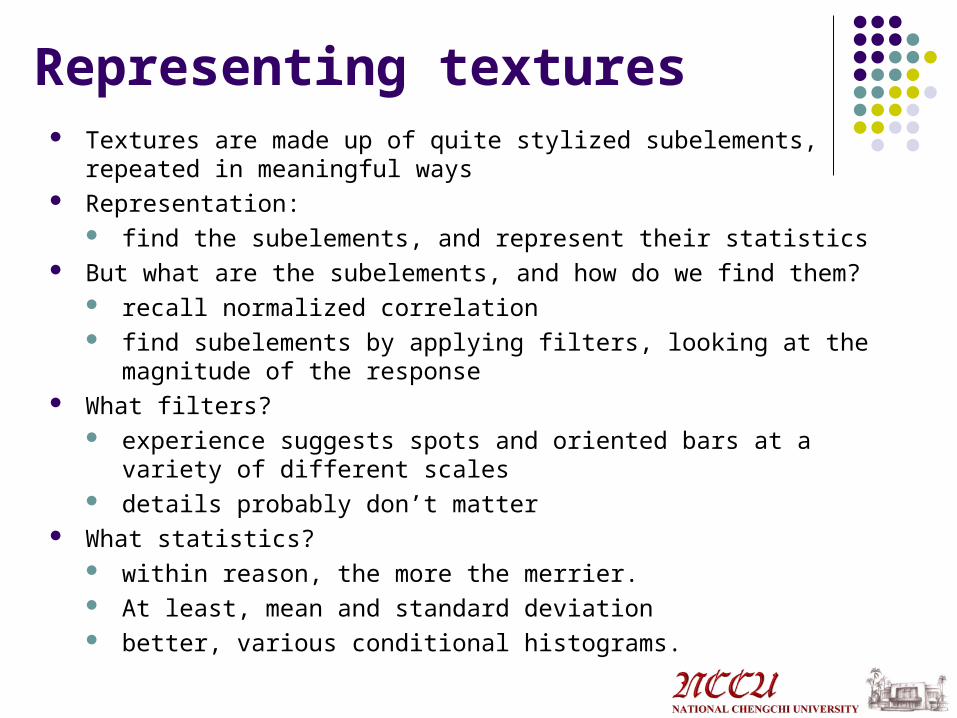
Representing textures Textures are made up of quite stylized subelements, repeated in meaningful
ways Representation:
find the subelements, and represent their statistics But what are the subelements, and how do we find them?
recall normalized correlation find subelements by applying filters, looking at the magnitude of the
response What filters?
experience suggests spots and oriented bars at a variety of different scales
details probably don’t matter What statistics?
within reason, the more the merrier. At least, mean and standard deviation better, various conditional histograms.
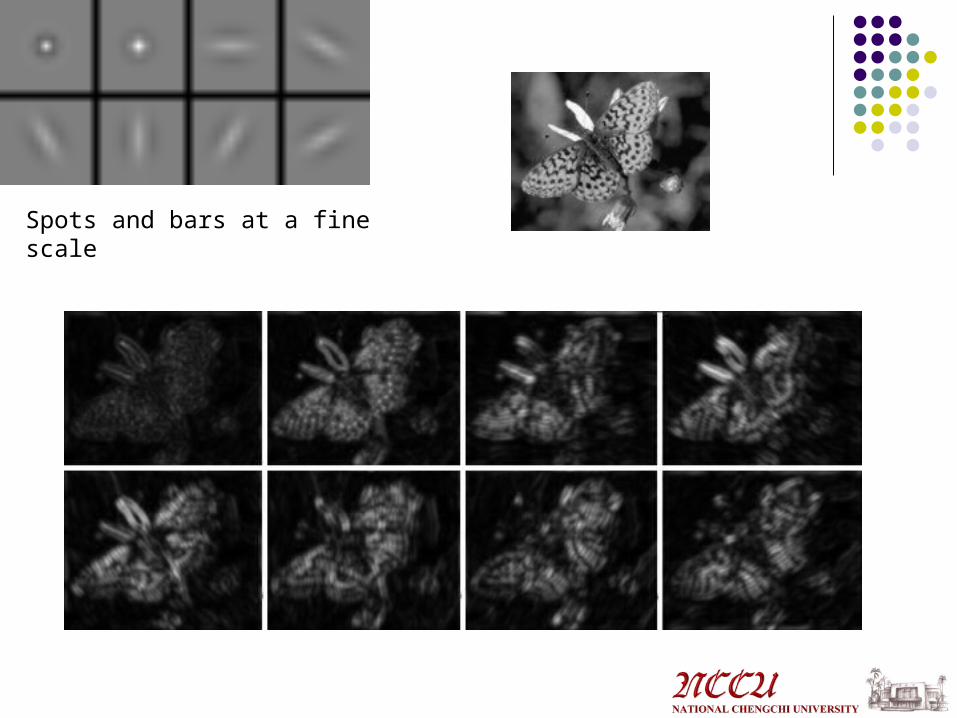
Spots and bars at a fine scale
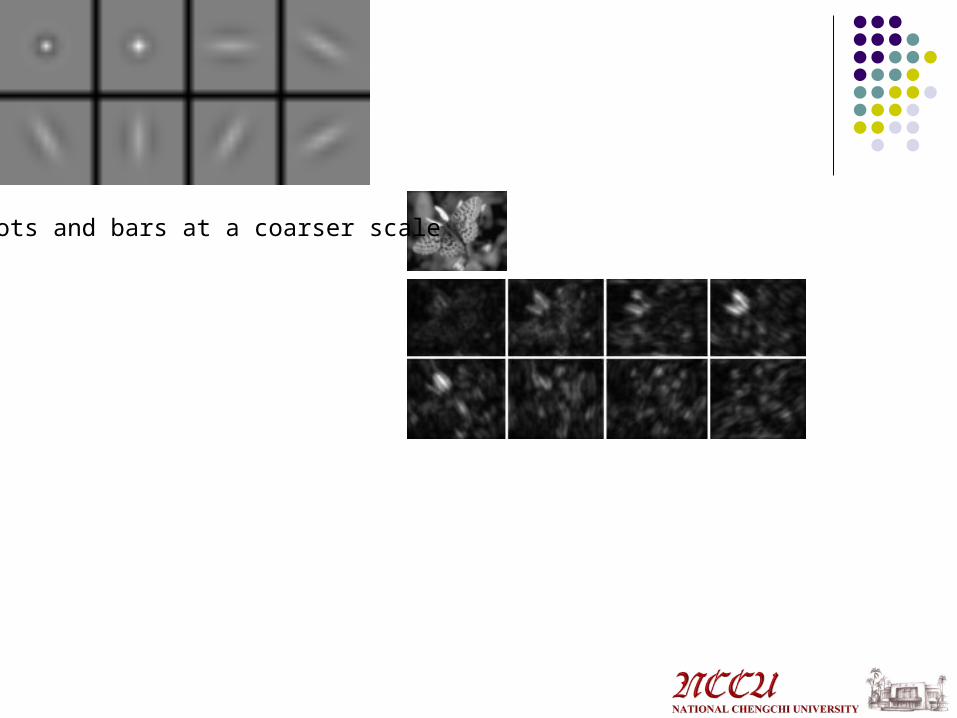
Spots and bars at a coarser scale

Fine scale
Coarse scale
How many filters and what orientations?
Texture Similarity based on Response Statistics
Collect statistics of responses over an image or subimage Mean of squared response Mean and variance of squared response
Euclidean distance between vectors of response statistics for two images is measure of texture similarity
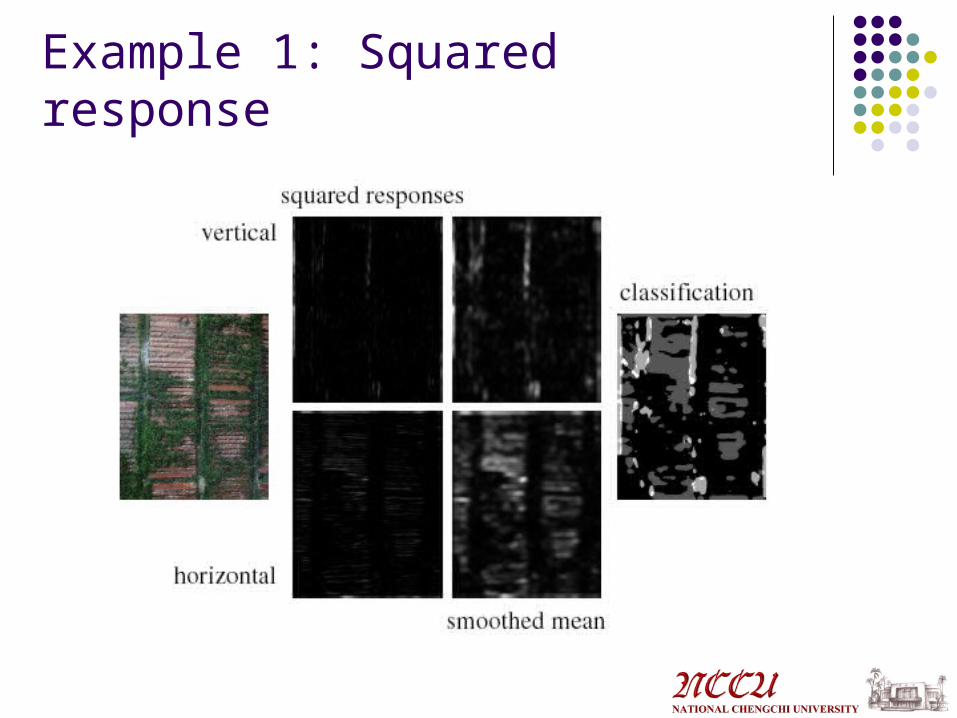
Example 1: Squared response
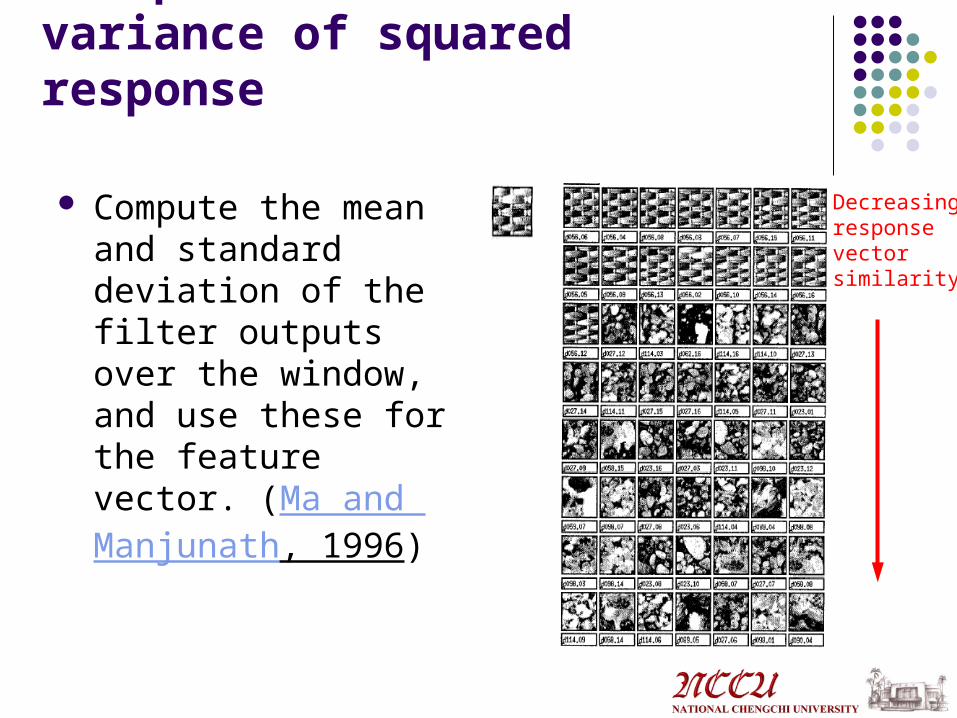
Example 2: Mean and variance of squared response
Compute the mean and standard deviation of the filter outputs over the window, and use these for the feature vector. (Ma and Manjunath, 1996)
Decreasingresponse vectorsimilarity
The Choice of Scale
One approach: start with a small window and increase the size of the window until an increase does not cause a significant change.
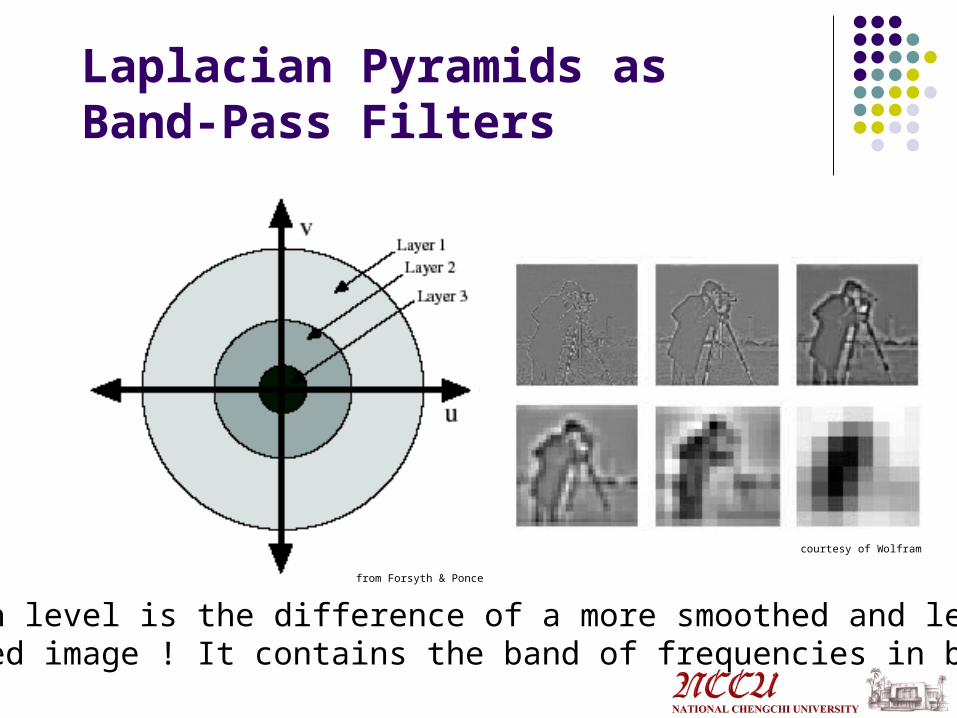
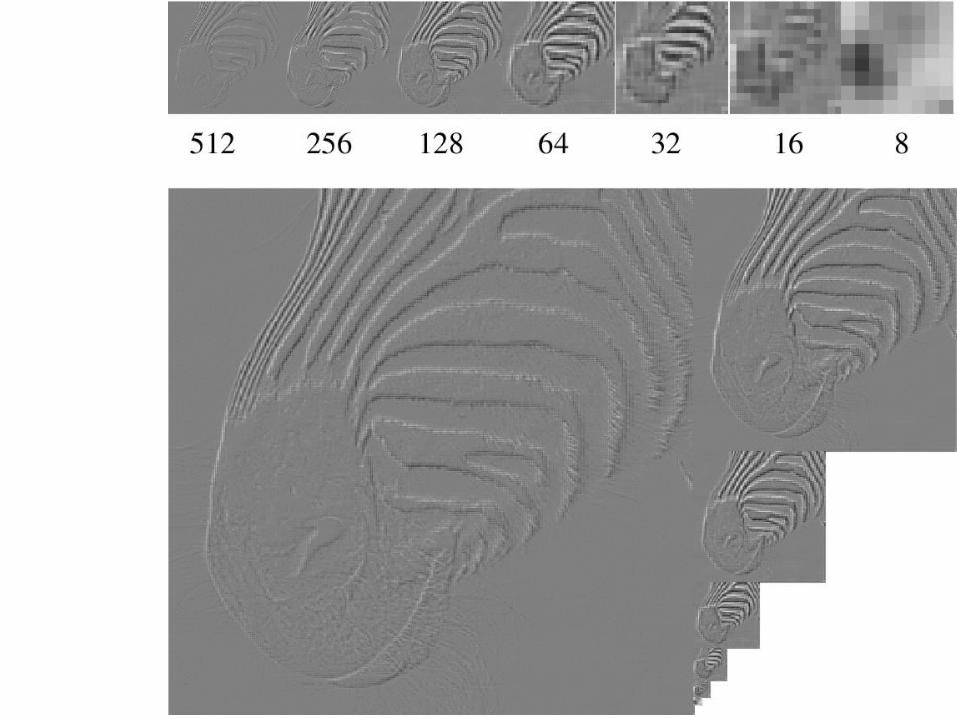
Laplacian Pyramids as Band-Pass Filters
Each level is the difference of a more smoothed and less smoothed image ! It contains the band of frequencies in between
courtesy of Wolfram
from Forsyth & Ponce
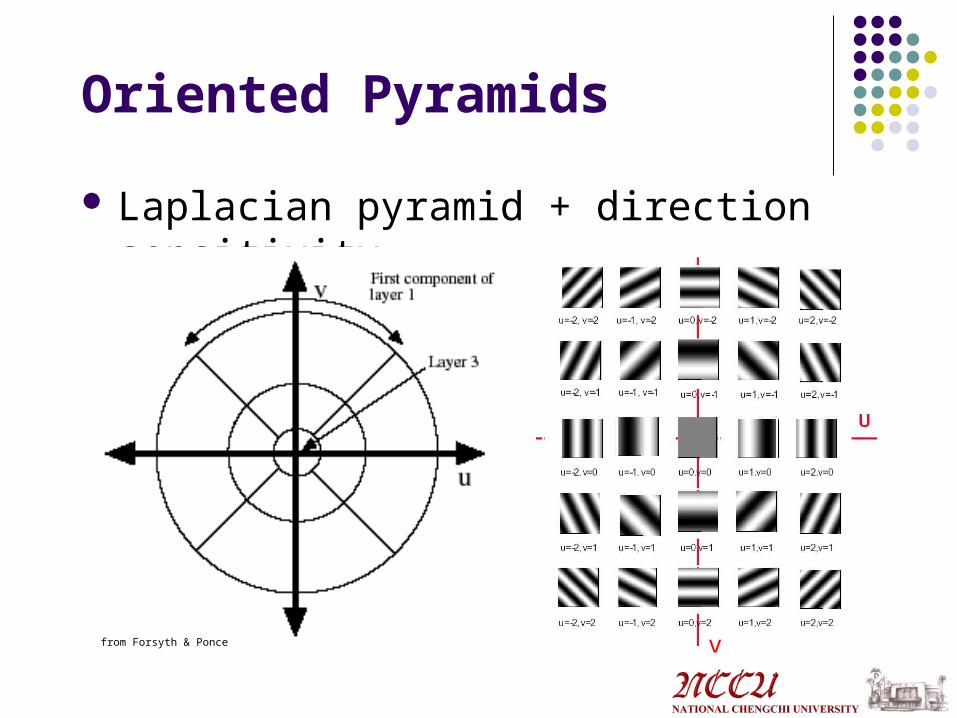
Oriented Pyramids
Laplacian pyramid + direction sensitivity
vfrom Forsyth & Ponce
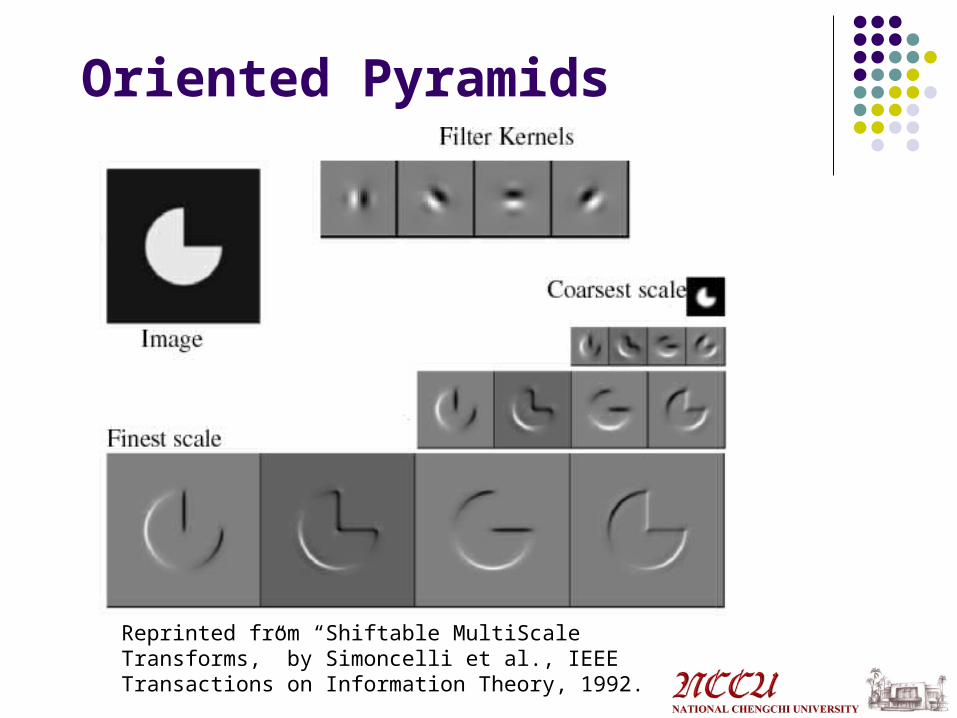
Oriented Pyramids
Reprinted from “Shiftable MultiScale Transforms,” by Simoncelli et al., IEEE Transactions on Information Theory, 1992.
Gabor Filters
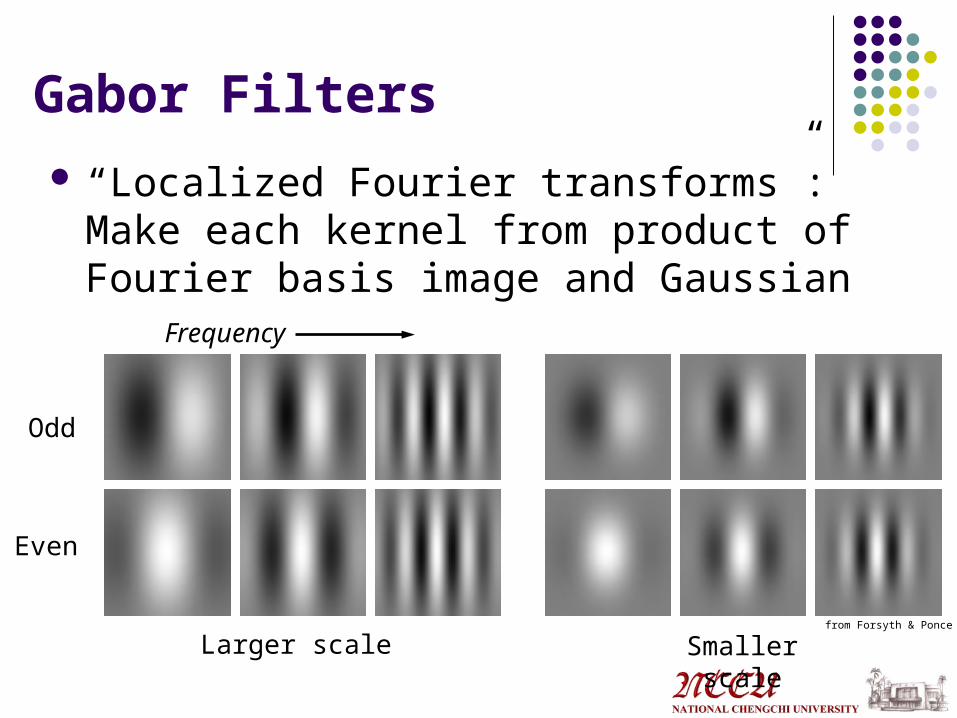
“Localized Fourier transforms”: Make each kernel from product of Fourier basis image and Gaussian
Larger scale Smaller scale
Odd
Even
Frequency
from Forsyth & Ponce
Gabor Filters (cont’d)
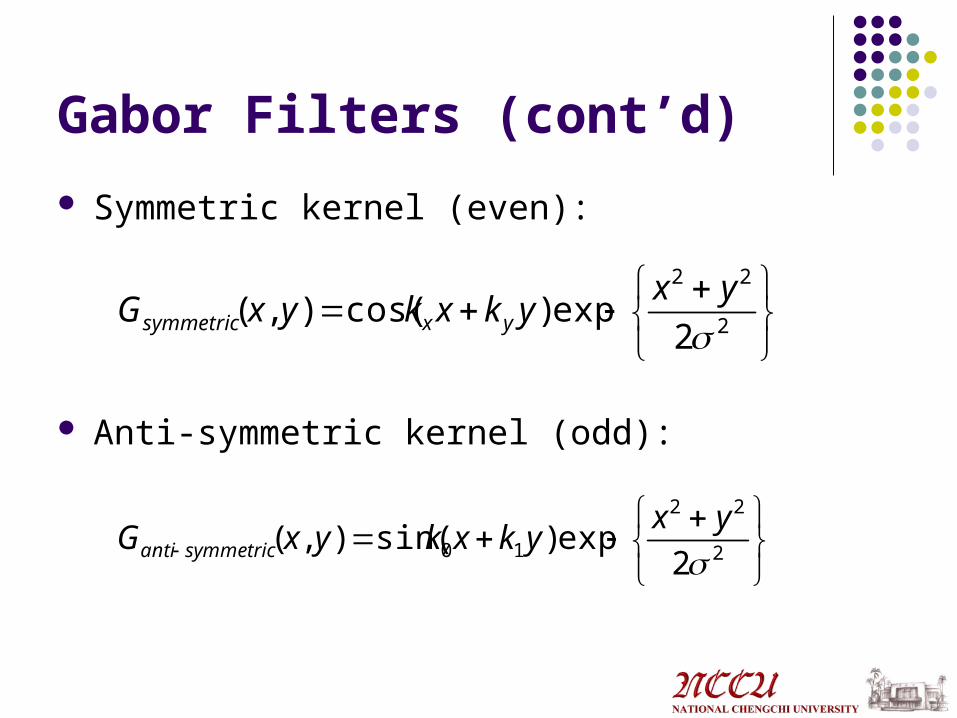
Symmetric kernel (even):
Anti-symmetric kernel (odd):
2
22
2exp)cos(),(
yx
ykxkyxG yxsymmetric
2
22
10 2exp)sin(),(
yx
ykxkyxG symmetricanti
Application: Texture synthesis
Use image as a source of probability model Choose pixel values by matching
neighborhood, then filling in Matching process
look at pixel differences count only synthesized pixels


![Hairs and FIbers Spring 2018 · Microsoft PowerPoint - Hairs and FIbers Spring 2018 [Compatibility Mode] Author: kellie.white Created Date](https://img.pdfslide.us/doc/110x75/60485492ba71c23f3455f45d/hairs-and-fibers-spring-2018-microsoft-powerpoint-hairs-and-fibers-spring-2018.jpg)