Embed Size (px)
Citation preview

Page 1/28
Identi�cation of two recessive etiolation genes (py1,py2) in pakchoi (Brassica rapa L. ssp. chinensis)Kun Zhang
Shenyang Agricultiral UniversityYu Mu
Shenyang Agricultural University College of HorticultureWeijia Li
Shenyang Agricultural University College of HorticultureXiaofei Shan
Shenyang Agricultural UniversityNan Wang
Shenyang Agricultural UniversityHui Feng ( [email protected] )
Shenyang Agricultural University
Research article
Keywords: Brassica rapa,·BSR-Seq,·etiolation mutant,·genetic mapping
Posted Date: January 29th, 2020
DOI: https://doi.org/10.21203/rs.2.15677/v4
License: This work is licensed under a Creative Commons Attribution 4.0 International License. Read Full License
Version of Record: A version of this preprint was published on February 10th, 2020. See the publishedversion at https://doi.org/10.1186/s12870-020-2271-3.
Page 2/28
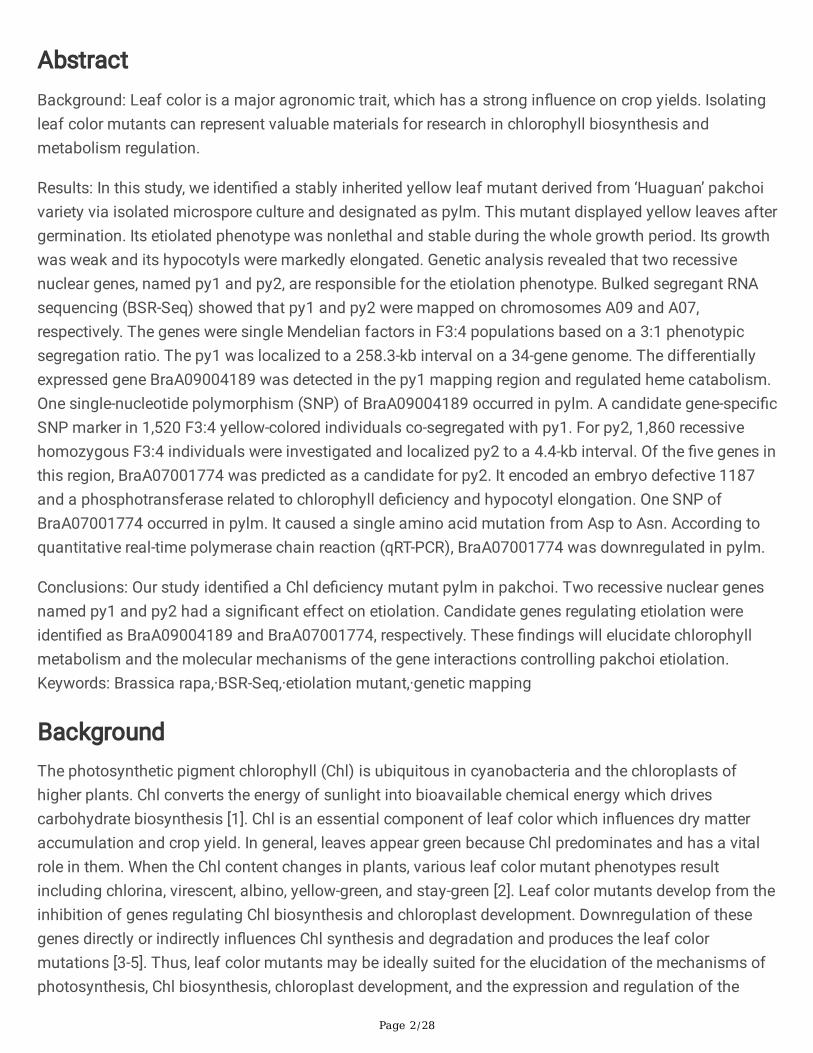
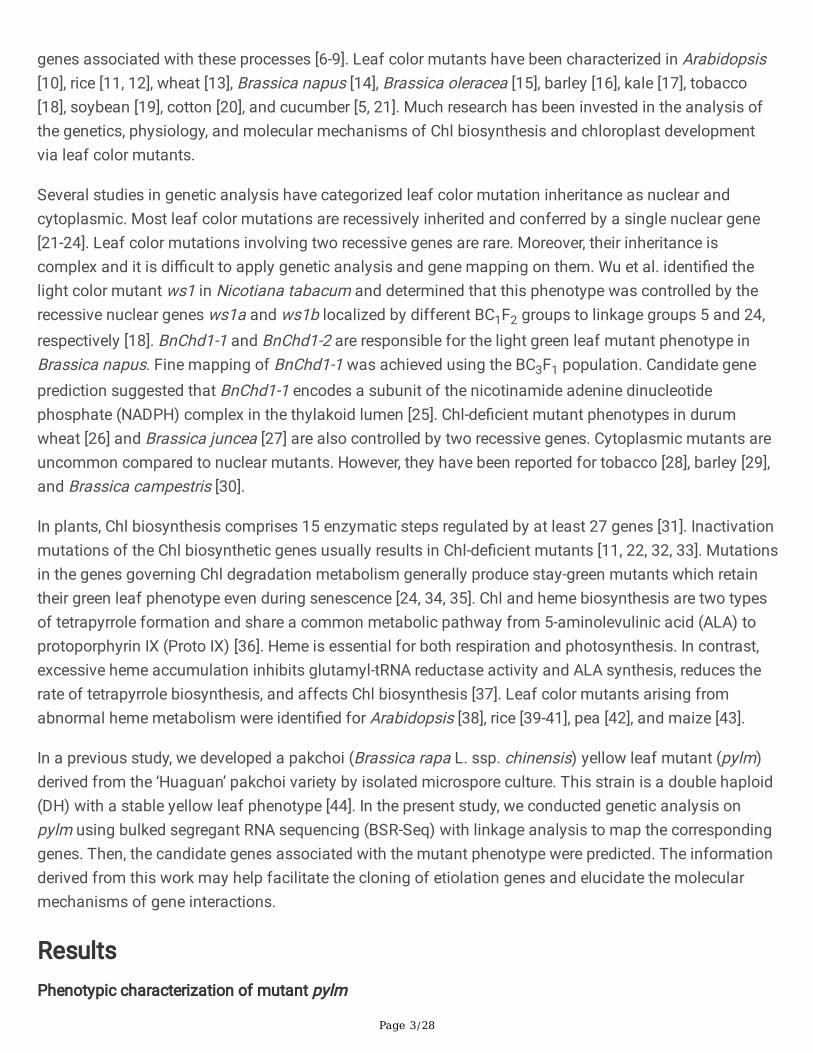
AbstractBackground: Leaf color is a major agronomic trait, which has a strong in�uence on crop yields. Isolatingleaf color mutants can represent valuable materials for research in chlorophyll biosynthesis andmetabolism regulation.
Results: In this study, we identi�ed a stably inherited yellow leaf mutant derived from ‘Huaguan’ pakchoivariety via isolated microspore culture and designated as pylm. This mutant displayed yellow leaves aftergermination. Its etiolated phenotype was nonlethal and stable during the whole growth period. Its growthwas weak and its hypocotyls were markedly elongated. Genetic analysis revealed that two recessivenuclear genes, named py1 and py2, are responsible for the etiolation phenotype. Bulked segregant RNAsequencing (BSR-Seq) showed that py1 and py2 were mapped on chromosomes A09 and A07,respectively. The genes were single Mendelian factors in F3:4 populations based on a 3:1 phenotypicsegregation ratio. The py1 was localized to a 258.3-kb interval on a 34-gene genome. The differentiallyexpressed gene BraA09004189 was detected in the py1 mapping region and regulated heme catabolism.One single-nucleotide polymorphism (SNP) of BraA09004189 occurred in pylm. A candidate gene-speci�cSNP marker in 1,520 F3:4 yellow-colored individuals co-segregated with py1. For py2, 1,860 recessivehomozygous F3:4 individuals were investigated and localized py2 to a 4.4-kb interval. Of the �ve genes inthis region, BraA07001774 was predicted as a candidate for py2. It encoded an embryo defective 1187and a phosphotransferase related to chlorophyll de�ciency and hypocotyl elongation. One SNP ofBraA07001774 occurred in pylm. It caused a single amino acid mutation from Asp to Asn. According toquantitative real-time polymerase chain reaction (qRT-PCR), BraA07001774 was downregulated in pylm.
Conclusions: Our study identi�ed a Chl de�ciency mutant pylm in pakchoi. Two recessive nuclear genesnamed py1 and py2 had a signi�cant effect on etiolation. Candidate genes regulating etiolation wereidenti�ed as BraA09004189 and BraA07001774, respectively. These �ndings will elucidate chlorophyllmetabolism and the molecular mechanisms of the gene interactions controlling pakchoi etiolation.Keywords: Brassica rapa,·BSR-Seq,·etiolation mutant,·genetic mapping
BackgroundThe photosynthetic pigment chlorophyll (Chl) is ubiquitous in cyanobacteria and the chloroplasts ofhigher plants. Chl converts the energy of sunlight into bioavailable chemical energy which drivescarbohydrate biosynthesis [1]. Chl is an essential component of leaf color which in�uences dry matteraccumulation and crop yield. In general, leaves appear green because Chl predominates and has a vitalrole in them. When the Chl content changes in plants, various leaf color mutant phenotypes resultincluding chlorina, virescent, albino, yellow-green, and stay-green [2]. Leaf color mutants develop from theinhibition of genes regulating Chl biosynthesis and chloroplast development. Downregulation of thesegenes directly or indirectly in�uences Chl synthesis and degradation and produces the leaf colormutations [3-5]. Thus, leaf color mutants may be ideally suited for the elucidation of the mechanisms ofphotosynthesis, Chl biosynthesis, chloroplast development, and the expression and regulation of the
Page 3/28
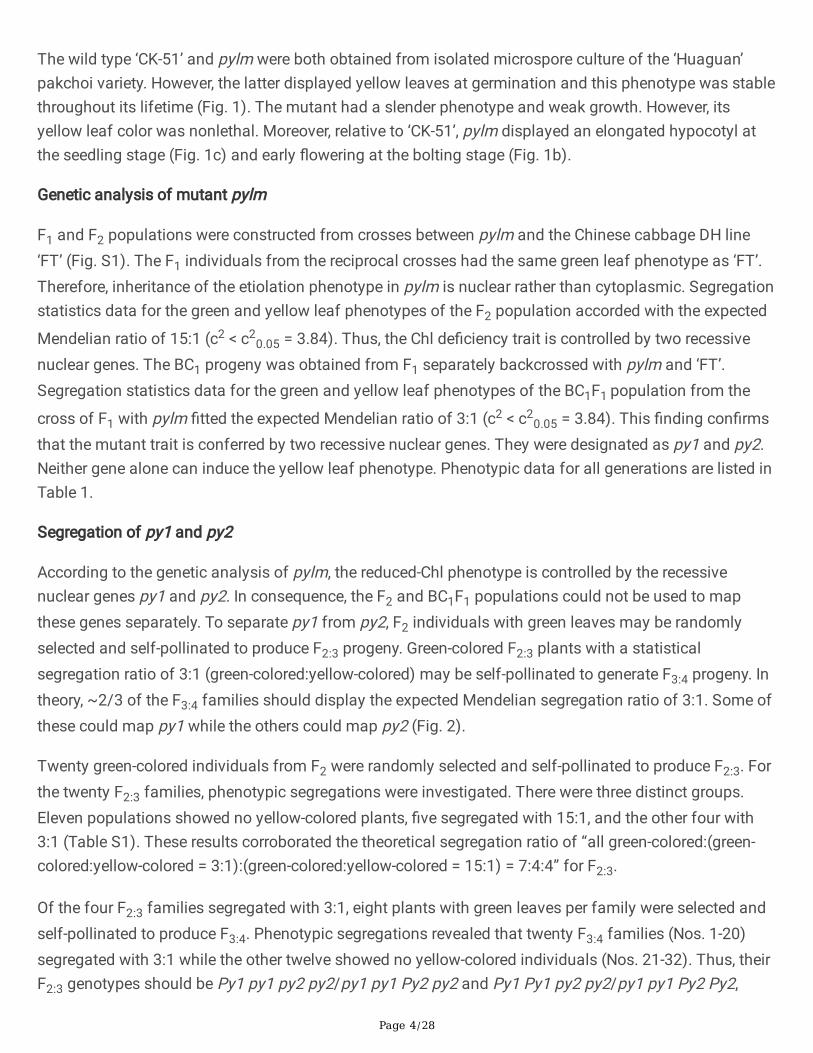
genes associated with these processes [6-9]. Leaf color mutants have been characterized in Arabidopsis[10], rice [11, 12], wheat [13], Brassica napus [14], Brassica oleracea [15], barley [16], kale [17], tobacco[18], soybean [19], cotton [20], and cucumber [5, 21]. Much research has been invested in the analysis ofthe genetics, physiology, and molecular mechanisms of Chl biosynthesis and chloroplast developmentvia leaf color mutants.
Several studies in genetic analysis have categorized leaf color mutation inheritance as nuclear andcytoplasmic. Most leaf color mutations are recessively inherited and conferred by a single nuclear gene[21-24]. Leaf color mutations involving two recessive genes are rare. Moreover, their inheritance iscomplex and it is di�cult to apply genetic analysis and gene mapping on them. Wu et al. identi�ed thelight color mutant ws1 in Nicotiana tabacum and determined that this phenotype was controlled by therecessive nuclear genes ws1a and ws1b localized by different BC1F2 groups to linkage groups 5 and 24,respectively [18]. BnChd1-1 and BnChd1-2 are responsible for the light green leaf mutant phenotype inBrassica napus. Fine mapping of BnChd1-1 was achieved using the BC3F1 population. Candidate geneprediction suggested that BnChd1-1 encodes a subunit of the nicotinamide adenine dinucleotidephosphate (NADPH) complex in the thylakoid lumen [25]. Chl-de�cient mutant phenotypes in durumwheat [26] and Brassica juncea [27] are also controlled by two recessive genes. Cytoplasmic mutants areuncommon compared to nuclear mutants. However, they have been reported for tobacco [28], barley [29],and Brassica campestris [30].
In plants, Chl biosynthesis comprises 15 enzymatic steps regulated by at least 27 genes [31]. Inactivationmutations of the Chl biosynthetic genes usually results in Chl-de�cient mutants [11, 22, 32, 33]. Mutationsin the genes governing Chl degradation metabolism generally produce stay-green mutants which retaintheir green leaf phenotype even during senescence [24, 34, 35]. Chl and heme biosynthesis are two typesof tetrapyrrole formation and share a common metabolic pathway from 5-aminolevulinic acid (ALA) toprotoporphyrin IX (Proto IX) [36]. Heme is essential for both respiration and photosynthesis. In contrast,excessive heme accumulation inhibits glutamyl-tRNA reductase activity and ALA synthesis, reduces therate of tetrapyrrole biosynthesis, and affects Chl biosynthesis [37]. Leaf color mutants arising fromabnormal heme metabolism were identi�ed for Arabidopsis [38], rice [39-41], pea [42], and maize [43].
In a previous study, we developed a pakchoi (Brassica rapa L. ssp. chinensis) yellow leaf mutant (pylm)derived from the ‘Huaguan’ pakchoi variety by isolated microspore culture. This strain is a double haploid(DH) with a stable yellow leaf phenotype [44]. In the present study, we conducted genetic analysis onpylm using bulked segregant RNA sequencing (BSR-Seq) with linkage analysis to map the correspondinggenes. Then, the candidate genes associated with the mutant phenotype were predicted. The informationderived from this work may help facilitate the cloning of etiolation genes and elucidate the molecularmechanisms of gene interactions.
ResultsPhenotypic characterization of mutant pylm
Page 4/28
The wild type ‘CK-51’ and pylm were both obtained from isolated microspore culture of the ‘Huaguan’pakchoi variety. However, the latter displayed yellow leaves at germination and this phenotype was stablethroughout its lifetime (Fig. 1). The mutant had a slender phenotype and weak growth. However, itsyellow leaf color was nonlethal. Moreover, relative to ‘CK-51’, pylm displayed an elongated hypocotyl atthe seedling stage (Fig. 1c) and early �owering at the bolting stage (Fig. 1b).
Genetic analysis of mutant pylm
F1 and F2 populations were constructed from crosses between pylm and the Chinese cabbage DH line‘FT’ (Fig. S1). The F1 individuals from the reciprocal crosses had the same green leaf phenotype as ‘FT’.Therefore, inheritance of the etiolation phenotype in pylm is nuclear rather than cytoplasmic. Segregationstatistics data for the green and yellow leaf phenotypes of the F2 population accorded with the expected
Mendelian ratio of 15:1 (c2 < c20.05 = 3.84). Thus, the Chl de�ciency trait is controlled by two recessive
nuclear genes. The BC1 progeny was obtained from F1 separately backcrossed with pylm and ‘FT’.Segregation statistics data for the green and yellow leaf phenotypes of the BC1F1 population from the
cross of F1 with pylm �tted the expected Mendelian ratio of 3:1 (c2 < c20.05 = 3.84). This �nding con�rms
that the mutant trait is conferred by two recessive nuclear genes. They were designated as py1 and py2.Neither gene alone can induce the yellow leaf phenotype. Phenotypic data for all generations are listed inTable 1.
Segregation of py1 and py2
According to the genetic analysis of pylm, the reduced-Chl phenotype is controlled by the recessivenuclear genes py1 and py2. In consequence, the F2 and BC1F1 populations could not be used to mapthese genes separately. To separate py1 from py2, F2 individuals with green leaves may be randomlyselected and self-pollinated to produce F2:3 progeny. Green-colored F2:3 plants with a statisticalsegregation ratio of 3:1 (green-colored:yellow-colored) may be self-pollinated to generate F3:4 progeny. Intheory, ~2/3 of the F3:4 families should display the expected Mendelian segregation ratio of 3:1. Some ofthese could map py1 while the others could map py2 (Fig. 2).
Twenty green-colored individuals from F2 were randomly selected and self-pollinated to produce F2:3. Forthe twenty F2:3 families, phenotypic segregations were investigated. There were three distinct groups.Eleven populations showed no yellow-colored plants, �ve segregated with 15:1, and the other four with3:1 (Table S1). These results corroborated the theoretical segregation ratio of “all green-colored:(green-colored:yellow-colored = 3:1):(green-colored:yellow-colored = 15:1) = 7:4:4” for F2:3.
Of the four F2:3 families segregated with 3:1, eight plants with green leaves per family were selected andself-pollinated to produce F3:4. Phenotypic segregations revealed that twenty F3:4 families (Nos. 1-20)segregated with 3:1 while the other twelve showed no yellow-colored individuals (Nos. 21-32). Thus, theirF2:3 genotypes should be Py1 py1 py2 py2/py1 py1 Py2 py2 and Py1 Py1 py2 py2/py1 py1 Py2 Py2,
Page 5/28
respectively (Table S2). Phenotypic segregations of the F3:4 families �tted the theoretical segregationratio of “(green-colored:yellow-colored = 3:1):all green-colored = 2:1”. Therefore, the F3:4 families (Nos. 1-20) could be used to map the py1 and/or py2 loci.
BSR-Seq analysis
A total of 47,526,126 and 49,119,466 raw reads (150-bp) were generated from the G-pool and Y-pool,respectively. After quality evaluation and data �ltering, 97% of the read pairs (46,456,174 for the G-pooland 47,581,728 for the Y-pool) remained. Clean reads were mapped against the Brassica referencegenome with Hisat v. 2.0.14. Of these, > 66% were uniquely mapped in both pools.
Relative to the reference genome, 154,863 and 157,022 SNPs were detected in the G-pool and Y-pool,respectively. Differential SNP loci were screened for ED5 calculation and 412 target differential SNP lociwere obtained between the pools according to the top 1% ED5 threshold. Two distinct peaks wereobserved on chromosomes A07 and A09 (Fig. 3). This �nding was consistent with the hypothesis that themutant trait is controlled by two recessive nuclear genes. Thus, it was predicted that the etiolation geneswere located on chromosomes A07 and A09 within �ve chromosome regions (Table 2).
Identi�cation of differentially expressed genes
RPKM was used to measure gene expression level. By setting RPKM ≥ 0.1, 55,250 genes were detected.These were divided into six RPKM distribution intervals (Table S3). There were 181 DEGs between the G-pool and Y-pool according to the constraint (|log2 fold change| ≥ 1 and FDR ≤ 0.05). Ninety genes wereupregulated and the others were downregulated when the G-pool was compared with the Y-pool (Fig. S2).The DEGs are shown in Table S4.
Fine mapping of py1
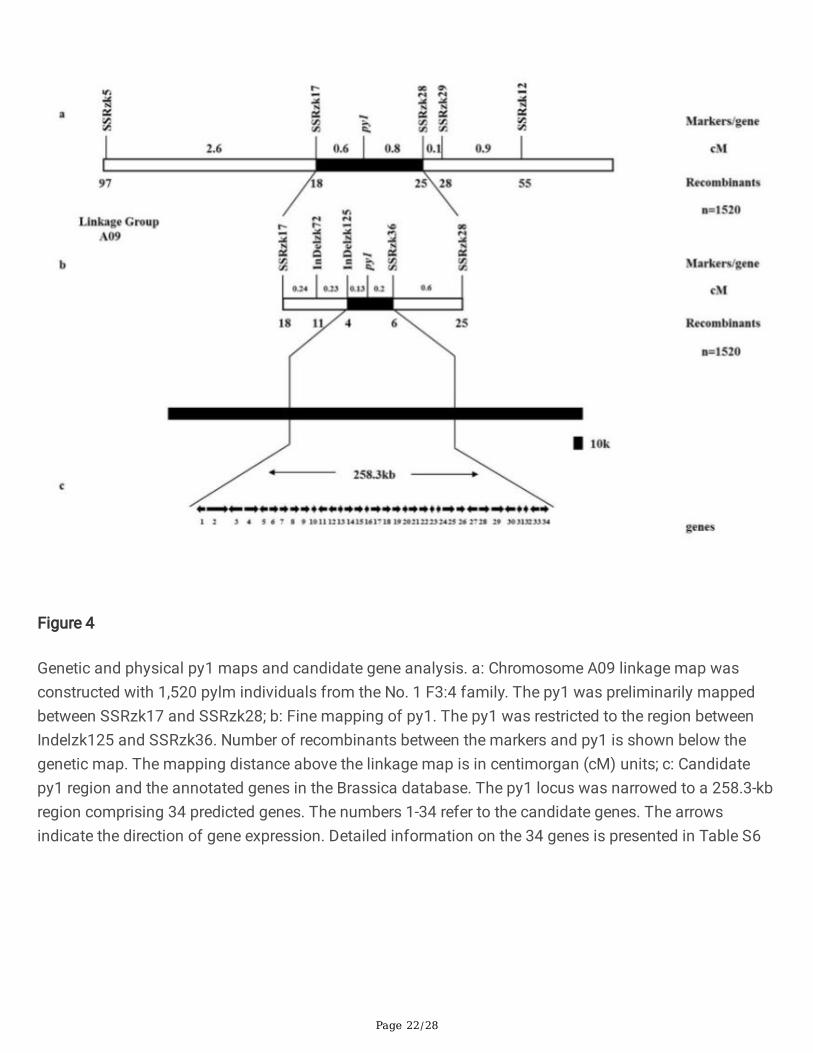
Ninety-six SSR markers were developed around the three predicted chromosome regions on chromosomeA09. They were used to detect polymorphisms between pylm and ‘FT’. After screening, thirty-seven SSRmarkers displayed polymorphisms between parents. They were used to test twelve green-colored andyellow-colored individuals each from the No. 1 F3:4 family. SSRzk5 and SSRzk12 were located near the23,811,435-27,563,122 region on chromosome A09 and showed linkage to py1 on the opposite side.
A total of 1,520 yellow-colored individuals of the No. 1 F3:4 family were selected as the py1 mappingpopulation. A linkage analysis disclosed that py1 was located between SSRzk5 and SSRzk12 atestimated genetic distances of 3.2 cM and 1.8 cM, respectively (Fig. 4a). To identify the molecularmarkers tightly linked to py1 and narrow the py1 mapping interval, new SSR and Indel markers weredeveloped between SSRzk5 and SSRzk12. The polymorphic markers SSRzk17, SSRzk28, SSRzk29,SSRzk36, Indelzk72, and Indelzk125 were linked to py1 (Table S5). SSRzk17, Indelzk72, and Indelzk125were located on one side of py1 as SSRzk5 while SSRzk28, SSRzk29, and SSRzk36 were located on theother side of py1 as SSRzk12. The py1 was mapped between Indelzk125 and SSRzk36 at 0.13 cM and
Page 6/28
0.2 cM, respectively (Fig. 4b). Therefore, py1 was mapped in a 258.3-kb region between the most tightlylinked markers (Fig. 4c).
Candidate py1 analysis
The target DNA sequences of the 258.3-kb region between Indelzk125 and SSRzk36 were obtained fromthe Brassica database. A genomic sequence analysis revealed that the candidate region contained 34genes (Fig. 4c, Table S6). Differential gene expression analysis disclosed only BraA09004189 in the py1mapping region. BraA09004189 is a heme oxygenase (HO1) which participates in heme catabolism.Mutants with yellow leaf phenotype induced by defective HOs were reported in earlier studies [40, 41].BraA09004189 was predicted to be the most probable candidate py1 gene.
To con�rm this hypothesis, two pairs of primers were designed to sequence BraA09004189 in pylm and‘CK-51’ (Table S7). The BraA sequence did not differ between parents whereas the BraB sequence in pylmpresented with one SNP (Fig. 5). Based on the position of BraA09004189, an SNP marker was designedto screen 1,520 yellow-colored individuals from the No. 1 F3:4 family. The bands of whole mappingindividuals co-segregated with py1.
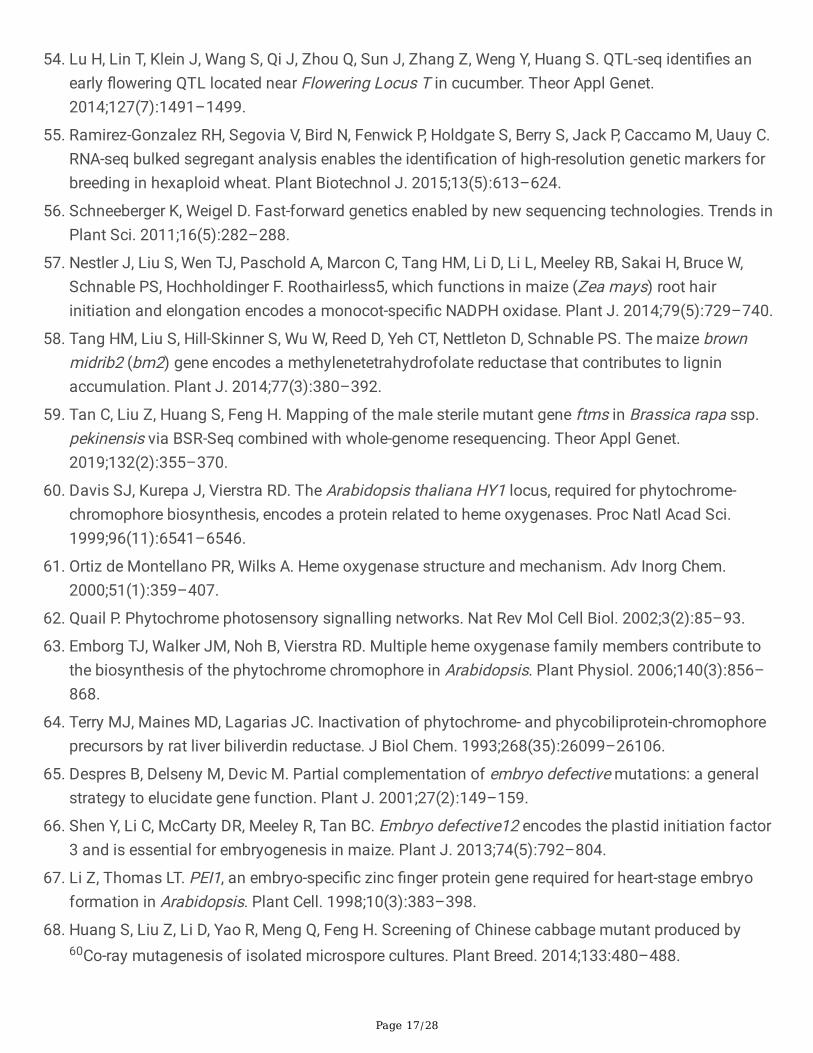
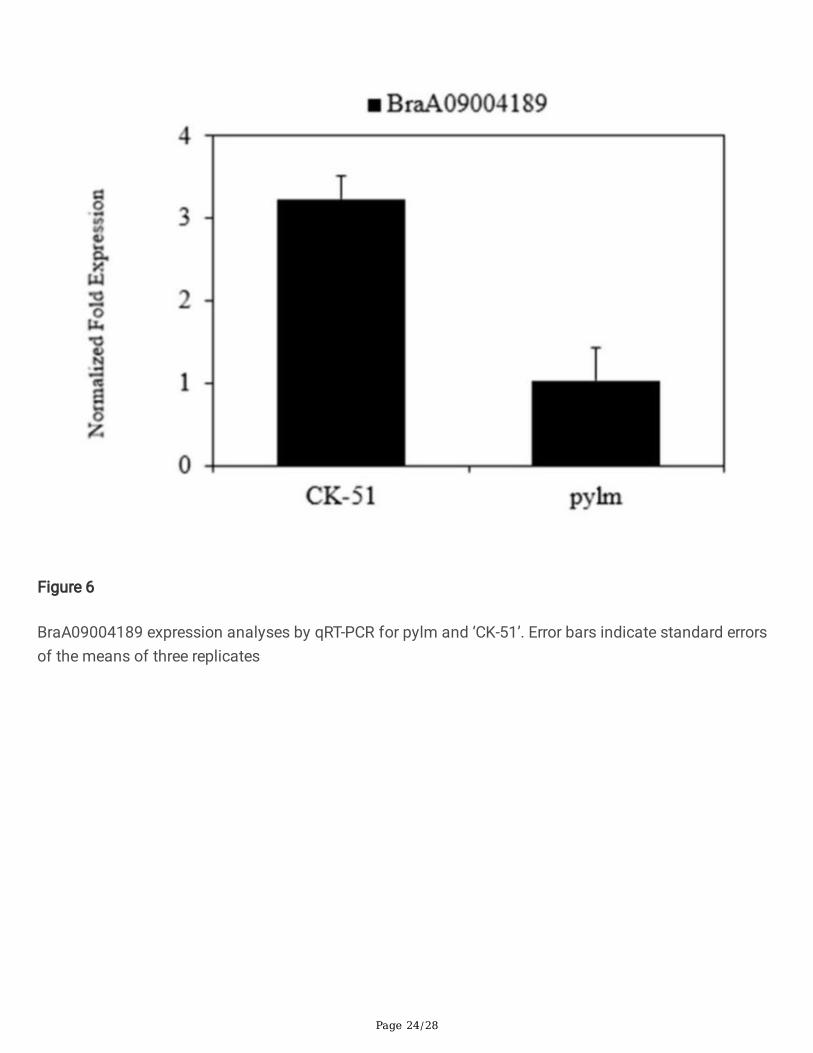
A qRT-PCR was performed to determine BraA09004189 expression in pylm and ‘CK-51’. In accordancewith the differential gene expression analysis, the results indicated that BraA09004189 expression levelwas much higher in ‘CK-51’ than that in pylm (Fig. 6). This �nding further supports the likelihood thatBraA09004189 is the candidate for py1.
Fine mapping of py2
Considering the constructed populations size, we screened the Nos. 2-5 F3:4 families using the sameresearch strategy applied for SSRzk5 and SSRzk12 linked to py1. The etiolation gene py1 was identi�edin the Nos. 2, 4, and 5 F3:4 families. In theory, then, the No. 3 F3:4 family may be used to establish the py2locus.
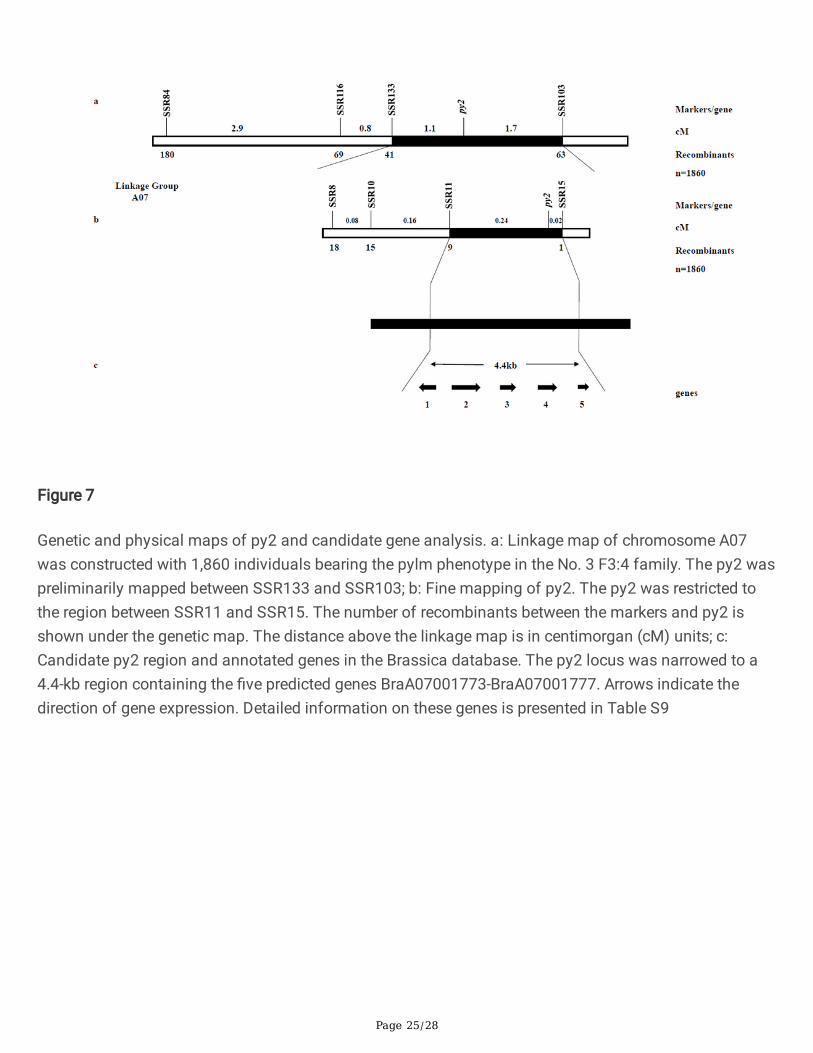
Forty-eight SSR markers were developed around the two predicted regions on chromosome A07 to detectpolymorphisms between pylm and ‘FT’. After screening, eleven SSR markers displayed polymorphismsbetween the parents. They were used to test twelve green-colored and twelve yellow-colored individuals ofthe No. 3 F3:4 family. SSR84 and SSR103 were located around the region 11,166,810-15,034,483 onchromosome A07 and presented with linkages to py2 on the opposite side (Fig. 7a; Table S8).
There were 1,860 yellow-colored individuals from the No. 3 F3:4 family selected as the py2 mappingpopulation. The py2 was located between SSR11 and SSR15 at estimated genetic distances of 0.24 cMand 0.02 cM, respectively (Fig. 7b). To narrow the py2 mapping interval and identify the molecularmarkers tightly linked to py2, new SNP markers were developed between SSR11 and SSR15. Only thepolymorphic marker SNP11 was linked to py2. Based on the recombinant individuals, the py2 intervalwas narrowed to 14,851,951-14,896,902 and contained �ve genes (Fig. 7c).

Page 7/28
Candidate py2 analysis
Annotation data for the �ve candidate genes in the py2 target region were obtained from the Brassicadatabase (Table S9). Primers were designed to cover the cDNA for each gene and predict the candidategenes (Table S10). There were no differences between pylm and ‘CK-51’ in terms of BraA07001775,BraA07001776, or BraA07001777. After PCR ampli�cation, the BraA07001773 sequence was disorderedand the sequence comparisons were inconsistent over serial repetitions. There was SNP variationbetween parents for the �rst exon in BraA07001774 (Fig. 8). It caused a single amino acid mutation fromAsp (GAT) in the wild type to Asn (AAT) in pylm (Fig. 9). Therefore, BraA07001774 was taken as the mostprobable candidate gene for py2.
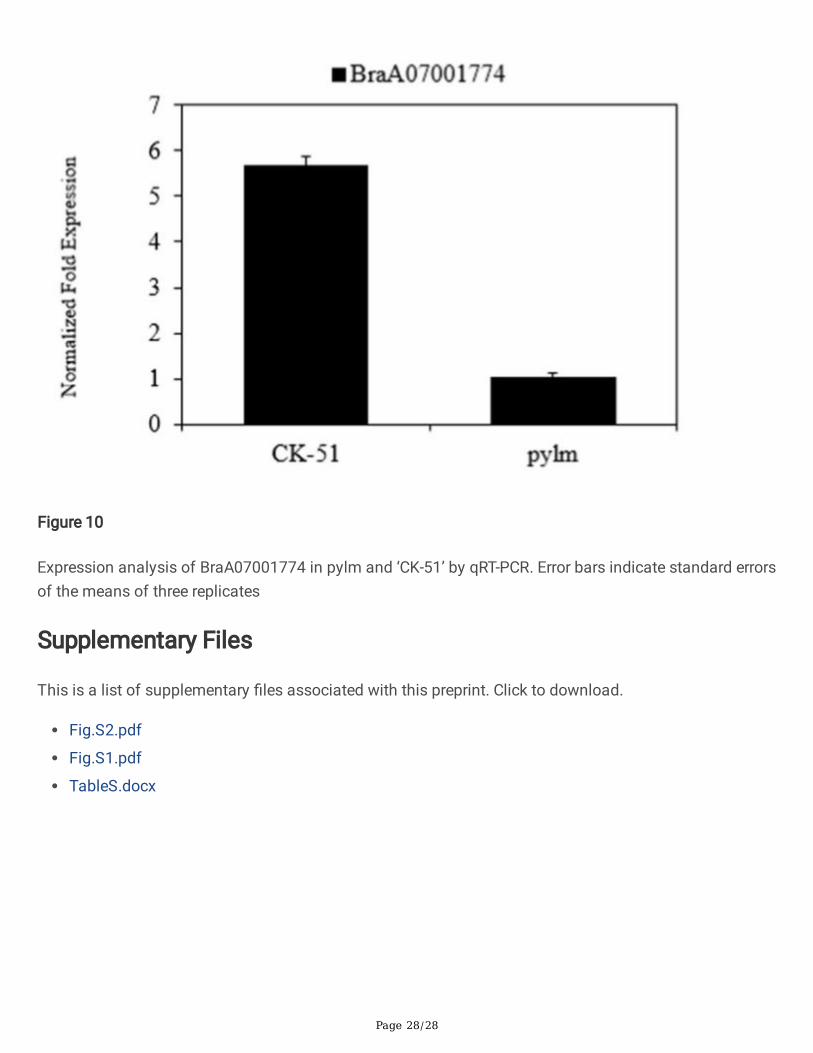
BraA07001774 is an embryo defective 1187 (emb 1187) and a phosphotransferase. The albino mutants(pds1, pds2) phenotypes in Arabidopsis thaliana may be caused by emb 71 [45]. For Arabidopsis seedswith silique defects, hypocotyl elongation was characterized during the development of F2 generationmutant seedlings [46]. We proposed that the mutant phenotype is determined by mutations inBraA07001774. To validate our prediction, BraA07001774 expression in pylm and ‘CK-51’ was analyzedby qRT-PCR. BraA07001774 was dramatically downregulated in pylm (Fig. 10). Thus, it probably is thecandidate gene for py2.
DiscussionMutations in leaf color are widespread in nature. The main type of leaf color mutation is Chl de�ciency.Dwar�sm, retarded growth, attenuated photosynthetic capacity, low yield, and death are associated withthis defect [25, 47, 48]. Here, we identi�ed the pakchoi yellow leaf mutant pylm from isolated microsporeculture. Unlike previously reported Chl de�cient mutants, pylm presented with substantially elongatedhypocotyls at the seedling stage and early �owering at the bolting stage. The etiolation phenotype inpylm was nonlethal and stable throughout the growth period. The Chl de�ciency in pylm was controlledby two recessive genes. These characteristics suggested that pylm was of high value for research inrevealing the Chl biosynthesis mechanism regulated by gene interactions.
Map-based cloning is an effective gene isolation strategy. It has been extensively used for plant genefunction analysis [49-51]. However, it is contingent upon �ne mapping of the target gene. For most leafcolor mutants, the traits are recessively inherited and controlled by a single nuclear gene. The F2
populations are instinctively applied to map the target gene [5, 41, 48].With regard to the character conferred by two recessive nuclear genes, F2 populations may also be usedin preliminary mapping. An e�cient way to isolate allele pairs from each other and separately map themis to construct advanced backcrosses and other populations. The recessive white stem (ws) loci inNicotiana tabacum and the Chl de�ciency (Bnchd1) loci in Brassica napus were successfully mappedusing constructed BC1F2 and BC3F1 populations, respectively [18, 25]. In the present study, geneticanalysis revealed that the recessive nuclear genes designated as py1 and py2 were responsible for theetiolation trait. We successfully segregated py1 from py2 and constructed an inheritance model for the

Page 8/28
Chl de�ciency trait in pakchoi. Twenty F3:4 families with a phenotypic segregation ratio of 3:1 wereconstructed. Various F3:4 families were successfully used to map the py1 and py2 loci separately.Compared to using advanced backcross populations to map pairs of recessive nuclear genes, creatingand using F2:3 or F3:4 families avoid the selection errors and interference in genetic analysis caused bythe incomplete emasculation of Brassica rapa.
BSR-Seq e�ciently combines the respective superiorities of bulk segregation analysis (BSA) and RNAsequencing (RNA-Seq) for rapid gene mapping [52-55]. BSR-Seq is targeted at the mRNA level. It selectsphenotypically opposite individuals from segregated populations and constructs two RNA mixing poolsto �nd SNPs at the transcript level. The transcriptome data localize the target genes and detectpotentially associated DEGs [56]. BSR-Seq has been extensively applied to map the causal genes linkedto a single target trait [24, 57, 58]. Two independently inherited traits may also be localized by BSR-Seq.Tan et al. applied BSR-Seq to locate the genes controlling male sterility on chromosome A05 and whitepetal on chromosome A02 [59]. Here, the mutant pylm and Chinese cabbage DH 'FT' lines were chosen asparents to construct the F2 separation population. The phenotypes of the wild type and mutantindividuals signi�cantly differed. Thus, extreme mixed pools could be accurately and convenientlycreated for BSR-Seq. Release of Brassica rapa genomic data enhanced the reliability of these populationsin BSR-Seq applications. Five candidate regions related to the yellow leaf phenotype in pylm wereidenti�ed on chromosomes A07 and A09. Molecular markers were developed according to the locationsof the candidate regions. The etiolation genes py1 and py2 were separately mapped with different F3:4
families. The �ndings con�rmed the feasibility of BSR-Seq for mapping two recessive nuclear genes.They also showed that BSR-Seq simpli�es molecular marker development and screening in traditionalmapping methods and greatly improves their e�ciency.
New molecular markers were developed near the target regions based on preliminary py1 mapping byBSR-Seq. The py1 was mapped between the markers Indelzk125 and SSRzk36 on A09 chromosome overa 258.3-kb localization interval containing 34 predicted genes. No new polymorphic SSR or Indel markerswere available to limit the localization interval. The gene expression patterns determined by BSR-Seqdisclosed only one differentially expressed gene (BraA09004189) within the py1 mapping region. A geneannotation referenced from the Brassica database indicated that BraA09004189 encodes hemeoxygenase-1 (HO1). This enzyme plays a vital role in phytochrome chromophore metabolism, thephotoresponse mechanism, adventitious root formation, and oxidative damage mitigation [60-63]. HO1stabilizes and maintains the heme content by transforming heme into BV-IXα [64]. As embranchments oftetrapyrrole biosynthesis, Chl and heme biosynthesis share a common metabolic pathway from ALA toProto IX. Excessive heme accumulation caused by abnormal heme metabolism leads to feedbackinhibition of Chl biosynthesis [36]. Therefore, a decrease in HO1 activity may in�uence Chl biosynthesis.The hy1 mutant of Arabidopsis and the yellow-green leaf 2 mutant of rice presented with the reduced-Chlphenotype because of free heme inhibition resulting from HO1 mutations [40, 60]. HO1 defects stronglyaffected thylakoid development in rice [41]. Davis et al. found that the abnormally elongated hypocotylphenotype of mutant Arabidopsis seedlings may be associated with HO1 defects [60]. Thus, py1 may
Page 9/28
encode HO and a mutation thereof may in�uence Chl biosynthesis and leaf color. In this study, qRT-PCRdemonstrated that BraA09004189 was downregulated in pylm. This �nding was consistent with thoseobtained by BSR-Seq. The SNP BraA09004189 was detected between pylm and ‘CK-51’. A candidategene-speci�c SNP marker in 1,520 F3:4 yellow-colored individuals co-segregated with py1. Thus,BraA09004189 corresponds to the yellow leaf locus py1 in pylm.
It was already known that certain Chl de�ciency traits are controlled by two recessive nuclear genes.However, there was a lack of appropriate mapping populations or reliable molecule markers. Therefore,they were either approximately mapped without de�nite locations [18, 26] or only one of the pair could belocalized [25]. In previous studies, little progress was made in the simultaneous �ne mapping or accurateprediction of the candidate genes. Here, we used the same mapping strategy as that for py1 toaccomplish �ne mapping for py2. The linkage analysis disclosed that py2 was mapped between SSR11and SSR15 on chromosome A07. The mapping interval was narrowed to 4.4 kb by the SNP11 markerlinked to py2. Sequence analysis of the �ve genes in the py2 localization interval showed that onlyBraA07001774 expression signi�cantly differed between pylm and ‘CK-51’. For pylm, BraA07001774 hada SNP missense mutation on the �rst exon such that the wild type had an Asp residue whereas pylm hadan Asn. The qRT-PCR revealed that BraA07001774 was downregulated in the mutant relative to the wildtype. Gene annotation in the Brassica database indicated that BraA09004189 encodes emb 1187 and aphosphotransferase. In Arabidopsis, the emb genes are essential for seed development [65]. EMB genesencode various proteins. Thirty percent of them are active in the plastids [66]. Most emb mutations resultin albinism or etiolated seeds and embryos which are secondary effects of mutations in chloroplastbiogenesis and function [67]. The albino mutants (pds1, pds2) and hypocotyl elongation phenotypes inArabidopsis may be related to mutations in EMB genes [45, 46]. Thus, BraA07001774 is a candidate genefor py2.
ConclusionsWe reported the identi�cation of a Chl de�ciency mutant pylm in pakchoi in this study. The etiolation traitwas controlled by two recessive nuclear genes py1 and py2. We successfully segregated py1 from py2 byconstructing F3:4 families and achieved �ne mapping and predictions for the two etiolation genes.Candidate genes regulating etiolation were identi�ed as BraA09004189 and BraA07001774, respectively.These discoveries may help elucidate the molecular mechanisms underlying the trait controlled by tworecessive nuclear genes. In future studies, functional validation will be conducted to clarify the functionsof these candidate genes. In this manner, the molecular mechanism of gene interactions may be betterunderstood.
MethodsPlant materials and mapping population development

Page 10/28
The DH line pylm was obtained by isolated microspore culture of the ‘Huaguan’ pakchoi varietyintroduced from Japan musashino seed company. This strain was characterized by yellow leaves andelongated hypocotyls [44]. The parent used for the segregating population development with pylm in thisstudy was ‘FT’, a DH line derived from Chinese cabbage variety ‘Fukuda 50’ screened by Shenyanggreenstar Chinese cabbage research institute (Shenyang, China), which exhibits folded green leaves [68].The pylm was reciprocally crossed with ‘FT’ to produce the F1, F2, and BC1 generations. Twenty F2
individuals with green leaves were self-pollinated to produce F2:3 progenies. Eight green F2:3 individualsper group were randomly selected from the corresponding populations and self-pollinated to produce theF3:4 populations. Those with character segregation were used in linkage analysis and gene mapping. Allplants were grown in the greenhouse at Shenyang Agricultural University, China.
Detection of variations by BSR-Seq
One hundred individuals with extreme leaf color phenotype at three-leaf stage were separately collectedfrom the F2 progeny and pooled for RNA extraction. Total RNA of each sample was extracted usingTRIzol Reagent (Invitrogen, USA). The RNA concentration and integrity were analyzed with an Agilent2100 Bioanalyzer (Agilent Technologies, USA). The extreme mixed pools green-leaf (G-pool) and yellow-leaf (Y-pool) were constructed by mixing equal amounts of each RNA sample. RNA-Seq librarypreparations were constructed according to the manufacturer’s protocol (NEBNext® Ultra™ RNA LibraryPrep Kit for Illumina®). Sequencing was run on an Illumina HiSeq 2500 by GENEWIZ Suzhou BiologicalTechnology Co., Ltd., China.
The quality of the raw RNA-Seq reads was assessed with FastQC (v. 0.10.1). Adapter sequences and low-quality reads containing N and < 70 were deleted from the raw reads with Cutadapt (v. 1.9.1). Low-qualitybases at the 5’ or 3’ end were �ltered out. Those with mean quality < 20 were trimmed by the 4-bp slidingwindow method. Clean data were aligned to the Brassica database (http://brassicadb.org/brad/) withHisat v. 2.0.14 [69]. Candidate single nucleotide polymorphisms (SNPs) between the pools were obtainedwith the Mpileup module in SAM Tools (v. 0.1.18) SNP loci with depth coverage > 3× were screened fordifferential SNP analysis in the mutant and wild type pools. Euclidean distances (ED) for the differentialSNP loci were calculated. The ED for each differential SNP locus was raised to the power �ve, namely,ED5, to eliminate background noise [70]. All ED5 were sorted and the differential SNP loci with ED5 in thetop 1% were screened and mapped to speci�c chromosome regions based on the SNP locus distributions.Chromosome regions associated with the target traits were predicted according to the distributions of theED5 for the differential SNP loci on the chromosomes.
Differential gene expression analysis
To detect differentially expressed genes (DEGs) between the pools, a gene expression level analysis wasperformed with Htseq (v. 0.6.1). The reads per kilobases per million mapped reads (RPKM) werecalculated [71]. DEGs were screened using a preset threshold (|log2 fold change| ≥ 1 and false discoveryrate (FDR) ≤ 0.05).
Page 11/28
DNA isolation, polymerase chain reaction (PCR), and linkage analysis
A modi�ed cetyltrimethylammonium bromide (CTAB) method [72] was used to extract genomic DNA fromyoung leaves of the parental and F3:4 populations with a phenotypic segregation ratio of 3:1. The primersfor polymorphism analysis were designed in Primer Premier (v. 5.0). PCR ampli�cations were performedfollowing the instruction as described by Wang et al. [24]. PCR products were separated on 5% (w/v)denaturing polyacrylamide gels and examined by silver staining. The genetic linkage map wasconstructed by Join Map v. 4.0 [73] using the segregation data. Map distances were calculated andreported in centimorgans (cM) according to Kosambi’s mapping function [74].
Candidate gene prediction and quantitative real-time PCR (qRT-PCR) validation
Using the chromosome location of the target gene, all adjacent genes were annotated with the Brassicadatabase (http://brassicadb.org/brad/). Candidate genes were predicted according to gene annotation.PCR primers were designed to span the entire putative gene length between the mutant pylm and wildtype ‘CK-51’. The control line ‘CK-51’, with a green leaf phenotype, was obtained in the same manner asthe pylm mutant during the same period [44]. Candidate genes were cloned following the methodreferenced from Huang et al. [75]. Sequences were determined by GENEWIZ Biological Technology Co.Ltd. (Suzhou, China) and aligned with DNAMAN software.
Leaves of pylm and ‘CK-51’ were collected for total RNA extraction as previously described. Aftercon�rming its concentration and integrity, the RNA was reverse-transcribed with a FastQuant RT Kit(Tiangen, China). qRT-PCR was performed with a Bio-Rad IQ5 Real-Time PCR System (Bio-RadLaboratories, USA) and SYBR Green PCR Master Mix (Tiangen, China). All reactions were run on threebiological replicates. Two independent technical replicates per sample were processed to con�rm dataaccuracy. Primers for the candidate genes BraA09004189 (F: 5′-GCTTCCACTTCGCTTTTTCCT-3′; R: 5′-TCTTTTTCTGCTTCTCTGATGCTG-3′) and BraA07001774 (F: 5′-GGATACGACTGTGATTACACCTTCTAC-3′;R: 5′-CCGACTCCACTTCACCAACG-3′) were used in the qRT-PCR analysis. The Actin gene (F: 5′-CGAAACAACTTACAACTCCA-3′; R: 5′-CTCTTTGCTCATACGGTCA-3′) served as an endogenous control. TheqRT-PCR reaction conditions and program were those cited in Huang et al. [76]. The relative expressionlevel was calculated by the 2−ΔΔCt method [77]. Bio-Rad IQ5 (Bio-Rad Laboratories, USA) analyzed thedata.
AbbreviationsALA: 5-Aminolevulinic acid; BSA: Bulk segregation analysis; BSR-Seq: Bulked segregant RNA sequencing;Chl: Chlorophyll; cM: Centimorgans; CTAB: Cetyltrimethylammonium bromide; DEGs: Differentiallyexpressed genes; DH: Double haploid; ED: Euclidean distances; emb: embryo defective; FDR: Falsediscovery rate; ‘FT’: Fukuda 50; HO1: Heme oxygenase-1; NADPH: Nicotinamide adenine dinucleotidephosphate; PCR: Polymerase chain reaction; Proto IX: Protoporphyrin IX; pylm: pakchoi (Brassica rapa L.

Page 12/28
ssp. chinensis) yellow leaf mutant; qRT-PCR: quantitative real-time PCR; RNA-Seq: RNA sequencing;RPKM: Reads per kilobases per million mapped reads; SNP: Single-nucleotide polymorphism
DeclarationsEthics approval and consent to participate
Not applicable.
Consent for publication
Not applicable.
Availability of data and materials
The datasets analysed during the current study are available in the Brassica database(http://brassicadb.org/brad/). All data used and/or analyzed are available upon request.
Competing interests
The authors declare that they have no competing interests.
Funding
This study was funded by grants from the National Natural Science Foundation of China (No. 31672144).The funding played roles in the design of the study and collection, analysis, and interpretation of data.
Authors' contributions
KZ and FH conceived the study and designed the experiments. KZ, YM, XS and NW conducted theexperiments and collected the data. KZ and WL analyzed the data and drafted the manuscript. All authorsread and approved the �nal manuscript.
Acknowledgements
The authors thank Editage for English language editing and GENEWIZ for sequencing.
Authors' information
KZ, lecturer, College of Life Sciences, Shanxi Datong University, Datong City, Shanxi Province, People’sRepublic of China. YM and NW are postgraduates from College of Horticulture, Shenyang AgriculturalUniversity, Shenyang City, Liaoning Province, People’s Republic of China. WL, lecturer, Institute of CarbonMaterials Science, Shanxi Datong University, Datong City, Shanxi Province, People’s Republic of China.XS, laboratory technician, College of Life Sciences, Shanxi Datong University, Datong City, Shanxi
Page 13/28
Province, People’s Republic of China. HF, professor, College of Horticulture, Shenyang AgriculturalUniversity, Shenyang City, Liaoning Province, People’s Republic of China.
References1. Fromme P, Melkozernov A, Jordan P, Krauss N. Structure and function of photosystem I: interaction
with its soluble electron carriers and external antenna systems. FEBS Lett. 2003;555(1):0–44.
2. Kurata N, Miyoshi K, Nonomura KI, Yamazaki Y, Ito Y. Rice mutants and genes related to organdevelopment, morphogenesis and physiological traits. Plant Cell Physiol. 2005;46(1):48–62.
3. Schultes NP, Sawers RJH, Brutnell TP, Krueger RW. Maize high chlorophyll �uorescent 60 mutation iscaused by an Ac disruption of the gene encoding the chloroplast ribosomal small subunit protein 17.Plant J. 2000;21(4):317–327.
4. Motohashi K, Koyama F, Nakanishi Y, Ueoka-Nakanishi H, Hisabori T. Chloroplast Cyclophilin is atarget protein of thioredoxin THIOL MODULATION OF THE PEPTIDYL-PROLYL CIS-TRANSISOMERASE ACTIVITY. J Biol Chem. 2003;278(34):31848–31852.
5. Song M, Wei Q, Wang J, Fu W, Qin X, Lu X, Cheng F, Yang K, Zhang L, Yu X, Li J, Chen J, Lou Q. Finemapping of CsVYL, conferring virescent leaf through the regulation of chloroplast development incucumber. Front Plant Sci. 2018;9:432–443.
�. Stern DB, Hanson MR, Barkan A. Genetics and genomics of chloroplast biogenesis: Maize as amodel system. Trends Plant Sci. 2004;9(6):293–301.
7. Kusaba M, Ito H, Morita R, Iida S, Sato Y, Fujimoto M, Kawasaki S, Tanaka R, Hirochika H, NishimuraM, Tanaka A. Rice NON-YELLOW COLORING1 is involved in light-harvesting complex II and granadegradation during leaf senescence. Plant Cell. 2007;19(4):1362–1375.
�. Bang WY, Jeong IS, Kim DW, Im CH, Ji C, Hwang SM, Kim SW, Son YS, Jeong J, Shiina T, Bahk JD.Role of Arabidopsis CHL27 protein for photosynthesis, chloroplast development and gene expressionpro�ling. Plant Cell Physiol. 2008;49(9):1350–1363.
9. Chen P, Hu H, Zhang Y, Wang Z, Dong G, Cui Y, Qian Q, Ren D, Guo LB. Genetic analysis and �ne-mapping of a new rice mutant, white and lesion mimic leaf1. Plant Growth Regul. 2018;85(3):425–435.
10. Jarvis P, Dörmannn Peter, Peto CA, Lutes J, Benning C, Chory J. Galactolipid de�ciency and abnormalchloroplast development in the Arabidopsis MGD synthase 1 Proc Natl Acad Sci. 2000;97(14):8175–8179.
11. Zhang H, Li J, Yoo JH, Yoo SC, Cho SH, Koh HJ, Seo HS, Paek NC. Rice Chlorina-1 and Chlorina-9encode ChlD and ChlI subunits of Mg-chelatase, a key enzyme for chlorophyll synthesis andchloroplast development. Plant Mol Biol. 2006;62(3):325–337.
12. Moon S, Giglione C, Lee DY, An S, Jeong DH, Meinnel T, An G. Rice peptide deformylase PDF1B iscrucial for development of chloroplasts. Plant Cell Physiol. 2008;49(10):1536–1546.
Page 14/28
13. Hui Z, Tian FX, Wang GK, Wang GP, Wang W. The antioxidative defense system is involved in thedelayed senescence in a wheat mutant tasg1. Plant Cell Rep. 2012;31(6):1073–1084.
14. Zhu L, Zeng X, Chen Y, Yang Z, Qi L, Pu Y, Yi B, Wen J, Ma C, Shen J, Tu J, Fu T. Geneticcharacterisation and �ne mapping of a chlorophyll-de�cient mutant (ygl) in Brassica napus. MolBreed. 2014;34(2):603–614.
15. Liu XP, Yang C, Han FQ, Fang ZY, Yang LM, Zhuang M, Lv HH, Liu YM, Li ZS, Zhang YY. Genetics and�ne mapping of a yellow-green leaf gene (ygl-1) in cabbage (Brassica oleracea capitata L.). MolBreed. 2016;36(6):82–89.
1�. Mueller AH, Dockter C, Gough SP, Lundqvist U, von Wettstein D, Hansson M. Characterization ofmutations in barley fch2 encoding chlorophyllide a oxygenase. Plant Cell Physiol. 2012;53:1232–1246.
17. Zhou S, Hu Z, Zhu M, Zhang B, Deng L, Pan Y, Chen G. Biochemical and molecular analysis of atemperature-sensitive albino mutant in kale named “White Dove”. Plant Growth Regul.2013;71(3):281–
1�. Wu Q, Wu X, Zhang X, Jiang C, Xiao B, Zhang Y, Wang Y, Liu G. Mapping of two white stem genes intetraploid common tobacco (Nicotiana tabacum). Mol Breed. 2014;34(3):1065–1074.
19. Fang C, Li C, Li W, Wang Z, Zhou Z, Shen Y, Wu M, Wu Y, Li G, Kong LA, Liu C, Jackson SA, Tian Z.Concerted evolution of D1 and D2 to regulate chlorophyll degradation in soybean. Plant J.2014;77(5):700–712.
20. Song M, Yang Z, Fan S, Zhu H, Pang C, Tian M, Yu S. Cytological and genetic analysis of a virescentmutant in upland cotton (Gossypium hirsutum). Euphytica. 2012;187(2):235–245.
21. Gao M, Hu L, Li Y, Weng Y. The chlorophyll-de�cient golden leaf mutation in cucumber is due to asingle nucleotide substitution in CsChlI for magnesium chelatase I subunit. Theor Appl Genet.2016;129(10):1961–1973.
22. Wang P, Gao J, Wan C, Zhang F, Xu Z, Huang X, Sun X, Deng X. Divinyl chlorophyll (ide) a can beconverted to monovinyl chlorophyll (ide) a by a divinyl reductase in rice. Plant Physiol.2010;153(3):994–1003.
23. Ansari MJ, Al-Ghamdi A, Kumar R, Usmani S, AL-Attal Y, Nuru A, Mohamed AA, Singh K, Dhaliwal HS.Characterization and gene mapping of a chlorophyll-de�cient mutant clm1 of Triticum monococcumBiol Plant. 2012;57(3):442–448.
24. Wang N, Liu Z, Zhang Y, Li C, Feng H. Identi�cation and �ne mapping of a stay-green gene (Brnye1)in pakchoi (Brassica campestris ssp. chinensis). Theor Appl Genet. 2018;131(3):673–684.
25. Zhao H, Yu L, Huai Z, Wang X, Ding G, Chen S, Li P, Xu F. Mapping and candidate gene identi�cationde�ning BnChd1-1, a locus involved in chlorophyll biosynthesis in Brassica napus. Acta PhysiolPlant. 2014;36(4):859–870.
2�. Li N, Jia J, Xia C, Liu X and Kong X. Characterization and mapping of novel chlorophyll de�cientmutant genes in durum wheat. Breed Sci. 2013;63(2):169–175.
Page 15/28
27. Tian Y, Huang Q, Liu H, Wang J, An R, Liu X, Hu W. Inheritance of chlorophyll-de�cient mutant L638-yin Brassica juncea and molecular markers for chlorophyll-de�cient gene gr1. J Northwest AgricForest Univ (Nat Sci Ed). 2012;40(12): 90-96. (in Chinese)
2�. Barak S, Heimer Y, Nejidat A, Volkita M. The peroxisomal glycolate oxidase gene is differentiallyexpressed in yellow and white sectors of the DP1 variegated tobacco mutant. Physiol Plant.2000;110(1):120–126.
29. Colombo N, Emanuel C, Lainez V, Maldonado S, Prina AR, Börner T. The barley plastome mutant CL2affects expression of nuclear and chloroplast housekeeping genes in a cell-age dependent manner.Mol Gen Genomics. 2008;279(4):403–4
30. Tang X, Wang Y, Zhang Y, Huang S, Liu Z, Fei D, Feng H. A missense mutation of plastid RPS4 isassociated with chlorophyll de�ciency in Chinese cabbage (Brassica campestris pekinensis). BMCPlant Biol. 2018;18(1):130–140.
31. Nagata N, Tanaka R, Satoh S, Tanaka A. Identi�cation of a vinyl reductase gene for chlorophyllsynthesis in Arabidopsis thaliana and implications for the evolution of Prochlorococcus Species.Plant Cell. 2005;17(1):233–240.
32. Frick G, Su Q, Apel K, Armstrong GA. An Arabidopsis porB porC double mutant lacking light-dependent NADPH: protochlorophyllide oxidoreductases B and C is highly chlorophyll-de�cient anddevelopmentally arrested. Plant J. 2003;35(2):141–153.
33. Sheng Z, Lv Y, Li W, Luo R, Wei X, Xie L, Jiao G, Shao G, Wang J, Tang S, Hu P. Yellow-Leaf 1 encodesa magnesium-protoporphyrin IX monomethyl ester cyclase, involved in chlorophyll biosynthesis inrice (Oryza sativa). PLoS ONE. 2017;12(5):e0177989.
34. Yoo SC, Cho SH, Zhang H, Paik HC, Lee CH, Li J, Yoo JH, Lee BW, Koh HJ, Seo HS, Paek NC.Quantitative trait loci associated with functional stay green SNU-SG1 in rice. Mol Cells.2007;24(1):83–94.
35. Morita R, Sato Y, Masuda Y, Nishimura M, Kusaba M. Defect in non-yellow coloring 3, an alpha/betahydrolase-fold family protein, causes a stay green phenotype during leaf senescence in rice. Plant J.2009;59(6):940–952.
3�. Weller JL, Terry MJ, Rameau C, Reid JB, Kendrick RE. The phytochrome-de�cient pcd1 mutant of peais unable to convert heme to biliverdin IXα. Plant Cell. 1996;8(1):55–67.
37. Terry MJ, Kendrick RE. Feedback inhibition of chlorophyll synthesis in the phytochromechromophore-de�cient aurea and yellow-green-2 mutants of tomato. Plant Physiol.1999;119(1):143–152.
3�. Xie YJ, Xu DK, Cui WT, Shen WB. Mutation of Arabidopsis HY1 causes UV-C hypersensitivity byimpairing carotenoid and �avonoid biosynthesis and the down-regulation of antioxidant defence. JExp Bot. 2012;63(10):3869–3883.
39. Xu S, Wang L, Zhang B, Han B, Xie Y, Yang J, Zhong W, Chen H, Wang R, Wang N, Cui W, Shen W.RNAi knockdown of rice SE5 gene is sensitive to the herbicide methyl viologen by the down-regulation of antioxidant defense. Plant Mol Biol. 2012;80(2):219–235.
Page 16/28
40. Chen H, Cheng Z, Ma X, Wu H, Liu Y, Zhou K, Chen Y, Ma W, Bi J, Zhang X, Guo X, Wang J, Lei C, Wu F,Lin Q, Liu Y, Liu L, Jiang L. A knockdown mutation of YELLOW-GREEN LEAF2 blocks chlorophyllbiosynthesis in rice. Plant Cell Rep. 2013;32(12):1855–1867.
41. Li Q, Zhu FY, Gao X, Sun Y, Li S, Tao Y, Lo C, Liu H. Young leaf chlorosis 2, encodes the stroma-localized heme oxygenase 2 which is required for normal tetrapyrrole biosynthesis in rice. Planta.2014;240(4):701–712.
42. Linley PJ, Landsberger M, Kohchi T, Cooper JB, Terry MJ. The molecular basis of heme oxygenasede�ciency in the pcd1mutant of pea. Febs J. 2006;273(12):2594–2606.
43. Shi D, Zheng X, Li L, Lin W, Xie W, Yang J, Chen S, Jin W. Chlorophyll de�ciency in the maizeelongated mesocotyl2 mutant is caused by a defective heme oxygenase and delaying granastacking. PLoS One. 2013;8(11):e80107.
44. Zhang K, Liu Z, Shan X, Li C, Tang X, Chi M, Feng H. Physiological properties and chlorophyllbiosynthesis in a Pak-choi (Brassica rapa, L. ssp. chinensis) yellow leaf mutant, pylm. Acta PhysiolPlant. 2017;39(1):22–32.
45. Franzmann LH, Yoon ES, Meinke DW. Saturating the genetic map of Arabidopsis thaliana withembryonic mutations. Plant J. 1995;7(2):341–350.
4�. Patton DA, Franzmann LH, Meinke DW. Mapping genes essential for embryo development inArabidopsis thaliana. Mol Gen Genet. 1991;227(3):337–347.
47. Jung KH, Hur J, Ryu CH, Choi Y, Chung YY, Miyao A, Hirochika H, An G. Characterization of a ricechlorophyll-de�cient mutant using the T-DNA gene-trap system. Plant Cell 2003;44(5):463–472.
4�. Wu Z, Zhang X, He B, Diao L, Sheng S, Wang J, Guo X, Su N, Wang L, Jiang L, Wang C, Zhai H, Wan J.A chlorophyll-de�cient rice mutant with impaired chlorophyllide esteri�cation in chlorophyllbiosynthesis. Plant Physiol. 2007;145(1):29–40.
49. Jander G, Norris SR, Rounsley SD, Bush DF, Levin IM, Last RL. Arabidopsis map-based cloning in thepost-genome era. Plant Physiol. 2002;129(2):440–450.
50. Sang XC, Fang LK, Vanichpakorn Y, Ling YH, Du P, Zhao FM, Yang ZL, He GH. Physiological characterand molecular mapping of leaf-color mutant wyv1 in rice (Oryza sativa). Genes Genomics.2010;32(2):123–128.
51. Xie K, Wu S, Li Z, Zhou Y, Zhang D, Dong Z, An X, Zhu T, Zhang S, Liu S, Li J, Wan Map-based cloningand characterization of Zea mays male sterility33 (ZmMs33) gene, encoding a glycerol-3-phosphateacyltransferase. Theor Appl Genet. 2018;131(6):1363–1378.
52. Trick M, Adamski NM, Mugford SG, Jiang CC, Febrer M, Uauy Combining SNP discovery from next-generation sequencing data with bulked segregant analysis (BSA) to �ne-map genes in polyploidwheat. BMC Plant Biol. 2012;12(1):14–30.
53. Lee YP, Cho Y, Kim S. A high-resolution linkage map of the Rfd1, a restorer-of-fertility locus forcytoplasmic male sterility in radish (Raphanus sativus) produced by a combination of bulkedsegregant analysis and RNA-Seq. Theor Appl Genet. 2014;127(10):2243–2252.
Page 17/28
54. Lu H, Lin T, Klein J, Wang S, Qi J, Zhou Q, Sun J, Zhang Z, Weng Y, Huang S. QTL-seq identi�es anearly �owering QTL located near Flowering Locus T in cucumber. Theor Appl Genet.2014;127(7):1491–1499.
55. Ramirez-Gonzalez RH, Segovia V, Bird N, Fenwick P, Holdgate S, Berry S, Jack P, Caccamo M, Uauy C.RNA-seq bulked segregant analysis enables the identi�cation of high-resolution genetic markers forbreeding in hexaploid wheat. Plant Biotechnol J. 2015;13(5):613–624.
5�. Schneeberger K, Weigel D. Fast-forward genetics enabled by new sequencing technologies. Trends inPlant Sci. 2011;16(5):282–288.
57. Nestler J, Liu S, Wen TJ, Paschold A, Marcon C, Tang HM, Li D, Li L, Meeley RB, Sakai H, Bruce W,Schnable PS, Hochholdinger F. Roothairless5, which functions in maize (Zea mays) root hairinitiation and elongation encodes a monocot-speci�c NADPH oxidase. Plant J. 2014;79(5):729–740.
5�. Tang HM, Liu S, Hill-Skinner S, Wu W, Reed D, Yeh CT, Nettleton D, Schnable PS. The maize brownmidrib2 (bm2) gene encodes a methylenetetrahydrofolate reductase that contributes to ligninaccumulation. Plant J. 2014;77(3):380–392.
59. Tan C, Liu Z, Huang S, Feng H. Mapping of the male sterile mutant gene ftms in Brassica rapa ssp.pekinensis via BSR-Seq combined with whole-genome resequencing. Theor Appl Genet.2019;132(2):355–370.
�0. Davis SJ, Kurepa J, Vierstra RD. The Arabidopsis thaliana HY1 locus, required for phytochrome-chromophore biosynthesis, encodes a protein related to heme oxygenases. Proc Natl Acad Sci.1999;96(11):6541–6546.
�1. Ortiz de Montellano PR, Wilks A. Heme oxygenase structure and mechanism. Adv Inorg Chem.2000;51(1):359–407.
�2. Quail P. Phytochrome photosensory signalling networks. Nat Rev Mol Cell Biol. 2002;3(2):85–93.
�3. Emborg TJ, Walker JM, Noh B, Vierstra RD. Multiple heme oxygenase family members contribute tothe biosynthesis of the phytochrome chromophore in Arabidopsis. Plant Physiol. 2006;140(3):856–868.
�4. Terry MJ, Maines MD, Lagarias JC. Inactivation of phytochrome- and phycobiliprotein-chromophoreprecursors by rat liver biliverdin reductase. J Biol Chem. 1993;268(35):26099–26106.
�5. Despres B, Delseny M, Devic M. Partial complementation of embryo defective mutations: a generalstrategy to elucidate gene function. Plant J. 2001;27(2):149–159.
��. Shen Y, Li C, McCarty DR, Meeley R, Tan BC. Embryo defective12 encodes the plastid initiation factor3 and is essential for embryogenesis in maize. Plant J. 2013;74(5):792–804.
�7. Li Z, Thomas LT. PEI1, an embryo-speci�c zinc �nger protein gene required for heart-stage embryoformation in Arabidopsis. Plant Cell. 1998;10(3):383–398.
��. Huang S, Liu Z, Li D, Yao R, Meng Q, Feng H. Screening of Chinese cabbage mutant produced by60Co-ray mutagenesis of isolated microspore cultures. Plant Breed. 2014;133:480–488.
Page 18/28
�9. Kim D, Langmead B, Salzberg SL. HISAT: a fast spliced aligner with low memory requirements. NatMethods. 2015;12(4):357–362.
70. Su A, Song W, Xing J, Zhao Y, Zhang R, Li C, Duan M, Luo M, Shi Z, Zhao J. Identi�cation of genespotentially associated with the fertility instability of s-type cytoplasmic male sterility in maize viabulked segregant RNA-Seq. Plos One. 2016;11(9):e0163489.
71. Mortazavi A, Williams BA, McCue K, Schaeffer L, Wold B. Mapping and quantifying mammaliantranscriptomes by RNA-Seq. Nat Methods. 2008;5(7):621–628.
72. Murray MG, Thompson WF. Rapid isolation of high molecular weight plant DNA. Nucleic Acids Res.1980;8(19):4321–4326.
73. Van Ooijen J. Joinmap 4.0 software for the calculation of genetic linkage maps in experimentalpopulations. Wageningen: Kyazma BV; 2006.
74. Kosambi DD. The estimation of map distance from recombination values. Ann Eugen.1944;12(1):172–175.
75. Huang S, Liu Z, Yao R, Li D, Zhang T, Li X, Hou L, Wang Y, Tang X, Feng H. Candidate gene predictionfor a petal degeneration mutant, pdm, of the Chinese cabbage (Brassica campestris, ssp. pekinensis)by using �ne mapping and transcriptome analysis. Mol Breed. 2016;36(3):26–35.
7�. Huang S, Liu Z, Yao R, Li D, Feng H. Comparative transcriptome analysis of the petal degenerationmutant pdm in Chinese cabbage (Brassica campestris ssp.pekinensis) using RNA-Seq. Mol GenetGenomics. 2015;290(5):1833–1847.
77. Livak KJ, Schmittgen TD. Analysis of relative gene expression data using real-time quantitative PCRand the 2−ΔΔCt Methods. 2001;25(4):402–408.
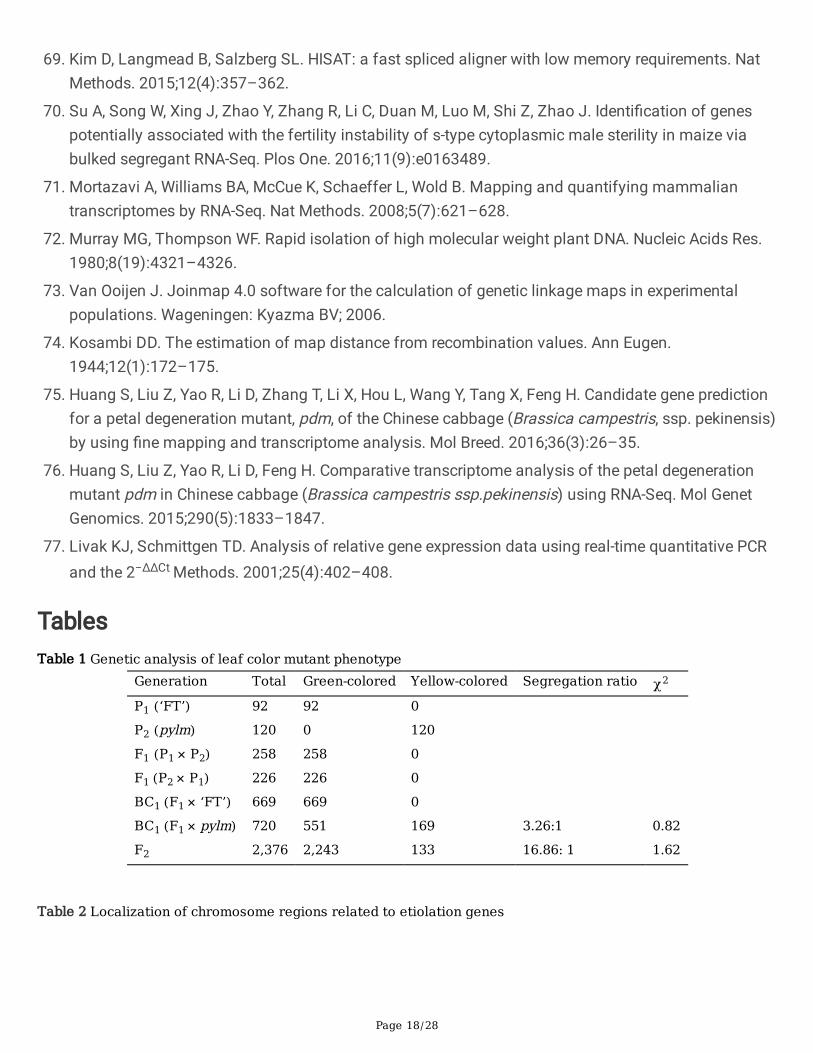
TablesTable 1 Genetic analysis of leaf color mutant phenotype
Generation Total Green-colored Yellow-colored Segregation ratio χ2
P1 (‘FT’) 92 92 0
P2 (pylm) 120 0 120
F1 (P1 × P2) 258 258 0
F1 (P2 × P1) 226 226 0
BC1 (F1 × ‘FT’) 669 669 0
BC1 (F1 × pylm) 720 551 169 3.26:1 0.82
F2 2,376 2,243 133 16.86: 1 1.62
Table 2 Localization of chromosome regions related to etiolation genes
Page 19/28
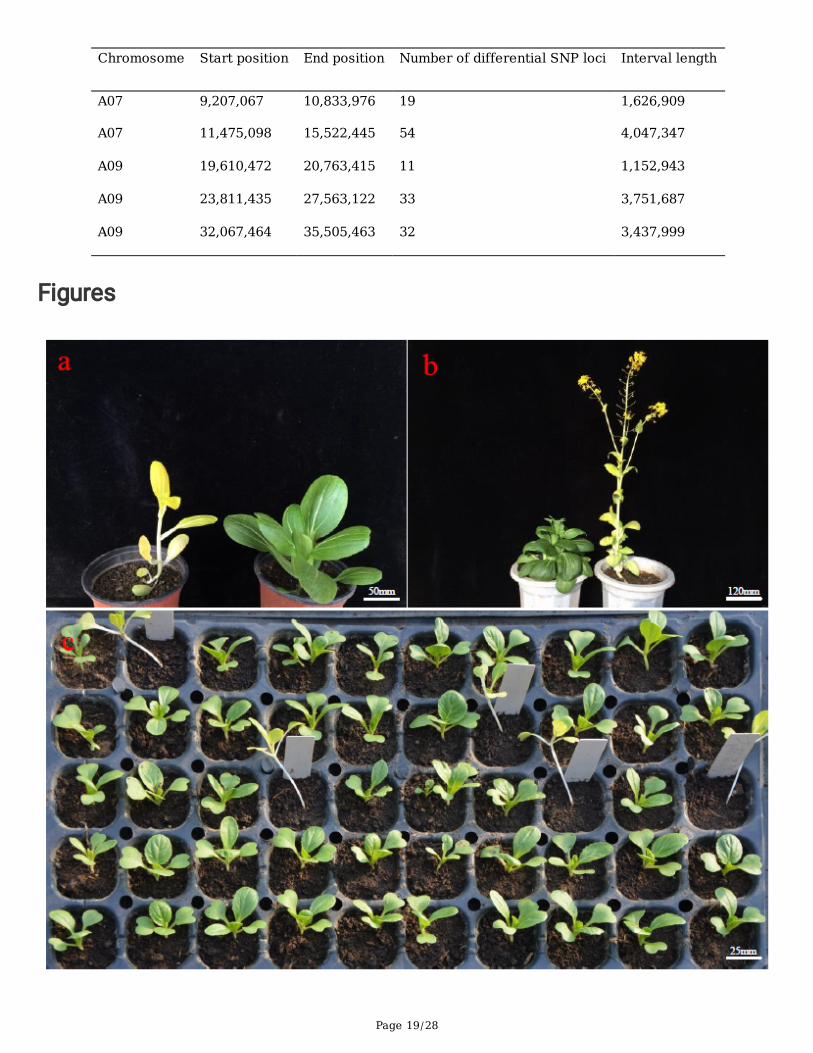
Chromosome Start position End position Number of differential SNP loci Interval length
A07 9,207,067 10,833,976 19 1,626,909
A07 11,475,098 15,522,445 54 4,047,347
A09 19,610,472 20,763,415 11 1,152,943
A09 23,811,435 27,563,122 33 3,751,687
A09 32,067,464 35,505,463 32 3,437,999
Figures

Page 20/28
Figure 1
Phenotypes of mutant pylm and wild type ‘CK-51’. a pylm (left) and ‘CK-51’ (right) at the seedling stage; b‘CK-51’ (left) and pylm (right) at the bolting stage; c Seedling morphology of 2-wk pylm and ‘CK-51’ plants.Labeled plants in the tray are pylm. Scale bar: a-50 mm; b-120 mm; c-25 mm
Figure 2
Genetic model for the pylm mutant. G and Y indicate green-colored and yellow-colored plants, respectively

Page 21/28
Figure 3
ED5 distributions on chromosomes. Each color on the X-axis represents different chromosomes ofBrassica rapa. Y-axis represents ED5 for each differential SNP locus. Horizontal line is the threshold ofthe top 1% ED5
Page 22/28
Figure 4
Genetic and physical py1 maps and candidate gene analysis. a: Chromosome A09 linkage map wasconstructed with 1,520 pylm individuals from the No. 1 F3:4 family. The py1 was preliminarily mappedbetween SSRzk17 and SSRzk28; b: Fine mapping of py1. The py1 was restricted to the region betweenIndelzk125 and SSRzk36. Number of recombinants between the markers and py1 is shown below thegenetic map. The mapping distance above the linkage map is in centimorgan (cM) units; c: Candidatepy1 region and the annotated genes in the Brassica database. The py1 locus was narrowed to a 258.3-kbregion comprising 34 predicted genes. The numbers 1-34 refer to the candidate genes. The arrowsindicate the direction of gene expression. Detailed information on the 34 genes is presented in Table S6

Page 23/28
Figure 5
Sequence alignments of BraA09004189 in ‘CK-51’ and pylm
Page 24/28
Figure 6
BraA09004189 expression analyses by qRT-PCR for pylm and ‘CK-51’. Error bars indicate standard errorsof the means of three replicates
Page 25/28
Figure 7
Genetic and physical maps of py2 and candidate gene analysis. a: Linkage map of chromosome A07was constructed with 1,860 individuals bearing the pylm phenotype in the No. 3 F3:4 family. The py2 waspreliminarily mapped between SSR133 and SSR103; b: Fine mapping of py2. The py2 was restricted tothe region between SSR11 and SSR15. The number of recombinants between the markers and py2 isshown under the genetic map. The distance above the linkage map is in centimorgan (cM) units; c:Candidate py2 region and annotated genes in the Brassica database. The py2 locus was narrowed to a4.4-kb region containing the �ve predicted genes BraA07001773-BraA07001777. Arrows indicate thedirection of gene expression. Detailed information on these genes is presented in Table S9

Page 26/28
Figure 8
Sequence alignments of BraA07001774 in ‘CK-51’ and pylm

Page 27/28
Figure 9
Amino acid sequence alignments of BraA07001774 in ‘CK-51’ and pylm
Page 28/28
Figure 10
Expression analysis of BraA07001774 in pylm and ‘CK-51’ by qRT-PCR. Error bars indicate standard errorsof the means of three replicates
Supplementary Files
This is a list of supplementary �les associated with this preprint. Click to download.
Fig.S2.pdf
Fig.S1.pdf
TableS.docx