Embed Size (px)
Citation preview
PY 2019 State Data Book
Illinois
February 2021 Prepared for:
Office of Policy Development and Research
Employment and Training Administration
US Department of Labor
200 Constitution Ave. NW
Washington DC 20210

i PY 2019 State Data Book
Contents
Guide to the Reader ............................................................................................ 1
What is Included in This Data Book ......................................................................................................... 1
A Word About Missing Data .................................................................................................................... 2
Overview of the Tables ............................................................................................................................ 3
Summary of Table Notation and Units of Measurement ....................................................................... 4
Quality of the Underlying Data ............................................................................................................... 5
Part I: Summary Comparisons Across Programs .................................................. 7
Table I-1 Number of Program Participants (including Exiters) and Reportable Individuals from July 2019 to June 2020, by State and Program ........................................................................... 8
Table I-2 Trend in the Number of Exiters, by Program of Participation and Reporting Period.............. 10
Table I-3 Number of Exiters from April 2019 to March 2020, by State and Program of Participation .............................................................................................................................. 11
Table I-4 Number of State Exiters from April 2019 to March 2020,...........................................................
by Program and Selected Characteristics ............................................................................................... 13
Table I-5 Trends in the Number of WIOA Adult Participants, by State and Reporting Period ............... 15
Table I-6 Trends in the Number of WIOA Dislocated Worker Participants from State and Local Programs, by State and Reporting Period ................................................................................. 17
Table I-7 Trends in the Number of Dislocated Worker Grant Participants, by State, Reporting Period, and DWG Type .............................................................................................................. 19
Table I-8 Trends in the Number of WIOA Youth Participants, by State and Reporting Period .............. 21
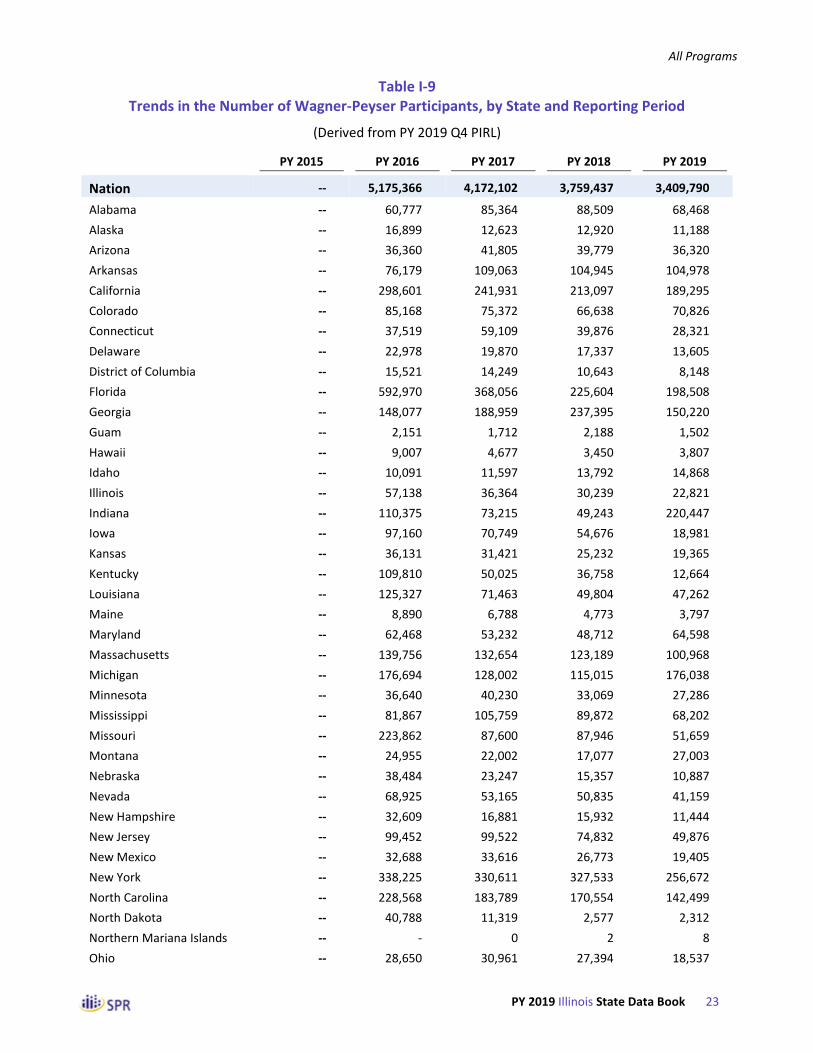
Table I-9 Trends in the Number of Wagner-Peyser Participants, by State and Reporting Period ......... 23
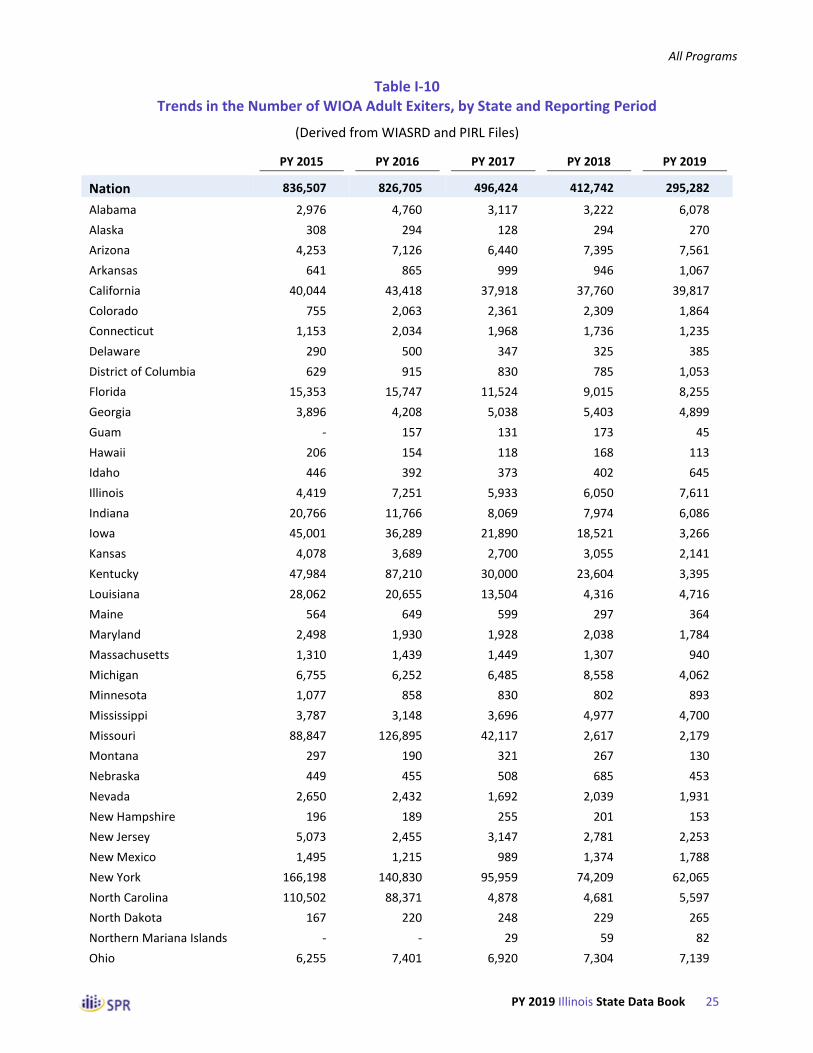
Table I-10 Trends in the Number of WIOA Adult Exiters, by State and Reporting Period ..................... 25
Table I-11 Trends in the Number of WIOA Dislocated Worker Exiters from State and Local Programs, by State and Reporting Period ................................................................................. 27
Table I-12 Trends in the Number of Dislocated Worker Grant Exiters, by State, Reporting Period, and DWG Type ........................................................................................................................... 29
Table I-13 Trends in the Number of WIOA Youth Exiters, by State and Reporting Period .................... 31
Table I-14 Trends in the Number of Wagner-Peyser Exiters, by State and Reporting Period................ 33
Part II: Adult Program ....................................................................................... 35
Table II-1 Trends in the Characteristics of Adult Exiters, by Reporting Period ...................................... 36
Table II-2 Trends in the Number of Adult Exiters, by Reporting Period ................................................. 38
Table II-3 Characteristics of Adults Who Exited from April 2019 to March 2020, by Age at Program Entry ............................................................................................................................ 40
Table II-4 Characteristics of Adults Who Exited from April 2019 to March 2020, by Ethnicity and Race ........................................................................................................................................... 42

ii PY 2019 State Data Book
Table II-5 Characteristics of Adults Who Exited from April 2019 to March 2020, by Gender, Employment Status, and Disability Status ................................................................................. 44
Table II-6 Characteristics of Adults Who Exited from April 2019 to March 2020, by Other Employment Characteristics ...................................................................................................... 46
Table II-7 Characteristics of Adults Who Exited from April 2019 to March 2020, by Adult Program Priority Groups .......................................................................................................................... 48
Table II-8 Characteristics of Adults Who Exited from April 2019 to March 2020, by Highest Educational Level ....................................................................................................................... 50
Table II-9 Characteristics of Adults Who Exited from April 2019 to March 2020, by Selected Other Characteristics ................................................................................................................. 52
Table II-10 Characteristics of Adults Who Exited from April 2019 to March 2020, by Major Service Categories ..................................................................................................................... 53
Table II-11 Number of Adults Who Exited from April 2019 to March 2020, by Major Service Categories .................................................................................................................................. 56
Table II-12 Characteristics of Adult Trainees Who Exited from April 2019 to March 2020, by Type of Training .................................................................................................................................. 58
Table II-13 Trends Over Time in Services Received by Adult Exiters, by Reporting Period .................... 60
Table II-14 Trends Over Time in the Number of Adult Exiters Who Received Various Services, by Reporting Period ........................................................................................................................ 63
Table II-15 Services Received by Adults Who Exited from April 2019 to March 2020, by Age at Program Entry ............................................................................................................................ 66
Table II-16 Services Received by Adults Who Exited from April 2019 to March 2020, by Ethnicity and Race .................................................................................................................................... 69
Table II-17 Services Received by Adults Who Exited from April 2019 to March 2020, by Gender, Employment Status, and Disability Status ................................................................................. 72
Table II-18 Services Received by Adults Who Exited from April 2019 to March 2020, by Other Employment Characteristics ...................................................................................................... 75
Table II-19 Services Received by Adults Who Exited from April 2019 to March 2020, by Adult Program Priority Groups ............................................................................................................ 78
Table II-20 Services Received by Adults Who Exited from April 2019 to March 2020, by Highest Educational Level ....................................................................................................................... 81
Table II-21 Services Received by Adults Who Exited from April 2019 to March 2020, by Selected Other Characteristics ................................................................................................................. 84
Table II-23 Services Received by Adults Who Exited from April 2019 to March 2020, by State ............ 87
Table II-24 Training Services Received by Adult Trainees Who Exited from April 2019 to March 2020, by State ............................................................................................................................ 89
Table II-25 Trends in the Outcomes of Adults, by Performance Period ................................................. 91
Table II-26 Trends in the Number of Adults Who Achieved Various Outcomes, by Performance Period ........................................................................................................................................ 94
Table II-27 Outcomes of Adults, by Age at Program Entry ..................................................................... 97

iii PY 2019 State Data Book
Table II-28 Outcomes of Adults, by Ethnicity and Race ........................................................................ 100
Table II-29 Outcomes of Adults, by Gender, Employment Status, and Disability Status ..................... 103
Table II-30 Outcomes of Adults, by Other Employment Characteristics .............................................. 106
Table II-31 Outcomes of Adults, by Adult Program Priority Groups .................................................... 109
Table II-32 Outcomes of Adults, by Highest Educational Level ............................................................ 112
Table II-33 Outcomes of Adults, by Selected Other Characteristics ..................................................... 115
Table II-34 Outcomes of Adults, by Major Service Category ................................................................ 118
Table II-35 WIOA Primary Indicators of Performance for Adults, by State .......................................... 121
Table II-36 WIA Common Measures for Adults, by State ..................................................................... 123
Part III: Dislocated Worker Program ................................................................ 125
Table III-1 Trends in the Characteristics of Dislocated Worker Exiters, by Reporting Period .............. 126
Table III-2 Trends in the Number of Dislocated Worker Exiters, by Reporting Period ......................... 129
Table III-3 Characteristics of Dislocated Workers Who Exited from April 2019 to March 2020, by Funding Source ........................................................................................................................ 132
Table III-4 Characteristics of Dislocated Workers Who Exited from April 2019 to March 2020, by Age at Program Entry .............................................................................................................. 135
Table III-5 Characteristics of Dislocated Workers Who Exited from April 2019 to March 2020, by Ethnicity and Race .............................................................................................................. 138
Table III-6 Characteristics of Dislocated Workers Who Exited from April 2019 to March 2020, by Gender, Employment Status, and Disability Status ............................................................ 141
Table III-7 Characteristics of Dislocated Workers Who Exited from April 2019 to March 2020, by Other Employment Characteristics ......................................................................................... 144
Table III-8 Characteristics of Dislocated Workers Who Exited from April 2019 to March 2020, by Veteran Status and Selected Barriers to Employment ............................................................ 147
Table III-9 Characteristics of Dislocated Workers Who Exited from April 2019 to March 2020, by Highest Educational Level ........................................................................................................ 150
Table III-10 Characteristics of Dislocated Workers Who Exited from April 2019 to March 2020, by Selected Other Characteristics ................................................................................................ 153
Table III-11 Characteristics of Dislocated Workers Who Exited from April 2019 to March 2020, by Major Service Categories ......................................................................................................... 156
Table III-12 Number of Dislocated Workers Who Exited from April 2019 to March 2020, by Major Service Categories ................................................................................................................... 159
Table III-13 Characteristics of Dislocated Worker Trainees Who Exited from April 2019 to March 2020, by Type of Training ........................................................................................................ 162
Table III-14 Trends in Services Received by Dislocated Worker Exiters, by Reporting Period ............. 165
Table III-15 Trends in the Number of Dislocated Worker Exiters Who Received Various Services, by Reporting Period ................................................................................................................. 168

iv PY 2019 State Data Book
Table III-16 Services Received by Dislocated Workers Who Exited from April 2019 to March 2020, by Funding Source ......................................................................................................... 171
Table III-17 Services Received by Dislocated Workers Who Exited from April 2019 to March 2020, by Age at Program Entry ................................................................................................ 174
Table III-18 Services Received by Dislocated Workers Who Exited from April 2019 to March 2020, by Ethnicity and Race .................................................................................................... 177
Table III-19 Services Received by Dislocated Workers Who Exited from April 2019 to March 2020, by Gender, Employment Status, and Disability Status .................................................. 180
Table III-20 Services Received by Dislocated Workers Who Exited from April 2019 to March 2020, by Other Employment Characteristics .......................................................................... 183
Table III-21 Services Received by Dislocated Workers Who Exited from April 2019 to March 2020, by Veteran Status and Selected Barriers to Employment ............................................. 186
Table III-22 Services Received by Dislocated Workers Who Exited from April 2019 to March 2020, by Highest Educational Level ......................................................................................... 189
Table III-23 Services Received by Dislocated Workers Who Exited from April 2019 to March 2020, by Selected Other Characteristics ................................................................................. 192
Table III-25 Services Received by Dislocated Workers Who Exited from April 2019 to March 2020, by State .......................................................................................................................... 195
Table III-26 Training Services Received by Dislocated Worker Trainees Who Exited from April 2019 to March 2020, by State ................................................................................................. 197
Table III-27 Trends in the Outcomes of Dislocated Workers, by Performance Period ........................ 199
Table III-28 Trends in the Number of Dislocated Workers Who Achieved Various Outcomes, by Performance Period................................................................................................................. 201
Table III-29 Outcomes of Dislocated Workers, by Funding Source ...................................................... 205
Table III-30 Outcomes of Dislocated Workers, by Age at Program Entry ............................................ 208
Table III-31 Outcomes of Dislocated Workers, by Ethnicity and Race6 ................................................ 211
Table III-32 Outcomes of Dislocated Workers, by Gender, Employment Status, and Disability Status ....................................................................................................................................... 214
Table III-33 Outcomes of Dislocated Workers, by Other Employment Characteristics ....................... 217
Table III-34 Outcomes of Dislocated Workers, by Selected Barriers to Employment .......................... 220
Table III-35 Outcomes of Dislocated Workers, by Highest Educational Level ...................................... 223
Table III-36 Outcomes of Dislocated Workers, by Selected Other Characteristics .............................. 226
Table III-37 Outcomes of Dislocated Workers, by Major Service Category ......................................... 229
Table III-38 WIOA Primary Indicators of Performance for Dislocated Workers, by State .................... 232
Table III-39 WIA Common Measures for Dislocated Workers, by State ............................................... 234
Part IV: Dislocated Worker Grants .................................................................. 237
Table IV-1 Characteristics of Dislocated Worker Grant Exiters, Comparing Nation to State by DWG Type ................................................................................................................................ 238

v PY 2019 State Data Book
Table IV-2 Number of Dislocated Worker Grant Exiters, Comparing Nation to State by DWG Type .. 241
Table IV-3 Characteristics of Dislocated Worker Grant Exiters Who Exited from April 2018 to March 2019, by Major Service Categories .............................................................................. 243
Table IV-4 Number of Dislocated Worker Grant Exiters Who Exited from April 2018 to March 2019, by Major Service Categories .......................................................................................... 245
Table IV-5 Characteristics of Dislocated Worker Grant Trainees Who Exited from April 2018 to March 2019, by Type of Training ............................................................................................. 247
Table IV-6 Services Received by Dislocated Worker Grant Exiters, Comparing Nation to State by DWG Type ................................................................................................................................ 249
Table IV-7 Number of Dislocated Worker Grant Exiters Who Received Various Services, Comparing Nation to State by DWG Type ............................................................................... 253
Table IV-15 Services Received by Dislocated Worker Grant Exiters Who Exited from April 2018 to March 2019, by State .............................................................................................................. 256
Table IV-16 Training Services Received by Dislocated Worker Grant Trainees Who Exited from April 2018 to March 2019, by State ......................................................................................... 258
Table IV-17 Outcomes of Dislocated Worker Grant Exiters, Comparing Nation to State by DWG Type ......................................................................................................................................... 260
Table IV-18 Number of Dislocated Worker Grant Exiters Who Achieved Various Outcomes, Comparing Nation to State by DWG Type ............................................................................... 261
Table IV-26 Outcomes of Dislocated Worker Grant Exiters, by Major Service Category ..................... 263
Table IV-27 WIOA Core Performance Indicators for Dislocated Worker Grant Exiters, by State ........ 264
Table IV-28 WIA Common Measures for Dislocated Worker Grant Exiters, by State .......................... 267
Part V: Youth Program .................................................................................... 269
Table V-1 Trends in the Characteristics of Youth Exiters, by Reporting Period ................................... 270
Table V-2 Trends in the Number of Youth Exiters, by Reporting Period .............................................. 272
Table V-3 Characteristics of Youth Who Exited from April 2019 to March 2020, by Age at Program Entry .......................................................................................................................... 274
Table V-4 Characteristics of Youth Who Exited from April 2019 to March 2020, by Ethnicity and Race ......................................................................................................................................... 276
Table V-5 Characteristics of Youth Who Exited from April 2019 to March 2020, by Gender, Employment Status, and Disability Status ............................................................................... 278
Table V-6 Characteristics of In-School Youth Who Exited from April 2019 to March 2020, by Highest Educational Level for In-School Youth........................................................................ 280
Table V-7 Characteristics of Out-of-School Youth Who Exited from April 2019 to March 2020, by Highest Educational Level for Out-of-School Youth ................................................................ 282
Table V-8 Characteristics of Youth Who Exited from April 2019 to March 2020, by Veteran Status and Other Selected Characteristics ......................................................................................... 284
Table V-9 Characteristics of Youth Who Exited from April 2019 to March 2020, by Selected Barriers .................................................................................................................................... 286

vi PY 2019 State Data Book
Table V-10 Characteristics of Youth Who Exited from April 2019 to March 2020, by Major Service Categories ................................................................................................................... 288
Table V-11 Number of Youth Who Exited from April 2019 to March 2020, by Major Service Categories ................................................................................................................................ 290
Table V-12 Trends in Services Received by Youth Exiters, by Reporting Period .................................. 292
Table V-13 Trends in the Number of Youth Who Received Various Services, by Reporting Period .... 295
Table V-14 Services Received by Youth Who Exited from April 2019 to March 2020, by Age at Program Entry .......................................................................................................................... 298
Table V-15 Services Received by Youth Who Exited from April 2019 to March 2020, by Ethnicity and Race .................................................................................................................................. 301
Table V-16 Services Received by Youth Who Exited from April 2019 to March 2020, by Gender, Employment Status, and Disability Status ............................................................................... 304
Table V-17 Services Received by In-School Youth Who Exited from April 2019 to March 2020, by Highest Educational Level for In-School Youth........................................................................ 307
Table V-18 Services Received by Out-of-School Youth Who Exited from April 2019 to March 2020, by Highest Educational Level for Out-of-School Youth ................................................. 310
Table V-19 Services Received by Youth Who Exited from April 2019 to March 2020, by Veteran Status and Other Selected Characteristics .............................................................................. 313
Table V-20 Services Received by Youth Who Exited from April 2019 to March 2020, by Selected Barriers .................................................................................................................................... 316
Table V-21 Services Received by Youth Who Exited from April 2019 to March 2020, by State .......... 319
Table V-22 Trends in the Outcomes of Youth, by Performance Period ............................................... 321
Table V-23 Trends in the Number of Youth Who Achieved Various Outcomes, by Performance Period ...................................................................................................................................... 324
Table V-24 Outcomes of Youth, by Age at Program Entry ................................................................... 327
Table V-25 Outcomes of Youth, by Ethnicity and Race6 ....................................................................... 330
Table V-26 Outcomes of Youth, by Gender, Employment Status, and Disability Status ...................... 333
Table V-27 Outcomes of In-School Youth, by Highest Educational Level for In-School Youth ............ 336
Table V-28 Outcomes of Out-of-School Youth, by Highest Educational Level for Out-of-School Youth ....................................................................................................................................... 339
Table V-29 Outcomes of Youth, by Veteran Status and Other Selected Characteristics ..................... 342
Table V-30 Outcomes of Youth, by Selected Barriers .......................................................................... 345
Table V-31 Outcomes of Youth, by Major Service Category ................................................................ 348
Table V-32 WIOA Primary Indicators of Performance for Youth, by State........................................... 351
Part VI: Wagner-Peyser Exiters ....................................................................... 353
Table VI-1 Trends in the Characteristics of Wagner-Peyser Exiters, by Reporting Period ................... 354
Table VI-2 Trends in the Number of Wagner-Peyser Participants, by Reporting Period ..................... 357

vii PY 2019 State Data Book
Table VI-3 Characteristics of Wagner-Peyser Participants Who Exited from April 2019 to March 2020, by Age at Program Entry ................................................................................................ 360
Table VI-4 Characteristics of Wagner-Peyser Participants Who Exited from April 2019 to March 2020, by Ethnicity and Race .................................................................................................... 363
Table VI-5 Characteristics of Wagner-Peyser Participants Who Exited from April 2019 to March 2020, by Gender, Employment Status, and Disability Status .................................................. 366
Table VI-6 Characteristics of Wagner-Peyser Participants Who Exited from April 2019 to March 2020, by Other Employment Characteristics .......................................................................... 369
Table VI-7 Characteristics of Wagner-Peyser Participants Who Exited from April 2019 to March 2020, by Veteran Status and Selected Barriers to Employment ............................................. 372
Table VI-8 Characteristics of Wagner-Peyser Participants Who Exited from April 2019 to March 2020, by Highest Educational Level ......................................................................................... 375
Table VI-9 Characteristics of Wagner-Peyser Participants Who Exited from April 2019 to March 2020, by Selected Other Characteristics ................................................................................. 378
Table VI-10 Characteristics of Wagner-Peyser Participants Who Exited from April 2019 to March 2020, by Major Service Categories .......................................................................................... 381
Table VI-11 Number of Wagner-Peyser Participants Who Exited from April 2019 to March 2020, by Major Service Categories .................................................................................................... 384
Table VI-12 Trends Over Time in Services Received by Wagner-Peyser Exiters, by Reporting Period ...................................................................................................................................... 387
Table VI-13 Trends Over Time in the Number of Wagner-Peyser Exiters Who Received Various Services, by Reporting Period ................................................................................................. 389
Table VI-14 Services Received by Wagner-Peyser Participants Who Exited from April 2019 to March 2020, by Age at Program Entry .................................................................................... 391
Table VI-15 Services Received by Wagner-Peyser Participants Who Exited from April 2019 to March 2020, by Ethnicity and Race ......................................................................................... 393
Table VI-16 Services Received by Wagner-Peyser Participants Who Exited from April 2019 to March 2020, by Gender, Employment Status, and Disability Status ....................................... 395
Table VI-17 Services Received by Wagner-Peyser Participants Who Exited from April 2019 to March 2020, by Other Employment Characteristics ............................................................... 397
Table VI-18 Services Received by Wagner-Peyser Participants Who Exited from April 2019 to March 2020, by Veteran Status and Selected Barriers to Employment .................................. 399
Table VI-19 Services Received by Wagner-Peyser Participants Who Exited from April 2019 to March 2020, by Highest Educational Level ............................................................................. 401
Table VI-20 Services Received by Wagner-Peyser Participants Who Exited from April 2019 to March 2020, by Selected Other Characteristics ...................................................................... 403
Table VI-21 Services Received by Wagner-Peyser Participants Who Exited from April 2019 to March 2020, by State .............................................................................................................. 405
Table VI-22 Trends in the Outcomes of Wagner-Peyser Exiters, by Performance Period ................... 407

viii PY 2019 State Data Book
Table VI-23 Trends in the Number of Wagner-Peyser Exiters Who Achieved Various Outcomes, by Performance Period ............................................................................................................ 409
Table VI-24 Outcomes of Wagner-Peyser Exiters, by Age at Program Entry ....................................... 413
Table VI-25 Outcomes of Wagner-Peyser Exiters, by Ethnicity and Race ............................................ 415
Table VI-26 Outcomes of Wagner-Peyser Exiters, by Gender, Employment Status, and Disability Status ....................................................................................................................................... 417
Table VI-27 Outcomes of Wagner-Peyser Exiters, by Other Employment Characteristics .................. 419
Table VI-28 Outcomes of Wagner-Peyser Exiters, by Veteran Status and Selected Barriers to Employment ............................................................................................................................ 421
Table VI-29 Outcomes of Wagner-Peyser Exiters, by Highest Educational Level ................................ 423
Table VI-30 Outcomes of Wagner-Peyser Exiters, by Selected Other Characteristics ......................... 425
Table VI-31 Outcomes of Wagner-Peyser Exiters, by Major Service Category .................................... 427
Table VI-32 WIOA Primary Indicators of Performance for Wagner-Peyser Exiters, by State ............... 429
Table VI-33 WIA Common Measures for Wagner-Peyser Exiters, by State ......................................... 431
Appendix A ..................................................................................................... 433
Part I: Summary Comparisons Across Programs ................................................................................. 433
Part II: Adult Program .......................................................................................................................... 434
Part III: Dislocated Worker Program ................................................................................................... 439
Part IV: National Dislocated Worker Grant Program ......................................................................... 441
Part V: Youth Program ......................................................................................................................... 442
Part VI: Wagner-Peyser Program ........................................................................................................ 445
Appendix B: Cross-reference to PIRL Elements ................................................ 449
Appendix C: Abbreviations .............................................................................. 453
Guide to the Reader
PY 2019 Illinois State Data Book 1
Guide to the Reader
This Data Book provides information on the characteristics, services, and outcomes of persons served by the Workforce Innovation and Opportunity Act (WIOA) Adult, Dislocated Worker, and Youth programs, and the Wagner-Peyser Act program in Illinois (IL). General notes that apply to most of the tables in the Data Book appear in this section. More detailed information is provided in the appendices. Appendix A, Notes to Tables, presents important information about how specific rows or columns are defined. Appendix B, Cross-reference to PIRL Elements, identifies which PIRL elements were used in the computation of the tables’ row entries. Finally, Appendix C provides a list of acronyms used throughout the report.
What is Included in This Data Book
The Data Book draws primarily from the Participant Individual Record Layout (PIRL) data that states submitted to the U.S. Department of Labor (DOL) Employment and Training Administration (ETA) to meet their program year (PY) 2019 quarter 4 (Q4) reporting requirements.1 The report presents detailed tabulations for persons served by the WIOA Adult program (PIRL element 903); the formula-funded WIOA Dislocated Worker program (PIRL 904), including rapid response additional assistance (PIRL 909); the WIOA Youth program (PIRL 905); Dislocated Worker Grants (DWGs, PIRL 932); and Wagner-Peyser (PIRL 918) program. Most tables present results for exiters, defined as those participating in the above programs with a valid exit date (PIRL 901); however, some tabulations cover participants, who are those with a valid date of program entry (PIRL 900) regardless of whether they have an exit date. Tabulations are restricted to those with an exit or entry date within the date range covered by the table or column heading.
The Data Book also presents counts of reportable individuals (identified as those with code 4 in PIRL 903, 904, 905 or code 2 in PIRL 918 or 932). As described in TEGL 10-16 Change 1, reportable individuals are those who demonstrated an intent to use program services or accessed self-services or information-only services, but who have not received any service that would qualify them as a participant. They have neither a date of participation nor a date of exit.
The PY 2019 Q4 PIRL includes information about individuals who participated in DOL workforce programs at any time during PY 2019, which runs from July 1, 2019, to June 30, 2020, including those who may have begun participating before the start of the program year. For historical comparison, some tables present data for persons who participated and exited prior to July 1, 2019. The PY 2019 Q4 PIRL also includes information about individuals who exited January 1, 2018 to June 30, 2019, and previous PIRL quarterly submissions include information about individuals who exited July 1, 2016 to December 31, 2017. Information about individuals who exited prior to July 1, 2016 are drawn from the Workforce Investment Act Standardized Record Data (WIASRD), which preceded the introduction of the PIRL.2
1 Detailed information about the PIRL, including the specifications that states were to follow when reporting, can be found at https://www.doleta.gov/performance/reporting/.
2 Reporting specifications for the WIASRD can be found in Training and Employment Guidance Letter (TEGL) 4-13.

Guide to the Reader
PY 2019 Illinois State Data Book 2
A Word About Missing Data
States first reported using the PIRL with the first quarter of PY 2016. Their first quarterly PIRL submission included information on all those who participated anytime during the first quarter of PY 2016; each subsequent quarterly submission provided additional information about the services received by those who continued as participants from the prior quarter, added information for new participants, and noted which participants had exited as of the preceding quarter.3
Some Data Book tables present historical trends using WIASRD data. The transition from the WIASRD to the PIRL has implications for the coverage of the data available from these two sources.
• PIRL data. The PIRL data includes those who participated anytime from July 1, 2016, to June 30, 2020, and those who exited anytime from July 1, 2016 to March 31, 2020.
• Historical trends data. The states’ last WIASRD submission was a ‘closeout’ file that covered all those who exited from WIOA programs anytime between January 1, 2015 and June 30, 2016.4 This report utilizes the WIASRD ‘closeout’ data and prior WIASRD data.
• Some items new with the PIRL have substantial missing data. The reporting specifications for the characteristics of Adult, Dislocated Worker, and Youth program participants are largely the same in the PIRL as they were in the WIASRD. However, some reporting items were newly introduced with the PIRL. Some participants included in the PIRL were enrolled prior to July 1, 2016, when the PIRL specifications took effect, and, therefore, information on characteristics newly introduced with the PIRL may not have been collected from them at intake and are not available from the WIASRD. A few more items were added to the PIRL for the first time effective PY 2018 quarter 1 and, therefore, may not be available for those who entered the program before July 1, 2018. For these reasons, some characteristics could have substantial missing data. (Note that statistics in the Data Book are calculated based only on those with non-missing data, except where noted).
• Performance indicators not available from WIASRD.5 Measurable Skill Gains and Credential Rate, two of the WIOA performance indicators,6 are measured using items not available from the WIASRD. Second, third, and fourth quarter employment and wages are not available for all youth from the WIASRD.
• Historical data miss Wagner-Peyser participants. The WIASRD included Wagner-Peyser participants only if they were co-enrolled in WIOA programs, therefore trends before PY 2017 are not presented in Part VI.
3 Exit status is not known until 90 days after the last service was received. Therefore, exit status cannot be determined until the quarter after participation ended. See TEGL 10-16 Change 1 for the definition of a participant and the determination of the exit date.
4 ETA issued TEGL 5-17 in January 2018, requiring states to submit separate WIASRD files with the missing performance information for those who exited prior to July 1, 2016. These submissions were due by April 2018 and are incorporated into this Data Book.
5 For a description of the WIOA performance indicators, see TEGL 10-16 Change 1.
6 An additional WIOA performance indicator is Effectiveness in Serving Employers and this is generally not measured using the PIRL.

Guide to the Reader
PY 2019 Illinois State Data Book 3
• Guam. Guam includes only those who exited on or after July 1, 2015.
• Northern Mariana Islands. Northern Mariana Islands includes only those who exited on or after January 1, 2017.
• Palau. Palau includes only those who exited on or after July 1, 2016.
• Puerto Rico. Puerto Rico is missing from this report as it has not yet submitted PIRL records.
Overview of the Tables
The Data Book contains five groups of tables.
• Part I contains summary tables for WIOA Adult, Dislocated Worker, and Youth programs, DWG projects, and Wagner-Peyser. It provides counts of WIOA participants and exiters, Wagner-Peyser participants and exiters, and reportable individuals, by state; shows trends over time in the number of WIOA exiters; shows counts of the numbers served in WIOA and Wagner-Peyser with certain characteristics; and shows counts of exiters who received incumbent worker training.7
• Part II contains tables for the Adult program, which serves individuals ages 18 and older. Priority for individualized career services and training services in the WIOA Adult program must be given to recipients of cash public assistance, other low-income individuals, and individuals who are basic skills deficient, including English-language learners (see the WIOA Final Rule 20 CFR Part 680.600 and TEGL 19-16).
• Part III contains tables for the Dislocated Worker program (including rapid response additional assistance recipients). Dislocated workers are generally experienced workers who have been laid off (or received notice of termination) due to a permanent closure or substantial layoff (see the WIOA Final Rule 20 CFR Part 680.130). The tables include information only on individuals served by the formula-funded Title I Dislocated Worker program and excludes those served only by DWGs.
• Part IV contains tables for those who received services under WIOA Title I-D, Section 170, National Dislocated Worker Grants (DWGs). Unlike other parts of this report, this does not present trends but rather presents a comparison of nation to state by DWG type (disaster or economic recovery). Many DWGs are coenrolled in the Dislocated Worker program and are, therefore, also included in Part III tables.
• Part V contains tables for the Youth program, which serves individuals ages 14 to 24. Both in-school youth and out-of-school youth are eligible for the youth program, but at least 75 percent of youth program funds must be spent on the latter group. Eligibility criteria for the WIOA youth program are described in TEGL 8-15.
7 This Data Book is based on an extract of the PIRL that we received from ETA that includes reportable individuals; WIOA Adult, Dislocated Worker, and Youth participants; and Wagner-Peyser participants. Therefore, tabulations for incumbent workers include only incumbent workers who are also in one of the above groups.
Guide to the Reader
PY 2019 Illinois State Data Book 4
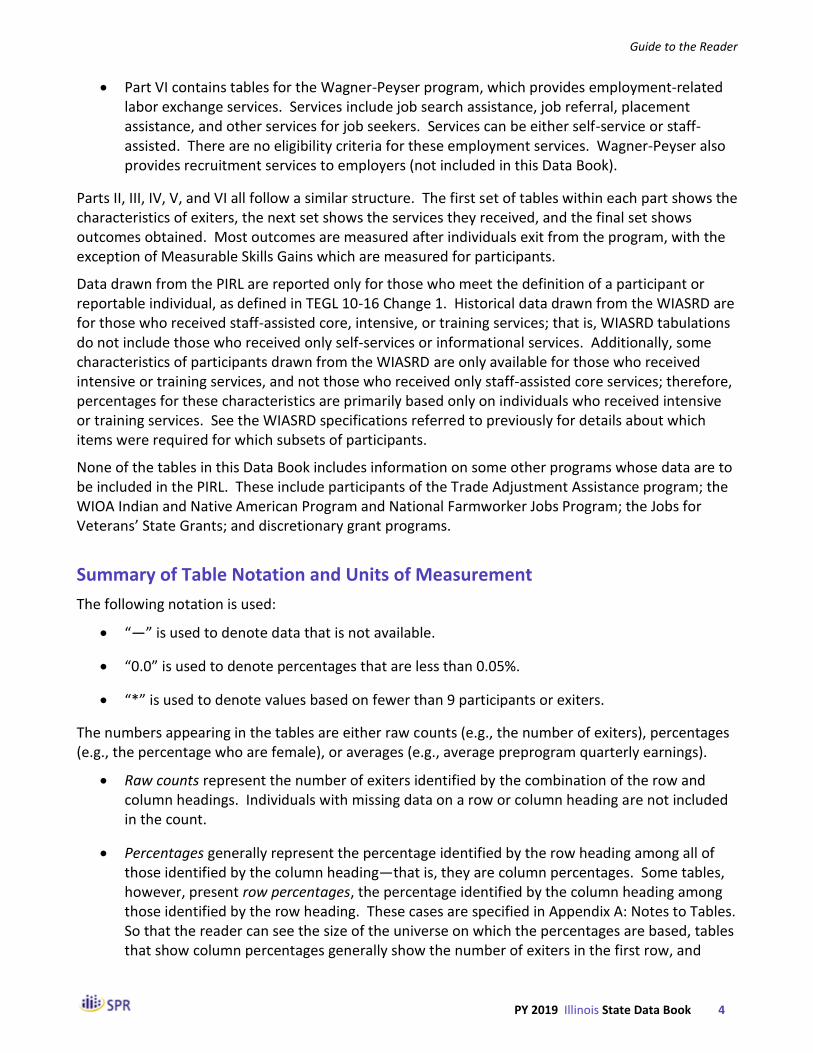
• Part VI contains tables for the Wagner-Peyser program, which provides employment-related labor exchange services. Services include job search assistance, job referral, placement assistance, and other services for job seekers. Services can be either self-service or staff-assisted. There are no eligibility criteria for these employment services. Wagner-Peyser also provides recruitment services to employers (not included in this Data Book).
Parts II, III, IV, V, and VI all follow a similar structure. The first set of tables within each part shows the characteristics of exiters, the next set shows the services they received, and the final set shows outcomes obtained. Most outcomes are measured after individuals exit from the program, with the exception of Measurable Skills Gains which are measured for participants.
Data drawn from the PIRL are reported only for those who meet the definition of a participant or reportable individual, as defined in TEGL 10-16 Change 1. Historical data drawn from the WIASRD are for those who received staff-assisted core, intensive, or training services; that is, WIASRD tabulations do not include those who received only self-services or informational services. Additionally, some characteristics of participants drawn from the WIASRD are only available for those who received intensive or training services, and not those who received only staff-assisted core services; therefore, percentages for these characteristics are primarily based only on individuals who received intensive or training services. See the WIASRD specifications referred to previously for details about which items were required for which subsets of participants.
None of the tables in this Data Book includes information on some other programs whose data are to be included in the PIRL. These include participants of the Trade Adjustment Assistance program; the WIOA Indian and Native American Program and National Farmworker Jobs Program; the Jobs for Veterans’ State Grants; and discretionary grant programs.
Summary of Table Notation and Units of Measurement
The following notation is used:
• “—” is used to denote data that is not available.
• “0.0” is used to denote percentages that are less than 0.05%.
• “*” is used to denote values based on fewer than 9 participants or exiters.
The numbers appearing in the tables are either raw counts (e.g., the number of exiters), percentages (e.g., the percentage who are female), or averages (e.g., average preprogram quarterly earnings).
• Raw counts represent the number of exiters identified by the combination of the row and column headings. Individuals with missing data on a row or column heading are not included in the count.
• Percentages generally represent the percentage identified by the row heading among all of those identified by the column heading—that is, they are column percentages. Some tables, however, present row percentages, the percentage identified by the column heading among those identified by the row heading. These cases are specified in Appendix A: Notes to Tables. So that the reader can see the size of the universe on which the percentages are based, tables that show column percentages generally show the number of exiters in the first row, and

Guide to the Reader
PY 2019 Illinois State Data Book 5
tables that show row percentages generally show the number of exiters in the first column. Individuals with missing data on either the row or column heading are excluded when calculating percentages. In addition, all WIOA Primary Indicators of Performance are calculated after excluding individuals who exited the program by virtue of being incarcerated or hospitalized, were receiving medical treatment expected to last longer than 90 days that precluded them from continuing services or entering employment, were deceased, were reservists called to active duty for at least 90 days, or (for the Youth program) moved from the local workforce area by virtue of being in the foster care system (see TEGL 10-16 Change 1 for more detail about these exclusions).
• Averages are calculated for selected items that are measured on a continuous scale (e.g., preprogram quarterly earnings) and are computed after excluding missing data and zeros.
Quality of the Underlying Data
The PIRL reporting system was introduced with PY 2016. Some revisions and additions were effective with the PY 2018 Q1 data submissions. The PY 2019 Q4 data used for this Data Book represent the sixteenth quarter of reporting. States varied in how long it took to fully implement the different elements of the PIRL. Thus, the quality and completeness of the data vary among states. Moreover, data on characteristics newly introduced with the PIRL are often not available for participants who enrolled before the PIRL took effect and subsequent additions to the PIRL are often not available for participants who enrolled before the additions went into effect.
The data used to prepare the Data Book underwent an extensive data review. As a result of this review, some data for a few states were recoded or set to missing, because they appeared to be incorrect. Data that were set to missing are excluded from the calculations of percentages and averages in this Data Book, as discussed above. Consequently, state results reported in the Data Book may differ from states’ own computations from their data.


All Programs
PY 2019 Illinois State Data Book 7
Part I: Summary Comparisons Across Programs

All Programs
PY 2019 Illinois State Data Book 8
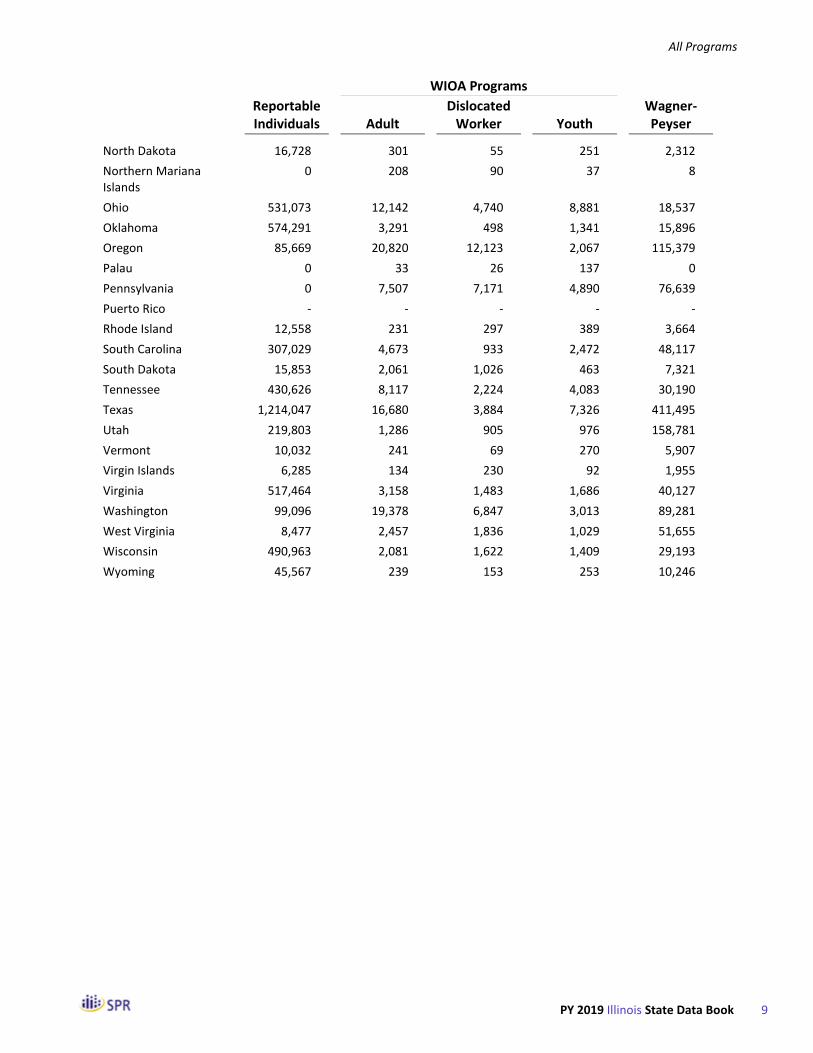
Table I-1 Number of Program Participants (including Exiters) and Reportable Individuals
from July 2019 to June 2020, by State and Program
(Derived from PY 2019 Q4 PIRL)
WIOA Programs
Reportable Individuals Adult
Dislocated Worker Youth
Wagner-Peyser
Nation 11,877,435 357,558 256,498 137,289 3,409,790
Alabama 57,504 9,617 840 2,410 68,468
Alaska 64,239 492 299 800 11,188
Arizona 327,577 11,379 1,362 4,403 36,320
Arkansas 77,321 1,468 388 831 104,978
California 820,523 44,116 25,753 17,210 189,295
Colorado 271,567 2,323 1,097 1,898 70,826
Connecticut 26,464 2,337 1,816 1,228 28,321
Delaware 45,655 813 486 410 13,605
District of Columbia 132,802 1,320 384 378 8,148
Florida 422,692 30,224 4,889 11,830 198,508
Georgia 457,050 10,799 2,554 6,759 150,220
Guam 8,791 70 42 3 1,502
Hawaii 51,311 315 183 307 3,807
Idaho 58,062 960 482 627 14,868
Illinois 1,710,336 11,212 7,586 6,749 22,821
Indiana 70,961 7,396 4,308 3,250 220,447
Iowa 23,078 1,032 528 553 18,981
Kansas 278,231 2,856 621 619 19,365
Kentucky 2,615 4,386 2,680 2,366 12,664
Louisiana 54,587 5,126 1,673 1,973 47,262
Maine 190,012 573 221 401 3,797
Maryland 77,432 2,513 771 1,398 64,598
Massachusetts 2,831 1,325 2,424 1,477 100,968
Michigan 73,178 7,285 2,442 4,210 176,038
Minnesota 115,544 1,699 2,265 2,563 27,286
Mississippi 185,880 6,940 3,496 1,588 68,202
Missouri 51,558 3,226 882 1,683 51,659
Montana 88 385 174 223 27,003
Nebraska 113,974 681 278 353 10,887
Nevada 81,829 2,677 565 940 41,159
New Hampshire 7,570 253 202 256 11,444
New Jersey 142,672 2,277 3,323 3,047 49,876
New Mexico 61,328 2,584 627 1,116 19,405
New York 956,225 63,543 132,339 8,020 256,672
North Carolina 270,387 8,318 2,306 4,345 142,499
All Programs
PY 2019 Illinois State Data Book 9
WIOA Programs
Reportable Individuals Adult
Dislocated Worker Youth
Wagner-Peyser
North Dakota 16,728 301 55 251 2,312
Northern Mariana Islands
0 208 90 37 8
Ohio 531,073 12,142 4,740 8,881 18,537
Oklahoma 574,291 3,291 498 1,341 15,896
Oregon 85,669 20,820 12,123 2,067 115,379
Palau 0 33 26 137 0
Pennsylvania 0 7,507 7,171 4,890 76,639
Puerto Rico - - - - -
Rhode Island 12,558 231 297 389 3,664
South Carolina 307,029 4,673 933 2,472 48,117
South Dakota 15,853 2,061 1,026 463 7,321
Tennessee 430,626 8,117 2,224 4,083 30,190
Texas 1,214,047 16,680 3,884 7,326 411,495
Utah 219,803 1,286 905 976 158,781
Vermont 10,032 241 69 270 5,907
Virgin Islands 6,285 134 230 92 1,955
Virginia 517,464 3,158 1,483 1,686 40,127
Washington 99,096 19,378 6,847 3,013 89,281
West Virginia 8,477 2,457 1,836 1,029 51,655
Wisconsin 490,963 2,081 1,622 1,409 29,193
Wyoming 45,567 239 153 253 10,246

All Programs
PY 2019 Illinois State Data Book 10
Table I-2 Trend in the Number of Exiters, by Program of Participation
and Reporting Period
(Derived from WIASRD and PIRL Files)
Nation PY 2017
Nation PY 2018
Nation PY 2019
IL PY 2017
IL PY 2018
IL PY 2019
WIOA Exiters, All Programs 811,988 705,397 582,569
13,937 14,327 15,309
Local programs 797,135 692,775 567,161 13,707 13,870 14,225
Statewide programs 16,802 14,857 18,196 663 1,285 1,483
DWG programs 20,132 15,988 14,957 339 85 173
WIOA Adults 496,424 412,742 295,282 5,933 6,050 7,611
Local programs 492,802 409,609 290,196 5,871 5,971 7,281
Statewide programs 4,897 4,683 8,167 62 79 330
WIOA Dislocated Workers 320,450 289,662 238,793 4,702 4,448 4,418
Local programs 318,502 287,888 236,877 4,550 4,271 3,958
Statewide programs 11,358 9,370 8,518 585 1,005 858
DWG programs
Disaster Recovery 5,874 6,090 6,107 0 0 15
Economic Recovery 14,258 9,898 8,850 339 85 158
WIOA Youth 81,467 81,365 80,693 3,453 3,964 3,586
Local programs 81,301 80,885 79,539 3,437 3,763 3,290
Statewide 617 824 1,540 16 201 296
School status
In-school 16,017 13,486 13,973 542 522 501
Not attending 65,394 67,809 66,714 2,911 3,442 3,085
Wagner-Peyser 4,021,585 3,570,450 3,317,555 32,895 33,517 26,814

All Programs
PY 2019 Illinois State Data Book 11
Table I-3 Number of Exiters from April 2019 to March 2020, by State and Program of Participation
(Derived from PY 2019 Q4 PIRL)
WIOA Programs
All WIOA Adult Dislocated
Worker Youth Wagner-Peyser
Nation 582,569 295,282 238,793 80,693 3,317,555
Alabama 7,951 6,078 353 1,590 76,833
Alaska 645 270 178 206 12,278
Arizona 10,342 7,561 707 2,183 38,202
Arkansas 1,903 1,067 263 532 105,749
California 70,009 39,817 16,910 13,674 215,470
Colorado 4,022 1,864 753 1,558 55,339
Connecticut 3,045 1,235 976 817 33,986
Delaware 777 385 246 148 13,709
District of Columbia 1,641 1,053 347 301 9,501
Florida 13,607 8,255 1,588 3,270 170,256
Georgia 8,720 4,899 1,205 2,718 163,609
Guam 48 45 4 0 1,510
Hawaii 315 113 71 127 2,906
Idaho 1,330 645 292 429 15,334
Illinois 15,309 7,611 4,418 3,586 26,814
Indiana 10,393 6,086 3,433 2,276 40,663
Iowa 3,670 3,266 287 340 28,037
Kansas 2,685 2,141 300 347 21,204
Kentucky 5,466 3,395 1,542 1,413 13,403
Louisiana 7,144 4,716 1,436 1,212 46,613
Maine 725 364 136 247 4,511
Maryland 3,348 1,784 589 813 46,873
Massachusetts 3,723 940 1,730 922 113,907
Michigan 7,396 4,062 1,382 1,809 141,312
Minnesota 3,225 893 1,419 915 27,026
Mississippi 8,694 4,700 2,649 1,360 77,438
Missouri 3,516 2,179 358 1,134 51,927
Montana 271 130 62 104 15,637
Nebraska 811 453 158 204 11,080
Nevada 3,143 1,931 395 835 51,079
New Hampshire 478 153 150 184 14,128
New Jersey 7,089 2,253 2,909 1,927 60,445
New Mexico 2,906 1,788 415 757 20,768
New York 208,354 62,065 143,158 4,598 285,635
North Carolina 10,270 5,597 1,819 2,641 161,869
North Dakota 427 265 22 153 2,073

All Programs
PY 2019 Illinois State Data Book 12
WIOA Programs
All WIOA Adult Dislocated
Worker Youth Wagner-Peyser
Northern Mariana Islands
132 82 31 24 3
Ohio 13,448 7,139 2,620 3,755 17,377
Oklahoma 3,581 2,649 275 915 18,865
Oregon 34,294 33,677 22,210 843 114,682
Palau 165 24 16 140 0
Pennsylvania 13,909 5,755 5,069 3,368 81,786
Puerto Rico - - - - -
Rhode Island 1,316 210 283 333 4,577
South Carolina 5,992 3,614 633 1,787 51,097
South Dakota 2,290 2,126 1,065 431 8,707
Tennessee 8,301 4,341 1,242 2,436 29,994
Texas 25,449 16,515 2,988 5,848 430,347
Utah 1,823 801 479 551 145,905
Vermont 409 192 45 173 5,981
Virgin Islands 357 118 180 51 2,260
Virginia 4,174 2,258 843 1,113 47,780
Washington 26,547 22,463 5,955 1,983 90,848
West Virginia 3,134 1,563 1,104 523 54,382
Wisconsin 3,462 1,527 1,040 923 26,104
Wyoming 388 169 55 166 9,736

All Programs
PY 2019 Illinois State Data Book 13
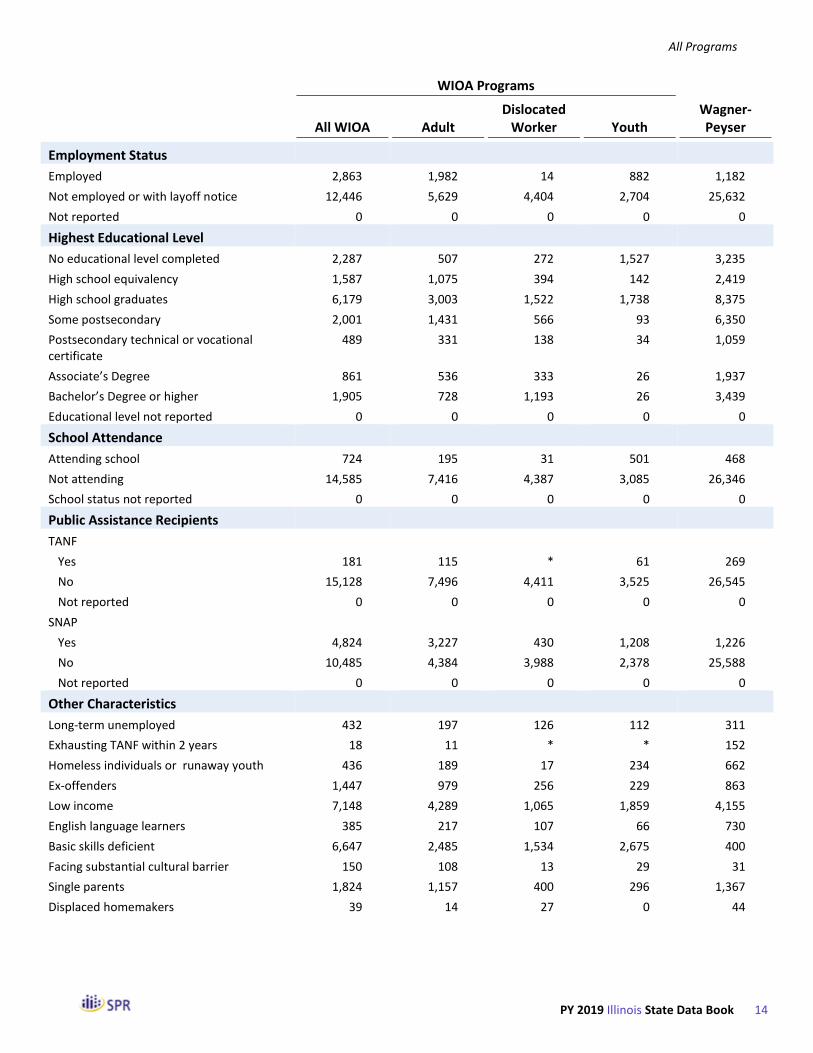
Table I-4 Number of Illinois Exiters from April 2019 to March 2020,
by Program and Selected Characteristics (Derived from PY 2019 Q4 PIRL)
WIOA Programs
All WIOA Adult Dislocated
Worker Youth Wagner-Peyser
All exiters 15,309 7,611 4,418 3,586 26,814
Age Categories
14 to 17 689 * 0 689 100
18 to 21 2,370 417 45 1,916 665
22 to 29 3,241 1,872 523 885 3,468
30 to 44 4,280 2,853 1,513 0 8,382
45 to 54 2,616 1,405 1,306 0 6,344
55 and older 2,017 1,062 1,030 0 7,757
Not reported 96 * * 96 98
Gender
Females 7,223 3,657 1,860 1,846 10,800
Males 8,011 3,901 2,542 1,729 15,715
Did not self-identify 75 53 16 11 299
Race and Ethnicity
Ethnicity
Hispanics/Latinos 2,619 928 950 774 3,950
Not Hispanic/Latino 12,603 6,606 3,452 2,812 22,410
Did not self-identify 87 77 16 0 454
Race
American Indians/Alaska Natives 137 57 38 45 225
Asians 481 215 199 72 396
Blacks or African Americans 6,631 3,660 1,373 1,701 8,563
Native Hawaiians/Pacific Islanders 39 13 10 18 74
Whites 6,421 2,978 2,187 1,410 14,232
More than one race 192 77 36 84 275
Did not identify at least one race 1,806 771 650 429 3,623
Disability Status
Has any disability 997 301 63 650 1,680
Without a disability 14,270 7,275 4,344 2,934 22,893
Did not self-identify 42 35 11 * 2,241
Veteran Status
Veterans 919 598 324 34 5,169
Not a veteran 14,390 7,013 4,094 3,552 21,645
Status not known 0 0 0 0 0
All Programs
PY 2019 Illinois State Data Book 14
WIOA Programs
All WIOA Adult Dislocated
Worker Youth Wagner-Peyser
Employment Status
Employed 2,863 1,982 14 882 1,182
Not employed or with layoff notice 12,446 5,629 4,404 2,704 25,632
Not reported 0 0 0 0 0
Highest Educational Level
No educational level completed 2,287 507 272 1,527 3,235
High school equivalency 1,587 1,075 394 142 2,419
High school graduates 6,179 3,003 1,522 1,738 8,375
Some postsecondary 2,001 1,431 566 93 6,350
Postsecondary technical or vocational certificate
489 331 138 34 1,059
Associate’s Degree 861 536 333 26 1,937
Bachelor’s Degree or higher 1,905 728 1,193 26 3,439
Educational level not reported 0 0 0 0 0
School Attendance
Attending school 724 195 31 501 468
Not attending 14,585 7,416 4,387 3,085 26,346
School status not reported 0 0 0 0 0
Public Assistance Recipients
TANF
Yes 181 115 * 61 269
No 15,128 7,496 4,411 3,525 26,545
Not reported 0 0 0 0 0
SNAP
Yes 4,824 3,227 430 1,208 1,226
No 10,485 4,384 3,988 2,378 25,588
Not reported 0 0 0 0 0
Other Characteristics
Long-term unemployed 432 197 126 112 311
Exhausting TANF within 2 years 18 11 * * 152
Homeless individuals or runaway youth 436 189 17 234 662
Ex-offenders 1,447 979 256 229 863
Low income 7,148 4,289 1,065 1,859 4,155
English language learners 385 217 107 66 730
Basic skills deficient 6,647 2,485 1,534 2,675 400
Facing substantial cultural barrier 150 108 13 29 31
Single parents 1,824 1,157 400 296 1,367
Displaced homemakers 39 14 27 0 44

All Programs
PY 2019 Illinois State Data Book 15
Table I-5 Trends in the Number of WIOA Adult Participants, by State and Reporting Period
(Derived from WIASRD and PIRL Files)
PY 2015 PY 2016 PY 2017 PY 2018 PY 2019
Nation 1,073,765 903,962 551,097 477,956 357,558
Alabama 5,994 6,098 4,550 6,762 9,617
Alaska 488 345 307 396 492
Arizona 9,362 11,035 10,211 10,268 11,379
Arkansas 1,281 1,606 1,556 1,357 1,468
California 63,929 59,000 53,513 47,442 44,116
Colorado 2,100 3,968 3,288 2,956 2,323
Connecticut 2,767 3,629 3,211 2,346 2,337
Delaware 813 870 547 538 813
District of Columbia 1,446 1,408 1,362 1,332 1,320
Florida 27,313 23,737 17,660 13,410 30,224
Georgia 8,485 9,377 9,290 8,024 10,799
Guam 328 281 274 189 70
Hawaii 298 350 261 174 315
Idaho 719 678 634 547 960
Illinois 10,023 11,865 10,339 9,398 11,212
Indiana 22,746 13,060 11,600 9,568 7,396
Iowa 46,460 34,764 23,559 16,468 1,032
Kansas 4,831 4,395 3,893 3,609 2,856
Kentucky 77,284 81,321 33,948 18,243 4,386
Louisiana 32,607 24,413 10,880 5,472 5,126
Maine 1,046 1,070 608 480 573
Maryland 3,929 3,124 3,137 2,885 2,513
Massachusetts 2,383 2,497 2,280 1,682 1,325
Michigan 10,728 10,678 12,536 10,311 7,285
Minnesota 1,836 1,693 1,604 1,337 1,699
Mississippi 3,701 3,818 5,760 6,114 6,940
Missouri 143,764 136,042 8,663 3,689 3,226
Montana 469 488 476 325 385
Nebraska 905 817 910 889 681
Nevada 3,482 2,672 2,635 2,571 2,677
New Hampshire 221 350 331 211 253
New Jersey 5,538 3,467 4,146 3,306 2,277
New Mexico 2,145 1,581 1,900 2,394 2,584
New York 179,058 145,271 91,857 78,769 63,543
North Carolina 124,632 65,324 7,478 7,672 8,318
North Dakota 307 338 345 304 301
Northern Mariana Islands - - 82 84 208
Ohio 13,182 11,253 9,628 9,764 12,142

All Programs
PY 2019 Illinois State Data Book 16
PY 2015 PY 2016 PY 2017 PY 2018 PY 2019
Oklahoma 15,818 15,932 9,444 4,856 3,291
Oregon 126,465 114,852 109,533 101,196 20,820
Palau - 23 98 87 33
Pennsylvania 8,020 9,701 9,739 8,623 7,507
Puerto Rico - - - - -
Rhode Island 995 1,339 664 365 231
South Carolina 5,728 5,248 5,250 5,220 4,673
South Dakota 692 755 1,365 2,360 2,061
Tennessee 6,446 6,936 6,801 6,642 8,117
Texas 26,821 15,275 16,917 20,388 16,680
Utah 51,191 28,725 943 1,155 1,286
Vermont 423 377 312 281 241
Virgin Islands 151 189 286 221 134
Virginia 4,923 4,766 4,007 3,198 3,158
Washington 3,643 10,081 24,820 27,213 19,378
West Virginia 944 1,778 2,152 2,183 2,457
Wisconsin 3,554 3,715 3,197 2,460 2,081
Wyoming 576 444 310 222 239

All Programs
PY 2019 Illinois State Data Book 17
Table I-6 Trends in the Number of WIOA Dislocated Worker Participants from State and Local Programs,
by State and Reporting Period (Derived from WIASRD and PIRL Files)
PY 2015 PY 2016 PY 2017 PY 2018 PY 2019
Nation 509,849 453,701 389,229 344,557 256,498
Alabama 1,216 1,005 571 573 840
Alaska 324 311 310 276 299
Arizona 1,999 1,457 978 887 1,362
Arkansas 441 462 442 354 388
California 35,814 30,869 26,847 22,320 25,753
Colorado 1,272 2,108 1,463 1,143 1,097
Connecticut 2,115 2,509 2,344 1,757 1,816
Delaware 747 689 475 358 486
District of Columbia 529 443 394 423 384
Florida 8,460 6,285 4,729 3,033 4,889
Georgia 2,534 2,980 2,481 1,834 2,554
Guam 15 3 5 6 42
Hawaii 329 222 152 102 183
Idaho 577 499 474 439 482
Illinois 10,907 10,606 8,743 7,132 7,586
Indiana 5,611 6,266 6,340 5,321 4,308
Iowa 15,717 8,424 1,157 532 528
Kansas 935 877 549 468 621
Kentucky 20,812 18,817 7,003 3,824 2,680
Louisiana 14,677 11,193 3,294 1,293 1,673
Maine 607 592 384 241 221
Maryland 2,966 2,065 1,645 1,044 771
Massachusetts 5,154 4,592 3,920 3,032 2,424
Michigan 3,987 4,178 3,474 2,314 2,442
Minnesota 2,592 2,589 2,427 2,238 2,265
Mississippi 2,637 2,363 3,853 3,632 3,496
Missouri 45,421 9,689 1,544 809 882
Montana 600 336 295 159 174
Nebraska 504 475 323 306 278
Nevada 1,409 709 507 573 565
New Hampshire 533 615 475 263 202
New Jersey 4,389 5,778 5,768 4,366 3,323
New Mexico 691 524 455 512 627
New York 162,776 178,647 171,884 163,508 132,339
North Carolina 5,672 3,576 3,504 2,856 2,306
North Dakota 75 45 45 45 55
Northern Mariana Islands - - 12 48 90

All Programs
PY 2019 Illinois State Data Book 18
PY 2015 PY 2016 PY 2017 PY 2018 PY 2019
Ohio 5,687 4,540 3,237 3,276 4,740
Oklahoma 849 813 591 410 498
Oregon 94,139 84,904 78,540 71,597 12,123
Palau - 3 17 15 26
Pennsylvania 10,952 11,957 10,117 7,906 7,171
Puerto Rico - - - - -
Rhode Island 1,362 1,127 607 459 297
South Carolina 2,531 1,733 1,297 1,170 933
South Dakota 237 195 325 815 1,026
Tennessee 2,957 3,154 2,901 2,350 2,224
Texas 9,647 7,165 9,881 6,793 3,884
Utah 1,477 963 658 730 905
Vermont 194 116 85 81 69
Virgin Islands 97 103 468 273 230
Virginia 3,740 3,255 1,987 1,368 1,483
Washington 4,082 3,863 4,886 5,997 6,847
West Virginia 2,237 2,872 1,978 1,528 1,836
Wisconsin 4,139 3,690 2,330 1,723 1,622
Wyoming 172 102 58 45 153

All Programs
PY 2019 Illinois State Data Book 19
Table I-7 Trends in the Number of Dislocated Worker Grant Participants, by State, Reporting Period, and
DWG Type
(Derived from WIASRD and PIRL Files)
All DWG Disaster Recovery Economic Recovery
PY 2018 PY 2019 PY 2018 PY 2019 PY 2018 PY 2019
Nation 90,893 112,593 21,234 31,335 69,659 81,258
Alabama 570 570 0 0 570 570
Alaska 474 738 0 0 474 738
Arizona 17 17 0 0 17 17
Arkansas 1,250 1,378 957 1,070 293 308
California 7,440 11,044 2,823 5,367 4,617 5,677
Colorado 146 148 0 0 146 148
Connecticut 668 965 10 10 658 955
Delaware 445 467 139 158 306 309
District of Columbia 1 1 0 0 1 1
Florida 5,510 6,969 1,300 2,435 4,210 4,534
Georgia 102 118 14 28 88 90
Guam 0 27 0 27 0 0
Hawaii 226 245 7 23 219 222
Idaho 563 622 333 389 230 233
Illinois 1,716 2,012 361 372 1,355 1,640
Indiana 1,009 1,239 51 146 958 1,093
Iowa 1,199 1,343 5 15 1,194 1,328
Kansas 329 564 149 317 180 247
Kentucky 5,118 5,681 81 81 5,037 5,600
Louisiana 1,641 1,651 434 435 1,207 1,216
Maine 490 492 0 2 490 490
Maryland 2,250 2,663 0 0 2,250 2,663
Massachusetts 3,494 4,199 101 367 3,393 3,832
Michigan 5,883 6,495 54 54 5,829 6,441
Minnesota 1,320 1,470 845 995 475 475
Mississippi 941 1,021 737 817 204 204
Missouri 2,244 2,361 394 485 1,850 1,876
Montana 735 752 0 0 735 752
Nebraska 1,091 1,159 34 96 1,057 1,063
Nevada 129 129 0 0 129 129
New Hampshire 612 612 0 0 612 612
New Jersey 1,800 2,010 90 90 1,710 1,920
New Mexico 19 19 0 0 19 19
New York 11,696 15,210 2,676 2,989 9,020 12,221
North Carolina 2,390 2,967 524 913 1,866 2,054
North Dakota 0 9 0 9 0 0

All Programs
PY 2019 Illinois State Data Book 20
All DWG Disaster Recovery Economic Recovery
PY 2018 PY 2019 PY 2018 PY 2019 PY 2018 PY 2019
Northern Mariana Islands 61 87 0 0 61 87
Ohio 2,051 3,652 129 682 1,922 2,970
Oklahoma 297 469 266 436 31 33
Oregon 3,008 3,148 0 1 3,008 3,147
Palau 0 0 0 0 0 0
Pennsylvania 3,077 3,773 1,661 1,672 1,416 2,101
Puerto Rico - - - - - -
Rhode Island 1,807 2,334 477 520 1,330 1,814
South Carolina 284 297 63 74 221 223
South Dakota 48 48 8 8 40 40
Tennessee 296 1,099 97 900 199 199
Texas 5,777 8,279 3,888 6,390 1,889 1,889
Utah 0 0 0 0 0 0
Vermont 104 109 70 75 34 34
Virgin Islands 320 531 21 98 299 433
Virginia 1,672 1,705 0 0 1,672 1,705
Washington 5,795 6,432 2,060 2,060 3,735 4,372
West Virginia 976 1,327 369 720 607 607
Wisconsin 1,775 1,893 0 0 1,775 1,893
Wyoming 20 36 0 3 20 33

All Programs
PY 2019 Illinois State Data Book 21
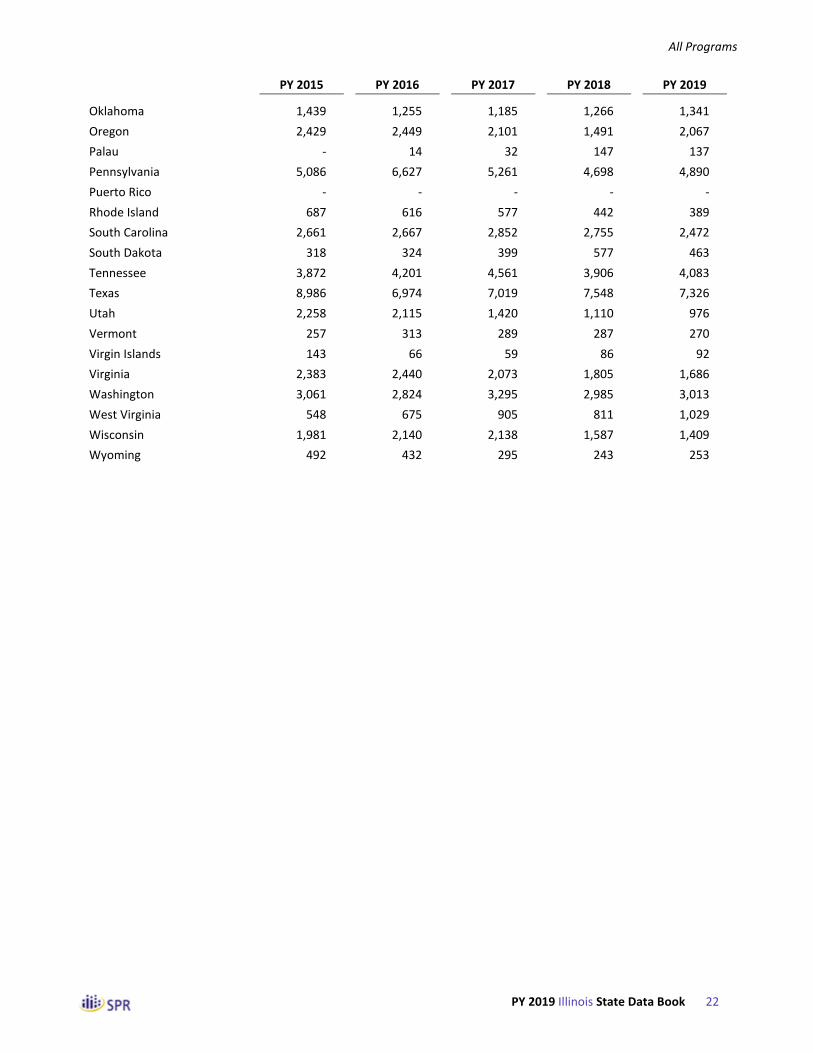
Table I-8 Trends in the Number of WIOA Youth Participants, by State and Reporting Period
(Derived from WIASRD and PIRL Files)
PY 2015 PY 2016 PY 2017 PY 2018 PY 2019
Nation 149,647 145,967 137,066 120,132 137,289
Alabama 2,579 2,730 1,768 1,965 2,410
Alaska 510 731 452 352 800
Arizona 3,276 3,880 4,024 3,490 4,403
Arkansas 1,204 1,169 1,075 927 831
California 17,849 17,679 16,992 17,011 17,210
Colorado 1,635 2,970 2,612 2,433 1,898
Connecticut 1,331 1,473 1,381 1,276 1,228
Delaware 538 430 404 223 410
District of Columbia 224 503 683 563 378
Florida 10,093 8,874 7,919 5,383 11,830
Georgia 6,534 6,558 6,301 4,465 6,759
Guam 273 76 39 12 3
Hawaii 450 377 279 247 307
Idaho 795 544 460 540 627
Illinois 8,071 7,387 7,314 6,282 6,749
Indiana 5,269 5,157 4,697 3,650 3,250
Iowa 739 898 880 625 553
Kansas 937 1,017 833 668 619
Kentucky 2,208 1,602 1,730 2,153 2,366
Louisiana 1,355 1,323 1,552 1,638 1,973
Maine 673 600 432 330 401
Maryland 2,030 1,822 1,838 1,405 1,398
Massachusetts 2,175 1,878 1,745 1,342 1,477
Michigan 5,813 4,684 4,265 3,076 4,210
Minnesota 2,793 2,426 1,964 1,483 2,563
Mississippi 1,054 1,269 1,477 1,667 1,588
Missouri 3,009 3,175 2,749 2,212 1,683
Montana 351 199 126 145 223
Nebraska 493 451 435 343 353
Nevada 2,492 1,576 1,420 1,343 940
New Hampshire 323 335 337 269 256
New Jersey 4,015 3,026 3,522 2,743 3,047
New Mexico 865 813 813 1,167 1,116
New York 9,272 9,404 7,182 6,442 8,020
North Carolina 5,418 5,371 5,101 4,050 4,345
North Dakota 301 215 271 217 251
Northern Mariana Islands - - 54 27 37
Ohio 6,096 7,190 7,479 6,224 8,881
All Programs
PY 2019 Illinois State Data Book 22
PY 2015 PY 2016 PY 2017 PY 2018 PY 2019
Oklahoma 1,439 1,255 1,185 1,266 1,341
Oregon 2,429 2,449 2,101 1,491 2,067
Palau - 14 32 147 137
Pennsylvania 5,086 6,627 5,261 4,698 4,890
Puerto Rico - - - - -
Rhode Island 687 616 577 442 389
South Carolina 2,661 2,667 2,852 2,755 2,472
South Dakota 318 324 399 577 463
Tennessee 3,872 4,201 4,561 3,906 4,083
Texas 8,986 6,974 7,019 7,548 7,326
Utah 2,258 2,115 1,420 1,110 976
Vermont 257 313 289 287 270
Virgin Islands 143 66 59 86 92
Virginia 2,383 2,440 2,073 1,805 1,686
Washington 3,061 2,824 3,295 2,985 3,013
West Virginia 548 675 905 811 1,029
Wisconsin 1,981 2,140 2,138 1,587 1,409
Wyoming 492 432 295 243 253
All Programs
PY 2019 Illinois State Data Book 23
Table I-9 Trends in the Number of Wagner-Peyser Participants, by State and Reporting Period
(Derived from PY 2019 Q4 PIRL)
PY 2015 PY 2016 PY 2017 PY 2018 PY 2019
Nation -- 5,175,366 4,172,102 3,759,437 3,409,790
Alabama -- 60,777 85,364 88,509 68,468
Alaska -- 16,899 12,623 12,920 11,188
Arizona -- 36,360 41,805 39,779 36,320
Arkansas -- 76,179 109,063 104,945 104,978
California -- 298,601 241,931 213,097 189,295
Colorado -- 85,168 75,372 66,638 70,826
Connecticut -- 37,519 59,109 39,876 28,321
Delaware -- 22,978 19,870 17,337 13,605
District of Columbia -- 15,521 14,249 10,643 8,148
Florida -- 592,970 368,056 225,604 198,508
Georgia -- 148,077 188,959 237,395 150,220
Guam -- 2,151 1,712 2,188 1,502
Hawaii -- 9,007 4,677 3,450 3,807
Idaho -- 10,091 11,597 13,792 14,868
Illinois -- 57,138 36,364 30,239 22,821
Indiana -- 110,375 73,215 49,243 220,447
Iowa -- 97,160 70,749 54,676 18,981
Kansas -- 36,131 31,421 25,232 19,365
Kentucky -- 109,810 50,025 36,758 12,664
Louisiana -- 125,327 71,463 49,804 47,262
Maine -- 8,890 6,788 4,773 3,797
Maryland -- 62,468 53,232 48,712 64,598
Massachusetts -- 139,756 132,654 123,189 100,968
Michigan -- 176,694 128,002 115,015 176,038
Minnesota -- 36,640 40,230 33,069 27,286
Mississippi -- 81,867 105,759 89,872 68,202
Missouri -- 223,862 87,600 87,946 51,659
Montana -- 24,955 22,002 17,077 27,003
Nebraska -- 38,484 23,247 15,357 10,887
Nevada -- 68,925 53,165 50,835 41,159
New Hampshire -- 32,609 16,881 15,932 11,444
New Jersey -- 99,452 99,522 74,832 49,876
New Mexico -- 32,688 33,616 26,773 19,405
New York -- 338,225 330,611 327,533 256,672
North Carolina -- 228,568 183,789 170,554 142,499
North Dakota -- 40,788 11,319 2,577 2,312
Northern Mariana Islands -- - 0 2 8
Ohio -- 28,650 30,961 27,394 18,537

All Programs
PY 2019 Illinois State Data Book 24
PY 2015 PY 2016 PY 2017 PY 2018 PY 2019
Oklahoma -- 37,017 25,440 17,116 15,896
Oregon -- 456 35,985 122,228 115,379
Palau -- 0 0 0 0
Pennsylvania -- 136,993 113,614 89,625 76,639
Puerto Rico -- - - - -
Rhode Island -- 11,649 7,548 5,298 3,664
South Carolina -- 135,564 79,704 61,935 48,117
South Dakota -- 44,566 11,959 10,861 7,321
Tennessee -- 95,866 67,996 34,923 30,190
Texas -- 705,631 604,322 571,546 411,495
Utah -- 57,589 49,408 45,376 158,781
Vermont -- 8,799 7,314 5,385 5,907
Virgin Islands -- 6,214 2,234 2,511 1,955
Virginia -- 65,633 47,175 46,548 40,127
Washington -- 100,803 100,410 101,057 89,281
West Virginia -- 80,481 48,828 53,098 51,655
Wisconsin -- 26,444 27,921 29,154 29,193
Wyoming -- 47,552 15,242 9,209 10,246
All Programs
PY 2019 Illinois State Data Book 25
Table I-10 Trends in the Number of WIOA Adult Exiters, by State and Reporting Period
(Derived from WIASRD and PIRL Files)
PY 2015 PY 2016 PY 2017 PY 2018 PY 2019
Nation 836,507 826,705 496,424 412,742 295,282
Alabama 2,976 4,760 3,117 3,222 6,078
Alaska 308 294 128 294 270
Arizona 4,253 7,126 6,440 7,395 7,561
Arkansas 641 865 999 946 1,067
California 40,044 43,418 37,918 37,760 39,817
Colorado 755 2,063 2,361 2,309 1,864
Connecticut 1,153 2,034 1,968 1,736 1,235
Delaware 290 500 347 325 385
District of Columbia 629 915 830 785 1,053
Florida 15,353 15,747 11,524 9,015 8,255
Georgia 3,896 4,208 5,038 5,403 4,899
Guam - 157 131 173 45
Hawaii 206 154 118 168 113
Idaho 446 392 373 402 645
Illinois 4,419 7,251 5,933 6,050 7,611
Indiana 20,766 11,766 8,069 7,974 6,086
Iowa 45,001 36,289 21,890 18,521 3,266
Kansas 4,078 3,689 2,700 3,055 2,141
Kentucky 47,984 87,210 30,000 23,604 3,395
Louisiana 28,062 20,655 13,504 4,316 4,716
Maine 564 649 599 297 364
Maryland 2,498 1,930 1,928 2,038 1,784
Massachusetts 1,310 1,439 1,449 1,307 940
Michigan 6,755 6,252 6,485 8,558 4,062
Minnesota 1,077 858 830 802 893
Mississippi 3,787 3,148 3,696 4,977 4,700
Missouri 88,847 126,895 42,117 2,617 2,179
Montana 297 190 321 267 130
Nebraska 449 455 508 685 453
Nevada 2,650 2,432 1,692 2,039 1,931
New Hampshire 196 189 255 201 153
New Jersey 5,073 2,455 3,147 2,781 2,253
New Mexico 1,495 1,215 989 1,374 1,788
New York 166,198 140,830 95,959 74,209 62,065
North Carolina 110,502 88,371 4,878 4,681 5,597
North Dakota 167 220 248 229 265
Northern Mariana Islands - - 29 59 82
Ohio 6,255 7,401 6,920 7,304 7,139

All Programs
PY 2019 Illinois State Data Book 26
PY 2015 PY 2016 PY 2017 PY 2018 PY 2019
Oklahoma 15,108 14,603 9,776 4,377 2,649
Oregon 113,743 102,202 106,433 97,547 33,677
Palau - - 28 78 24
Pennsylvania 5,623 5,649 6,446 6,587 5,755
Puerto Rico - - - - -
Rhode Island 547 891 753 254 210
South Carolina 3,968 3,390 3,504 3,673 3,614
South Dakota 389 470 665 1,600 2,126
Tennessee 3,802 4,228 3,603 3,757 4,341
Texas 27,412 12,355 11,492 15,994 16,515
Utah 37,446 37,851 432 639 801
Vermont 309 231 237 189 192
Virgin Islands 106 88 198 150 118
Virginia 2,733 3,209 2,714 2,177 2,258
Washington 2,664 3,225 20,993 23,768 22,463
West Virginia 596 785 1,403 1,789 1,563
Wisconsin 2,220 1,669 2,090 2,122 1,527
Wyoming 303 324 219 163 169

All Programs
PY 2019 Illinois State Data Book 27
Table I-11 Trends in the Number of WIOA Dislocated Worker Exiters from State and Local Programs,
by State and Reporting Period (Derived from WIASRD and PIRL Files)
PY 2015 PY 2016 PY 2017 PY 2018 PY 2019
Nation 419,961 361,246 320,450 289,662 238,793
Alabama 672 816 427 349 353
Alaska 256 194 207 199 178
Arizona 1,142 1,200 459 525 707
Arkansas 242 266 281 260 263
California 21,975 21,117 18,539 16,197 16,910
Colorado 476 1,166 998 890 753
Connecticut 1,003 1,244 1,240 1,181 976
Delaware 302 330 267 205 246
District of Columbia 300 292 263 238 347
Florida 4,873 4,416 2,887 2,066 1,588
Georgia 1,299 1,404 1,623 1,282 1,205
Guam - 1 1 2 4
Hawaii 213 153 72 88 71
Idaho 419 267 257 305 292
Illinois 5,045 5,875 4,702 4,448 4,418
Indiana 5,264 4,059 4,656 4,286 3,433
Iowa 14,601 10,562 870 444 287
Kansas 687 624 400 368 300
Kentucky 13,282 19,590 5,751 3,963 1,542
Louisiana 9,633 8,867 4,889 1,090 1,436
Maine 368 303 347 181 136
Maryland 1,945 1,438 1,119 848 589
Massachusetts 2,839 2,837 2,364 2,177 1,730
Michigan 2,411 2,404 2,315 1,751 1,382
Minnesota 1,834 1,286 1,313 1,258 1,419
Mississippi 2,537 2,259 2,695 3,132 2,649
Missouri 49,956 11,093 2,811 721 358
Montana 453 180 222 150 62
Nebraska 250 293 197 214 158
Nevada 1,313 715 373 392 395
New Hampshire 438 416 404 286 150
New Jersey 3,909 3,261 4,522 3,215 2,909
New Mexico 365 365 256 254 415
New York 147,182 144,134 146,532 137,066 143,158
North Carolina 7,143 2,555 2,152 2,207 1,819
North Dakota 41 47 27 37 22
Northern Mariana Islands - - 8 19 31

All Programs
PY 2019 Illinois State Data Book 28
PY 2015 PY 2016 PY 2017 PY 2018 PY 2019
Ohio 2,752 2,897 2,680 2,285 2,620
Oklahoma 407 508 388 326 275
Oregon 85,986 76,247 77,516 69,714 22,210
Palau - - 7 11 16
Pennsylvania 6,070 6,866 6,468 5,960 5,069
Puerto Rico - - - - -
Rhode Island 708 874 498 297 283
South Carolina 1,380 1,333 827 901 633
South Dakota 141 126 156 411 1,065
Tennessee 1,713 1,898 1,659 1,589 1,242
Texas 6,537 5,368 5,564 7,420 2,988
Utah 709 660 303 409 479
Vermont 125 97 58 61 45
Virgin Islands 69 59 303 151 180
Virginia 1,823 2,509 1,581 1,001 843
Washington 3,091 1,975 2,799 4,161 5,955
West Virginia 1,069 1,543 1,493 1,319 1,104
Wisconsin 2,500 1,829 1,662 1,323 1,040
Wyoming 91 91 42 29 55
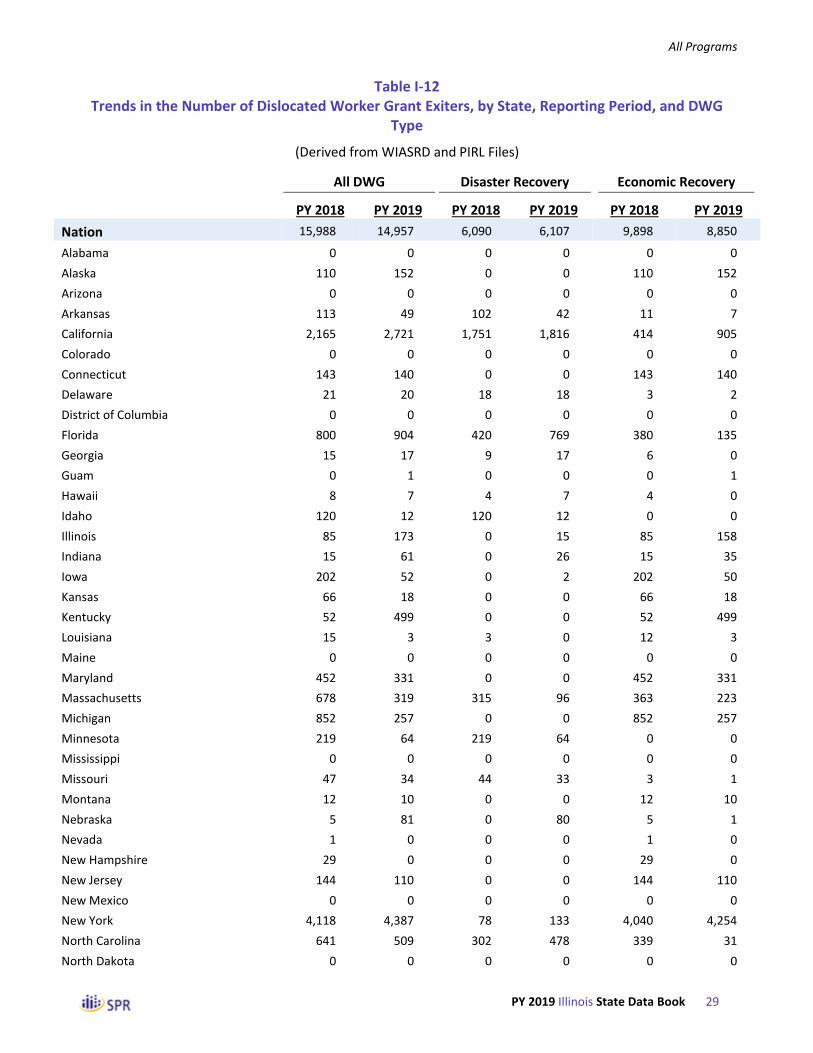
All Programs
PY 2019 Illinois State Data Book 29
Table I-12 Trends in the Number of Dislocated Worker Grant Exiters, by State, Reporting Period, and DWG
Type
(Derived from WIASRD and PIRL Files)
All DWG Disaster Recovery Economic Recovery
PY 2018 PY 2019 PY 2018 PY 2019 PY 2018 PY 2019
Nation 15,988 14,957 6,090 6,107 9,898 8,850
Alabama 0 0 0 0 0 0
Alaska 110 152 0 0 110 152
Arizona 0 0 0 0 0 0
Arkansas 113 49 102 42 11 7
California 2,165 2,721 1,751 1,816 414 905
Colorado 0 0 0 0 0 0
Connecticut 143 140 0 0 143 140
Delaware 21 20 18 18 3 2
District of Columbia 0 0 0 0 0 0
Florida 800 904 420 769 380 135
Georgia 15 17 9 17 6 0
Guam 0 1 0 0 0 1
Hawaii 8 7 4 7 4 0
Idaho 120 12 120 12 0 0
Illinois 85 173 0 15 85 158
Indiana 15 61 0 26 15 35
Iowa 202 52 0 2 202 50
Kansas 66 18 0 0 66 18
Kentucky 52 499 0 0 52 499
Louisiana 15 3 3 0 12 3
Maine 0 0 0 0 0 0
Maryland 452 331 0 0 452 331
Massachusetts 678 319 315 96 363 223
Michigan 852 257 0 0 852 257
Minnesota 219 64 219 64 0 0
Mississippi 0 0 0 0 0 0
Missouri 47 34 44 33 3 1
Montana 12 10 0 0 12 10
Nebraska 5 81 0 80 5 1
Nevada 1 0 0 0 1 0
New Hampshire 29 0 0 0 29 0
New Jersey 144 110 0 0 144 110
New Mexico 0 0 0 0 0 0
New York 4,118 4,387 78 133 4,040 4,254
North Carolina 641 509 302 478 339 31
North Dakota 0 0 0 0 0 0

All Programs
PY 2019 Illinois State Data Book 30
All DWG Disaster Recovery Economic Recovery
PY 2018 PY 2019 PY 2018 PY 2019 PY 2018 PY 2019
Northern Mariana Islands 15 32 0 0 15 32
Ohio 181 595 79 220 102 375
Oklahoma 6 186 4 178 2 8
Oregon 287 35 0 0 287 35
Palau 0 0 0 0 0 0
Pennsylvania 555 213 10 1 545 212
Puerto Rico - - - - - -
Rhode Island 323 504 0 0 323 504
South Carolina 9 25 7 25 2 0
South Dakota 0 0 0 0 0 0
Tennessee 6 413 6 413 0 0
Texas 2,483 1,420 2,483 1,420 0 0
Utah 0 0 0 0 0 0
Vermont 17 1 17 1 0 0
Virgin Islands 64 100 64 66 0 34
Virginia 41 17 0 0 41 17
Washington 814 151 0 0 814 151
West Virginia 35 175 35 175 0 0
Wisconsin 14 156 0 0 14 156
Wyoming 10 3 0 0 10 3

All Programs
PY 2019 Illinois State Data Book 31
Table I-13 Trends in the Number of WIOA Youth Exiters, by State and Reporting Period
(Derived from WIASRD and PIRL Files)
PY 2015 PY 2016 PY 2017 PY 2018 PY 2019
Nation 90,888 82,604 81,467 81,365 80,693
Alabama 1,514 1,899 1,647 1,090 1,590
Alaska 293 575 380 290 206
Arizona 1,188 1,544 2,131 2,124 2,183
Arkansas 719 698 610 668 532
California 14,806 12,769 11,870 12,109 13,674
Colorado 410 1,196 1,806 1,779 1,558
Connecticut 617 657 799 740 817
Delaware 216 275 219 292 148
District of Columbia 72 222 387 392 301
Florida 6,521 4,637 4,050 4,061 3,270
Georgia 3,102 2,970 3,498 3,294 2,718
Guam - 86 48 18 0
Hawaii 176 201 104 138 127
Idaho 457 382 263 265 429
Illinois 3,717 4,126 3,453 3,964 3,586
Indiana 3,246 3,439 2,933 2,883 2,276
Iowa 324 249 603 424 340
Kansas 546 596 480 458 347
Kentucky 1,739 1,404 501 904 1,413
Louisiana 640 728 811 955 1,212
Maine 432 298 342 190 247
Maryland 1,101 1,037 985 1,069 813
Massachusetts 1,230 1,273 956 1,018 922
Michigan 3,780 2,098 2,274 2,115 1,809
Minnesota 1,651 1,150 1,113 792 915
Mississippi 1,504 954 1,163 1,321 1,360
Missouri 1,508 1,381 1,949 1,614 1,134
Montana 238 160 90 73 104
Nebraska 252 242 251 237 204
Nevada 2,252 1,100 951 1,009 835
New Hampshire 234 177 190 200 184
New Jersey 3,336 1,938 2,487 2,125 1,927
New Mexico 600 521 507 638 757
New York 4,888 5,775 4,656 4,346 4,598
North Carolina 2,485 2,414 2,875 2,703 2,641
North Dakota 163 146 171 154 153
Northern Mariana Islands - - 21 35 24
Ohio 2,085 3,750 3,710 3,749 3,755
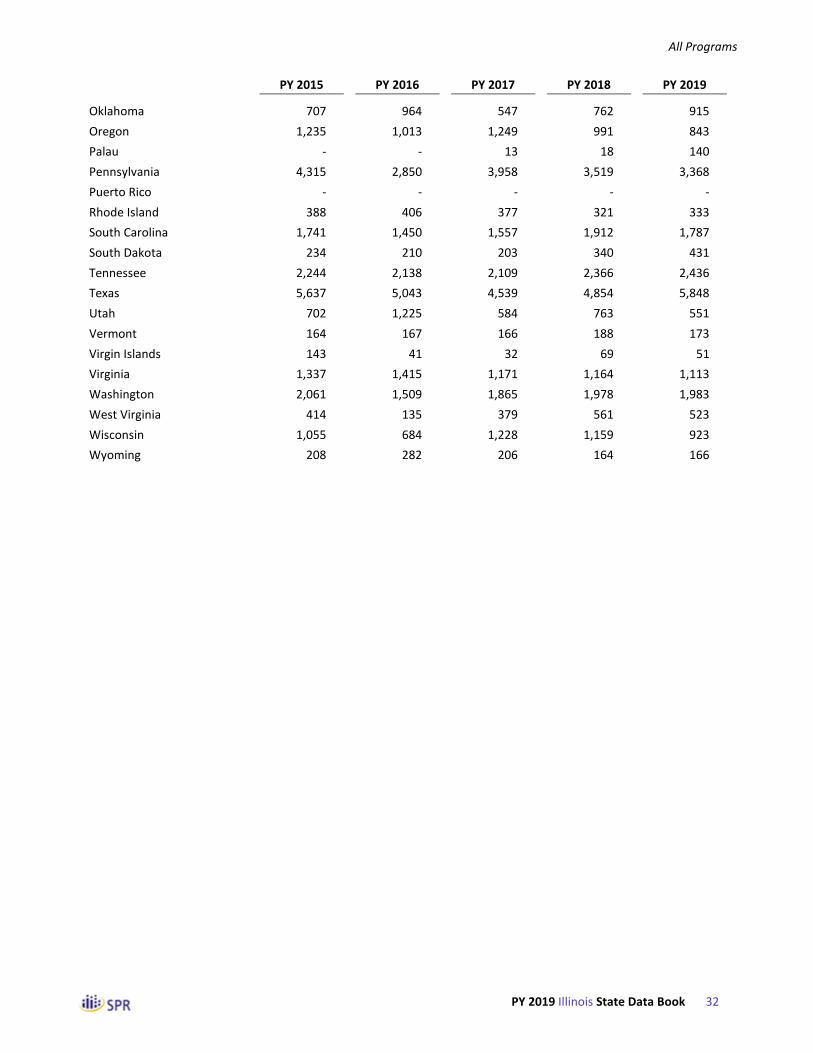
All Programs
PY 2019 Illinois State Data Book 32
PY 2015 PY 2016 PY 2017 PY 2018 PY 2019
Oklahoma 707 964 547 762 915
Oregon 1,235 1,013 1,249 991 843
Palau - - 13 18 140
Pennsylvania 4,315 2,850 3,958 3,519 3,368
Puerto Rico - - - - -
Rhode Island 388 406 377 321 333
South Carolina 1,741 1,450 1,557 1,912 1,787
South Dakota 234 210 203 340 431
Tennessee 2,244 2,138 2,109 2,366 2,436
Texas 5,637 5,043 4,539 4,854 5,848
Utah 702 1,225 584 763 551
Vermont 164 167 166 188 173
Virgin Islands 143 41 32 69 51
Virginia 1,337 1,415 1,171 1,164 1,113
Washington 2,061 1,509 1,865 1,978 1,983
West Virginia 414 135 379 561 523
Wisconsin 1,055 684 1,228 1,159 923
Wyoming 208 282 206 164 166

All Programs
PY 2019 Illinois State Data Book 33
Table I-14 Trends in the Number of Wagner-Peyser Exiters, by State and Reporting Period
(Derived from PY 2019 Q4 PIRL)
PY 2015 PY 2016 PY 2017 PY 2018 PY 2019
Nation -- -- 4,021,585 3,570,450 3,317,555
Alabama -- -- 57,839 80,412 76,833
Alaska -- -- 12,512 13,022 12,278
Arizona -- -- 27,428 39,068 38,202
Arkansas -- -- 79,903 102,226 105,749
California -- -- 243,608 193,320 215,470
Colorado -- -- 73,167 66,221 55,339
Connecticut -- -- 49,135 38,849 33,986
Delaware -- -- 17,311 15,784 13,709
District of Columbia -- -- 13,600 10,303 9,501
Florida -- -- 399,759 229,575 170,256
Georgia -- -- 175,914 223,118 163,609
Guam -- -- 1,279 1,748 1,510
Hawaii -- -- 5,102 3,271 2,906
Idaho -- -- 11,051 12,377 15,334
Illinois -- -- 32,895 33,517 26,814
Indiana -- -- 76,465 43,261 40,663
Iowa -- -- 66,627 58,284 28,037
Kansas -- -- 30,839 24,823 21,204
Kentucky -- -- 44,123 39,759 13,403
Louisiana -- -- 84,796 46,954 46,613
Maine -- -- 7,450 4,454 4,511
Maryland -- -- 52,413 45,094 46,873
Massachusetts -- -- 125,112 115,019 113,907
Michigan -- -- 135,707 109,096 141,312
Minnesota -- -- 35,949 29,465 27,026
Mississippi -- -- 100,335 87,916 77,438
Missouri -- -- 127,942 86,323 51,927
Montana -- -- 22,411 17,078 15,637
Nebraska -- -- 25,559 14,371 11,080
Nevada -- -- 54,060 47,022 51,079
New Hampshire -- -- 19,035 14,252 14,128
New Jersey -- -- 89,084 74,579 60,445
New Mexico -- -- 33,925 27,327 20,768
New York -- -- 292,170 291,031 285,635
North Carolina -- -- 177,139 162,591 161,869
North Dakota -- -- 20,089 3,401 2,073
Northern Mariana Islands -- -- 0 0 3
Ohio -- -- 19,365 23,183 17,377

All Programs
PY 2019 Illinois State Data Book 34
PY 2015 PY 2016 PY 2017 PY 2018 PY 2019
Oklahoma -- -- 26,356 17,647 18,865
Oregon -- -- 0 117,664 114,682
Palau -- -- 0 0 0
Pennsylvania -- -- 107,142 84,248 81,786
Puerto Rico -- -- - - -
Rhode Island -- -- 8,008 4,746 4,577
South Carolina -- -- 87,324 62,941 51,097
South Dakota -- -- 12,410 10,459 8,707
Tennessee -- -- 78,562 31,808 29,994
Texas -- -- 570,672 540,194 430,347
Utah -- -- 42,909 41,323 145,905
Vermont -- -- 6,822 5,081 5,981
Virgin Islands -- -- 3,344 1,786 2,260
Virginia -- -- 48,307 42,007 47,780
Washington -- -- 93,510 92,321 90,848
West Virginia -- -- 48,102 53,745 54,382
Wisconsin -- -- 25,046 27,377 26,104
Wyoming -- -- 21,973 9,009 9,736

Adults
PY 2019 Illinois State Data Book 35
Part II: Adult Program

Adults
PY 2019 Illinois State Data Book 36
Table II-1 Trends in the Characteristics of Adult Exiters, by Reporting Period
(Derived from WIASRD and PIRL Files)
Nation PY 2017
Nation PY 2018
Nation PY 2019
IL PY 2017
IL PY 2018
IL PY 2019
Number of Exiters
All exiters 496,424 412,742 295,282 5,933 6,050 7,611
Statewide programs 4,897 4,683 8,167 62 79 330
Local programs 492,802 409,609 290,196 5,871 5,971 7,281
Age Categories
18 to 21 7.3 7.4 8.4 5.7 6.2 5.5
22 to 29 22.7 22.8 23.7 26.7 27.4 24.6
30 to 44 33.9 34.7 35.1 37.3 38.9 37.5
45 to 54 19.0 18.2 17.2 18.5 16.9 18.5
55 and older 17.0 16.9 15.6 11.7 10.5 14.0
Gender
Females 50.5 51.1 50.7 50.3 53.2 48.4
Males 49.5 48.9 49.3 49.7 46.8 51.6
Race and Ethnicity
Hispanics/Latinos 14.0 15.3 17.7 14.0 13.6 12.2
American Indians/Alaska Natives 3.5 3.5 3.3 0.8 0.9 0.8
Asians 3.9 4.1 4.3 3.3 3.7 3.1
Blacks or African Americans 28.7 28.8 35.1 54.9 56.0 53.5
Native Hawaiians/Pacific Islanders 1.0 1.1 1.0 0.2 0.3 0.2
Whites 66.8 66.5 60.0 41.6 40.3 43.5
More than one race 3.3 3.4 3.3 0.9 1.1 1.1
Employment Status
Employed 21.1 22.4 25.5 25.2 29.8 26.0
Not employed or with layoff notice 78.9 77.6 74.5 74.8 70.2 74.0
Veteran Status
Veterans 6.6 6.0 6.0 6.7 5.3 7.9
Disabled veterans 1.4 1.4 1.7 1.1 0.9 1.8
Other eligible persons 0.2 0.2 0.2 0.1 0.0 0.0
Active duty military spouses -- -- 0.1 -- -- 0.2
Unemployment Compensation Status
Claimants referred by RESEA 2.4 2.1 4.8 1.5 1.4 6.0
Claimants referred by WPRS 1.9 1.1 1.3 9.5 6.2 6.2
Claimants not referred 20.7 20.6 14.9 17.0 12.6 23.6
Claimants exempt 0.2 0.1 0.2 0.1 0.0 0.0
Exhaustees 1.2 1.3 1.2 2.5 2.2 1.2
Neither claimants nor exhaustees 73.6 74.8 77.5 69.5 77.5 63.1

Adults
PY 2019 Illinois State Data Book 37
Nation PY 2017
Nation PY 2018
Nation PY 2019
IL PY 2017
IL PY 2018
IL PY 2019
Highest Educational Level
No educational level completed 11.3 11.8 11.4 9.4 6.4 6.7
Secondary school equivalency 9.6 9.5 9.7 13.4 13.4 14.1
Secondary school graduates 37.6 37.1 35.6 38.9 41.4 39.5
Some postsecondary 15.4 14.7 16.1 19.4 17.5 18.8
Postsecondary technical or vocational certificate
3.1 3.4 4.2 3.1 4.7 4.3
Associate’s Degree 7.8 7.8 8.0 6.0 6.9 7.0
Bachelor’s Degree or higher 15.2 15.7 14.9 9.9 9.8 9.6
School Attendance
Attending school 7.1 7.1 7.6 3.5 3.3 2.6
Not attending 92.9 92.9 92.4 96.5 96.7 97.4
Preprogram Quarterly Earnings
Average Earnings $7,223 $7,554 $7,247 $4,733 $4,719 $5,816
None 24.7 23.8 26.6 26.1 26.8 23.2
$1 to $2,499 18.4 17.7 18.7 26.0 24.7 20.6
$2,500 to $4,999 16.6 16.2 15.7 20.9 21.0 19.3
$5,000 to $7,499 14.1 14.3 13.6 13.9 14.1 16.3
$7,500 to $9,999 9.5 10.1 9.3 6.6 6.8 9.5
$10,000 or more 16.6 17.9 16.1 6.5 6.5 11.1
Public Assistance Information
Any public assistance 26.8 27.4 27.6 51.6 56.5 43.3
TANF 3.2 3.1 3.2 2.0 1.7 1.5
SSI or SSDI 1.9 2.1 2.4 1.5 2.1 1.8
SNAP 22.1 24.3 24.3 51.0 55.6 42.4
Other public assistance 5.9 4.8 5.7 50.7 55.3 40.9
Other Characteristics
Any Adult Program priority group 51.7 54.2 57.6 74.8 79.9 69.6
Individuals with a disability 8.0 8.1 8.8 3.7 3.5 4.0
Long-term unemployed 9.6 11.0 10.3 2.3 3.4 2.6
Exhausting TANF within 2 years 0.1 0.2 0.4 1.7 0.5 0.6
Homeless individuals or runaway youth 3.8 4.3 5.4 1.7 1.9 2.5
Ex-offenders 8.6 11.0 13.2 11.6 12.4 13.2
Low income 45.7 48.2 51.5 63.1 68.3 56.4
English language learners 3.1 3.7 3.6 3.0 2.8 2.9
Basic skills deficient 3.8 5.0 7.5 31.5 35.7 32.7
Facing substantial cultural barrier 0.5 0.9 1.2 1.8 1.5 1.4
Single parents 15.3 18.1 18.4 21.0 19.3 17.3
Displaced homemakers 1.8 1.9 1.3 0.3 0.2 0.2

Adults
PY 2019 Illinois State Data Book 38
Table II-2 Trends in the Number of Adult Exiters, by Reporting Period
(Derived from WIASRD and PIRL Files)
Nation PY 2017
Nation PY 2018
Nation PY 2019
IL PY 2017
IL PY 2018
IL PY 2019
Number of Exiters
All exiters 496,424 412,742 295,282 5,933 6,050 7,611
Statewide programs 4,897 4,683 8,167 62 79 330
Local programs 492,802 409,609 290,196 5,871 5,971 7,281
Age Categories
18 to 21 36,452 30,377 24,692 341 372 417
22 to 29 112,818 93,913 69,978 1,582 1,659 1,872
30 to 44 168,438 143,405 103,667 2,215 2,353 2,853
45 to 54 94,300 75,141 50,856 1,096 1,023 1,405
55 and older 84,169 69,684 45,944 697 637 1,062
Gender
Females 249,613 209,654 148,836 2,974 3,209 3,657
Males 244,844 200,516 144,633 2,939 2,826 3,901
Race and Ethnicity
Hispanics/Latinos 67,138 60,926 50,303 827 821 928
American Indians/Alaska Natives 15,180 12,547 8,284 44 51 57
Asians 16,626 14,561 10,806 179 204 215
Blacks or African Americans 123,459 102,519 88,204 2,938 3,067 3,660
Native Hawaiians/Pacific Islanders 4,422 3,768 2,441 11 15 13
Whites 287,342 236,691 150,792 2,228 2,208 2,978
More than one race 14,308 11,996 8,274 47 62 77
Employment Status
Employed 104,597 92,648 75,239 1,496 1,803 1,982
Not employed or with layoff notice 391,827 320,094 220,043 4,437 4,247 5,629
Veteran Status
Veterans 32,556 24,657 17,604 399 319 598
Disabled veterans 7,080 5,900 4,956 65 56 134
Other eligible persons 921 871 505 * * *
Active duty military spouses -- -- 422 -- -- 12
Unemployment Compensation Status
Claimants referred by RESEA 12,106 8,583 14,221 87 83 456
Claimants referred by WPRS 9,287 4,460 3,809 561 376 470
Claimants not referred 102,814 85,067 44,064 1,007 765 1,794
Claimants exempt 849 596 678 * * *
Exhaustees 6,148 5,230 3,658 150 134 89
Neither claimants nor exhaustees 365,220 308,806 228,852 4,125 4,689 4,799

Adults
PY 2019 Illinois State Data Book 39
Nation PY 2017
Nation PY 2018
Nation PY 2019
IL PY 2017
IL PY 2018
IL PY 2019
Highest Educational Level
No educational level completed 56,305 48,623 33,675 556 388 507
Secondary school equivalency 47,572 39,211 28,573 793 810 1,075
Secondary school graduates 186,534 153,179 105,162 2,306 2,502 3,003
Some postsecondary 76,244 60,864 47,675 1,152 1,059 1,431
Postsecondary technical or vocational certificate
15,596 14,076 12,417 183 282 331
Associate’s Degree 38,520 32,037 23,646 356 416 536
Bachelor’s Degree or higher 75,653 64,752 44,134 587 593 728
School Attendance
Attending school 35,172 29,098 22,573 210 197 195
Not attending 461,204 383,570 272,669 5,723 5,853 7,416
Preprogram Quarterly Earnings
None 121,324 98,285 78,563 1,547 1,619 1,762
$1 to $2,499 90,233 73,165 55,077 1,540 1,497 1,571
$2,500 to $4,999 81,627 66,689 46,259 1,241 1,273 1,466
$5,000 to $7,499 69,171 59,097 40,269 823 856 1,241
$7,500 to $9,999 46,766 41,501 27,442 394 413 725
$10,000 or more 81,447 73,695 47,521 388 392 846
Public Assistance Information
Any public assistance 132,839 112,968 81,460 3,062 3,419 3,298
TANF 15,842 12,814 9,408 119 100 115
SSI or SSDI 9,549 8,773 7,066 91 127 138
SNAP 109,465 100,267 71,774 3,023 3,366 3,227
Other public assistance 29,394 19,661 16,700 3,008 3,346 3,112
Other Characteristics
Any Adult Program priority group 256,507 223,686 170,187 4,439 4,834 5,296
Individuals with a disability 34,167 31,193 23,819 216 208 301
Long-term unemployed 47,678 45,540 30,537 139 207 197
Exhausting TANF within 2 years 362 610 709 * * 11
Homeless individuals or runaway youth 19,092 17,835 15,838 102 113 189
Ex-offenders 32,548 35,697 31,340 686 751 979
Low income 226,890 198,849 152,042 3,744 4,135 4,289
English language learners 15,250 15,264 10,697 179 171 217
Basic skills deficient 18,895 20,786 22,219 1,871 2,161 2,485
Facing substantial cultural barrier 1,507 2,405 2,263 104 91 108
Single parents 66,315 64,112 44,900 1,204 1,124 1,157
Displaced homemakers 8,990 7,898 3,795 16 12 14

Adults
PY 2019 Illinois State Data Book 40
Table II-3 Characteristics of Adults Who Exited from April 2019 to March 2020 in IL, by Age at Program Entry
(Derived from PY 2019 Q4 PIRL)
18 to 21 22 to 29 30 to 44 45 to 54 55 and Older
Number of Exiters
All exiters 417 1,872 2,853 1,405 1,062
Statewide programs 38 98 148 33 13
Local programs 379 1,774 2,705 1,372 1,049
Age Categories
18 to 21 100.0 0.0 0.0 0.0 0.0
22 to 29 0.0 100.0 0.0 0.0 0.0
30 to 44 0.0 0.0 100.0 0.0 0.0
45 to 54 0.0 0.0 0.0 100.0 0.0
55 and older 0.0 0.0 0.0 0.0 100.0
Gender
Females 51.6 57.2 47.9 42.7 40.4
Males 48.4 42.8 52.1 57.3 59.6
Race and Ethnicity
Hispanics/Latinos 21.6 15.4 12.3 9.4 6.5
American Indians/Alaska Natives 0.8 0.6 0.8 1.1 0.9
Asians 1.4 2.4 3.7 3.5 3.3
Blacks or African Americans 52.7 58.2 57.0 50.2 40.5
Native Hawaiians/Pacific Islanders 0.5 0.2 0.2 0.2 0.0
Whites 46.4 39.8 39.6 46.2 56.0
More than one race 1.6 1.1 1.2 1.2 0.7
Employment Status
Employed 46.0 38.6 26.0 16.5 8.6
Not employed or with layoff notice 54.0 61.4 74.0 83.5 91.4
Veteran Status
Veterans 1.2 2.5 5.2 11.7 21.8
Disabled veterans 0.0 0.4 1.5 2.9 4.0
Other eligible persons 0.0 0.0 0.0 0.1 0.0
Active duty military spouses 0.5 0.4 0.1 0.0 0.0
Unemployment Compensation Status
Claimants referred by RESEA 0.0 2.1 6.8 9.1 8.9
Claimants referred by WPRS 1.2 3.3 6.3 8.7 9.4
Claimants not referred 1.9 8.1 21.0 35.6 50.3
Claimants exempt 0.0 0.0 0.0 0.1 0.1
Exhaustees 0.2 0.7 1.1 1.6 1.9
Neither claimants nor exhaustees 96.6 85.7 64.7 45.0 29.5

Adults
PY 2019 Illinois State Data Book 41
18 to 21 22 to 29 30 to 44 45 to 54 55 and Older
Highest Educational Level
No educational level completed 4.1 5.4 7.0 7.7 7.3
Secondary school equivalency 5.5 12.3 18.4 13.7 9.8
Secondary school graduates 67.9 49.5 34.3 32.3 33.8
Some postsecondary 19.7 18.8 17.3 19.4 21.8
Postsecondary technical or vocational certificate
0.5 3.7 5.6 4.8 2.9
Associate’s Degree 2.2 5.0 7.9 8.7 8.1
Bachelor’s Degree or higher 0.2 5.3 9.4 13.4 16.2
School Attendance
Attending school 6.0 4.1 2.1 1.4 1.1
Not attending 94.0 95.9 97.9 98.6 98.9
Preprogram Quarterly Earnings
Average Earnings $2,952 $4,415 $6,030 $6,868 $7,596
None 23.7 19.1 25.2 25.3 21.8
$1 to $2,499 36.9 26.7 18.5 16.4 14.9
$2,500 to $4,999 27.8 25.4 17.2 15.8 15.2
$5,000 to $7,499 7.9 17.7 16.8 15.5 16.9
$7,500 to $9,999 2.9 6.9 10.8 10.6 12.0
$10,000 or more 0.7 4.3 11.4 16.4 19.4
Public Assistance Information
Any public assistance 37.9 55.2 48.1 35.1 22.7
TANF 1.0 2.4 1.5 1.0 0.8
SSI or SSDI 0.7 1.1 1.9 2.5 2.4
SNAP 36.9 54.8 47.2 34.0 21.1
Other public assistance 36.7 53.8 46.0 31.2 18.9
Other Characteristics
Any Adult Program priority group 89.0 82.3 69.9 60.2 51.2
Individuals with a disability 3.6 2.1 3.2 5.8 6.9
Long-term unemployed 1.7 2.6 2.3 3.0 3.0
Exhausting TANF within 2 years 0.0 0.9 0.0 1.1 0.5
Homeless individuals or runaway youth 1.7 1.6 2.2 3.5 3.9
Ex-offenders 3.4 12.4 16.7 14.1 8.1
Low income 68.3 70.0 60.1 45.6 31.7
English language learners 1.9 1.8 3.4 3.4 2.7
Basic skills deficient 47.5 40.1 34.7 27.2 15.3
Facing substantial cultural barrier 0.7 1.2 1.8 1.5 1.0
Single parents 6.6 25.2 19.7 10.8 7.5
Displaced homemakers 0.0 0.2 0.2 0.2 0.2

Adults
PY 2019 Illinois State Data Book 42
Table II-4 Characteristics of Adults Who Exited from April 2019 to March 2020 in IL, by Ethnicity and Race
(Derived from PY 2019 Q4 PIRL)
Ethnicity Race
Hispanic Not Hispanic White Only Black Only Other
Number of Exiters
All exiters 928 6,655 2,916 3,605 319
Statewide programs 60 270 84 194 15
Local programs 868 6,385 2,832 3,411 304
Age Categories
18 to 21 9.7 4.9 5.7 5.2 3.8
22 to 29 31.0 23.8 22.5 26.9 21.3
30 to 44 37.6 37.5 33.7 39.6 41.4
45 to 54 14.2 19.0 19.8 17.5 20.4
55 and older 7.4 14.8 18.4 10.8 13.2
Gender
Females 42.8 49.2 46.6 51.6 46.4
Males 57.2 50.8 53.4 48.4 53.6
Race and Ethnicity
Hispanics/Latinos 100.0 0.0 15.1 1.5 8.5
American Indians/Alaska Natives 3.5 0.6 0.0 0.0 17.9
Asians 1.0 3.3 0.0 0.0 67.4
Blacks or African Americans 11.0 57.0 0.0 100.0 17.2
Native Hawaiians/Pacific Islanders 0.4 0.2 0.0 0.0 4.1
Whites 85.6 40.1 100.0 0.0 19.4
More than one race 1.3 1.1 0.0 0.0 24.1
Employment Status
Employed 30.5 25.5 27.7 24.9 33.5
Not employed or with layoff notice 69.5 74.5 72.3 75.1 66.5
Veteran Status
Veterans 4.3 8.4 10.2 6.3 7.2
Disabled veterans 0.8 1.9 2.4 1.4 1.3
Other eligible persons 0.0 0.0 0.0 0.0 0.0
Active duty military spouses 0.1 0.2 0.0 0.3 0.0
Unemployment Compensation Status
Claimants referred by RESEA 2.8 6.3 7.9 4.6 2.2
Claimants referred by WPRS 7.4 6.0 5.9 6.5 6.3
Claimants not referred 17.1 24.3 26.9 20.2 15.4
Claimants exempt 0.1 0.0 0.1 0.0 0.0
Exhaustees 1.0 1.2 1.2 1.2 1.9
Neither claimants nor exhaustees 71.6 62.1 58.0 67.5 74.3

Adults
PY 2019 Illinois State Data Book 43
Ethnicity Race
Hispanic Not Hispanic White Only Black Only Other
Highest Educational Level
No educational level completed 10.5 6.1 4.9 6.9 8.5
Secondary school equivalency 18.0 13.6 14.1 14.5 11.0
Secondary school graduates 43.0 39.0 35.3 42.9 38.9
Some postsecondary 13.0 19.6 22.6 16.7 11.6
Postsecondary technical or vocational certificate
4.0 4.4 4.9 4.2 4.4
Associate’s Degree 6.0 7.2 8.0 6.7 6.6
Bachelor’s Degree or higher 5.5 10.1 10.3 8.2 19.1
School Attendance
Attending school 1.4 2.7 3.7 1.8 2.8
Not attending 98.6 97.3 96.3 98.2 97.2
Preprogram Quarterly Earnings
Average Earnings $6,259 $5,743 $6,519 $5,069 $6,116
None 24.2 23.0 22.0 22.9 32.9
$1 to $2,499 17.9 21.1 17.8 23.7 18.5
$2,500 to $4,999 17.0 19.6 18.5 20.8 18.2
$5,000 to $7,499 17.6 16.1 16.8 16.8 10.0
$7,500 to $9,999 11.2 9.3 10.4 8.0 10.3
$10,000 or more 12.1 10.9 14.6 7.9 10.0
Public Assistance Information
Any public assistance 40.0 44.0 36.2 51.6 38.6
TANF 1.1 1.6 1.0 2.0 1.6
SSI or SSDI 1.7 1.8 1.4 2.3 0.6
SNAP 39.3 43.0 35.4 50.6 37.3
Other public assistance 38.8 41.4 33.7 49.2 36.7
Other Characteristics
Any Adult Program priority group 75.9 68.9 66.1 73.3 80.9
Individuals with a disability 2.1 4.3 4.8 3.8 2.5
Long-term unemployed 2.9 2.6 1.8 3.2 3.1
Exhausting TANF within 2 years 0.0 0.6 0.3 1.0 0.0
Homeless individuals or runaway youth 1.2 2.7 2.5 2.5 1.3
Ex-offenders 10.7 13.6 11.5 15.9 6.7
Low income 56.6 56.5 51.3 62.4 59.9
English language learners 6.6 2.3 1.8 1.6 25.4
Basic skills deficient 43.9 31.2 25.3 37.3 47.3
Facing substantial cultural barrier 0.2 1.6 0.7 1.2 13.2
Single parents 13.3 17.9 18.9 18.6 8.8
Displaced homemakers 0.3 0.2 0.2 0.2 0.0

Adults
PY 2019 Illinois State Data Book 44
Table II-5 Characteristics of Adults Who Exited from April 2019 to March 2020 in IL,
by Gender, Employment Status, and Disability Status
(Derived from PY 2019 Q4 PIRL)
Gender Employment Status Has a
Female Male Employed Not Employed Disability
Number of Exiters
All exiters 3,657 3,901 1,982 5,629 301
Statewide programs 60 267 51 279 12
Local programs 3,597 3,634 1,931 5,350 289
Age Categories
18 to 21 5.9 5.2 9.7 4.0 5.0
22 to 29 29.2 20.4 36.5 20.4 13.3
30 to 44 37.0 37.8 37.5 37.5 30.6
45 to 54 16.3 20.5 11.7 20.8 26.9
55 and older 11.7 16.1 4.6 17.3 24.3
Gender
Females 100.0 0.0 66.1 42.1 38.7
Males 0.0 100.0 33.9 57.9 61.3
Race and Ethnicity
Hispanics/Latinos 10.8 13.6 14.3 11.5 6.3
American Indians/Alaska Natives 0.6 1.1 0.8 0.8 0.0
Asians 3.1 3.2 4.1 2.8 1.4
Blacks or African Americans 56.2 51.0 50.4 54.6 50.2
Native Hawaiians/Pacific Islanders 0.2 0.2 0.3 0.2 0.4
Whites 41.2 45.7 45.8 42.7 50.2
More than one race 1.1 1.1 1.3 1.1 1.8
Employment Status
Employed 35.7 17.2 100.0 0.0 14.3
Not employed or with layoff notice 64.3 82.8 0.0 100.0 85.7
Veteran Status
Veterans 2.2 13.2 3.2 9.5 45.8
Disabled veterans 0.7 2.8 0.5 2.2 41.2
Other eligible persons 0.1 0.0 0.0 0.0 0.0
Active duty military spouses 0.1 0.2 0.0 0.2 0.3
Unemployment Compensation Status
Claimants referred by RESEA 6.2 5.6 0.5 7.9 3.7
Claimants referred by WPRS 5.4 7.0 0.6 8.1 8.6
Claimants not referred 18.2 28.1 3.5 30.6 32.6
Claimants exempt 0.0 0.1 0.0 0.1 0.0
Exhaustees 1.1 1.2 0.6 1.4 1.7
Neither claimants nor exhaustees 69.0 58.0 94.8 51.9 53.5

Adults
PY 2019 Illinois State Data Book 45
Gender Employment Status Has a
Female Male Employed Not Employed Disability
Highest Educational Level
No educational level completed 5.8 7.4 3.8 7.7 4.3
Secondary school equivalency 11.3 16.8 11.0 15.2 11.3
Secondary school graduates 38.6 40.4 42.9 38.2 34.2
Some postsecondary 21.2 16.5 21.2 17.9 21.6
Postsecondary technical or vocational certificate
4.8 3.9 6.2 3.7 4.0
Associate’s Degree 8.6 5.6 7.4 6.9 8.3
Bachelor’s Degree or higher 9.7 9.4 7.5 10.3 16.3
School Attendance
Attending school 4.2 1.0 6.9 1.0 1.3
Not attending 95.8 99.0 93.1 99.0 98.7
Preprogram Quarterly Earnings
Average Earnings $5,014 $6,649 $4,830 $6,225 $5,877
None 17.7 28.5 13.5 26.6 40.9
$1 to $2,499 24.4 17.2 22.8 19.9 18.9
$2,500 to $4,999 23.6 15.0 29.2 15.8 16.9
$5,000 to $7,499 18.7 14.1 20.8 14.7 6.6
$7,500 to $9,999 8.6 10.4 9.0 9.7 8.6
$10,000 or more 7.0 14.8 4.7 13.4 8.0
Public Assistance Information
Any public assistance 54.7 33.2 60.7 37.2 46.5
TANF 2.7 0.4 1.2 1.6 1.0
SSI or SSDI 2.4 1.3 1.3 2.0 20.9
SNAP 53.6 32.4 60.4 36.1 37.2
Other public assistance 52.3 30.6 60.0 34.2 34.9
Other Characteristics
Any Adult Program priority group 72.0 67.9 90.4 62.2 91.7
Individuals with a disability 3.2 4.7 2.2 4.6 100.0
Long-term unemployed 2.3 2.9 0.2 3.4 6.0
Exhausting TANF within 2 years 0.8 0.4 0.9 0.5 0.0
Homeless individuals or runaway youth 1.2 3.7 1.3 2.9 10.6
Ex-offenders 5.0 21.1 9.8 14.4 13.3
Low income 65.1 48.8 77.1 49.0 59.5
English language learners 2.7 3.0 4.2 2.4 3.3
Basic skills deficient 32.1 33.4 43.0 29.0 30.6
Facing substantial cultural barrier 1.5 1.3 2.0 1.2 0.7
Single parents 28.7 6.2 30.9 11.6 15.6
Displaced homemakers 0.3 0.1 0.0 0.2 0.7
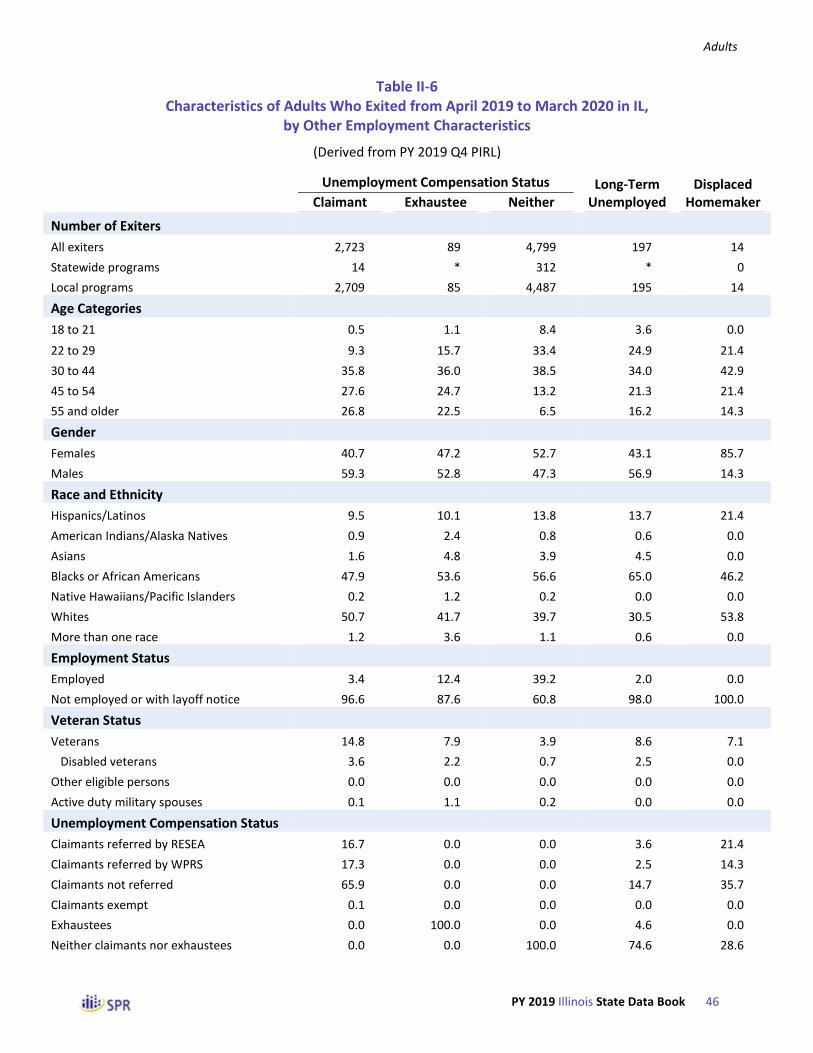
Adults
PY 2019 Illinois State Data Book 46
Table II-6 Characteristics of Adults Who Exited from April 2019 to March 2020 in IL,
by Other Employment Characteristics
(Derived from PY 2019 Q4 PIRL)
Unemployment Compensation Status Long-Term Displaced
Claimant Exhaustee Neither Unemployed Homemaker
Number of Exiters
All exiters 2,723 89 4,799 197 14
Statewide programs 14 * 312 * 0
Local programs 2,709 85 4,487 195 14
Age Categories
18 to 21 0.5 1.1 8.4 3.6 0.0
22 to 29 9.3 15.7 33.4 24.9 21.4
30 to 44 35.8 36.0 38.5 34.0 42.9
45 to 54 27.6 24.7 13.2 21.3 21.4
55 and older 26.8 22.5 6.5 16.2 14.3
Gender
Females 40.7 47.2 52.7 43.1 85.7
Males 59.3 52.8 47.3 56.9 14.3
Race and Ethnicity
Hispanics/Latinos 9.5 10.1 13.8 13.7 21.4
American Indians/Alaska Natives 0.9 2.4 0.8 0.6 0.0
Asians 1.6 4.8 3.9 4.5 0.0
Blacks or African Americans 47.9 53.6 56.6 65.0 46.2
Native Hawaiians/Pacific Islanders 0.2 1.2 0.2 0.0 0.0
Whites 50.7 41.7 39.7 30.5 53.8
More than one race 1.2 3.6 1.1 0.6 0.0
Employment Status
Employed 3.4 12.4 39.2 2.0 0.0
Not employed or with layoff notice 96.6 87.6 60.8 98.0 100.0
Veteran Status
Veterans 14.8 7.9 3.9 8.6 7.1
Disabled veterans 3.6 2.2 0.7 2.5 0.0
Other eligible persons 0.0 0.0 0.0 0.0 0.0
Active duty military spouses 0.1 1.1 0.2 0.0 0.0
Unemployment Compensation Status
Claimants referred by RESEA 16.7 0.0 0.0 3.6 21.4
Claimants referred by WPRS 17.3 0.0 0.0 2.5 14.3
Claimants not referred 65.9 0.0 0.0 14.7 35.7
Claimants exempt 0.1 0.0 0.0 0.0 0.0
Exhaustees 0.0 100.0 0.0 4.6 0.0
Neither claimants nor exhaustees 0.0 0.0 100.0 74.6 28.6

Adults
PY 2019 Illinois State Data Book 47
Unemployment Compensation Status Long-Term Displaced
Claimant Exhaustee Neither Unemployed Homemaker
Highest Educational Level
No educational level completed 9.5 6.7 5.1 5.6 7.1
Secondary school equivalency 12.6 10.1 15.1 11.7 14.3
Secondary school graduates 30.5 32.6 44.7 35.0 35.7
Some postsecondary 25.9 9.0 15.0 19.3 35.7
Postsecondary technical or vocational certificate
4.8 3.4 4.1 4.6 0.0
Associate’s Degree 7.5 9.0 6.8 6.1 7.1
Bachelor’s Degree or higher 9.3 29.2 9.3 17.8 0.0
School Attendance
Attending school 0.8 2.2 3.6 1.0 0.0
Not attending 99.2 97.8 96.4 99.0 100.0
Preprogram Quarterly Earnings
Average Earnings $7,505 $3,941 $4,596 $4,046 $3,802
None 9.5 37.1 30.7 56.9 21.4
$1 to $2,499 15.2 32.6 23.5 21.3 42.9
$2,500 to $4,999 18.4 18.0 19.8 10.2 14.3
$5,000 to $7,499 19.1 7.9 14.9 5.1 7.1
$7,500 to $9,999 15.1 2.2 6.5 2.5 7.1
$10,000 or more 22.7 2.2 4.7 4.1 7.1
Public Assistance Information
Any public assistance 9.5 68.5 62.1 55.8 14.3
TANF 0.9 1.1 1.9 2.0 0.0
SSI or SSDI 0.7 2.2 2.5 7.1 0.0
SNAP 8.9 68.5 60.9 51.8 14.3
Other public assistance 5.4 66.3 60.6 49.7 14.3
Other Characteristics
Any Adult Program priority group 30.0 87.6 91.7 79.2 35.7
Individuals with a disability 5.0 5.7 3.4 9.2 16.7
Long-term unemployed 1.5 10.1 3.1 100.0 14.3
Exhausting TANF within 2 years 0.6 0.0 0.4 0.0 0.0
Homeless individuals or runaway youth 2.2 3.4 2.6 4.6 7.1
Ex-offenders 6.2 14.6 16.9 16.8 0.0
Low income 16.0 78.7 78.8 68.5 21.4
English language learners 1.0 2.2 3.9 6.1 0.0
Basic skills deficient 5.7 40.4 47.8 35.5 7.1
Facing substantial cultural barrier 0.2 1.1 2.1 3.6 0.0
Single parents 11.7 17.4 19.6 9.3 61.5
Displaced homemakers 0.4 0.0 0.1 1.0 100.0

Adults
PY 2019 Illinois State Data Book 48
Table II-7 Characteristics of Adults Who Exited from April 2019 to March 2020 in IL,
by Adult Program Priority Groups
(Derived from PY 2019 Q4 PIRL)
Any Priority Group Veterans
Receives TANF Low Income
Basic Skills/English
Deficient
Number of Exiters
All exiters 5,296 598 115 4,289 2,528
Statewide programs 309 * * 207 223
Local programs 4,987 593 113 4,082 2,305
Age Categories
18 to 21 7.0 0.8 3.5 6.6 8.0
22 to 29 29.1 7.9 39.1 30.6 29.8
30 to 44 37.7 24.9 38.3 40.0 39.8
45 to 54 16.0 27.6 12.2 14.9 15.6
55 and older 10.3 38.8 7.0 7.9 6.8
Gender
Females 49.8 13.8 85.2 55.6 47.4
Males 50.2 86.2 14.8 44.4 52.6
Race and Ethnicity
Hispanics/Latinos 13.3 6.7 8.7 12.3 17.0
American Indians/Alaska Natives 0.8 0.5 0.9 0.9 1.0
Asians 3.8 2.6 1.9 3.2 5.2
Blacks or African Americans 55.6 42.4 70.1 58.1 60.8
Native Hawaiians/Pacific Islanders 0.2 0.2 0.0 0.2 0.2
Whites 41.0 56.3 29.9 39.0 34.2
More than one race 1.3 2.0 2.8 1.2 1.3
Employment Status
Employed 33.8 10.5 20.9 35.6 34.4
Not employed or with layoff notice 66.2 89.5 79.1 64.4 65.6
Veteran Status
Veterans 11.3 100.0 1.7 5.0 3.2
Disabled veterans 2.5 22.4 0.0 1.1 0.4
Other eligible persons 0.0 0.0 0.0 0.0 0.0
Active duty military spouses 0.2 0.3 0.9 0.2 0.4
Unemployment Compensation Status
Claimants referred by RESEA 0.9 4.2 0.9 0.6 0.4
Claimants referred by WPRS 4.4 9.4 4.3 3.6 4.2
Claimants not referred 10.0 53.7 15.7 6.0 2.1
Claimants exempt 0.0 0.3 0.0 0.0 0.0
Exhaustees 1.5 1.2 0.9 1.6 1.4
Neither claimants nor exhaustees 83.1 31.3 78.3 88.2 91.9

Adults
PY 2019 Illinois State Data Book 49
Any Priority Group Veterans
Receives TANF Low Income
Basic Skills/English
Deficient
Highest Educational Level
No educational level completed 5.6 2.3 13.9 5.5 8.5
Secondary school equivalency 14.6 4.8 13.0 15.6 17.8
Secondary school graduates 42.7 35.6 42.6 42.5 47.4
Some postsecondary 16.4 27.3 14.8 15.7 10.6
Postsecondary technical or vocational certificate
4.2 5.5 3.5 4.4 3.8
Associate’s Degree 7.1 9.5 7.8 7.2 5.8
Bachelor’s Degree or higher 9.4 14.9 4.3 9.3 6.2
School Attendance
Attending school 3.2 2.0 2.6 3.6 1.8
Not attending 96.8 98.0 97.4 96.4 98.2
Preprogram Quarterly Earnings
Average Earnings $4,926 $7,769 $3,358 $4,306 $4,744
None 29.0 23.4 36.5 30.2 30.2
$1 to $2,499 23.2 14.5 33.9 25.5 23.0
$2,500 to $4,999 19.7 17.2 15.7 20.7 18.5
$5,000 to $7,499 14.6 14.2 8.7 14.3 15.0
$7,500 to $9,999 7.0 11.0 2.6 5.4 7.5
$10,000 or more 6.5 19.6 2.6 3.9 5.8
Public Assistance Information
Any public assistance 62.2 19.7 100.0 76.8 59.4
TANF 2.2 0.3 100.0 2.7 1.7
SSI or SSDI 2.5 2.0 4.3 3.1 2.6
SNAP 60.9 18.6 92.2 75.2 58.3
Other public assistance 58.8 15.2 71.3 72.6 58.4
Other Characteristics
Any Adult Program priority group 100.0 100.0 100.0 100.0 100.0
Individuals with a disability 5.2 23.2 2.6 4.2 3.8
Long-term unemployed 2.9 2.8 3.5 3.1 2.9
Exhausting TANF within 2 years 0.8 0.3 0.9 1.1 0.0
Homeless individuals or runaway youth 3.6 12.0 3.5 3.9 2.8
Ex-offenders 16.7 11.4 15.7 17.2 21.4
Low income 81.0 36.0 100.0 100.0 74.3
English language learners 4.1 0.3 11.3 3.2 8.6
Basic skills deficient 46.9 13.5 35.7 43.3 98.3
Facing substantial cultural barrier 2.0 0.5 7.8 2.0 3.8
Single parents 19.2 10.4 51.0 21.5 16.7
Displaced homemakers 0.1 0.2 0.0 0.1 0.0
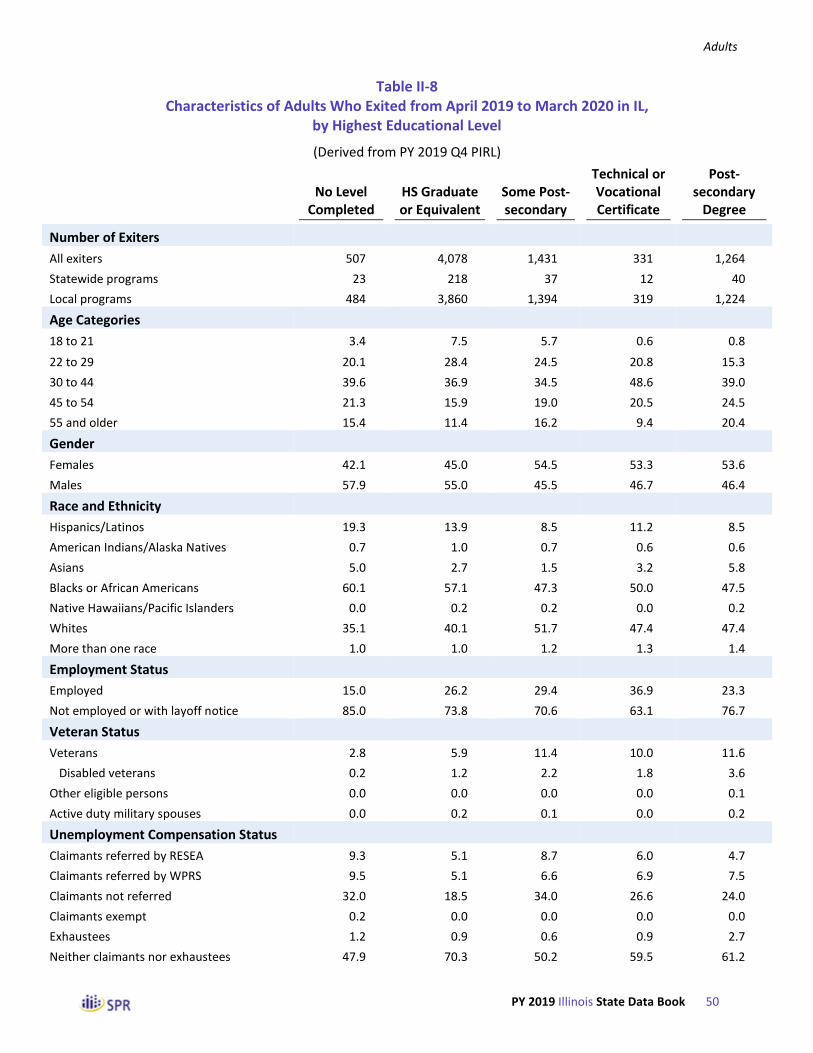
Adults
PY 2019 Illinois State Data Book 50
Table II-8 Characteristics of Adults Who Exited from April 2019 to March 2020 in IL,
by Highest Educational Level
(Derived from PY 2019 Q4 PIRL)
No Level
Completed HS Graduate or Equivalent
Some Post-secondary
Technical or Vocational Certificate
Post-secondary
Degree
Number of Exiters
All exiters 507 4,078 1,431 331 1,264
Statewide programs 23 218 37 12 40
Local programs 484 3,860 1,394 319 1,224
Age Categories
18 to 21 3.4 7.5 5.7 0.6 0.8
22 to 29 20.1 28.4 24.5 20.8 15.3
30 to 44 39.6 36.9 34.5 48.6 39.0
45 to 54 21.3 15.9 19.0 20.5 24.5
55 and older 15.4 11.4 16.2 9.4 20.4
Gender
Females 42.1 45.0 54.5 53.3 53.6
Males 57.9 55.0 45.5 46.7 46.4
Race and Ethnicity
Hispanics/Latinos 19.3 13.9 8.5 11.2 8.5
American Indians/Alaska Natives 0.7 1.0 0.7 0.6 0.6
Asians 5.0 2.7 1.5 3.2 5.8
Blacks or African Americans 60.1 57.1 47.3 50.0 47.5
Native Hawaiians/Pacific Islanders 0.0 0.2 0.2 0.0 0.2
Whites 35.1 40.1 51.7 47.4 47.4
More than one race 1.0 1.0 1.2 1.3 1.4
Employment Status
Employed 15.0 26.2 29.4 36.9 23.3
Not employed or with layoff notice 85.0 73.8 70.6 63.1 76.7
Veteran Status
Veterans 2.8 5.9 11.4 10.0 11.6
Disabled veterans 0.2 1.2 2.2 1.8 3.6
Other eligible persons 0.0 0.0 0.0 0.0 0.1
Active duty military spouses 0.0 0.2 0.1 0.0 0.2
Unemployment Compensation Status
Claimants referred by RESEA 9.3 5.1 8.7 6.0 4.7
Claimants referred by WPRS 9.5 5.1 6.6 6.9 7.5
Claimants not referred 32.0 18.5 34.0 26.6 24.0
Claimants exempt 0.2 0.0 0.0 0.0 0.0
Exhaustees 1.2 0.9 0.6 0.9 2.7
Neither claimants nor exhaustees 47.9 70.3 50.2 59.5 61.2
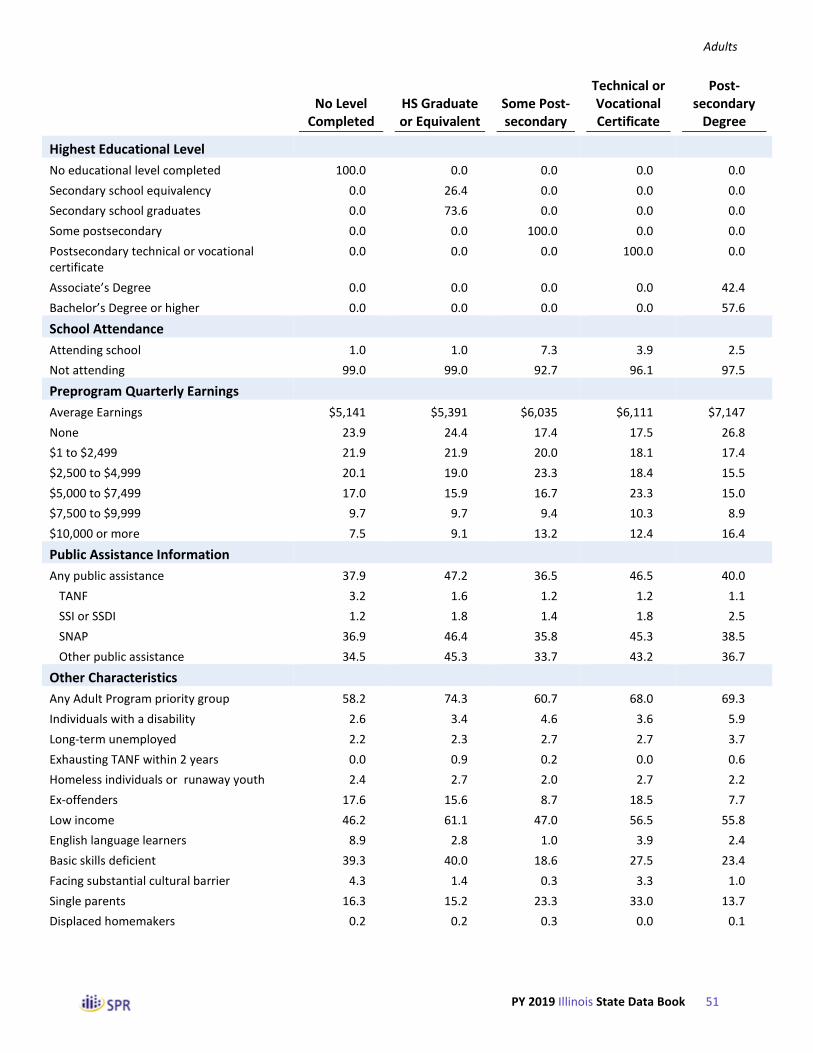
Adults
PY 2019 Illinois State Data Book 51
No Level
Completed HS Graduate or Equivalent
Some Post-secondary
Technical or Vocational Certificate
Post-secondary
Degree
Highest Educational Level
No educational level completed 100.0 0.0 0.0 0.0 0.0
Secondary school equivalency 0.0 26.4 0.0 0.0 0.0
Secondary school graduates 0.0 73.6 0.0 0.0 0.0
Some postsecondary 0.0 0.0 100.0 0.0 0.0
Postsecondary technical or vocational certificate
0.0 0.0 0.0 100.0 0.0
Associate’s Degree 0.0 0.0 0.0 0.0 42.4
Bachelor’s Degree or higher 0.0 0.0 0.0 0.0 57.6
School Attendance
Attending school 1.0 1.0 7.3 3.9 2.5
Not attending 99.0 99.0 92.7 96.1 97.5
Preprogram Quarterly Earnings
Average Earnings $5,141 $5,391 $6,035 $6,111 $7,147
None 23.9 24.4 17.4 17.5 26.8
$1 to $2,499 21.9 21.9 20.0 18.1 17.4
$2,500 to $4,999 20.1 19.0 23.3 18.4 15.5
$5,000 to $7,499 17.0 15.9 16.7 23.3 15.0
$7,500 to $9,999 9.7 9.7 9.4 10.3 8.9
$10,000 or more 7.5 9.1 13.2 12.4 16.4
Public Assistance Information
Any public assistance 37.9 47.2 36.5 46.5 40.0
TANF 3.2 1.6 1.2 1.2 1.1
SSI or SSDI 1.2 1.8 1.4 1.8 2.5
SNAP 36.9 46.4 35.8 45.3 38.5
Other public assistance 34.5 45.3 33.7 43.2 36.7
Other Characteristics
Any Adult Program priority group 58.2 74.3 60.7 68.0 69.3
Individuals with a disability 2.6 3.4 4.6 3.6 5.9
Long-term unemployed 2.2 2.3 2.7 2.7 3.7
Exhausting TANF within 2 years 0.0 0.9 0.2 0.0 0.6
Homeless individuals or runaway youth 2.4 2.7 2.0 2.7 2.2
Ex-offenders 17.6 15.6 8.7 18.5 7.7
Low income 46.2 61.1 47.0 56.5 55.8
English language learners 8.9 2.8 1.0 3.9 2.4
Basic skills deficient 39.3 40.0 18.6 27.5 23.4
Facing substantial cultural barrier 4.3 1.4 0.3 3.3 1.0
Single parents 16.3 15.2 23.3 33.0 13.7
Displaced homemakers 0.2 0.2 0.3 0.0 0.1
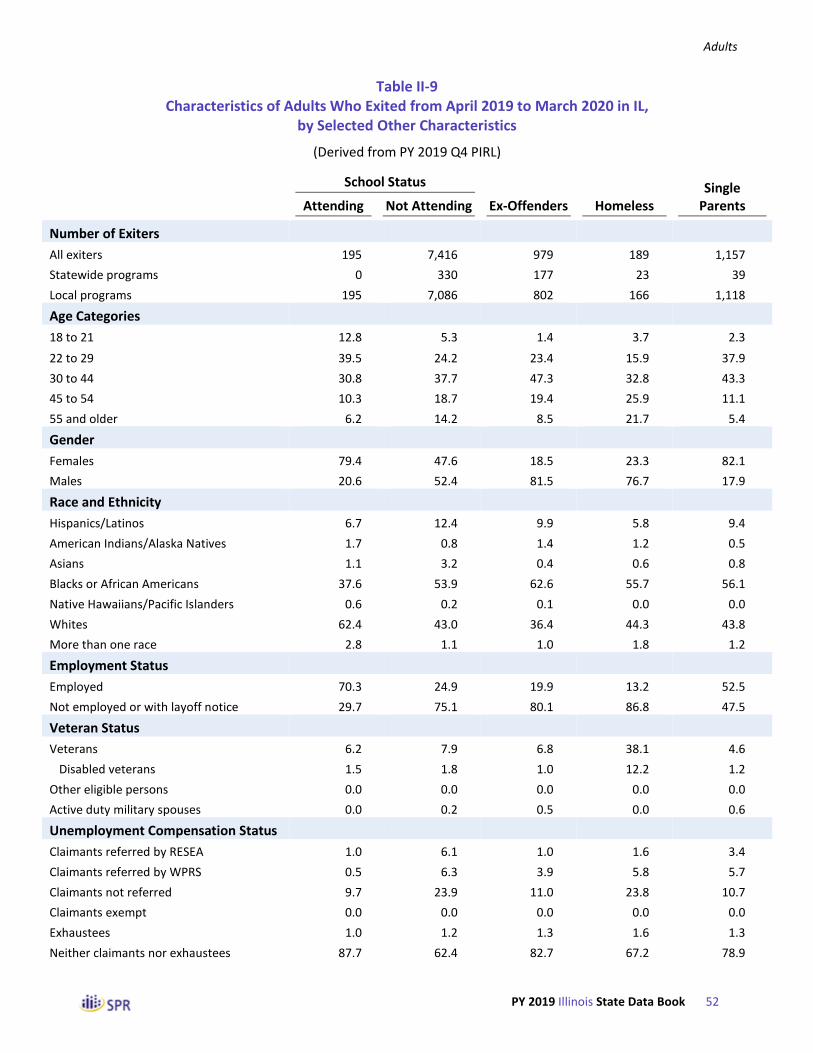
Adults
PY 2019 Illinois State Data Book 52
Table II-9 Characteristics of Adults Who Exited from April 2019 to March 2020 in IL,
by Selected Other Characteristics
(Derived from PY 2019 Q4 PIRL)
School Status Single
Attending Not Attending Ex-Offenders Homeless Parents
Number of Exiters
All exiters 195 7,416 979 189 1,157
Statewide programs 0 330 177 23 39
Local programs 195 7,086 802 166 1,118
Age Categories
18 to 21 12.8 5.3 1.4 3.7 2.3
22 to 29 39.5 24.2 23.4 15.9 37.9
30 to 44 30.8 37.7 47.3 32.8 43.3
45 to 54 10.3 18.7 19.4 25.9 11.1
55 and older 6.2 14.2 8.5 21.7 5.4
Gender
Females 79.4 47.6 18.5 23.3 82.1
Males 20.6 52.4 81.5 76.7 17.9
Race and Ethnicity
Hispanics/Latinos 6.7 12.4 9.9 5.8 9.4
American Indians/Alaska Natives 1.7 0.8 1.4 1.2 0.5
Asians 1.1 3.2 0.4 0.6 0.8
Blacks or African Americans 37.6 53.9 62.6 55.7 56.1
Native Hawaiians/Pacific Islanders 0.6 0.2 0.1 0.0 0.0
Whites 62.4 43.0 36.4 44.3 43.8
More than one race 2.8 1.1 1.0 1.8 1.2
Employment Status
Employed 70.3 24.9 19.9 13.2 52.5
Not employed or with layoff notice 29.7 75.1 80.1 86.8 47.5
Veteran Status
Veterans 6.2 7.9 6.8 38.1 4.6
Disabled veterans 1.5 1.8 1.0 12.2 1.2
Other eligible persons 0.0 0.0 0.0 0.0 0.0
Active duty military spouses 0.0 0.2 0.5 0.0 0.6
Unemployment Compensation Status
Claimants referred by RESEA 1.0 6.1 1.0 1.6 3.4
Claimants referred by WPRS 0.5 6.3 3.9 5.8 5.7
Claimants not referred 9.7 23.9 11.0 23.8 10.7
Claimants exempt 0.0 0.0 0.0 0.0 0.0
Exhaustees 1.0 1.2 1.3 1.6 1.3
Neither claimants nor exhaustees 87.7 62.4 82.7 67.2 78.9

Adults
PY 2019 Illinois State Data Book 53
School Status Single
Attending Not Attending Ex-Offenders Homeless Parents
Highest Educational Level
No educational level completed 2.6 6.8 8.7 6.3 5.9
Secondary school equivalency 5.1 14.4 30.7 19.6 12.9
Secondary school graduates 15.9 40.1 32.4 39.7 35.3
Some postsecondary 53.3 17.9 12.4 14.8 24.5
Postsecondary technical or vocational certificate
6.7 4.3 6.0 4.8 8.2
Associate’s Degree 8.2 7.0 6.4 5.3 8.3
Bachelor’s Degree or higher 8.2 9.6 3.4 9.5 4.9
School Attendance
Attending school 100.0 0.0 0.8 1.6 6.2
Not attending 0.0 100.0 99.2 98.4 93.8
Preprogram Quarterly Earnings
Average Earnings $4,346 $5,857 $4,349 $3,788 $4,913
None 17.9 23.3 45.4 39.7 14.3
$1 to $2,499 25.6 20.5 22.0 32.8 24.3
$2,500 to $4,999 29.7 19.0 13.6 11.6 26.2
$5,000 to $7,499 19.5 16.2 10.3 6.3 21.2
$7,500 to $9,999 2.6 9.7 4.9 5.8 8.1
$10,000 or more 4.6 11.3 3.9 3.7 6.0
Public Assistance Information
Any public assistance 55.4 43.0 57.5 40.2 69.9
TANF 1.5 1.5 1.8 2.1 4.2
SSI or SSDI 0.5 1.8 3.4 2.1 3.3
SNAP 54.9 42.1 56.1 38.6 69.1
Other public assistance 53.8 40.5 53.5 32.3 68.2
Other Characteristics
Any Adult Program priority group 88.2 69.1 89.9 100.0 84.3
Individuals with a disability 2.1 4.0 4.0 17.0 3.6
Long-term unemployed 1.0 2.6 3.4 4.8 1.6
Exhausting TANF within 2 years 0.0 0.6 0.0 0.0 0.5
Homeless individuals or runaway youth 1.5 2.5 7.7 100.0 1.8
Ex-offenders 4.1 13.5 100.0 40.5 12.5
Low income 79.0 55.8 75.3 88.9 77.0
English language learners 1.5 2.9 0.9 1.6 2.7
Basic skills deficient 22.1 32.9 55.2 36.5 35.4
Facing substantial cultural barrier 0.5 1.4 0.9 1.6 1.8
Single parents 38.9 16.6 15.2 12.0 100.0
Displaced homemakers 0.0 0.2 0.0 0.5 0.7

Adults
PY 2019 Illinois State Data Book 54
Table II-10 Characteristics of Adults Who Exited from April 2019 to March 2020 in IL,
by Major Service Categories
(Derived from PY 2019 Q4 PIRL)
All Exiters
Received Career Services
Basic Individualized Only Career
Services Received Training
Number of Exiters
All exiters 7,611 7,611 5,728 3,922 3,689
Statewide programs 330 330 330 170 160
Local programs 7,281 7,281 5,398 3,752 3,529
Age Categories
18 to 21 5.5 5.5 7.1 3.1 8.0
22 to 29 24.6 24.6 29.1 16.3 33.4
30 to 44 37.5 37.5 38.3 34.7 40.5
45 to 54 18.5 18.5 15.5 23.7 12.9
55 and older 14.0 14.0 10.0 22.1 5.3
Gender
Females 48.4 48.4 51.2 42.8 54.2
Males 51.6 51.6 48.8 57.2 45.8
Race and Ethnicity
Hispanics/Latinos 12.2 12.2 13.2 10.2 14.3
American Indians/Alaska Natives 0.8 0.8 0.8 1.0 0.7
Asians 3.1 3.1 3.6 2.5 3.9
Blacks or African Americans 53.5 53.5 54.9 53.8 53.2
Native Hawaiians/Pacific Islanders 0.2 0.2 0.2 0.1 0.3
Whites 43.5 43.5 41.8 43.7 43.3
More than one race 1.1 1.1 1.2 1.0 1.3
Employment Status
Employed 26.0 26.0 34.0 8.8 44.3
Not employed or with layoff notice 74.0 74.0 66.0 91.2 55.7
Veteran Status
Veterans 7.9 7.9 6.8 12.1 3.3
Disabled veterans 1.8 1.8 1.7 2.9 0.6
Other eligible persons 0.0 0.0 0.0 0.1 0.0
Active duty military spouses 0.2 0.2 0.2 0.3 0.0
Unemployment Compensation Status
Claimants referred by RESEA 6.0 6.0 3.4 10.9 0.7
Claimants referred by WPRS 6.2 6.2 4.2 9.0 3.2
Claimants not referred 23.6 23.6 9.5 44.4 1.4
Claimants exempt 0.0 0.0 0.0 0.1 0.0
Exhaustees 1.2 1.2 1.5 0.8 1.6
Neither claimants nor exhaustees 63.1 63.1 81.4 34.8 93.1

Adults
PY 2019 Illinois State Data Book 55
All Exiters
Received Career Services
Basic Individualized Only Career
Services Received Training
Highest Educational Level
No educational level completed 6.7 6.7 5.2 9.1 4.1
Secondary school equivalency 14.1 14.1 14.4 13.2 15.1
Secondary school graduates 39.5 39.5 42.5 35.1 44.1
Some postsecondary 18.8 18.8 16.5 21.3 16.1
Postsecondary technical or vocational certificate
4.3 4.3 4.3 4.2 4.6
Associate’s Degree 7.0 7.0 7.2 7.0 7.1
Bachelor’s Degree or higher 9.6 9.6 9.9 10.1 9.0
School Attendance
Attending school 2.6 2.6 3.0 1.0 4.2
Not attending 97.4 97.4 97.0 99.0 95.8
Preprogram Quarterly Earnings
Average Earnings $5,816 $5,816 $5,204 $6,680 $4,771
None 23.2 23.2 27.7 18.4 28.2
$1 to $2,499 20.6 20.6 21.9 19.3 22.1
$2,500 to $4,999 19.3 19.3 19.3 17.2 21.5
$5,000 to $7,499 16.3 16.3 15.3 16.5 16.0
$7,500 to $9,999 9.5 9.5 8.1 11.9 7.0
$10,000 or more 11.1 11.1 7.7 16.8 5.1
Public Assistance Information
Any public assistance 43.3 43.3 56.0 22.4 65.6
TANF 1.5 1.5 1.6 1.6 1.4
SSI or SSDI 1.8 1.8 2.2 1.3 2.4
SNAP 42.4 42.4 54.9 21.5 64.6
Other public assistance 40.9 40.9 54.3 18.6 64.6
Other Characteristics
Any Adult Program priority group 69.6 69.6 85.4 47.2 93.3
Individuals with a disability 4.0 4.0 4.3 4.9 3.0
Long-term unemployed 2.6 2.6 2.9 2.8 2.3
Exhausting TANF within 2 years 0.6 0.6 0.4 0.6 0.0
Homeless individuals or runaway youth 2.5 2.5 3.0 3.1 1.8
Ex-offenders 13.2 13.2 15.8 10.4 16.0
Low income 56.4 56.4 71.2 32.3 81.9
English language learners 2.9 2.9 3.6 2.6 3.1
Basic skills deficient 32.7 32.7 43.2 19.9 46.2
Facing substantial cultural barrier 1.4 1.4 1.9 1.4 1.4
Single parents 17.3 17.3 18.7 10.3 22.9
Displaced homemakers 0.2 0.2 0.1 0.3 0.1
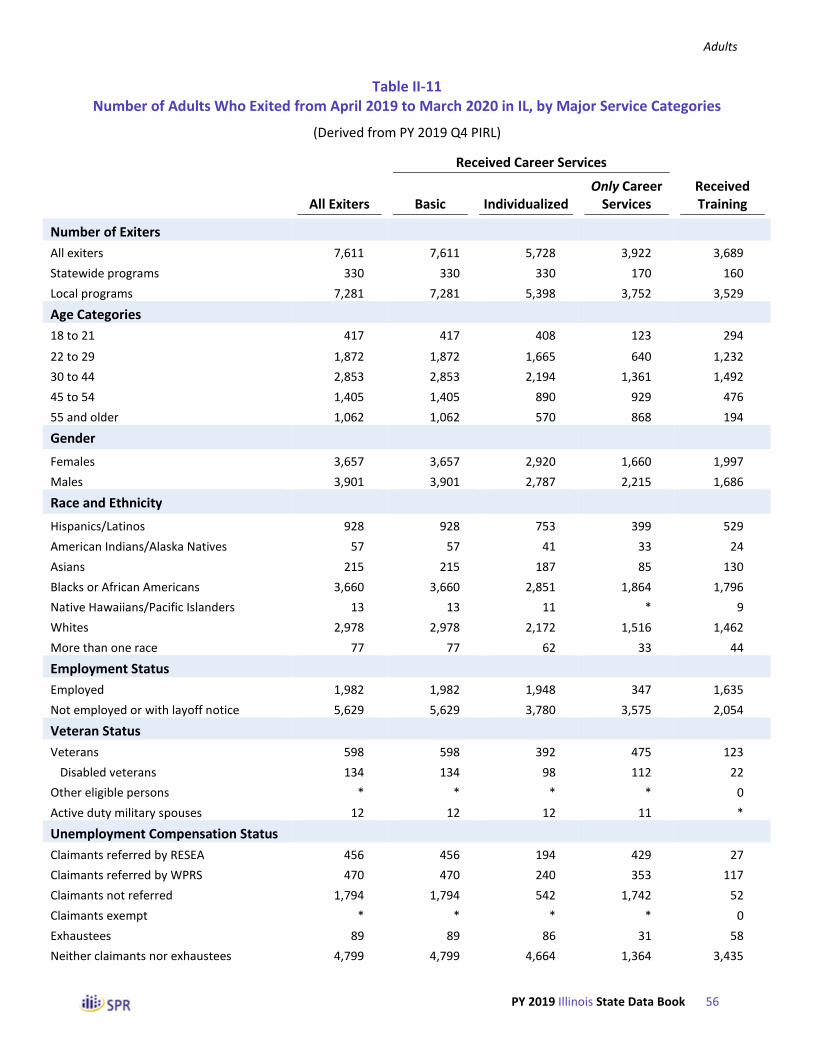
Adults
PY 2019 Illinois State Data Book 56
Table II-11 Number of Adults Who Exited from April 2019 to March 2020 in IL, by Major Service Categories
(Derived from PY 2019 Q4 PIRL)
All Exiters
Received Career Services
Basic
Individualized
Only Career Services
Received Training
Number of Exiters
All exiters 7,611 7,611 5,728 3,922 3,689
Statewide programs 330 330 330 170 160
Local programs 7,281 7,281 5,398 3,752 3,529
Age Categories
18 to 21 417 417 408 123 294
22 to 29 1,872 1,872 1,665 640 1,232
30 to 44 2,853 2,853 2,194 1,361 1,492
45 to 54 1,405 1,405 890 929 476
55 and older 1,062 1,062 570 868 194
Gender
Females 3,657 3,657 2,920 1,660 1,997
Males 3,901 3,901 2,787 2,215 1,686
Race and Ethnicity
Hispanics/Latinos 928 928 753 399 529
American Indians/Alaska Natives 57 57 41 33 24
Asians 215 215 187 85 130
Blacks or African Americans 3,660 3,660 2,851 1,864 1,796
Native Hawaiians/Pacific Islanders 13 13 11 * 9
Whites 2,978 2,978 2,172 1,516 1,462
More than one race 77 77 62 33 44
Employment Status
Employed 1,982 1,982 1,948 347 1,635
Not employed or with layoff notice 5,629 5,629 3,780 3,575 2,054
Veteran Status
Veterans 598 598 392 475 123
Disabled veterans 134 134 98 112 22
Other eligible persons * * * * 0
Active duty military spouses 12 12 12 11 *
Unemployment Compensation Status
Claimants referred by RESEA 456 456 194 429 27
Claimants referred by WPRS 470 470 240 353 117
Claimants not referred 1,794 1,794 542 1,742 52
Claimants exempt * * * * 0
Exhaustees 89 89 86 31 58
Neither claimants nor exhaustees 4,799 4,799 4,664 1,364 3,435

Adults
PY 2019 Illinois State Data Book 57
All Exiters
Received Career Services
Basic
Individualized
Only Career Services
Received Training
Highest Educational Level
No educational level completed 507 507 298 357 150
Secondary school equivalency 1,075 1,075 824 519 556
Secondary school graduates 3,003 3,003 2,436 1,375 1,628
Some postsecondary 1,431 1,431 944 837 594
Postsecondary technical or vocational certificate
331 331 246 163 168
Associate’s Degree 536 536 415 275 261
Bachelor’s Degree or higher 728 728 565 396 332
School Attendance
Attending school 195 195 174 41 154
Not attending 7,416 7,416 5,554 3,881 3,535
Preprogram Quarterly Earnings
None 1,762 1,762 1,589 720 1,042
$1 to $2,499 1,571 1,571 1,252 757 814
$2,500 to $4,999 1,466 1,466 1,108 673 793
$5,000 to $7,499 1,241 1,241 874 649 592
$7,500 to $9,999 725 725 465 466 259
$10,000 or more 846 846 440 657 189
Public Assistance Information
Any public assistance 3,298 3,298 3,208 879 2,419
TANF 115 115 94 62 53
SSI or SSDI 138 138 128 50 88
SNAP 3,227 3,227 3,147 844 2,383
Other public assistance 3,112 3,112 3,109 729 2,383
Other Characteristics
Any Adult Program priority group 5,296 5,296 4,892 1,853 3,443
Individuals with a disability 301 301 246 189 112
Long-term unemployed 197 197 164 111 86
Exhausting TANF within 2 years 11 11 * 11 0
Homeless individuals or runaway youth 189 189 172 123 66
Ex-offenders 979 979 899 387 592
Low income 4,289 4,289 4,081 1,267 3,022
English language learners 217 217 204 102 115
Basic skills deficient 2,485 2,485 2,477 779 1,706
Facing substantial cultural barrier 108 108 107 56 52
Single parents 1,157 1,157 1,024 311 846
Displaced homemakers 14 14 * 12 *

Adults
PY 2019 Illinois State Data Book 58
Table II-12 Characteristics of Adult Trainees Who Exited from April 2019 to March 2020 in IL,
by Type of Training
(Derived from PY 2019 Q4 PIRL)
Any
Training
ABE/ESL or Prerequisite
Training
Work-based
Training
Other Occupational
Training
Other
Training
Number of trainees
All trainees 3,689 93 411 3,294 *
Statewide programs 160 0 63 108 *
Local programs 3,529 93 348 3,186 *
Age Categories
18 to 21 8.0 14.0 17.0 6.8 *
22 to 29 33.4 26.9 32.1 33.7 *
30 to 44 40.5 35.5 32.6 41.5 *
45 to 54 12.9 16.1 13.9 12.8 *
55 and older 5.3 7.5 4.4 5.3 *
Gender
Females 54.2 31.2 38.4 56.1 *
Males 45.8 68.8 61.6 43.9 *
Race and Ethnicity
Hispanics/Latinos 14.3 24.7 23.1 13.1 *
American Indians/Alaska Natives 0.7 2.5 0.8 0.7 *
Asians 3.9 3.7 1.3 4.2 *
Blacks or African Americans 53.2 54.3 52.8 53.4 *
Native Hawaiians/Pacific Islanders 0.3 0.0 0.0 0.3 *
Whites 43.3 40.7 47.2 42.7 *
More than one race 1.3 1.2 1.9 1.2 *
Employment Status
Employed 44.3 35.5 28.2 46.2 *
Not employed or with layoff notice 55.7 64.5 71.8 53.8 *
Veteran Status
Veterans 3.3 5.4 4.4 3.2 *
Disabled veterans 0.6 0.0 0.7 0.6 *
Other eligible persons 0.0 0.0 0.0 0.0 *
Active duty military spouses 0.0 0.0 0.0 0.0 *
Unemployment Compensation Status
Claimants referred by RESEA 0.7 0.0 0.7 0.7 *
Claimants referred by WPRS 3.2 2.2 2.7 3.2 *
Claimants not referred 1.4 1.1 1.7 1.4 *
Claimants exempt 0.0 0.0 0.0 0.0 *
Exhaustees 1.6 2.2 0.7 1.6 *
Neither claimants nor exhaustees 93.1 94.6 94.2 93.0 *
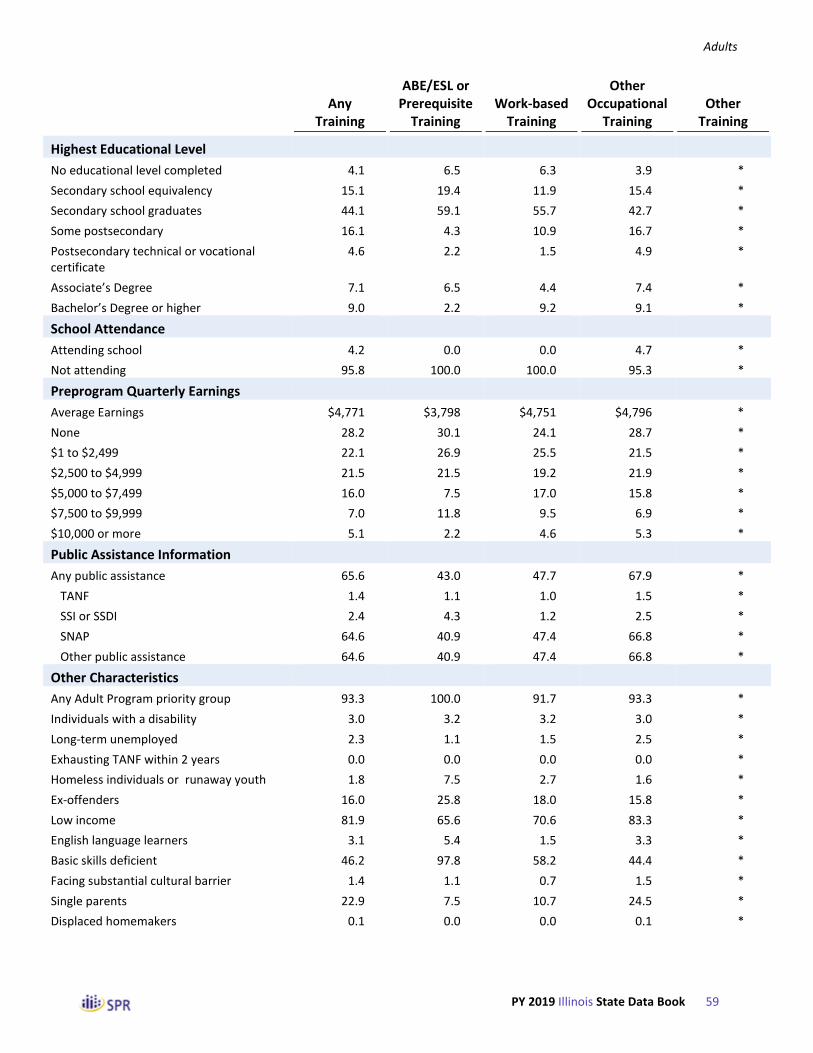
Adults
PY 2019 Illinois State Data Book 59
Any
Training
ABE/ESL or Prerequisite
Training
Work-based
Training
Other Occupational
Training
Other
Training
Highest Educational Level
No educational level completed 4.1 6.5 6.3 3.9 *
Secondary school equivalency 15.1 19.4 11.9 15.4 *
Secondary school graduates 44.1 59.1 55.7 42.7 *
Some postsecondary 16.1 4.3 10.9 16.7 *
Postsecondary technical or vocational certificate
4.6 2.2 1.5 4.9 *
Associate’s Degree 7.1 6.5 4.4 7.4 *
Bachelor’s Degree or higher 9.0 2.2 9.2 9.1 *
School Attendance
Attending school 4.2 0.0 0.0 4.7 *
Not attending 95.8 100.0 100.0 95.3 *
Preprogram Quarterly Earnings
Average Earnings $4,771 $3,798 $4,751 $4,796 *
None 28.2 30.1 24.1 28.7 *
$1 to $2,499 22.1 26.9 25.5 21.5 *
$2,500 to $4,999 21.5 21.5 19.2 21.9 *
$5,000 to $7,499 16.0 7.5 17.0 15.8 *
$7,500 to $9,999 7.0 11.8 9.5 6.9 *
$10,000 or more 5.1 2.2 4.6 5.3 *
Public Assistance Information
Any public assistance 65.6 43.0 47.7 67.9 *
TANF 1.4 1.1 1.0 1.5 *
SSI or SSDI 2.4 4.3 1.2 2.5 *
SNAP 64.6 40.9 47.4 66.8 *
Other public assistance 64.6 40.9 47.4 66.8 *
Other Characteristics
Any Adult Program priority group 93.3 100.0 91.7 93.3 *
Individuals with a disability 3.0 3.2 3.2 3.0 *
Long-term unemployed 2.3 1.1 1.5 2.5 *
Exhausting TANF within 2 years 0.0 0.0 0.0 0.0 *
Homeless individuals or runaway youth 1.8 7.5 2.7 1.6 *
Ex-offenders 16.0 25.8 18.0 15.8 *
Low income 81.9 65.6 70.6 83.3 *
English language learners 3.1 5.4 1.5 3.3 *
Basic skills deficient 46.2 97.8 58.2 44.4 *
Facing substantial cultural barrier 1.4 1.1 0.7 1.5 *
Single parents 22.9 7.5 10.7 24.5 *
Displaced homemakers 0.1 0.0 0.0 0.1 *

Adults
PY 2019 Illinois State Data Book 60
Table II-13 Trends Over Time in Services Received by Adult Exiters, by Reporting Period
(Derived from WIASRD and PIRL Files)
Nation PY 2017
Nation PY 2018
Nation PY 2019
IL PY 2017
IL PY 2018
IL PY 2019
Number of Exiters 496,424 412,742 295,282 5,933 6,050 7,611
Coenrollment
Any coenrollment 82.7 76.7 73.8 28.9 22.2 38.5
WIOA Dislocated Worker 18.4 19.8 12.1 2.1 1.8 3.6
WIOA Youth 0.9 1.0 1.4 0.5 0.4 0.4
Wagner-Peyser 66.6 59.0 65.0 26.8 19.9 36.7
Vocational Rehabilitation 0.1 0.2 0.3 0.1 0.1 0.1
Adult Education 0.3 0.4 0.7 0.4 0.5 0.4
WIOA National Farmworker Jobs 0.0 0.0 0.0 0.0 0.0 0.0
WIOA Indian and Native American 0.0 0.0 0.0 0.0 0.0 0.0
Veterans’ programs 1.3 1.0 1.2 0.9 0.8 2.2
Vocational Education 0.0 0.1 0.1 0.1 0.0 0.2
YouthBuild 0.0 0.0 0.0 0.0 0.0 0.0
Senior Community Services 0.0 0.0 0.0 0.0 0.0 0.0
SNAP Employment and Training 0.5 0.8 1.2 0.3 0.4 0.2
Basic Career Services
Self-service or informational service 72.6 80.2 80.8 46.6 38.5 38.1
Any staff-assisted basic career service 99.6 99.6 99.4 100.0 100.0 100.0
Workforce information services 40.8 37.2 41.0 6.3 3.9 8.3
Career guidance 64.8 64.6 62.0 60.5 59.6 54.0
Staff-assisted job search 39.0 38.3 43.9 23.4 18.6 21.5
Referred to employment 32.8 26.9 28.1 30.1 26.8 32.9
Referred to Federal training 18.1 16.6 23.9 75.2 82.0 65.3
Assistance with UI 2.6 1.0 1.4 1.9 4.3 7.3
Other basic services 44.9 46.8 55.2 0.3 0.3 0.7
Individualized Career Services
Any individualized career service 57.2 61.4 73.4 79.0 86.9 75.3
IEP created 35.4 41.2 51.8 0.7 0.8 3.2
Internships or work experience 1.5 1.8 2.5 4.3 6.7 8.3
Employment, excluding transitional jobs
0.8 1.0 1.3 4.3 6.7 8.3
Transitional jobs 0.3 0.4 0.4 0.1 0.0 0.0
Other work experience 0.4 0.6 1.0 0.0 0.0 0.0
Financial literacy services 0.5 0.6 1.0 0.2 0.2 0.9
English as a second language services 0.3 0.4 0.5 0.3 0.4 0.2
Pre-vocational services 3.6 4.2 5.9 1.3 1.1 0.4
Other individualized services 20.1 18.5 19.4 72.3 78.0 63.1
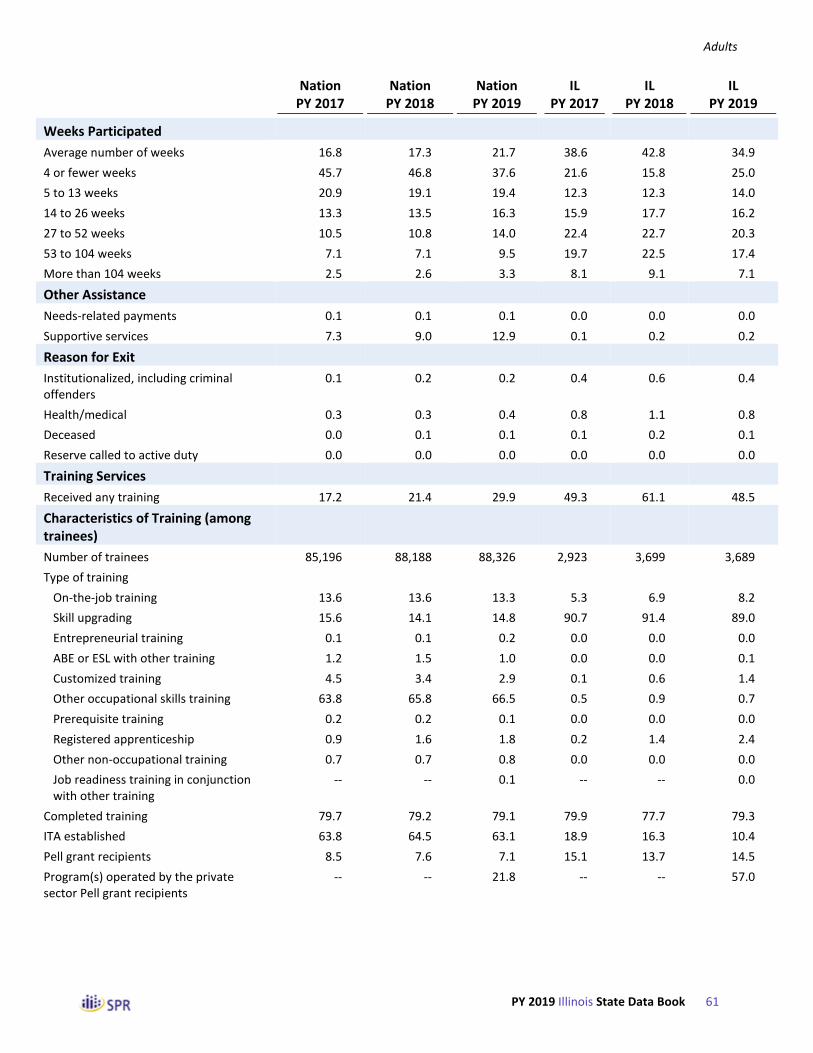
Adults
PY 2019 Illinois State Data Book 61
Nation PY 2017
Nation PY 2018
Nation PY 2019
IL PY 2017
IL PY 2018
IL PY 2019
Weeks Participated
Average number of weeks 16.8 17.3 21.7 38.6 42.8 34.9
4 or fewer weeks 45.7 46.8 37.6 21.6 15.8 25.0
5 to 13 weeks 20.9 19.1 19.4 12.3 12.3 14.0
14 to 26 weeks 13.3 13.5 16.3 15.9 17.7 16.2
27 to 52 weeks 10.5 10.8 14.0 22.4 22.7 20.3
53 to 104 weeks 7.1 7.1 9.5 19.7 22.5 17.4
More than 104 weeks 2.5 2.6 3.3 8.1 9.1 7.1
Other Assistance
Needs-related payments 0.1 0.1 0.1 0.0 0.0 0.0
Supportive services 7.3 9.0 12.9 0.1 0.2 0.2
Reason for Exit
Institutionalized, including criminal offenders
0.1 0.2 0.2 0.4 0.6 0.4
Health/medical 0.3 0.3 0.4 0.8 1.1 0.8
Deceased 0.0 0.1 0.1 0.1 0.2 0.1
Reserve called to active duty 0.0 0.0 0.0 0.0 0.0 0.0
Training Services
Received any training 17.2 21.4 29.9 49.3 61.1 48.5
Characteristics of Training (among trainees)
Number of trainees 85,196 88,188 88,326 2,923 3,699 3,689
Type of training
On-the-job training 13.6 13.6 13.3 5.3 6.9 8.2
Skill upgrading 15.6 14.1 14.8 90.7 91.4 89.0
Entrepreneurial training 0.1 0.1 0.2 0.0 0.0 0.0
ABE or ESL with other training 1.2 1.5 1.0 0.0 0.0 0.1
Customized training 4.5 3.4 2.9 0.1 0.6 1.4
Other occupational skills training 63.8 65.8 66.5 0.5 0.9 0.7
Prerequisite training 0.2 0.2 0.1 0.0 0.0 0.0
Registered apprenticeship 0.9 1.6 1.8 0.2 1.4 2.4
Other non-occupational training 0.7 0.7 0.8 0.0 0.0 0.0
Job readiness training in conjunction with other training
-- -- 0.1 -- -- 0.0
Completed training 79.7 79.2 79.1 79.9 77.7 79.3
ITA established 63.8 64.5 63.1 18.9 16.3 10.4
Pell grant recipients 8.5 7.6 7.1 15.1 13.7 14.5
Program(s) operated by the private sector Pell grant recipients
-- -- 21.8 -- -- 57.0
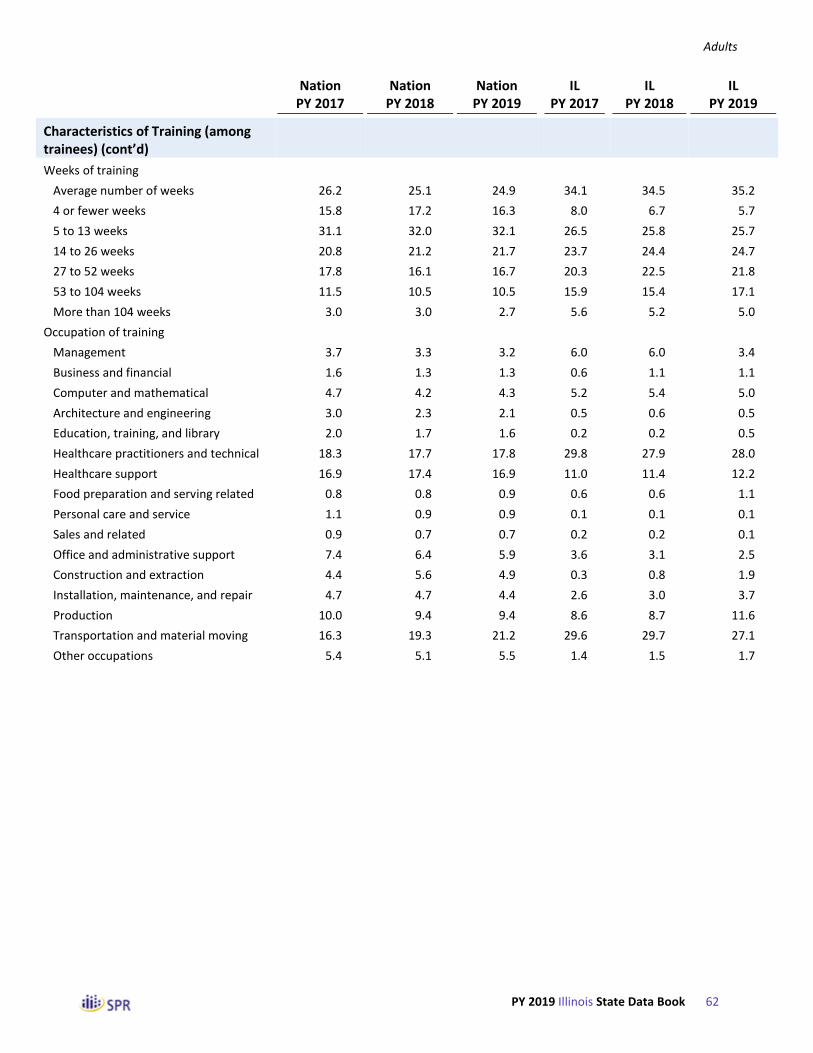
Adults
PY 2019 Illinois State Data Book 62
Nation PY 2017
Nation PY 2018
Nation PY 2019
IL PY 2017
IL PY 2018
IL PY 2019
Characteristics of Training (among trainees) (cont’d)
Weeks of training
Average number of weeks 26.2 25.1 24.9 34.1 34.5 35.2
4 or fewer weeks 15.8 17.2 16.3 8.0 6.7 5.7
5 to 13 weeks 31.1 32.0 32.1 26.5 25.8 25.7
14 to 26 weeks 20.8 21.2 21.7 23.7 24.4 24.7
27 to 52 weeks 17.8 16.1 16.7 20.3 22.5 21.8
53 to 104 weeks 11.5 10.5 10.5 15.9 15.4 17.1
More than 104 weeks 3.0 3.0 2.7 5.6 5.2 5.0
Occupation of training
Management 3.7 3.3 3.2 6.0 6.0 3.4
Business and financial 1.6 1.3 1.3 0.6 1.1 1.1
Computer and mathematical 4.7 4.2 4.3 5.2 5.4 5.0
Architecture and engineering 3.0 2.3 2.1 0.5 0.6 0.5
Education, training, and library 2.0 1.7 1.6 0.2 0.2 0.5
Healthcare practitioners and technical 18.3 17.7 17.8 29.8 27.9 28.0
Healthcare support 16.9 17.4 16.9 11.0 11.4 12.2
Food preparation and serving related 0.8 0.8 0.9 0.6 0.6 1.1
Personal care and service 1.1 0.9 0.9 0.1 0.1 0.1
Sales and related 0.9 0.7 0.7 0.2 0.2 0.1
Office and administrative support 7.4 6.4 5.9 3.6 3.1 2.5
Construction and extraction 4.4 5.6 4.9 0.3 0.8 1.9
Installation, maintenance, and repair 4.7 4.7 4.4 2.6 3.0 3.7
Production 10.0 9.4 9.4 8.6 8.7 11.6
Transportation and material moving 16.3 19.3 21.2 29.6 29.7 27.1
Other occupations 5.4 5.1 5.5 1.4 1.5 1.7

Adults
PY 2019 Illinois State Data Book 63
Table II-14 Trends Over Time in the Number of Adult Exiters Who Received Various Services,
by Reporting Period
(Derived from WIASRD and PIRL Files)
Nation PY 2017
Nation PY 2018
Nation PY 2019
IL PY 2017
IL PY 2018
IL PY 2019
Number of Exiters 496,424 412,742 295,282 5,933 6,050 7,611
Coenrollment
Any coenrollment 410,676 316,548 217,933 1,715 1,346 2,933
WIOA Dislocated Worker 91,529 81,826 35,583 122 107 277
WIOA Youth 4,292 4,093 4,275 29 27 28
Wagner-Peyser 330,617 243,698 191,893 1,588 1,204 2,795
Vocational Rehabilitation 680 933 1,001 * * *
Adult Education 1,322 1,707 1,992 24 31 32
WIOA National Farmworker Jobs 13 39 64 0 0 0
WIOA Indian and Native American 10 11 12 0 0 0
Veterans’ programs 6,382 4,152 3,679 51 50 166
Vocational Education 187 217 250 * * 14
YouthBuild 8 56 19 0 0 0
Senior Community Services 11 14 13 0 0 0
SNAP Employment and Training 2,475 3,127 3,656 18 24 19
Basic Career Services
Self-service or informational service 360,628 330,944 238,692 2,764 2,327 2,901
Any staff-assisted basic career service 494,301 411,028 293,629 5,932 6,049 7,611
Workforce information services 202,788 153,375 121,137 373 234 632
Career guidance 321,454 266,576 183,074 3,588 3,608 4,108
Staff-assisted job search 193,655 158,279 129,571 1,387 1,124 1,638
Referred to employment 162,776 110,903 82,854 1,784 1,623 2,505
Referred to Federal training 89,922 68,625 70,431 4,462 4,959 4,969
Assistance with UI 12,858 4,171 4,160 112 258 557
Other basic services 222,780 192,960 162,902 17 20 57
Individualized Career Services
Any individualized career service 283,969 253,508 216,711 4,690 5,259 5,728
IEP created 175,496 169,997 153,095 43 48 242
Internships or work experience 7,220 7,224 7,302 255 407 631
Employment, excluding transitional jobs 4,191 3,988 3,719 253 406 631
Transitional jobs 1,607 1,532 1,322 * * *
Other work experience 2,168 2,467 2,940 * * 0
Financial literacy services 2,279 2,472 3,027 11 13 65
English as a second language services 1,644 1,515 1,366 19 22 16
Pre-vocational services 17,800 17,341 17,552 80 65 31
Other individualized services 99,998 76,309 57,198 4,290 4,717 4,803

Adults
PY 2019 Illinois State Data Book 64
Nation PY 2017
Nation PY 2018
Nation PY 2019
IL PY 2017
IL PY 2018
IL PY 2019
Weeks Participated
4 or fewer weeks 226,952 193,325 110,948 1,283 953 1,904
5 to 13 weeks 103,823 78,731 57,246 727 743 1,065
14 to 26 weeks 66,171 55,759 48,040 945 1,068 1,231
27 to 52 weeks 51,965 44,555 41,325 1,328 1,372 1,544
53 to 104 weeks 35,313 29,444 27,967 1,170 1,362 1,323
More than 104 weeks 12,200 10,928 9,756 480 552 544
Other Assistance
Needs-related payments 363 284 327 0 0 *
Supportive services 36,470 36,969 37,952 * 15 12
Reason for Exit
Institutionalized, including criminal offenders
603 678 640 22 38 31
Health/medical 1,382 1,351 1,245 50 67 61
Deceased 181 212 163 * 10 *
Reserve called to active duty 15 25 17 * * 0
Training Services
Received any training 85,196 88,188 88,326 2,923 3,699 3,689
Characteristics of Training (among trainees)
Number of trainees 85,196 88,188 88,326 2,923 3,699 3,689
Type of training
On-the-job training 11,623 11,996 11,713 156 254 304
Skill upgrading 13,294 12,461 13,046 2,651 3,380 3,283
Entrepreneurial training 85 60 173 0 0 *
ABE or ESL with other training 1,009 1,333 926 0 0 *
Customized training 3,795 2,982 2,544 * 24 51
Other occupational skills training 54,367 58,041 58,736 16 34 26
Prerequisite training 164 202 104 0 0 0
Registered apprenticeship 784 1,440 1,563 * 50 87
Other non-occupational training 608 631 688 0 0 0
Job readiness training in conjunction with other training Other non-occupational training
-- -- 73 -- -- 0
Completed training 67,868 69,839 69,853 2,335 2,875 2,924
ITA established 54,396 56,876 55,759 551 603 383
Pell grant recipients 7,235 6,733 6,292 440 506 535
Program(s) operated by the private sector -- -- 19,230 -- -- 2,102

Adults
PY 2019 Illinois State Data Book 65
Nation PY 2017
Nation PY 2018
Nation PY 2019
IL PY 2017
IL PY 2018
IL PY 2019
Characteristics of Training (among trainees) (cont’d)
Weeks of training
4 or fewer weeks 13,443 15,177 14,426 233 246 209
5 to 13 weeks 26,506 28,249 28,370 776 955 948
14 to 26 weeks 17,727 18,693 19,199 692 903 913
27 to 52 weeks 15,187 14,166 14,726 593 833 804
53 to 104 weeks 9,783 9,246 9,254 466 569 632
More than 104 weeks 2,550 2,656 2,351 163 193 183
Occupation of training
Management 2,937 2,797 2,691 173 222 126
Business and financial 1,248 1,079 1,085 16 39 40
Computer and mathematical 3,810 3,562 3,608 149 200 186
Architecture and engineering 2,415 1,905 1,760 13 22 17
Education, training, and library 1,606 1,404 1,380 * * 17
Healthcare practitioners and technical 14,689 14,867 15,063 860 1,031 1,032
Healthcare support 13,562 14,630 14,238 316 421 449
Food preparation and serving related 665 648 726 16 22 39
Personal care and service 855 765 753 * * *
Sales and related 692 608 590 * * *
Office and administrative support 5,913 5,350 4,944 105 116 92
Construction and extraction 3,569 4,668 4,128 10 31 69
Installation, maintenance, and repair 3,747 3,971 3,718 76 110 138
Production 8,008 7,915 7,967 248 322 429
Transportation and material moving 13,097 16,251 17,897 853 1,096 999
Other occupations 4,301 4,261 4,616 39 54 61

Adults
PY 2019 Illinois State Data Book 66
Table II-15 Services Received by Adults Who Exited from April 2019 to March 2020 in IL,
by Age at Program Entry
(Derived from PY 2019 Q4 PIRL)
18 to 21 22 to 29 30 to 44 45 to 54 55 and Older
Number of Exiters 417 1,872 2,853 1,405 1,062
Coenrollment
Any coenrollment 6.0 16.2 35.8 56.7 73.8
WIOA Dislocated Worker 0.2 1.1 3.0 6.8 7.1
WIOA Youth 1.7 1.0 0.0 0.0 0.0
Wagner-Peyser 3.4 14.5 33.9 54.8 72.5
Vocational Rehabilitation 0.2 0.1 0.1 0.1 0.3
Adult Education 0.7 0.3 0.5 0.5 0.2
WIOA National Farmworker Jobs 0.0 0.0 0.0 0.0 0.0
WIOA Indian and Native American 0.0 0.0 0.0 0.0 0.0
Veterans’ programs 0.0 0.4 1.4 3.4 6.5
Vocational Education 0.2 0.5 0.0 0.1 0.1
YouthBuild 0.0 0.0 0.0 0.0 0.0
Senior Community Services 0.0 0.0 0.0 0.0 0.0
SNAP Employment and Training 0.0 0.2 0.4 0.3 0.0
Basic Career Services
Self-service or informational service 29.3 30.0 35.9 44.9 52.8
Any staff-assisted basic career service 100.0 100.0 100.0 100.0 100.0
Workforce information services 1.0 2.6 7.6 13.1 16.8
Career guidance 60.0 54.8 53.4 52.5 53.7
Staff-assisted job search 11.3 12.4 19.7 28.8 37.0
Referred to employment 22.3 24.5 32.7 40.1 42.8
Referred to Federal training 97.4 86.3 67.8 48.4 31.5
Assistance with UI 0.7 3.7 7.0 10.4 12.9
Other basic services 0.0 0.1 0.5 1.4 2.1
Individualized Career Services
Any individualized career service 97.8 88.9 76.9 63.3 53.7
IEP created 0.0 0.7 3.0 5.3 6.3
Internships or work experience 26.4 11.1 6.9 5.8 3.0
Employment, excluding transitional jobs 26.4 11.1 6.9 5.8 3.0
Transitional jobs 0.0 0.0 0.1 0.1 0.0
Other work experience 0.0 0.0 0.0 0.0 0.0
Financial literacy services 3.8 1.2 0.8 0.2 0.0
English as a second language services 0.2 0.3 0.1 0.3 0.3
Pre-vocational services 1.0 0.4 0.2 0.6 0.4
Other individualized services Pre-vocational services
70.0 76.5 66.4 51.2 43.7

Adults
PY 2019 Illinois State Data Book 67
18 to 21 22 to 29 30 to 44 45 to 54 55 and Older
Weeks Participated
Average number of weeks 46.0 43.2 36.3 27.6 21.6
4 or fewer weeks 6.2 12.7 23.8 34.7 44.6
5 to 13 weeks 13.2 12.7 13.4 15.7 15.9
14 to 26 weeks 19.4 17.9 15.5 15.1 15.2
27 to 52 weeks 28.3 24.6 21.6 16.9 10.6
53 to 104 weeks 21.8 22.8 18.3 13.0 9.4
More than 104 weeks 11.0 9.3 7.4 4.7 4.2
Other Assistance
Needs-related payments 0.0 0.0 0.0 0.0 0.0
Supportive services 0.5 0.5 0.0 0.0 0.0
Reason for Exit
Institutionalized, including criminal offenders
0.0 0.8 0.4 0.3 0.1
Health/medical 1.0 0.6 0.9 0.7 0.9
Deceased 0.0 0.1 0.0 0.2 0.1
Reserve called to active duty 0.0 0.0 0.0 0.0 0.0
Training Services
Received any training 70.5 65.8 52.3 33.9 18.3
Characteristics of Training (among trainees)
Number of trainees 294 1,232 1,492 476 194
Type of training
On-the-job training 18.4 7.9 6.4 9.2 7.2
Skill upgrading 75.5 89.6 91.5 88.0 89.2
Entrepreneurial training 0.0 0.0 0.0 0.0 0.0
ABE or ESL with other training 0.0 0.1 0.1 0.4 0.0
Customized training 4.1 1.1 0.8 1.9 2.1
Other occupational skills training 2.0 0.8 0.5 0.6 0.0
Prerequisite training 0.0 0.0 0.0 0.0 0.0
Registered apprenticeship 4.1 2.3 2.3 1.7 2.1
Other non-occupational training 0.0 0.0 0.0 0.0 0.0
Job readiness training in conjunction with other training Other non-occupational training
0.0 0.0 0.0 0.0 0.0
Completed training 75.9 80.5 81.0 74.6 74.7
ITA established 10.2 11.9 9.2 10.7 8.8
Pell grant recipients 17.3 19.7 13.5 6.5 4.6
Program(s) operated by the private sector Pell grant recipients
55.1 53.7 59.0 57.6 63.4

Adults
PY 2019 Illinois State Data Book 68
18 to 21 22 to 29 30 to 44 45 to 54 55 and Older
Characteristics of Training (among trainees) (cont’d)
Weeks of training
Average number of weeks 37.6 37.2 34.6 31.3 33.8
4 or fewer weeks 5.1 5.1 5.4 7.6 6.7
5 to 13 weeks 24.1 24.3 25.8 30.3 25.3
14 to 26 weeks 23.8 22.2 26.7 25.2 26.3
27 to 52 weeks 21.1 23.7 21.7 17.2 22.7
53 to 104 weeks 19.7 20.3 15.1 15.5 12.9
More than 104 weeks 6.1 4.4 5.3 4.2 6.2
Occupation of training
Management 1.7 1.3 3.7 5.9 11.3
Business and financial 0.0 0.5 1.3 2.1 2.1
Computer and mathematical 2.7 3.5 5.3 7.8 9.8
Architecture and engineering 1.0 0.2 0.5 0.4 1.0
Education, training, and library 2.4 0.4 0.3 0.2 0.0
Healthcare practitioners and technical 27.2 37.0 27.6 13.7 10.3
Healthcare support 17.7 15.1 9.5 10.9 8.8
Food preparation and serving related 1.7 0.7 1.2 0.6 2.1
Personal care and service 0.3 0.0 0.2 0.2 0.0
Sales and related 0.0 0.0 0.0 0.4 0.0
Office and administrative support 2.4 1.5 2.1 4.8 6.2
Construction and extraction 3.1 1.6 2.0 1.1 2.6
Installation, maintenance, and repair 7.1 3.4 3.6 3.2 3.1
Production 20.7 10.2 11.2 11.8 10.3
Transportation and material moving 11.2 22.3 30.7 36.3 31.4
Other occupations 2.0 2.6 1.1 0.8 1.5
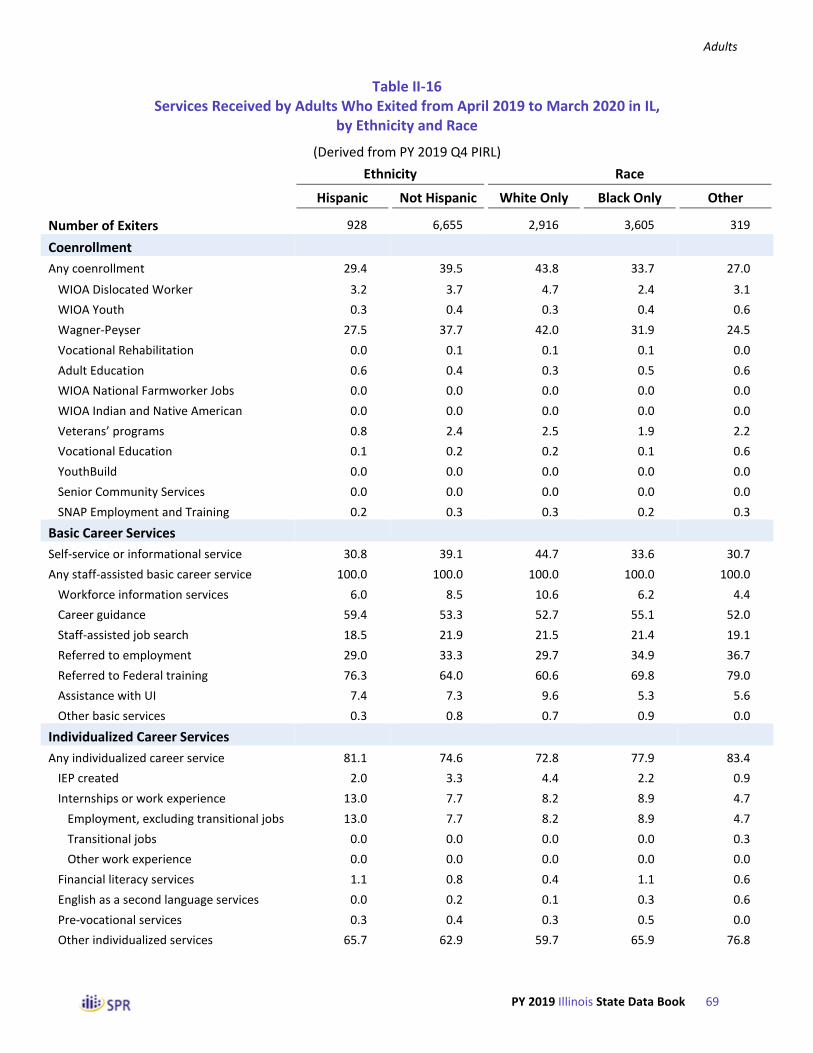
Adults
PY 2019 Illinois State Data Book 69
Table II-16 Services Received by Adults Who Exited from April 2019 to March 2020 in IL,
by Ethnicity and Race
(Derived from PY 2019 Q4 PIRL)
Ethnicity Race
Hispanic Not Hispanic White Only Black Only Other
Number of Exiters 928 6,655 2,916 3,605 319
Coenrollment
Any coenrollment 29.4 39.5 43.8 33.7 27.0
WIOA Dislocated Worker 3.2 3.7 4.7 2.4 3.1
WIOA Youth 0.3 0.4 0.3 0.4 0.6
Wagner-Peyser 27.5 37.7 42.0 31.9 24.5
Vocational Rehabilitation 0.0 0.1 0.1 0.1 0.0
Adult Education 0.6 0.4 0.3 0.5 0.6
WIOA National Farmworker Jobs 0.0 0.0 0.0 0.0 0.0
WIOA Indian and Native American 0.0 0.0 0.0 0.0 0.0
Veterans’ programs 0.8 2.4 2.5 1.9 2.2
Vocational Education 0.1 0.2 0.2 0.1 0.6
YouthBuild 0.0 0.0 0.0 0.0 0.0
Senior Community Services 0.0 0.0 0.0 0.0 0.0
SNAP Employment and Training 0.2 0.3 0.3 0.2 0.3
Basic Career Services
Self-service or informational service 30.8 39.1 44.7 33.6 30.7
Any staff-assisted basic career service 100.0 100.0 100.0 100.0 100.0
Workforce information services 6.0 8.5 10.6 6.2 4.4
Career guidance 59.4 53.3 52.7 55.1 52.0
Staff-assisted job search 18.5 21.9 21.5 21.4 19.1
Referred to employment 29.0 33.3 29.7 34.9 36.7
Referred to Federal training 76.3 64.0 60.6 69.8 79.0
Assistance with UI 7.4 7.3 9.6 5.3 5.6
Other basic services 0.3 0.8 0.7 0.9 0.0
Individualized Career Services
Any individualized career service 81.1 74.6 72.8 77.9 83.4
IEP created 2.0 3.3 4.4 2.2 0.9
Internships or work experience 13.0 7.7 8.2 8.9 4.7
Employment, excluding transitional jobs 13.0 7.7 8.2 8.9 4.7
Transitional jobs 0.0 0.0 0.0 0.0 0.3
Other work experience 0.0 0.0 0.0 0.0 0.0
Financial literacy services 1.1 0.8 0.4 1.1 0.6
English as a second language services 0.0 0.2 0.1 0.3 0.6
Pre-vocational services 0.3 0.4 0.3 0.5 0.0
Other individualized services 65.7 62.9 59.7 65.9 76.8

Adults
PY 2019 Illinois State Data Book 70
Ethnicity Race
Hispanic Not Hispanic White Only Black Only Other
Weeks Participated
Average number of weeks 34.5 35.1 35.6 35.8 34.6
4 or fewer weeks 19.3 25.6 25.7 22.8 21.9
5 to 13 weeks 14.2 14.0 15.1 13.4 12.9
14 to 26 weeks 19.9 15.7 15.1 17.1 15.4
27 to 52 weeks 25.0 19.7 18.5 21.4 27.0
53 to 104 weeks 15.5 17.7 17.3 18.6 17.9
More than 104 weeks 6.0 7.3 8.3 6.8 5.0
Other Assistance
Needs-related payments 0.0 0.0 0.0 0.0 0.0
Supportive services 0.1 0.2 0.2 0.2 0.0
Reason for Exit
Institutionalized, including criminal offenders
0.4 0.4 0.5 0.4 0.0
Health/medical 1.0 0.8 0.9 0.5 4.1
Deceased 0.0 0.1 0.1 0.1 0.0
Reserve called to active duty 0.0 0.0 0.0 0.0 0.0
Training Services
Received any training 57.0 47.5 48.9 48.9 57.7
Characteristics of Training (among trainees)
Number of trainees 529 3,160 1,426 1,763 184
Type of training
On-the-job training 15.1 7.1 9.5 7.4 5.4
Skill upgrading 80.9 90.3 88.0 89.7 93.5
Entrepreneurial training 0.0 0.0 0.0 0.1 0.0
ABE or ESL with other training 0.0 0.1 0.0 0.1 1.1
Customized training 3.6 1.0 1.6 1.1 0.5
Other occupational skills training 0.9 0.7 0.7 0.6 0.5
Prerequisite training 0.0 0.0 0.0 0.0 0.0
Registered apprenticeship 1.9 2.4 1.8 3.2 0.5
Other non-occupational training 0.0 0.0 0.0 0.0 0.0
Job readiness training in conjunction with other training
0.0 0.0 0.0 0.0 0.0
Completed training 83.6 78.5 80.1 77.4 84.2
ITA established 5.5 11.2 10.3 11.5 6.5
Pell grant recipients 5.5 16.0 22.0 10.1 9.8
Program(s) operated by the private sector 64.8 55.7 41.4 68.4 63.0

Adults
PY 2019 Illinois State Data Book 71
Ethnicity Race
Hispanic Not Hispanic White Only Black Only Other
Characteristics of Training (among trainees) (cont’d)
Weeks of training
Average number of weeks 29.6 36.2 41.2 31.9 29.3
4 or fewer weeks 6.0 5.6 6.7 5.2 3.3
5 to 13 weeks 29.5 25.1 21.9 29.1 17.9
14 to 26 weeks 29.3 24.0 21.0 25.2 44.6
27 to 52 weeks 18.5 22.3 22.2 22.2 17.9
53 to 104 weeks 12.9 17.8 21.0 14.7 14.1
More than 104 weeks 3.8 5.2 7.2 3.6 2.2
Occupation of training
Management 1.7 3.7 2.1 3.6 13.0
Business and financial 1.7 1.0 1.3 0.9 1.1
Computer and mathematical 5.5 5.0 5.6 4.3 8.2
Architecture and engineering 0.2 0.5 0.8 0.3 0.0
Education, training, and library 0.6 0.4 0.5 0.5 0.0
Healthcare practitioners and technical 18.3 29.6 34.2 25.1 26.1
Healthcare support 12.1 12.2 11.4 12.9 8.7
Food preparation and serving related 1.1 1.0 0.3 1.6 0.0
Personal care and service 0.2 0.1 0.0 0.3 0.0
Sales and related 0.0 0.1 0.1 0.1 0.0
Office and administrative support 4.0 2.2 2.7 2.2 3.3
Construction and extraction 0.9 2.0 1.5 2.3 1.1
Installation, maintenance, and repair 6.0 3.4 5.1 2.0 6.0
Production 16.6 10.8 13.1 9.5 17.9
Transportation and material moving 30.8 26.5 20.5 32.4 13.6
Other occupations 0.2 1.9 1.1 2.3 1.1
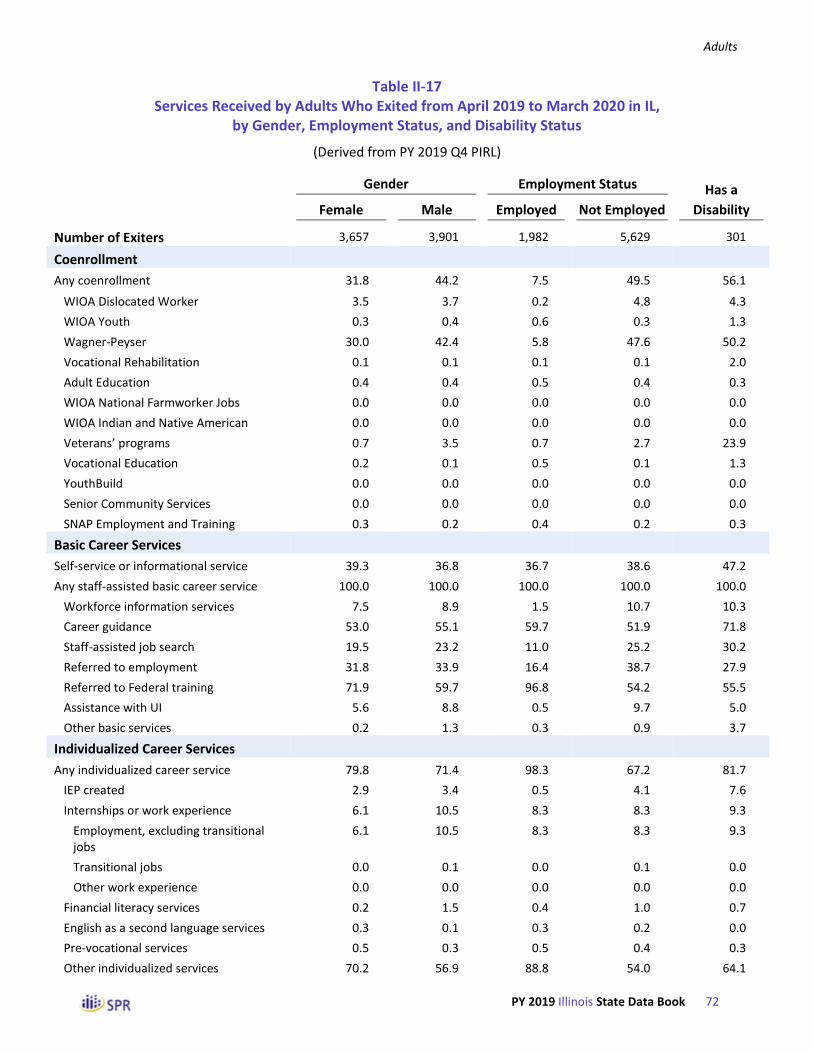
Adults
PY 2019 Illinois State Data Book 72
Table II-17 Services Received by Adults Who Exited from April 2019 to March 2020 in IL,
by Gender, Employment Status, and Disability Status
(Derived from PY 2019 Q4 PIRL)
Gender Employment Status Has a
Female Male Employed Not Employed Disability
Number of Exiters 3,657 3,901 1,982 5,629 301
Coenrollment
Any coenrollment 31.8 44.2 7.5 49.5 56.1
WIOA Dislocated Worker 3.5 3.7 0.2 4.8 4.3
WIOA Youth 0.3 0.4 0.6 0.3 1.3
Wagner-Peyser 30.0 42.4 5.8 47.6 50.2
Vocational Rehabilitation 0.1 0.1 0.1 0.1 2.0
Adult Education 0.4 0.4 0.5 0.4 0.3
WIOA National Farmworker Jobs 0.0 0.0 0.0 0.0 0.0
WIOA Indian and Native American 0.0 0.0 0.0 0.0 0.0
Veterans’ programs 0.7 3.5 0.7 2.7 23.9
Vocational Education 0.2 0.1 0.5 0.1 1.3
YouthBuild 0.0 0.0 0.0 0.0 0.0
Senior Community Services 0.0 0.0 0.0 0.0 0.0
SNAP Employment and Training 0.3 0.2 0.4 0.2 0.3
Basic Career Services
Self-service or informational service 39.3 36.8 36.7 38.6 47.2
Any staff-assisted basic career service 100.0 100.0 100.0 100.0 100.0
Workforce information services 7.5 8.9 1.5 10.7 10.3
Career guidance 53.0 55.1 59.7 51.9 71.8
Staff-assisted job search 19.5 23.2 11.0 25.2 30.2
Referred to employment 31.8 33.9 16.4 38.7 27.9
Referred to Federal training 71.9 59.7 96.8 54.2 55.5
Assistance with UI 5.6 8.8 0.5 9.7 5.0
Other basic services 0.2 1.3 0.3 0.9 3.7
Individualized Career Services
Any individualized career service 79.8 71.4 98.3 67.2 81.7
IEP created 2.9 3.4 0.5 4.1 7.6
Internships or work experience 6.1 10.5 8.3 8.3 9.3
Employment, excluding transitional jobs
6.1 10.5 8.3 8.3 9.3
Transitional jobs 0.0 0.1 0.0 0.1 0.0
Other work experience 0.0 0.0 0.0 0.0 0.0
Financial literacy services 0.2 1.5 0.4 1.0 0.7
English as a second language services 0.3 0.1 0.3 0.2 0.0
Pre-vocational services 0.5 0.3 0.5 0.4 0.3
Other individualized services 70.2 56.9 88.8 54.0 64.1

Adults
PY 2019 Illinois State Data Book 73
Gender Employment Status Has a
Female Male Employed Not Employed Disability
Weeks Participated
Average number of weeks 43.6 26.9 57.5 26.9 34.3
4 or fewer weeks 20.8 28.5 3.8 32.5 23.6
5 to 13 weeks 10.9 16.9 6.1 16.8 14.3
14 to 26 weeks 14.1 18.1 16.0 16.2 15.9
27 to 52 weeks 20.0 20.7 28.6 17.4 19.6
53 to 104 weeks 23.6 11.7 31.2 12.5 20.9
More than 104 weeks 10.6 4.0 14.2 4.7 5.6
Other Assistance
Needs-related payments 0.0 0.0 0.1 0.0 0.0
Supportive services 0.1 0.2 0.3 0.1 0.3
Reason for Exit
Institutionalized, including criminal offenders
0.2 0.6 0.2 0.5 0.0
Health/medical 0.7 0.9 0.6 0.9 2.0
Deceased 0.0 0.1 0.1 0.1 0.0
Reserve called to active duty 0.0 0.0 0.0 0.0 0.0
Training Services
Received any training 54.6 43.2 82.5 36.5 37.2
Characteristics of Training (among trainees)
Number of trainees 1,997 1,686 1,635 2,054 112
Type of training
On-the-job training 6.2 10.7 5.8 10.2 6.3
Skill upgrading 92.0 85.4 92.7 86.0 89.3
Entrepreneurial training 0.1 0.0 0.0 0.0 0.0
ABE or ESL with other training 0.1 0.2 0.2 0.0 0.0
Customized training 1.4 1.4 1.1 1.6 1.8
Other occupational skills training 0.7 0.7 0.9 0.6 0.0
Prerequisite training 0.0 0.0 0.0 0.0 0.0
Registered apprenticeship 1.2 3.8 1.1 3.4 3.6
Other non-occupational training 0.0 0.0 0.0 0.0 0.0
Job readiness training in conjunction with other training
0.0 0.0 0.0 0.0 0.0
Completed training 77.8 81.0 80.9 78.0 68.8
ITA established 11.7 8.8 11.1 9.8 13.4
Pell grant recipients 23.1 4.4 23.3 7.5 12.5
Program(s) operated by the private sector 46.2 69.9 48.2 64.0 48.2

Adults
PY 2019 Illinois State Data Book 74
Gender Employment Status Has a
Female Male Employed Not Employed Disability
Characteristics of Training (among trainees) (cont’d)
Weeks of training
Average number of weeks 44.4 24.3 43.0 29.1 33.5
4 or fewer weeks 3.2 8.5 3.1 7.7 5.4
5 to 13 weeks 16.2 37.0 19.4 30.7 24.1
14 to 26 weeks 21.1 29.1 23.0 26.1 21.4
27 to 52 weeks 28.4 13.9 24.6 19.5 25.9
53 to 104 weeks 24.6 8.3 23.4 12.2 21.4
More than 104 weeks 6.5 3.1 6.5 3.7 1.8
Occupation of training
Management 4.2 2.6 2.6 4.0 3.6
Business and financial 1.7 0.4 0.9 1.2 4.5
Computer and mathematical 3.5 6.9 3.6 6.2 7.1
Architecture and engineering 0.2 0.8 0.4 0.5 1.8
Education, training, and library 0.7 0.2 0.6 0.3 0.9
Healthcare practitioners and technical 47.6 4.8 44.2 15.1 17.0
Healthcare support 21.5 1.1 12.9 11.6 11.6
Food preparation and serving related 1.5 0.6 0.6 1.5 6.3
Personal care and service 0.3 0.0 0.1 0.2 0.9
Sales and related 0.1 0.1 0.0 0.1 0.0
Office and administrative support 2.8 2.1 1.3 3.4 5.4
Construction and extraction 0.7 3.3 0.7 2.8 2.7
Installation, maintenance, and repair 0.4 7.7 2.7 4.6 6.3
Production 4.5 20.0 8.2 14.4 8.9
Transportation and material moving 8.8 48.9 19.7 33.0 19.6
Other occupations 2.2 1.1 1.8 1.6 4.5
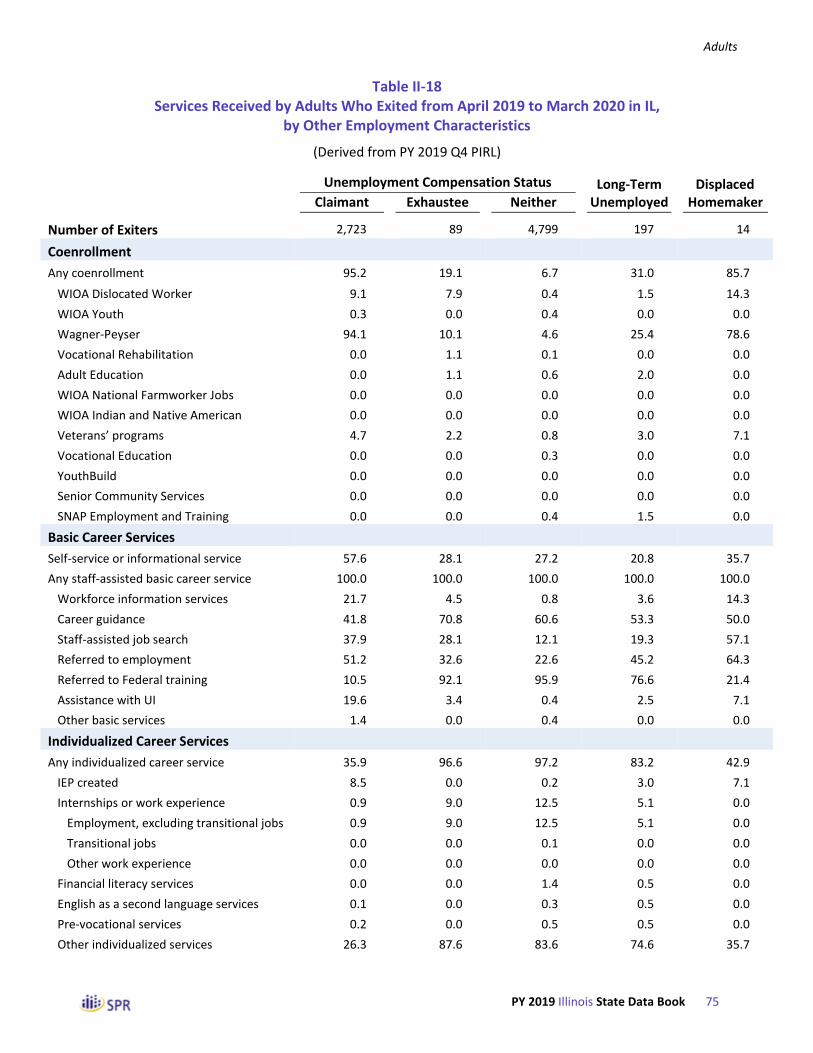
Adults
PY 2019 Illinois State Data Book 75
Table II-18 Services Received by Adults Who Exited from April 2019 to March 2020 in IL,
by Other Employment Characteristics
(Derived from PY 2019 Q4 PIRL)
Unemployment Compensation Status Long-Term Displaced
Claimant Exhaustee Neither Unemployed Homemaker
Number of Exiters 2,723 89 4,799 197 14
Coenrollment
Any coenrollment 95.2 19.1 6.7 31.0 85.7
WIOA Dislocated Worker 9.1 7.9 0.4 1.5 14.3
WIOA Youth 0.3 0.0 0.4 0.0 0.0
Wagner-Peyser 94.1 10.1 4.6 25.4 78.6
Vocational Rehabilitation 0.0 1.1 0.1 0.0 0.0
Adult Education 0.0 1.1 0.6 2.0 0.0
WIOA National Farmworker Jobs 0.0 0.0 0.0 0.0 0.0
WIOA Indian and Native American 0.0 0.0 0.0 0.0 0.0
Veterans’ programs 4.7 2.2 0.8 3.0 7.1
Vocational Education 0.0 0.0 0.3 0.0 0.0
YouthBuild 0.0 0.0 0.0 0.0 0.0
Senior Community Services 0.0 0.0 0.0 0.0 0.0
SNAP Employment and Training 0.0 0.0 0.4 1.5 0.0
Basic Career Services
Self-service or informational service 57.6 28.1 27.2 20.8 35.7
Any staff-assisted basic career service 100.0 100.0 100.0 100.0 100.0
Workforce information services 21.7 4.5 0.8 3.6 14.3
Career guidance 41.8 70.8 60.6 53.3 50.0
Staff-assisted job search 37.9 28.1 12.1 19.3 57.1
Referred to employment 51.2 32.6 22.6 45.2 64.3
Referred to Federal training 10.5 92.1 95.9 76.6 21.4
Assistance with UI 19.6 3.4 0.4 2.5 7.1
Other basic services 1.4 0.0 0.4 0.0 0.0
Individualized Career Services
Any individualized career service 35.9 96.6 97.2 83.2 42.9
IEP created 8.5 0.0 0.2 3.0 7.1
Internships or work experience 0.9 9.0 12.5 5.1 0.0
Employment, excluding transitional jobs 0.9 9.0 12.5 5.1 0.0
Transitional jobs 0.0 0.0 0.1 0.0 0.0
Other work experience 0.0 0.0 0.0 0.0 0.0
Financial literacy services 0.0 0.0 1.4 0.5 0.0
English as a second language services 0.1 0.0 0.3 0.5 0.0
Pre-vocational services 0.2 0.0 0.5 0.5 0.0
Other individualized services 26.3 87.6 83.6 74.6 35.7

Adults
PY 2019 Illinois State Data Book 76
Unemployment Compensation Status Long-Term Displaced
Claimant Exhaustee Neither Unemployed Homemaker
Weeks Participated
Average number of weeks 12.5 54.1 47.2 34.7 27.3
4 or fewer weeks 58.4 10.1 6.4 21.8 50.0
5 to 13 weeks 19.4 1.1 11.2 12.7 14.3
14 to 26 weeks 10.2 18.0 19.5 15.7 7.1
27 to 52 weeks 4.9 30.3 28.8 23.9 14.3
53 to 104 weeks 4.8 28.1 24.3 19.8 0.0
More than 104 weeks 2.4 12.4 9.8 6.1 14.3
Other Assistance
Needs-related payments 0.0 0.0 0.0 0.0 0.0
Supportive services 0.1 0.0 0.2 0.0 0.0
Reason for Exit
Institutionalized, including criminal offenders
0.0 0.0 0.6 1.0 0.0
Health/medical 0.0 3.4 1.2 1.5 0.0
Deceased 0.0 0.0 0.1 0.0 0.0
Reserve called to active duty 0.0 0.0 0.0 0.0 0.0
Training Services
Received any training 7.2 65.2 71.6 43.7 14.3
Characteristics of Training (among trainees)
Number of trainees 196 58 3,435 86 *
Type of training
On-the-job training 6.6 1.7 8.4 5.8 *
Skill upgrading 87.2 93.1 89.0 94.2 *
Entrepreneurial training 0.5 0.0 0.0 0.0 *
ABE or ESL with other training 0.0 0.0 0.1 0.0 *
Customized training 1.5 3.4 1.3 0.0 *
Other occupational skills training 2.6 0.0 0.6 0.0 *
Prerequisite training 0.0 0.0 0.0 0.0 *
Registered apprenticeship 3.1 1.7 2.3 1.2 *
Other non-occupational training 0.0 0.0 0.0 0.0 *
Job readiness training in conjunction with other training
0.0 0.0 0.0 0.0 *
Completed training 78.1 86.2 79.2 81.4 *
ITA established 9.7 5.2 10.5 8.1 *
Pell grant recipients 8.2 6.9 15.0 4.7 *
Program(s) operated by the private sector 59.2 65.5 56.7 74.4 *

Adults
PY 2019 Illinois State Data Book 77
Unemployment Compensation Status Long-Term Displaced
Claimant Exhaustee Neither Unemployed Homemaker
Characteristics of Training (among trainees) (cont’d)
Weeks of training
Average number of weeks 45.7 36.0 34.6 23.6 *
4 or fewer weeks 4.6 1.7 5.8 4.7 *
5 to 13 weeks 20.4 17.2 26.1 33.7 *
14 to 26 weeks 19.9 32.8 24.9 32.6 *
27 to 52 weeks 21.9 25.9 21.7 20.9 *
53 to 104 weeks 24.5 17.2 16.7 8.1 *
More than 104 weeks 8.7 5.2 4.7 0.0 *
Occupation of training
Management 5.1 8.6 3.2 7.0 *
Business and financial 3.1 6.9 0.9 1.2 *
Computer and mathematical 6.6 25.9 4.6 5.8 *
Architecture and engineering 0.5 1.7 0.4 1.2 *
Education, training, and library 1.5 0.0 0.4 0.0 *
Healthcare practitioners and technical 20.9 12.1 28.7 16.3 *
Healthcare support 10.7 5.2 12.4 8.1 *
Food preparation and serving related 1.5 0.0 1.0 7.0 *
Personal care and service 0.5 0.0 0.1 0.0 *
Sales and related 0.0 0.0 0.1 0.0 *
Office and administrative support 4.1 1.7 2.4 2.3 *
Construction and extraction 2.0 1.7 1.9 1.2 *
Installation, maintenance, and repair 2.6 1.7 3.8 0.0 *
Production 7.1 5.2 12.0 8.1 *
Transportation and material moving 30.6 29.3 26.9 40.7 *
Other occupations 3.1 0.0 1.6 1.2 *

Adults
PY 2019 Illinois State Data Book 78
Table II-19 Services Received by Adults Who Exited from April 2019 to March 2020 in IL,
by Adult Program Priority Groups
(Derived from PY 2019 Q4 PIRL)
Any Priority Group Veterans
Receives TANF
Low Income
Basic Skills/English
Deficient
Number of Exiters 5,296 598 115 4,289 2,528
Coenrollment
Any coenrollment 17.4 77.4 28.7 12.0 6.3
WIOA Dislocated Worker 1.8 6.2 1.7 1.1 1.3
WIOA Youth 0.4 0.0 0.0 0.4 0.6
Wagner-Peyser 14.8 74.7 26.1 9.6 3.3
Vocational Rehabilitation 0.2 0.3 0.9 0.2 0.2
Adult Education 0.6 0.0 0.9 0.5 1.0
WIOA National Farmworker Jobs 0.0 0.0 0.0 0.0 0.0
WIOA Indian and Native American 0.0 0.0 0.0 0.0 0.0
Veterans’ programs 3.1 27.6 0.9 1.5 0.4
Vocational Education 0.3 0.2 0.0 0.3 0.2
YouthBuild 0.0 0.0 0.0 0.0 0.0
Senior Community Services 0.0 0.0 0.0 0.0 0.0
SNAP Employment and Training 0.3 0.0 0.9 0.4 0.2
Basic Career Services
Self-service or informational service 31.9 55.4 34.8 30.4 24.9
Any staff-assisted basic career service 100.0 100.0 100.0 100.0 100.0
Workforce information services 3.6 18.6 8.7 2.4 0.6
Career guidance 62.2 76.3 51.3 61.9 58.0
Staff-assisted job search 15.7 31.4 17.4 14.2 14.6
Referred to employment 24.8 36.0 27.8 23.5 24.2
Referred to Federal training 87.4 31.9 75.7 92.6 98.8
Assistance with UI 2.1 6.7 7.8 1.6 0.7
Other basic services 0.9 6.7 0.9 0.5 0.1
Individualized Career Services
Any individualized career service 92.4 65.6 81.7 95.2 99.2
IEP created 1.3 9.5 0.0 0.6 0.2
Internships or work experience 11.0 3.2 3.5 10.5 15.8
Employment, excluding transitional jobs 11.0 3.2 3.5 10.5 15.8
Transitional jobs 0.1 0.2 0.0 0.1 0.1
Other work experience 0.0 0.0 0.0 0.0 0.0
Financial literacy services 1.2 0.2 0.0 0.7 2.3
English as a second language services 0.3 0.0 4.3 0.3 0.6
Pre-vocational services 0.5 0.2 2.6 0.5 0.5
Other individualized services 79.1 52.7 71.3 83.2 81.9

Adults
PY 2019 Illinois State Data Book 79
Any Priority Group Veterans
Receives TANF
Low Income
Basic Skills/English
Deficient
Weeks Participated
Average number of weeks 44.4 21.1 40.4 48.6 40.1
4 or fewer weeks 11.3 38.0 25.2 8.3 6.2
5 to 13 weeks 11.9 20.9 7.0 9.8 15.1
14 to 26 weeks 18.5 15.4 20.9 18.0 23.1
27 to 52 weeks 26.3 13.5 23.5 27.6 29.5
53 to 104 weeks 22.9 8.4 11.3 25.6 19.7
More than 104 weeks 9.3 3.8 12.2 10.6 6.4
Other Assistance
Needs-related payments 0.0 0.0 0.0 0.0 0.0
Supportive services 0.2 0.0 0.0 0.2 0.3
Reason for Exit
Institutionalized, including criminal offenders
0.5 0.0 0.0 0.6 0.8
Health/medical 1.1 0.3 0.0 1.1 1.1
Deceased 0.1 0.0 0.0 0.1 0.2
Reserve called to active duty 0.0 0.0 0.0 0.0 0.0
Training Services
Received any training 65.0 20.6 46.1 70.5 68.2
Characteristics of Training (among trainees)
Number of trainees 3,443 123 53 3,022 1,725
Type of training
On-the-job training 8.1 9.8 5.7 7.1 10.8
Skill upgrading 89.0 86.2 92.5 90.6 85.3
Entrepreneurial training 0.0 0.0 0.0 0.0 0.1
ABE or ESL with other training 0.1 0.0 1.9 0.0 0.2
Customized training 1.3 0.0 0.0 1.0 2.1
Other occupational skills training 0.7 0.8 0.0 0.6 1.2
Prerequisite training 0.0 0.0 0.0 0.0 0.0
Registered apprenticeship 2.2 4.9 1.9 2.0 2.1
Other non-occupational training 0.0 0.0 0.0 0.0 0.0
Job readiness training in conjunction with other training
0.0 0.0 0.0 0.0 0.0
Completed training 78.8 74.8 75.5 78.3 79.5
ITA established 10.2 10.6 7.5 10.1 9.9
Pell grant recipients 14.5 9.8 22.6 15.8 7.9
Program(s) operated by the private sector 57.4 56.1 47.2 55.9 63.9

Adults
PY 2019 Illinois State Data Book 80
Any Priority Group Veterans
Receives TANF
Low Income
Basic Skills/English
Deficient
Characteristics of Training (among trainees) (cont’d)
Weeks of training
Average number of weeks 34.8 30.7 50.7 36.3 26.6
4 or fewer weeks 5.9 8.1 7.5 5.1 7.7
5 to 13 weeks 25.8 28.5 15.1 25.0 32.7
14 to 26 weeks 24.8 25.2 18.9 24.3 27.8
27 to 52 weeks 21.8 21.1 24.5 22.3 18.7
53 to 104 weeks 17.2 13.0 20.8 18.3 10.3
More than 104 weeks 4.6 4.1 13.2 5.1 2.9
Occupation of training
Management 3.4 2.4 3.8 3.4 2.8
Business and financial 1.0 0.8 0.0 1.0 0.9
Computer and mathematical 4.8 10.6 3.8 4.7 3.6
Architecture and engineering 0.5 0.0 0.0 0.5 0.4
Education, training, and library 0.5 0.0 0.0 0.5 0.4
Healthcare practitioners and technical 27.6 12.2 45.3 29.2 16.5
Healthcare support 12.8 3.3 24.5 13.5 13.6
Food preparation and serving related 1.1 0.0 0.0 1.2 1.6
Personal care and service 0.1 0.0 0.0 0.2 0.2
Sales and related 0.1 0.0 0.0 0.1 0.1
Office and administrative support 2.6 4.9 0.0 2.4 3.0
Construction and extraction 1.8 4.9 3.8 1.7 1.7
Installation, maintenance, and repair 3.6 13.0 1.9 3.3 3.9
Production 11.3 9.8 3.8 9.6 17.1
Transportation and material moving 27.5 37.4 13.2 27.3 33.1
Other occupations 1.7 0.8 0.0 1.7 1.6

Adults
PY 2019 Illinois State Data Book 81
Table II-20 Services Received by Adults Who Exited from April 2019 to March 2020 in IL,
by Highest Educational Level
(Derived from PY 2019 Q4 PIRL)
No Level
Completed
HS Graduate or
Equivalent Some Post-secondary
Technical or Vocational Certificate
Post-secondary
Degree
Number of Exiters 507 4,078 1,431 331 1,264
Coenrollment
Any coenrollment 55.2 31.2 52.6 42.9 38.5
WIOA Dislocated Worker 2.6 2.3 5.9 4.2 5.8
WIOA Youth 1.2 0.4 0.3 0.0 0.2
Wagner-Peyser 51.3 29.5 51.2 40.8 36.6
Vocational Rehabilitation 0.2 0.1 0.1 0.0 0.2
Adult Education 2.0 0.4 0.1 0.3 0.2
WIOA National Farmworker Jobs 0.0 0.0 0.0 0.0 0.0
WIOA Indian and Native American 0.0 0.0 0.0 0.0 0.0
Veterans’ programs 0.8 1.5 3.1 3.6 3.4
Vocational Education 0.2 0.2 0.1 0.9 0.1
YouthBuild 0.0 0.0 0.0 0.0 0.0
Senior Community Services 0.0 0.0 0.0 0.0 0.0
SNAP Employment and Training 0.0 0.3 0.1 0.0 0.4
Basic Career Services
Self-service or informational service 40.0 33.2 50.2 41.1 38.8
Any staff-assisted basic career service 100.0 100.0 100.0 100.0 100.0
Workforce information services 10.3 6.7 12.2 10.3 7.8
Career guidance 37.9 55.9 51.6 43.5 59.6
Staff-assisted job search 25.4 19.3 23.5 22.1 24.8
Referred to employment 41.8 32.1 32.8 27.8 33.5
Referred to Federal training 48.9 72.4 50.8 61.3 66.3
Assistance with UI 11.0 6.4 9.0 8.5 6.5
Other basic services 0.2 0.5 1.1 1.2 1.1
Individualized Career Services
Any individualized career service 58.8 79.9 66.0 74.3 77.5
IEP created 3.6 2.6 4.8 3.6 2.9
Internships or work experience 10.1 10.4 5.6 3.3 5.1
Employment, excluding transitional jobs 10.1 10.4 5.6 3.3 5.1
Transitional jobs 0.4 0.0 0.0 0.0 0.0
Other work experience 0.0 0.0 0.0 0.0 0.0
Financial literacy services 1.6 1.2 0.4 0.0 0.2
English as a second language services 1.2 0.2 0.1 0.0 0.1
Pre-vocational services 0.4 0.5 0.1 0.3 0.5
Other individualized services 43.6 66.1 55.4 67.1 68.8
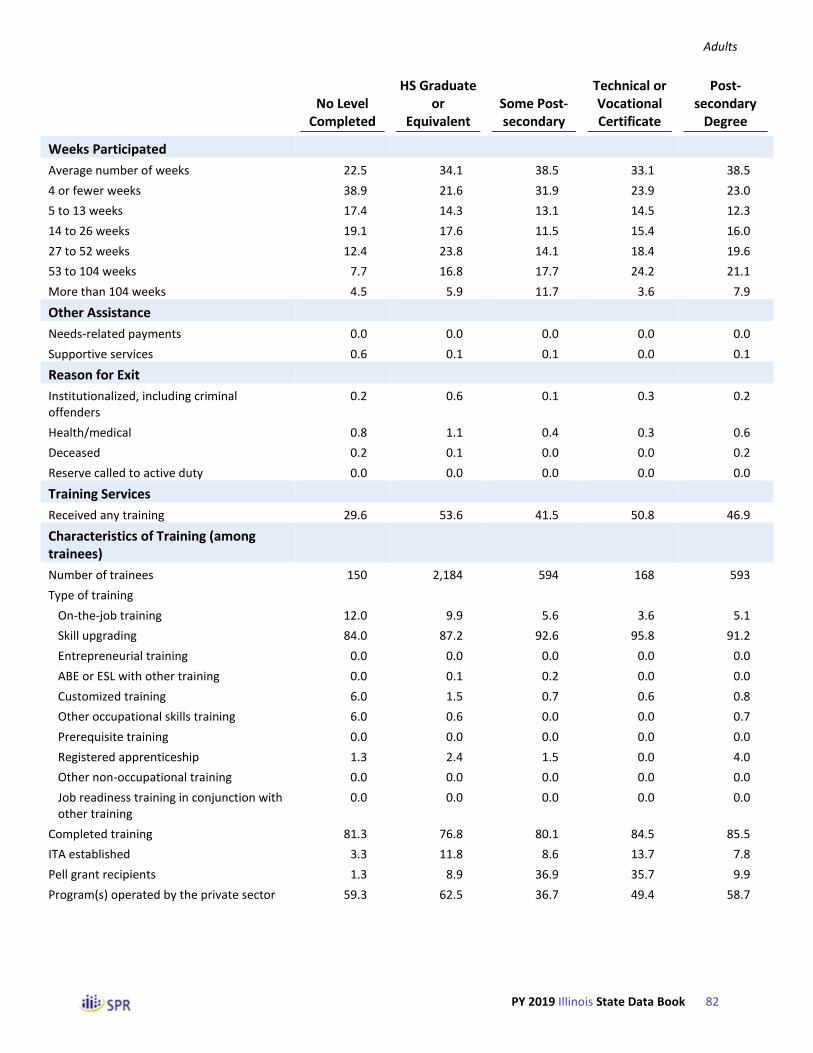
Adults
PY 2019 Illinois State Data Book 82
No Level Completed
HS Graduate or
Equivalent Some Post-secondary
Technical or Vocational Certificate
Post-secondary
Degree
Weeks Participated
Average number of weeks 22.5 34.1 38.5 33.1 38.5
4 or fewer weeks 38.9 21.6 31.9 23.9 23.0
5 to 13 weeks 17.4 14.3 13.1 14.5 12.3
14 to 26 weeks 19.1 17.6 11.5 15.4 16.0
27 to 52 weeks 12.4 23.8 14.1 18.4 19.6
53 to 104 weeks 7.7 16.8 17.7 24.2 21.1
More than 104 weeks 4.5 5.9 11.7 3.6 7.9
Other Assistance
Needs-related payments 0.0 0.0 0.0 0.0 0.0
Supportive services 0.6 0.1 0.1 0.0 0.1
Reason for Exit
Institutionalized, including criminal offenders
0.2 0.6 0.1 0.3 0.2
Health/medical 0.8 1.1 0.4 0.3 0.6
Deceased 0.2 0.1 0.0 0.0 0.2
Reserve called to active duty 0.0 0.0 0.0 0.0 0.0
Training Services
Received any training 29.6 53.6 41.5 50.8 46.9
Characteristics of Training (among trainees)
Number of trainees 150 2,184 594 168 593
Type of training
On-the-job training 12.0 9.9 5.6 3.6 5.1
Skill upgrading 84.0 87.2 92.6 95.8 91.2
Entrepreneurial training 0.0 0.0 0.0 0.0 0.0
ABE or ESL with other training 0.0 0.1 0.2 0.0 0.0
Customized training 6.0 1.5 0.7 0.6 0.8
Other occupational skills training 6.0 0.6 0.0 0.0 0.7
Prerequisite training 0.0 0.0 0.0 0.0 0.0
Registered apprenticeship 1.3 2.4 1.5 0.0 4.0
Other non-occupational training 0.0 0.0 0.0 0.0 0.0
Job readiness training in conjunction with other training
0.0 0.0 0.0 0.0 0.0
Completed training 81.3 76.8 80.1 84.5 85.5
ITA established 3.3 11.8 8.6 13.7 7.8
Pell grant recipients 1.3 8.9 36.9 35.7 9.9
Program(s) operated by the private sector 59.3 62.5 36.7 49.4 58.7

Adults
PY 2019 Illinois State Data Book 83
No Level
Completed
HS Graduate or
Equivalent Some Post-secondary
Technical or Vocational Certificate
Post-secondary
Degree
Characteristics of Training (among trainees) (cont’d)
Weeks of training
Average number of weeks 27.4 30.2 53.4 33.8 37.9
4 or fewer weeks 6.0 7.0 2.0 6.5 4.0
5 to 13 weeks 37.3 29.7 16.5 14.9 20.4
14 to 26 weeks 32.0 26.1 17.8 23.8 25.3
27 to 52 weeks 11.3 20.3 22.4 38.1 24.8
53 to 104 weeks 9.3 13.2 30.1 16.1 20.7
More than 104 weeks 4.0 3.8 11.1 0.6 4.7
Occupation of training
Management 2.0 2.2 3.4 1.2 8.9
Business and financial 0.0 0.5 1.9 0.0 3.0
Computer and mathematical 1.3 3.3 2.9 4.2 14.8
Architecture and engineering 0.0 0.4 0.8 0.0 0.7
Education, training, and library 0.0 0.4 1.2 0.0 0.3
Healthcare practitioners and technical 4.0 20.8 53.5 50.6 28.7
Healthcare support 11.3 14.6 8.3 10.1 7.9
Food preparation and serving related 2.7 1.4 0.3 0.0 0.3
Personal care and service 0.0 0.2 0.0 0.0 0.0
Sales and related 0.0 0.0 0.2 0.0 0.0
Office and administrative support 2.7 2.6 1.7 1.8 3.0
Construction and extraction 0.0 2.0 1.2 0.0 3.0
Installation, maintenance, and repair 8.0 4.5 2.0 1.8 2.0
Production 24.7 13.6 6.6 13.1 5.9
Transportation and material moving 43.3 32.6 13.8 17.3 18.7
Other occupations 0.0 1.2 2.9 0.0 3.0

Adults
PY 2019 Illinois State Data Book 84
Table II-21 Services Received by Adults Who Exited from April 2019 to March 2020 in IL,
by Selected Other Characteristics
(Derived from PY 2019 Q4 PIRL)
School Status Single
Attending Not Attending Ex-Offenders Homeless Parents
Number of Exiters 195 7,416 979 189 1,157
Coenrollment
Any coenrollment 19.0 39.1 18.2 42.3 21.6
WIOA Dislocated Worker 1.0 3.7 1.7 1.6 2.0
WIOA Youth 0.5 0.4 0.0 0.5 0.4
Wagner-Peyser 17.9 37.2 15.5 39.7 19.5
Vocational Rehabilitation 0.0 0.1 0.3 0.0 0.1
Adult Education 0.0 0.4 0.9 0.5 0.5
WIOA National Farmworker Jobs 0.0 0.0 0.0 0.0 0.0
WIOA Indian and Native American 0.0 0.0 0.0 0.0 0.0
Veterans’ programs 2.6 2.2 2.9 26.5 1.0
Vocational Education 0.0 0.2 0.2 0.0 0.5
YouthBuild 0.0 0.0 0.0 0.0 0.0
Senior Community Services 0.0 0.0 0.0 0.0 0.0
SNAP Employment and Training 1.0 0.2 0.2 0.0 0.1
Basic Career Services
Self-service or informational service 65.6 37.4 33.0 40.7 51.0
Any staff-assisted basic career service 100.0 100.0 100.0 100.0 100.0
Workforce information services 4.6 8.4 3.9 11.1 4.5
Career guidance 37.9 54.4 61.1 66.7 51.8
Staff-assisted job search 13.3 21.7 18.8 23.3 14.7
Referred to employment 8.7 33.5 18.4 28.0 15.5
Referred to Federal training 83.6 64.8 86.5 63.5 83.2
Assistance with UI 1.0 7.5 2.8 2.6 3.4
Other basic services 1.0 0.7 1.2 2.6 0.6
Individualized Career Services
Any individualized career service 89.2 74.9 91.8 91.0 88.5
IEP created 3.1 3.2 1.3 7.9 1.0
Internships or work experience 2.6 8.4 18.0 18.0 6.6
Employment, excluding transitional jobs 2.6 8.4 18.0 18.0 6.6
Transitional jobs 0.0 0.0 0.3 0.5 0.1
Other work experience 0.0 0.0 0.0 0.0 0.0
Financial literacy services 0.0 0.9 3.4 1.1 0.1
English as a second language services 0.0 0.2 0.0 0.0 0.3
Pre-vocational services 0.0 0.4 0.6 0.5 0.5
Other individualized services 83.6 62.6 71.8 64.6 80.1

Adults
PY 2019 Illinois State Data Book 85
School Status Single
Attending Not Attending Ex-Offenders Homeless Parents
Weeks Participated
Average number of weeks 59.8 34.2 33.6 28.9 54.1
4 or fewer weeks 9.2 25.4 13.3 24.3 10.9
5 to 13 weeks 4.1 14.3 15.6 17.5 6.8
14 to 26 weeks 7.7 16.4 20.7 19.6 14.3
27 to 52 weeks 29.2 20.1 30.7 22.2 24.0
53 to 104 weeks 35.4 16.9 15.7 13.2 29.6
More than 104 weeks 14.4 7.0 3.9 3.2 14.3
Other Assistance
Needs-related payments 0.0 0.0 0.1 0.0 0.0
Supportive services 0.0 0.2 0.0 0.0 0.3
Reason for Exit
Institutionalized, including criminal offenders
0.0 0.4 2.5 2.1 0.2
Health/medical 0.5 0.8 0.5 0.5 0.5
Deceased 0.0 0.1 0.1 0.5 0.0
Reserve called to active duty 0.0 0.0 0.0 0.0 0.0
Training Services
Received any training 79.0 47.7 60.5 34.9 73.1
Characteristics of Training (among trainees)
Number of trainees 154 3,535 592 66 846
Type of training
On-the-job training 0.0 8.6 7.8 13.6 3.7
Skill upgrading 100.0 88.5 87.8 80.3 94.9
Entrepreneurial training 0.0 0.0 0.0 0.0 0.0
ABE or ESL with other training 0.0 0.1 0.0 0.0 0.0
Customized training 0.0 1.4 0.7 0.0 0.7
Other occupational skills training 0.0 0.7 0.3 1.5 0.9
Prerequisite training 0.0 0.0 0.0 0.0 0.0
Registered apprenticeship 0.0 2.5 4.1 3.0 1.2
Other non-occupational training 0.0 0.0 0.0 0.0 0.0
Job readiness training in conjunction with other training
0.0 0.0 0.0 0.0 0.0
Completed training 74.7 79.5 76.2 65.2 73.5
ITA established 11.0 10.4 9.8 10.6 15.0
Pell grant recipients 64.3 12.3 8.3 7.6 36.8
Program(s) operated by the private sector 33.8 58.0 63.2 57.6 35.3

Adults
PY 2019 Illinois State Data Book 86
School Status Single
Attending Not Attending Ex-Offenders Homeless Parents
Characteristics of Training (among trainees) (cont’d)
Weeks of training
Average number of weeks 58.1 34.2 21.9 30.1 48.6
4 or fewer weeks 0.6 5.9 15.4 9.1 3.5
5 to 13 weeks 4.5 26.6 37.0 39.4 15.7
14 to 26 weeks 19.5 25.0 23.5 13.6 16.0
27 to 52 weeks 28.6 21.5 15.4 18.2 30.5
53 to 104 weeks 37.0 16.3 5.9 15.2 26.8
More than 104 weeks 9.7 4.8 2.9 4.5 7.4
Occupation of training
Management 0.6 3.5 1.5 6.1 2.5
Business and financial 1.9 1.0 0.7 1.5 1.1
Computer and mathematical 0.0 5.3 3.2 1.5 2.4
Architecture and engineering 0.0 0.5 0.5 0.0 0.2
Education, training, and library 0.6 0.5 0.3 0.0 0.8
Healthcare practitioners and technical 81.2 25.7 5.4 13.6 53.3
Healthcare support 4.5 12.5 4.9 6.1 20.1
Food preparation and serving related 0.0 1.1 0.7 1.5 0.4
Personal care and service 0.0 0.1 0.0 0.0 0.5
Sales and related 0.0 0.1 0.2 0.0 0.1
Office and administrative support 0.6 2.6 3.7 7.6 1.9
Construction and extraction 0.0 2.0 5.1 3.0 0.2
Installation, maintenance, and repair 2.6 3.8 3.7 6.1 0.8
Production 3.9 12.0 23.0 22.7 2.5
Transportation and material moving 1.9 28.2 46.1 30.3 11.2
Other occupations 1.9 1.6 1.2 3.0 2.2

Adults
PY 2019 Illinois State Data Book 87
Table II-23 Services Received by Adults Who Exited from April 2019 to March 2020, by State
(Derived from PY 2019 Q4 PIRL)
Received Career Services
Number of Exiters
Basic
Individualized
Only Career Services
Received Training
Nation 295,282 99.8 73.4 70.0 29.9
Alabama 6,078 100.0 100.0 3.8 96.2
Alaska 270 100.0 100.0 14.8 85.2
Arizona 7,561 100.0 63.3 63.0 37.0
Arkansas 1,067 99.8 97.6 31.8 68.2
California 39,817 100.0 99.0 72.3 27.7
Colorado 1,864 100.0 99.7 37.2 62.8
Connecticut 1,235 100.0 100.0 58.0 42.0
Delaware 385 100.0 86.0 27.3 72.7
District of Columbia 1,053 100.0 99.0 64.6 35.4
Florida 8,255 100.0 100.0 16.0 84.0
Georgia 4,899 100.0 84.2 23.7 76.3
Guam 45 100.0 100.0 57.8 42.2
Hawaii 113 100.0 100.0 48.7 51.3
Idaho 645 99.8 97.4 60.6 39.4
Illinois 7,611 100.0 75.3 51.5 48.5
Indiana 6,086 100.0 94.6 74.6 25.4
Iowa 3,266 100.0 98.3 87.4 12.6
Kansas 2,141 100.0 57.1 67.4 32.6
Kentucky 3,395 100.0 98.7 68.6 31.4
Louisiana 4,716 100.0 79.8 62.6 37.4
Maine 364 98.9 96.7 33.8 66.2
Maryland 1,784 100.0 100.0 43.3 56.7
Massachusetts 940 100.0 99.9 37.3 62.7
Michigan 4,062 99.1 99.1 34.4 65.0
Minnesota 893 99.7 100.0 44.8 55.2
Mississippi 4,700 100.0 92.2 48.2 51.8
Missouri 2,179 100.0 97.7 28.1 71.9
Montana 130 100.0 99.2 53.1 46.9
Nebraska 453 100.0 99.8 41.1 58.9
Nevada 1,931 100.0 100.0 42.1 57.9
New Hampshire 153 100.0 97.4 36.6 63.4
New Jersey 2,253 94.4 57.5 42.4 57.4
New Mexico 1,788 100.0 99.9 8.1 91.9
New York 62,065 99.9 57.9 92.7 7.2
North Carolina 5,597 100.0 100.0 22.3 77.7
North Dakota 265 100.0 99.6 29.8 70.2

Adults
PY 2019 Illinois State Data Book 88
Received Career Services
Number of Exiters
Basic
Individualized
Only Career Services
Received Training
Northern Mariana Islands 82 100.0 98.8 98.8 1.2
Ohio 7,139 100.0 59.3 64.8 35.2
Oklahoma 2,649 100.0 92.1 46.4 53.6
Oregon 33,677 99.7 9.6 94.7 5.0
Palau 24 100.0 91.7 75.0 25.0
Pennsylvania 5,755 100.0 98.0 63.7 36.3
Puerto Rico - - - - -
Rhode Island 210 100.0 100.0 33.8 66.2
South Carolina 3,614 100.0 98.1 48.1 51.9
South Dakota 2,126 100.0 99.9 91.7 8.3
Tennessee 4,341 100.0 100.0 22.5 77.5
Texas 16,515 100.0 99.0 73.7 26.3
Utah 801 100.0 99.6 40.1 59.9
Vermont 192 100.0 98.4 42.7 57.3
Virgin Islands 118 100.0 97.5 23.7 76.3
Virginia 2,258 100.0 100.0 24.7 75.3
Washington 22,463 100.0 63.4 95.2 4.8
West Virginia 1,563 91.4 63.9 41.2 50.3
Wisconsin 1,527 100.0 96.9 51.9 48.1
Wyoming 169 100.0 100.0 35.5 64.5

Adults
PY 2019 Illinois State Data Book 89
Table II-24 Training Services Received by Adult Trainees Who Exited from April 2019 to March 2020, by State
(Derived from PY 2019 Q4 PIRL)
Number of
Trainees
ABE/GED or Prerequisite
Training Work-based
Training
Other Occupational
Training Other
Training
Nation 88,326 1.4 17.6 81.7 1.1
Alabama 5,849 0.0 32.4 68.3 3.7
Alaska 230 0.0 46.5 54.3 0.0
Arizona 2,797 2.7 24.5 74.2 0.3
Arkansas 728 1.9 1.5 98.6 0.0
California 11,043 0.2 16.3 84.0 0.6
Colorado 1,171 0.3 14.3 90.7 0.0
Connecticut 519 0.0 9.2 91.7 19.1
Delaware 280 0.0 0.0 100.0 0.0
District of Columbia 373 0.0 5.4 94.9 0.0
Florida 6,935 0.2 29.0 70.8 0.7
Georgia 3,736 0.2 6.0 94.1 0.0
Guam 19 5.3 0.0 94.7 0.0
Hawaii 58 0.0 0.0 100.0 0.0
Idaho 254 2.4 9.4 87.8 3.5
Illinois 3,689 2.5 11.1 89.3 0.0
Indiana 1,546 24.2 5.9 73.0 0.0
Iowa 410 9.0 2.2 92.9 1.5
Kansas 697 0.7 13.6 84.6 3.6
Kentucky 1,066 0.0 4.0 96.0 0.0
Louisiana 1,762 0.2 14.6 85.5 0.0
Maine 241 0.0 15.4 93.8 0.0
Maryland 1,012 3.6 5.0 91.7 0.8
Massachusetts 589 3.4 0.8 96.6 0.2
Michigan 2,639 0.4 12.1 87.6 0.5
Minnesota 493 0.0 1.0 99.2 0.0
Mississippi 2,435 0.0 64.7 35.6 0.0
Missouri 1,567 1.1 20.8 77.5 4.7
Montana 61 1.6 13.1 86.9 0.0
Nebraska 267 0.0 11.2 89.5 0.0
Nevada 1,119 0.1 9.1 96.3 0.4
New Hampshire 97 0.0 13.4 88.7 0.0
New Jersey 1,294 3.8 1.5 94.7 0.9
New Mexico 1,643 0.0 42.2 60.1 0.9
New York 4,487 2.0 16.1 81.4 1.2
North Carolina 4,351 0.3 6.8 93.8 0.0
North Dakota 186 0.0 3.8 97.3 0.0

Adults
PY 2019 Illinois State Data Book 90
Number of
Trainees
ABE/GED or Prerequisite
Training Work-based
Training
Other Occupational
Training Other
Training
Northern Mariana Islands 1 0.0 0.0 100.0 0.0
Ohio 2,512 0.0 26.1 73.8 0.0
Oklahoma 1,421 0.1 7.5 93.0 0.1
Oregon 1,674 3.0 22.3 77.6 0.1
Palau 6 0.0 100.0 0.0 0.0
Pennsylvania 2,088 6.3 22.5 73.0 0.0
Puerto Rico - - - - -
Rhode Island 139 0.0 25.9 74.8 0.0
South Carolina 1,874 0.5 17.4 85.2 0.0
South Dakota 177 2.3 24.9 49.2 26.0
Tennessee 3,365 0.0 16.0 84.6 0.0
Texas 4,343 3.2 8.4 88.6 2.2
Utah 480 0.8 4.8 75.6 20.2
Vermont 110 0.0 6.4 94.5 0.0
Virgin Islands 90 0.0 2.2 98.9 0.0
Virginia 1,701 1.2 4.2 95.1 1.2
Washington 1,073 0.2 16.3 84.4 0.7
West Virginia 786 0.0 24.0 76.0 0.0
Wisconsin 734 0.8 10.1 89.6 0.1
Wyoming 109 2.8 1.8 98.2 0.0
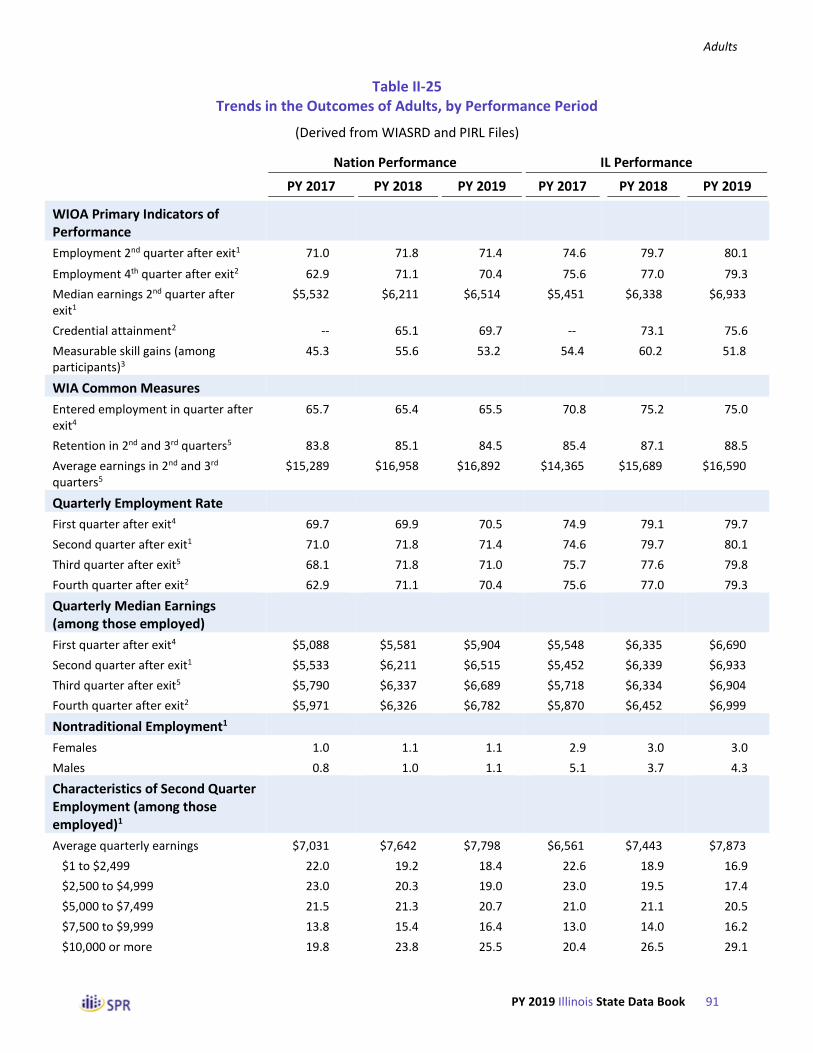
Adults
PY 2019 Illinois State Data Book 91
Table II-25 Trends in the Outcomes of Adults, by Performance Period
(Derived from WIASRD and PIRL Files)
Nation Performance IL Performance
PY 2017 PY 2018 PY 2019 PY 2017 PY 2018 PY 2019
WIOA Primary Indicators of Performance
Employment 2nd quarter after exit1 71.0 71.8 71.4 74.6 79.7 80.1
Employment 4th quarter after exit2 62.9 71.1 70.4 75.6 77.0 79.3
Median earnings 2nd quarter after exit1
$5,532 $6,211 $6,514 $5,451 $6,338 $6,933
Credential attainment2 -- 65.1 69.7 -- 73.1 75.6
Measurable skill gains (among participants)3
45.3 55.6 53.2 54.4 60.2 51.8
WIA Common Measures
Entered employment in quarter after exit4
65.7 65.4 65.5 70.8 75.2 75.0
Retention in 2nd and 3rd quarters5 83.8 85.1 84.5 85.4 87.1 88.5
Average earnings in 2nd and 3rd quarters5
$15,289 $16,958 $16,892 $14,365 $15,689 $16,590
Quarterly Employment Rate
First quarter after exit4 69.7 69.9 70.5 74.9 79.1 79.7
Second quarter after exit1 71.0 71.8 71.4 74.6 79.7 80.1
Third quarter after exit5 68.1 71.8 71.0 75.7 77.6 79.8
Fourth quarter after exit2 62.9 71.1 70.4 75.6 77.0 79.3
Quarterly Median Earnings (among those employed)
First quarter after exit4 $5,088 $5,581 $5,904 $5,548 $6,335 $6,690
Second quarter after exit1 $5,533 $6,211 $6,515 $5,452 $6,339 $6,933
Third quarter after exit5 $5,790 $6,337 $6,689 $5,718 $6,334 $6,904
Fourth quarter after exit2 $5,971 $6,326 $6,782 $5,870 $6,452 $6,999
Nontraditional Employment1
Females 1.0 1.1 1.1 2.9 3.0 3.0
Males 0.8 1.0 1.1 5.1 3.7 4.3
Characteristics of Second Quarter Employment (among those employed)1
Average quarterly earnings $7,031 $7,642 $7,798 $6,561 $7,443 $7,873
$1 to $2,499 22.0 19.2 18.4 22.6 18.9 16.9
$2,500 to $4,999 23.0 20.3 19.0 23.0 19.5 17.4
$5,000 to $7,499 21.5 21.3 20.7 21.0 21.1 20.5
$7,500 to $9,999 13.8 15.4 16.4 13.0 14.0 16.2
$10,000 or more 19.8 23.8 25.5 20.4 26.5 29.1

Adults
PY 2019 Illinois State Data Book 92
Nation Performance IL Performance
PY 2017 PY 2018 PY 2019 PY 2017 PY 2018 PY 2019
Characteristics of Second Quarter Employment (cont’d)1
Occupation of employment
Management 3.4 2.9 2.6 1.0 2.3 2.0
Business and financial 2.1 1.7 1.5 0.9 0.7 1.0
Computer and mathematical 2.2 2.1 1.9 2.3 4.0 2.4
Architecture and engineering 1.3 1.4 1.2 0.4 0.3 0.4
Education, training, and library 2.1 1.9 1.8 0.9 0.9 1.3
Healthcare practitioners and technical
12.8 13.4 13.7 23.8 19.9 21.4
Healthcare support 10.1 10.4 11.2 14.1 15.0 15.9
Food preparation and serving 4.0 3.8 3.9 4.8 3.2 2.2
Personal care and service 2.5 2.6 2.2 1.2 1.6 1.2
Sales and related 6.0 5.6 5.1 2.6 4.3 4.1
Office and administrative 14.6 14.4 13.9 12.7 10.0 8.1
Construction and extraction 3.9 3.6 3.8 0.6 3.9 4.0
Installation, maintenance, and repair
3.5 3.7 4.1 2.0 2.8 3.8
Production 11.9 12.2 11.4 6.1 6.7 6.1
Transportation and material moving 11.3 12.5 14.6 20.9 20.8 21.1
Other occupations 8.3 8.0 7.1 5.8 3.8 5.0
Industry of employment
Construction 5.9 5.9 6.1 2.7 3.3 3.5
Manufacturing 10.9 10.4 9.9 8.9 9.3 8.8
Wholesale and retail trade 3.3 3.2 3.3 2.9 2.6 2.6
Transportation and warehousing 5.4 5.5 6.3 10.4 11.0 10.9
Information 1.0 1.1 1.2 0.8 0.7 0.6
Administrative, support, waste management and remediation services
19.4 17.6 16.5 20.8 19.3 14.8
Educational services 3.2 3.5 3.9 3.2 2.6 3.4
Health care and social assistance 15.9 18.2 19.1 24.7 27.0 29.8
Arts, entertainment, and recreation 1.3 1.4 1.4 1.2 1.0 1.3
Accommodation and food services 10.2 9.3 8.9 7.6 7.3 7.8
Other services, inc public administration
2.4 2.5 2.5 1.8 1.8 2.3
Other industry 21.1 21.3 21.0 15.0 14.1 14.2
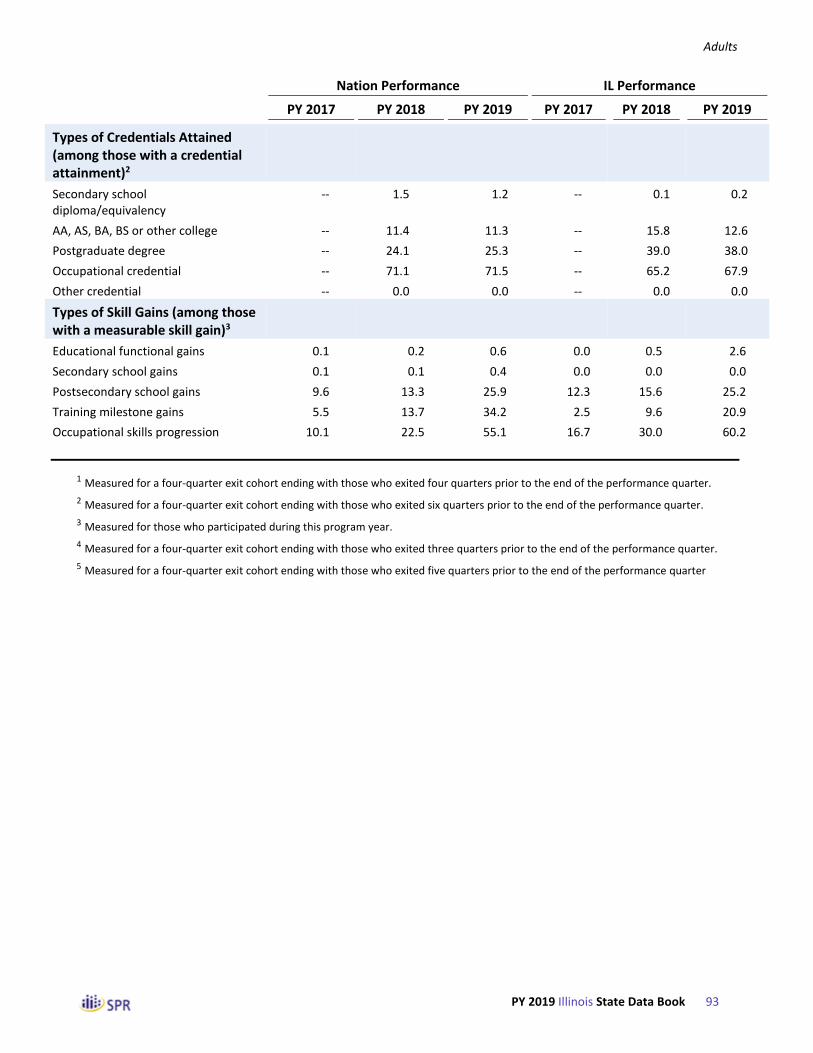
Adults
PY 2019 Illinois State Data Book 93
Nation Performance IL Performance
PY 2017 PY 2018 PY 2019 PY 2017 PY 2018 PY 2019
Types of Credentials Attained (among those with a credential attainment)2
Secondary school diploma/equivalency
-- 1.5 1.2 -- 0.1 0.2
AA, AS, BA, BS or other college -- 11.4 11.3 -- 15.8 12.6
Postgraduate degree -- 24.1 25.3 -- 39.0 38.0
Occupational credential -- 71.1 71.5 -- 65.2 67.9
Other credential -- 0.0 0.0 -- 0.0 0.0
Types of Skill Gains (among those with a measurable skill gain)3
Educational functional gains 0.1 0.2 0.6 0.0 0.5 2.6
Secondary school gains 0.1 0.1 0.4 0.0 0.0 0.0
Postsecondary school gains 9.6 13.3 25.9 12.3 15.6 25.2
Training milestone gains 5.5 13.7 34.2 2.5 9.6 20.9
Occupational skills progression 10.1 22.5 55.1 16.7 30.0 60.2
1 Measured for a four-quarter exit cohort ending with those who exited four quarters prior to the end of the performance quarter.
2 Measured for a four-quarter exit cohort ending with those who exited six quarters prior to the end of the performance quarter.
3 Measured for those who participated during this program year.
4 Measured for a four-quarter exit cohort ending with those who exited three quarters prior to the end of the performance quarter.
5 Measured for a four-quarter exit cohort ending with those who exited five quarters prior to the end of the performance quarter

Adults
PY 2019 Illinois State Data Book 94
Table II-26 Trends in the Number of Adults Who Achieved Various Outcomes, by Performance Period
(Derived from Prior PIRL and WIASRD Files)
Nation Performance IL Performance
PY 2017 PY 2018 PY 2019 PY 2017 PY 2018 PY 2019
WIOA Primary Indicators of Performance
Employment 2nd quarter after exit1 545,979 311,412 281,327 5,493 4,645 4,686
Employment 4th quarter after exit2 545,893 399,766 297,525 5,028 4,593 4,776
Credential attainment2 -- 49,210 51,326 -- 1,869 2,467
Measurable skill gains (among participants)3
23,622 74,567 66,871 1,260 3,380 2,766
WIA Common Measures
Entered employment in quarter after exit4
338,322 208,777 167,439 3,507 3,269 3,291
Retention in 2nd and 3rd quarters5 458,279 285,650 230,855 4,597 3,935 4,191
Quarterly Employment Rate
First quarter after exit4 461,225 298,053 252,512 4,783 4,740 5,061
Second quarter after exit1 545,979 311,412 281,327 5,493 4,645 4,686
Third quarter after exit5 561,003 354,658 291,369 5,425 4,518 4,737
Fourth quarter after exit2 545,893 399,766 297,525 5,028 4,593 4,776
Nontraditional Employment1
Females 1,822 975 904 55 61 70
Males 1,456 685 652 63 56 73
Characteristics of Second Quarter Employment (among those employed)1
Quarterly earnings
$1 to $2,499 120,015 59,761 52,019 1,247 887 799
$2,500 to $4,999 125,351 63,347 53,440 1,272 914 825
$5,000 to $7,499 117,550 66,342 58,497 1,159 990 969
$7,500 to $9,999 75,279 48,206 46,109 715 659 767
$10,000 or more 107,923 74,383 71,937 1,126 1,246 1,376

Adults
PY 2019 Illinois State Data Book 95
Nation Performance IL Performance
PY 2017 PY 2018 PY 2019 PY 2017 PY 2018 PY 2019
Characteristics of Second Quarter Employment (cont’d)1
Occupation of employment
Management 1,376 1,220 1,082 7 24 25
Business and financial 844 713 615 6 7 13
Computer and mathematical 892 879 771 16 41 30
Architecture and engineering 534 602 501 3 3 5
Education, training, and library 846 788 759 6 9 16
Healthcare practitioners and technical
5,152 5,635 5,669 165 206 268
Healthcare support 4,081 4,369 4,650 98 155 199
Food preparation and serving 1,600 1,596 1,605 33 33 28
Personal care and service 992 1,083 898 8 17 15
Sales and related 2,396 2,373 2,111 18 45 51
Office and administrative 5,872 6,078 5,739 88 103 102
Construction and extraction 1,554 1,532 1,591 4 40 50
Installation, maintenance, and repair 1,422 1,547 1,715 14 29 48
Production 4,785 5,155 4,732 42 69 77
Transportation and material moving 4,555 5,271 6,044 145 215 264
Other occupations 3,319 3,360 2,949 40 39 63
Industry of employment
Construction 29,395 17,348 16,005 147 151 158
Manufacturing 54,552 30,372 26,180 477 418 398
Wholesale and retail trade 16,734 9,330 8,591 158 117 118
Transportation and warehousing 26,997 15,962 16,623 555 495 494
Information 4,943 3,289 3,134 42 31 25
Administrative, support, waste management and remediation services
97,270 51,319 43,467 1,117 869 669
Educational services 15,872 10,329 10,308 170 118 153
Health care and social assistance 79,649 52,925 50,291 1,323 1,220 1,346
Arts, entertainment, and recreation 6,545 4,085 3,655 62 47 60
Accommodation and food services 51,335 27,142 23,501 407 330 353
Other services, inc public administration
12,030 7,337 6,521 99 82 103
Other industry 105,848 62,152 55,324 804 636 641

Adults
PY 2019 Illinois State Data Book 96
Nation Performance IL Performance
PY 2017 PY 2018 PY 2019 PY 2017 PY 2018 PY 2019
Types of Credentials Attained (among those with a credential attainment)2
Secondary school diploma/equivalency -- 736 593 -- 1 5
AA, AS, BA, BS or other college -- 5,626 5,801 -- 296 310
Postgraduate degree -- 11,838 12,960 -- 728 937
Occupational credential -- 34,995 36,722 -- 1,218 1,676
Other credential -- 0 0 -- 0 0
Types of Skill Gains (among those with a measurable skill gain)3
Educational functional gains 23 153 419 0 18 72
Secondary school gains 24 103 298 0 0 0
Postsecondary school gains 2,270 9,908 17,304 155 528 698
Training milestones gains 1,301 10,233 22,857 31 325 577
Occupational skills progression 2,377 16,753 36,823 210 1,015 1,664
1 Measured for a four-quarter exit cohort ending with those who exited four quarters prior to the end of the performance quarter.
2 Measured for a four-quarter exit cohort ending with those who exited six quarters prior to the end of the performance quarter.
3 Measured for those who participated during this program year.
4 Measured for a four-quarter exit cohort ending with those who exited three quarters prior to the end of the performance quarter.
5 Measured for a four-quarter exit cohort ending with those who exited five quarters prior to the end of the performance quarter.

Adults
PY 2019 Illinois State Data Book 97
Table II-27 Outcomes of Adults in IL, by Age at Program Entry
(Derived from PY 2019 Q4 PIRL)
18 to 21 22 to 29 30 to 44 45 to 54 55 and Older
WIOA Primary Indicators of Performance
Employment 2nd quarter after exit1 87.9 84.9 80.2 74.2 70.2
Employment 4th quarter after exit2 87.0 84.8 80.3 74.6 66.4
Median earnings 2nd quarter after exit1 $6,081 $6,917 $7,495 $6,926 $5,529
Credential attainment2 75.3 75.1 76.6 75.5 71.8
Measurable skill gains (among participants)3 55.7 55.0 50.3 47.6 44.9
WIA Common Measures
Entered employment in quarter after exit4 83.6 80.5 75.3 72.4 65.4
Retention in 2nd and 3rd quarters5 89.5 90.6 87.7 87.7 86.4
Average earnings in 2nd and 3rd quarters5 $14,402 $15,877 $17,881 $16,638 $15,056
Quarterly Employment Rate
First quarter after exit4 86.6 86.2 79.4 74.8 67.4
Second quarter after exit1 87.9 84.9 80.2 74.2 70.2
Third quarter after exit5 86.7 85.4 79.1 75.2 71.2
Fourth quarter after exit2 87.0 84.8 80.3 74.6 66.4
Quarterly Median Earnings (among those employed)
First quarter after exit4 $5,905 $6,750 $7,105 $6,498 $5,646
Second quarter after exit1 $6,082 $6,917 $7,495 $6,926 $5,529
Third quarter after exit5 $6,258 $6,816 $7,367 $6,944 $5,724
Fourth quarter after exit2 $6,513 $6,929 $7,439 $6,952 $6,067
Nontraditional Employment1
Females 3.3 2.8 2.7 4.2 3.2
Males 3.4 5.9 3.9 4.2 1.8
Characteristics of Second Quarter Employment (among those employed)1
Average quarterly earnings $6,851 $7,723 $8,499 $7,751 $6,746
$1 to $2,499 19.9 16.5 14.6 17.4 24.6
$2,500 to $4,999 22.4 17.6 15.4 17.8 20.5
$5,000 to $7,499 19.6 21.0 20.4 19.8 20.7
$7,500 to $9,999 14.4 15.7 16.6 18.8 13.4
$10,000 or more 23.8 29.2 33.0 26.1 20.7

Adults
PY 2019 Illinois State Data Book 98
18 to 21 22 to 29 30 to 44 45 to 54 55 and Older
Characteristics of Second Quarter Employment (cont’d)1
Occupation of employment
Management 2.0 1.7 1.8 3.2 3.0
Business and financial 2.0 0.2 1.0 1.9 3.0
Computer and mathematical 3.1 2.1 2.2 2.5 4.5
Architecture and engineering 2.0 0.0 0.4 0.6 0.0
Education, training, and library 0.0 1.7 0.8 1.9 3.0
Healthcare practitioners and technical 26.5 28.8 20.5 7.6 6.0
Healthcare support 20.4 16.5 15.8 13.9 10.4
Food preparation and serving 3.1 3.1 1.6 1.9 0.0
Personal care and service 3.1 0.9 1.2 0.6 1.5
Sales and related 5.1 3.1 3.9 4.4 9.0
Office and administrative 5.1 7.1 8.1 11.4 11.9
Construction and extraction 6.1 5.4 3.6 1.9 0.0
Installation, maintenance, and repair 6.1 4.0 3.6 2.5 4.5
Production 6.1 6.1 6.1 5.1 9.0
Transportation and material moving 8.2 15.6 24.9 31.6 20.9
Other occupations 1.0 3.5 4.7 8.9 13.4
Industry of employment
Construction 3.5 4.0 3.4 2.6 3.4
Manufacturing 11.4 6.1 8.3 11.5 13.5
Wholesale and retail trade 2.9 2.1 3.0 2.5 2.6
Transportation and warehousing 2.9 9.9 12.3 14.0 9.9
Information 0.3 0.6 0.6 0.6 0.5
Administrative, support, waste management and remediation services
10.9 12.2 14.9 17.8 21.9
Educational services 1.5 2.1 3.4 4.5 7.6
Health care and social assistance 33.4 37.2 30.8 18.7 15.1
Arts, entertainment, and recreation 0.9 1.5 1.2 1.8 1.0
Accommodation and food services 13.5 9.5 6.5 6.1 5.7
Other services, inc public administration 1.5 2.3 2.4 3.1 1.3
Other industry 17.3 12.5 13.2 16.7 17.4

Adults
PY 2019 Illinois State Data Book 99
18 to 21 22 to 29 30 to 44 45 to 54 55 and Older
Types of Credentials Attained (among those with a credential attainment)2
Secondary school diploma/equivalency 0.5 0.3 0.0 0.0 0.0
AA, AS, BA, BS or other college 23.5 16.9 10.8 3.9 6.9
Postgraduate degree 34.4 43.1 39.2 32.7 16.9
Occupational credential 62.3 61.3 69.1 77.0 83.8
Other credential 0.0 0.0 0.0 0.0 0.0
Types of Skill Gains (among those with a measurable skill gain)3
Educational functional gains 3.3 1.5 3.3 3.1 2.8
Secondary school gains 0.0 0.0 0.0 0.0 0.0
Postsecondary school gains 36.3 31.6 22.3 10.6 7.5
Training milestone gains 25.2 17.4 20.1 28.7 28.3
Occupational skills progression 45.2 59.1 63.0 64.5 67.0
1 Based on those who exited from July 2018 to June 2019.
2 Based on those who exited from January 2018 to December 2018.
3 Based on those who participated between July 2019 and June 2020.
4 Based on those who exited from October 2018 to September 2019.
5 Based on those who exited from April 2018 to March 2019.

Adults
PY 2019 Illinois State Data Book 100
Table II-28 Outcomes of Adults in IL, by Ethnicity and Race
(Derived from PY 2019 Q4 PIRL)
Ethnicity Race
Hispanic Not Hispanic White Only Black Only Other
WIOA Primary Indicators of Performance
Employment 2nd quarter after exit1 82.4 79.9 80.6 80.2 79.2
Employment 4th quarter after exit2 81.8 79.0 79.7 79.7 78.1
Median earnings 2nd quarter after exit1 $7,542 $6,828 $7,710 $6,367 $7,467
Credential attainment2 72.4 76.1 76.4 75.1 81.1
Measurable skill gains (among participants)3 51.0 52.0 57.9 46.5 54.1
WIA Common Measures
Entered employment in quarter after exit4 78.4 74.6 75.7 75.6 76.7
Retention in 2nd and 3rd quarters5 89.8 88.3 89.7 87.7 90.4
Average earnings in 2nd and 3rd quarters5 $17,556 $16,431 $17,733 $15,420 $17,406
Quarterly Employment Rate
First quarter after exit4 81.9 79.4 81.1 79.8 79.3
Second quarter after exit1 82.4 79.9 80.6 80.2 79.2
Third quarter after exit5 81.3 79.7 81.0 80.0 77.9
Fourth quarter after exit2 81.8 79.0 79.7 79.7 78.1
Quarterly Median Earnings (among those employed)
First quarter after exit4 $7,356 $6,583 $7,333 $6,091 $7,241
Second quarter after exit1 $7,542 $6,829 $7,710 $6,367 $7,467
Third quarter after exit5 $7,374 $6,828 $7,577 $6,306 $7,365
Fourth quarter after exit2 $7,806 $6,832 $7,804 $6,492 $7,456
Nontraditional Employment1
Females 3.0 3.0 2.8 3.2 2.3
Males 2.7 4.7 3.7 4.6 8.0
Characteristics of Second Quarter Employment (among those employed)1
Average quarterly earnings $8,125 $7,832 $8,466 $7,324 $8,519
$1 to $2,499 13.5 17.4 13.4 20.5 10.3
$2,500 to $4,999 13.4 18.1 15.3 18.8 18.0
$5,000 to $7,499 23.3 20.0 19.7 20.9 21.9
$7,500 to $9,999 19.7 15.6 16.7 15.1 19.7
$10,000 or more 30.2 28.9 34.8 24.6 30.0

Adults
PY 2019 Illinois State Data Book 101
Ethnicity Race
Hispanic Not Hispanic White Only Black Only Other
Characteristics of Second Quarter Employment (cont’d)1
Occupation of employment
Management 1.1 2.1 1.7 1.9 0.0
Business and financial 1.7 0.9 1.1 1.0 0.0
Computer and mathematical 0.6 2.7 3.0 1.1 9.3
Architecture and engineering 0.0 0.5 0.9 0.2 0.0
Education, training, and library 0.0 1.5 0.7 1.9 1.9
Healthcare practitioners and technical 11.5 23.0 28.4 18.2 25.9
Healthcare support 11.5 16.6 15.4 16.6 18.5
Food preparation and serving 3.4 2.0 1.5 2.5 3.7
Personal care and service 2.9 0.9 1.5 0.8 0.0
Sales and related 5.7 3.8 3.3 4.4 1.9
Office and administrative 13.8 7.2 6.1 8.6 13.0
Construction and extraction 6.3 3.6 5.9 2.7 3.7
Installation, maintenance, and repair 4.6 3.7 5.6 1.9 3.7
Production 8.6 5.7 4.3 7.4 3.7
Transportation and material moving 24.1 20.6 15.8 25.5 11.1
Other occupations 4.0 5.2 4.8 5.2 3.7
Industry of employment
Construction 5.5 3.2 5.3 2.0 2.2
Manufacturing 11.9 8.3 10.7 7.5 7.0
Wholesale and retail trade 4.1 2.4 2.9 2.3 1.8
Transportation and warehousing 9.2 11.2 9.6 12.3 5.7
Information 0.2 0.6 0.7 0.4 0.4
Administrative, support, waste management and remediation services
17.6 14.4 11.1 17.5 7.5
Educational services 3.5 3.4 2.4 3.8 2.6
Health care and social assistance 21.9 31.1 33.2 28.9 30.4
Arts, entertainment, and recreation 1.3 1.3 1.3 1.2 0.9
Accommodation and food services 7.6 7.8 6.1 7.8 22.5
Other services, inc public administration 2.7 2.2 2.6 2.0 2.6
Other industry 14.6 14.1 14.0 14.2 16.3

Adults
PY 2019 Illinois State Data Book 102
Ethnicity Race
Hispanic Not Hispanic White Only Black Only Other
Types of Credentials Attained (among those with a credential attainment)2
Secondary school diploma/equivalency 0.0 0.2 0.4 0.1 0.0
AA, AS, BA, BS or other college 9.2 13.1 21.3 7.3 6.7
Postgraduate degree 30.1 39.3 41.4 37.5 28.3
Occupational credential 71.1 67.4 58.4 74.1 73.3
Other credential 0.0 0.0 0.0 0.0 0.0
Types of Skill Gains (among those with a measurable skill gain)3
Educational functional gains 4.5 2.3 1.7 3.6 2.1
Secondary school gains 0.0 0.0 0.0 0.0 0.0
Postsecondary school gains 19.4 26.3 38.2 13.6 13.6
Training milestone gains 25.8 20.0 15.7 24.9 27.1
Occupational skills progression 55.7 60.9 54.3 65.8 70.0
1 Based on those who exited from July 2018 to June 2019.
2 Based on those who exited from January 2018 to December 2018.
3 Based on those who participated between July 2019 and June 2020.
4 Based on those who exited from October 2018 to September 2019.
5 Based on those who exited from April 2018 to March 2019.

Adults
PY 2019 Illinois State Data Book 103
Table II-29 Outcomes of Adults in IL, by Gender, Employment Status, and Disability Status
(Derived from PY 2019 Q4 PIRL)
WIOA Primary Indicators of Performance
Employment 2nd quarter after exit1 84.2 75.6 88.9 76.0 66.8
Employment 4th quarter after exit2 84.4 73.9 88.4 75.8 62.8
Median earnings 2nd quarter after exit1 $6,724 $7,280 $8,077 $6,427 $5,249
Credential attainment2 74.3 77.2 76.9 74.7 72.9
Measurable skill gains (among participants)3
49.6 55.4 55.3 48.5 47.7
WIA Common Measures
Entered employment in quarter after exit4 78.3 72.4 75.0 57.3
Retention in 2nd and 3rd quarters5 90.9 85.6 93.3 86.1 87.0
Average earnings in 2nd and 3rd quarters5 $15,798 $17,700 $17,887 $15,879 $13,387
Quarterly Employment Rate
First quarter after exit4 84.3 74.8 90.3 74.9 60.3
Second quarter after exit1 84.2 75.6 88.9 76.0 66.8
Third quarter after exit5 84.7 74.4 87.9 76.3 68.2
Fourth quarter after exit2 84.4 73.9 88.4 75.8 62.8
Quarterly Median Earnings (among those employed)
First quarter after exit4 $6,406 $7,236 $7,717 $6,201 $4,429
Second quarter after exit1 $6,724 $7,280 $8,077 $6,427 $5,249
Third quarter after exit5 $6,631 $7,383 $7,867 $6,393 $4,721
Fourth quarter after exit2 $6,620 $7,583 $8,261 $6,468 $6,065
Nontraditional Employment1
Females 3.0 2.7 3.3 2.0
Males 4.3 7.9 2.8 3.9
Characteristics of Second Quarter Employment (among those employed)
Average quarterly earnings1 $7,625 $8,197 $8,855 $7,338 $5,907
$1 to $2,499 16.9 16.8 10.7 20.2 26.4
$2,500 to $4,999 18.0 16.6 15.7 18.3 19.4
$5,000 to $7,499 22.4 18.1 19.5 21.0 25.6
$7,500 to $9,999 16.0 16.4 16.7 15.9 15.5
$10,000 or more 26.7 32.1 37.4 24.5 13.2
Gender Employment Status Has a
Female Male Employed Not Employed Disability
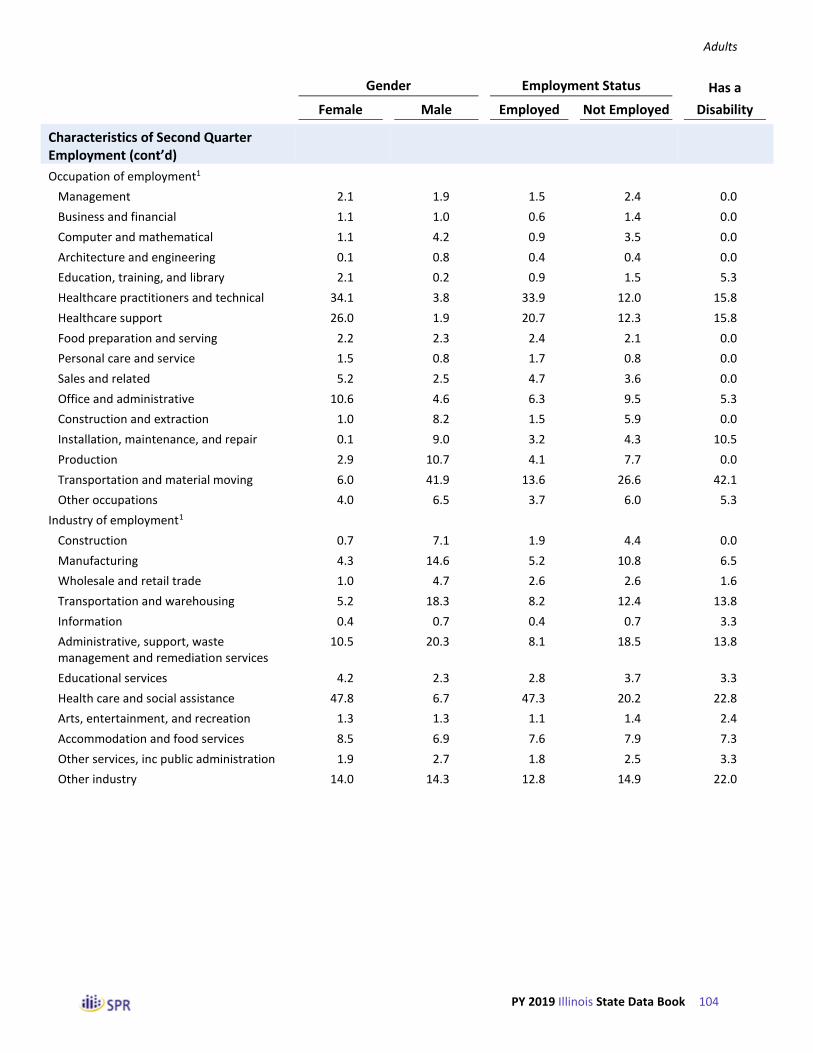
Adults
PY 2019 Illinois State Data Book 104
Characteristics of Second Quarter Employment (cont’d)
Occupation of employment1
Management 2.1 1.9 1.5 2.4 0.0
Business and financial 1.1 1.0 0.6 1.4 0.0
Computer and mathematical 1.1 4.2 0.9 3.5 0.0
Architecture and engineering 0.1 0.8 0.4 0.4 0.0
Education, training, and library 2.1 0.2 0.9 1.5 5.3
Healthcare practitioners and technical 34.1 3.8 33.9 12.0 15.8
Healthcare support 26.0 1.9 20.7 12.3 15.8
Food preparation and serving 2.2 2.3 2.4 2.1 0.0
Personal care and service 1.5 0.8 1.7 0.8 0.0
Sales and related 5.2 2.5 4.7 3.6 0.0
Office and administrative 10.6 4.6 6.3 9.5 5.3
Construction and extraction 1.0 8.2 1.5 5.9 0.0
Installation, maintenance, and repair 0.1 9.0 3.2 4.3 10.5
Production 2.9 10.7 4.1 7.7 0.0
Transportation and material moving 6.0 41.9 13.6 26.6 42.1
Other occupations 4.0 6.5 3.7 6.0 5.3
Industry of employment1
Construction 0.7 7.1 1.9 4.4 0.0
Manufacturing 4.3 14.6 5.2 10.8 6.5
Wholesale and retail trade 1.0 4.7 2.6 2.6 1.6
Transportation and warehousing 5.2 18.3 8.2 12.4 13.8
Information 0.4 0.7 0.4 0.7 3.3
Administrative, support, waste management and remediation services
10.5 20.3 8.1 18.5 13.8
Educational services 4.2 2.3 2.8 3.7 3.3
Health care and social assistance 47.8 6.7 47.3 20.2 22.8
Arts, entertainment, and recreation 1.3 1.3 1.1 1.4 2.4
Accommodation and food services 8.5 6.9 7.6 7.9 7.3
Other services, inc public administration 1.9 2.7 1.8 2.5 3.3
Other industry 14.0 14.3 12.8 14.9 22.0
Gender Employment Status Has a
Female Male Employed Not Employed Disability

Adults
PY 2019 Illinois State Data Book 105
Types of Credentials Attained (among those with a credential attainment)2
Secondary school diploma/equivalency 0.2 0.2 0.1 0.3 1.6
AA, AS, BA, BS or other college 18.7 4.9 21.0 6.7 14.5
Postgraduate degree 34.6 42.2 43.8 34.0 25.8
Occupational credential 65.6 70.9 57.1 75.4 67.7
Other credential 0.0 0.0 0.0 0.0 0.0
Types of Skill Gains (among those with a measurable skill gain)3
Educational functional gains 1.6 4.0 1.7 3.6 1.4
Secondary school gains 0.0 0.0 0.0 0.0 0.0
Postsecondary school gains 36.9 8.1 35.7 13.8 21.1
Training milestone gains 14.9 29.7 15.1 27.2 18.3
Occupational skills progression 57.0 64.8 57.9 62.6 69.0
1 Based on those who exited from July 2018 to June 2019.
2 Based on those who exited from January 2018 to December 2018.
3 Based on those who participated between July 2019 and June 2020.
4 Based on those who exited from October 2018 to September 2019.
5 Based on those who exited from April 2018 to March 2019.
Gender Employment Status Has a
Female Male Employed Not Employed Disability

Adults
PY 2019 Illinois State Data Book 106
Table II-30 Outcomes of Adults in IL, by Other Employment Characteristics
(Derived from PY 2019 Q4 PIRL)
Unemployment Compensation Status Long-term Displaced
Claimant Exhaustee Other Unemployed Homemaker
WIOA Primary Indicators of Performance
Employment 2nd quarter after exit1 75.6 76.6 81.3 63.9 70.0
Employment 4th quarter after exit2 78.2 77.0 79.8 62.8 73.3
Median earnings 2nd quarter after exit1 $5,571 $7,300 $7,231 $5,306 $3,476
Credential attainment2 73.1 73.7 75.8 70.5 0.0
Measurable skill gains (among participants)3 45.1 45.1 52.1 45.0 40.0
WIA Common Measures
Entered employment in quarter after exit4 72.6 73.7 76.2 58.0 80.0
Retention in 2nd and 3rd quarters5 85.2 87.7 89.4 78.2 100.0
Average earnings in 2nd and 3rd quarters5 $14,638 $20,171 $16,956 $14,104 $8,178
Quarterly Employment Rate
First quarter after exit4 73.5 75.9 81.7 58.4 80.0
Second quarter after exit1 75.6 76.6 81.3 63.9 70.0
Third quarter after exit5 80.2 78.4 79.8 60.8 91.7
Fourth quarter after exit2 78.2 77.0 79.8 62.8 73.3
Quarterly Median Earnings (among those employed)
First quarter after exit4 $5,326 $6,805 $6,956 $4,738 $2,781
Second quarter after exit1 $5,572 $7,301 $7,231 $5,306 $3,476
Third quarter after exit5 $5,719 $8,085 $7,191 $5,861 $3,849
Fourth quarter after exit2 $5,872 $6,353 $7,452 $5,066 $3,053
Nontraditional Employment1
Females 0.8 5.0 3.1 1.9 0.0
Males 2.3 3.2 4.5 6.3 0.0
Characteristics of Second Quarter Employment (among those employed)1
Average quarterly earnings $6,677 $8,962 $8,106 $6,578 $3,506
$1 to $2,499 24.5 15.3 15.3 26.7 14.3
$2,500 to $4,999 21.0 18.8 16.6 20.8 57.1
$5,000 to $7,499 20.7 16.5 20.5 18.3 28.6
$7,500 to $9,999 13.4 10.6 16.9 18.3 0.0
$10,000 or more 20.4 38.8 30.7 15.8 0.0

Adults
PY 2019 Illinois State Data Book 107
Unemployment Compensation Status Long-term Displaced
Claimant Exhaustee Other Unemployed Homemaker
Characteristics of Second Quarter Employment (cont’d)1
Occupation of employment
Management 7.8 3.7 1.6 2.9 0.0
Business and financial 3.1 7.4 0.8 5.9 0.0
Computer and mathematical 4.7 11.1 2.1 5.9 0.0
Architecture and engineering 1.6 0.0 0.3 0.0 0.0
Education, training, and library 1.6 0.0 1.3 2.9 0.0
Healthcare practitioners and technical 14.1 3.7 22.2 5.9 0.0
Healthcare support 10.9 11.1 16.3 8.8 100.0
Food preparation and serving 0.0 0.0 2.4 2.9 0.0
Personal care and service 0.0 0.0 1.3 2.9 0.0
Sales and related 3.1 7.4 4.0 5.9 0.0
Office and administrative 17.2 18.5 7.4 11.8 0.0
Construction and extraction 0.0 0.0 4.3 2.9 0.0
Installation, maintenance, and repair 4.7 0.0 3.9 0.0 0.0
Production 7.8 3.7 6.1 17.6 0.0
Transportation and material moving 20.3 25.9 21.0 20.6 0.0
Other occupations 3.1 7.4 5.1 2.9 0.0
Industry of employment
Construction 4.1 1.2 3.4 0.9 0.0
Manufacturing 15.1 9.9 7.4 4.7 0.0
Wholesale and retail trade 2.2 2.5 2.7 2.8 0.0
Transportation and warehousing 10.2 11.1 11.1 9.3 0.0
Information 0.4 0.0 0.6 0.0 0.0
Administrative, support, waste management and remediation services
25.0 19.8 12.5 24.3 28.6
Educational services 2.7 1.2 3.6 3.7 0.0
Health care and social assistance 16.1 21.0 33.0 13.1 28.6
Arts, entertainment, and recreation 1.5 2.5 1.3 0.9 0.0
Accommodation and food services 6.1 3.7 8.3 15.0 14.3
Other services, inc public administration 1.9 0.0 2.4 1.9 0.0
Other industry 14.6 27.2 13.8 23.4 28.6

Adults
PY 2019 Illinois State Data Book 108
Unemployment Compensation Status Long-term Displaced
Claimant Exhaustee Other Unemployed Homemaker
Types of Credentials Attained (among those with a credential attainment)2
Secondary school diploma/equivalency 0.7 0.0 0.2 0.0 0.0
AA, AS, BA, BS or other college 14.7 7.1 12.6 0.0 0.0
Postgraduate degree 27.2 26.8 38.9 29.1 0.0
Occupational credential 68.4 75.0 67.7 76.4 0.0
Other credential 0.0 0.0 0.0 0.0 0.0
Types of Skill Gains (among those with a measurable skill gain)3
Educational functional gains 1.4 0.0 2.7 1.6 0.0
Secondary school gains 0.0 0.0 0.0 0.0 0.0
Postsecondary school gains 14.5 13.0 25.6 11.1 0.0
Training milestone gains 30.4 39.1 20.5 38.1 0.0
Occupational skills progression 60.9 52.2 60.2 54.0 100.0
1 Based on those who exited from July 2018 to June 2019.
2 Based on those who exited from January 2018 to December 2018.
3 Based on those who participated between July 2019 and June 2020.
4 Based on those who exited from October 2018 to September 2019.
5 Based on those who exited from April 2018 to March 2019.

Adults
PY 2019 Illinois State Data Book 109
Table II-31 Outcomes of Adults in IL, by Adult Program Priority Groups
(Derived from PY 2019 Q4 PIRL)
Any Priority Group Veterans
Receives TANF Low Income
Basic Skills/English
Deficient
WIOA Primary Indicators of Performance
Employment 2nd quarter after exit1 81.0 73.6 75.5 80.7 80.4
Employment 4th quarter after exit2 79.7 70.6 73.3 80.0 78.2
Median earnings 2nd quarter after exit1 $7,128 $6,360 $6,267 $7,087 $6,792
Credential attainment2 75.0 71.0 57.7 74.3 74.9
Measurable skill gains (among participants)3 51.9 49.6 45.1 51.8 50.9
WIA Common Measures
Entered employment in quarter after exit4 76.4 68.2 78.6 76.3 77.2
Retention in 2nd and 3rd quarters5 89.3 87.6 79.1 89.3 88.4
Average earnings in 2nd and 3rd quarters5 $16,886 $18,469 $13,491 $16,774 $15,820
Quarterly Employment Rate
First quarter after exit4 81.3 69.9 79.8 81.2 81.3
Second quarter after exit1 81.0 73.6 75.5 80.7 80.4
Third quarter after exit5 79.9 74.8 75.5 79.8 78.8
Fourth quarter after exit2 79.7 70.6 73.3 80.0 78.2
Quarterly Median Earnings (among those employed)
First quarter after exit4 $6,796 $6,902 $5,856 $6,704 $6,621
Second quarter after exit1 $7,129 $6,360 $6,268 $7,087 $6,793
Third quarter after exit5 $7,140 $6,993 $5,722 $7,101 $6,852
Fourth quarter after exit2 $7,420 $7,119 $6,000 $7,357 $6,910
Nontraditional Employment1
Females 2.9 0.0 1.4 2.7 4.1
Males 4.2 3.8 0.0 4.6 2.2
Characteristics of Second Quarter Employment (among those employed)1
Average quarterly earnings $7,993 $7,880 $6,944 $7,970 $7,535
$1 to $2,499 15.8 19.2 21.8 16.5 15.9
$2,500 to $4,999 17.0 20.1 17.9 17.1 17.8
$5,000 to $7,499 20.4 18.3 20.5 19.7 23.7
$7,500 to $9,999 17.1 14.4 14.1 17.0 18.0
$10,000 or more 29.8 27.9 25.6 29.7 24.6
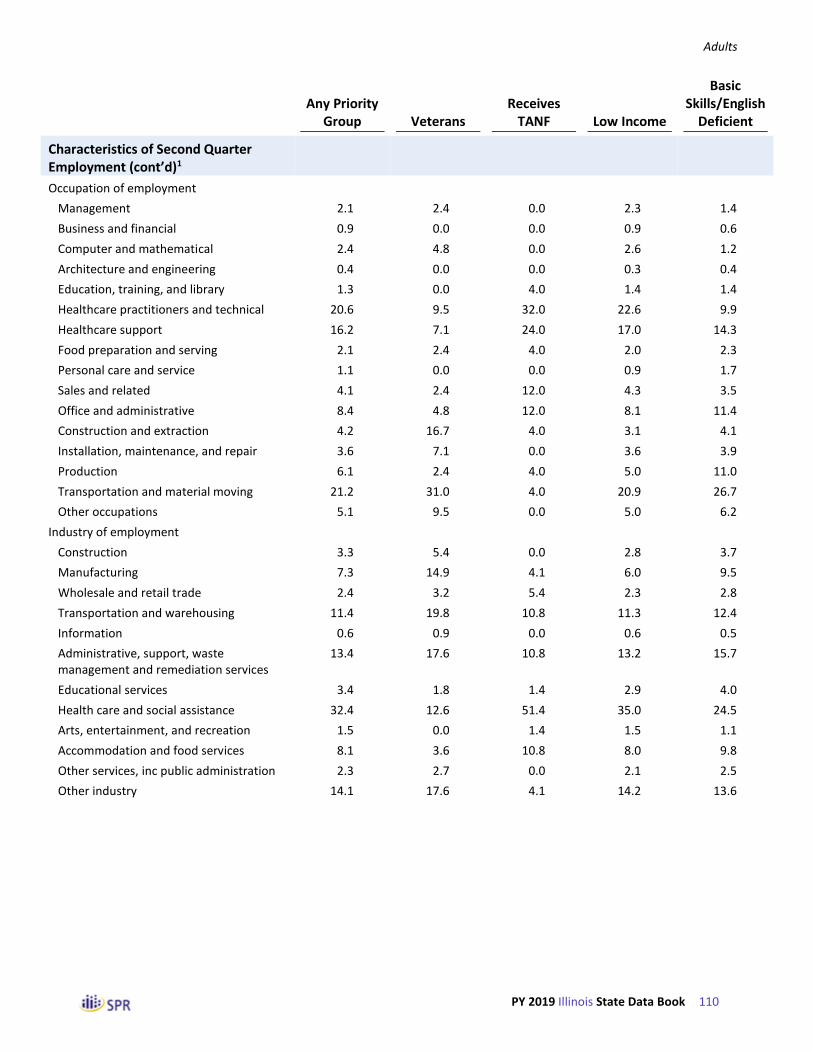
Adults
PY 2019 Illinois State Data Book 110
Any Priority Group Veterans
Receives TANF Low Income
Basic Skills/English
Deficient
Characteristics of Second Quarter Employment (cont’d)1
Occupation of employment
Management 2.1 2.4 0.0 2.3 1.4
Business and financial 0.9 0.0 0.0 0.9 0.6
Computer and mathematical 2.4 4.8 0.0 2.6 1.2
Architecture and engineering 0.4 0.0 0.0 0.3 0.4
Education, training, and library 1.3 0.0 4.0 1.4 1.4
Healthcare practitioners and technical 20.6 9.5 32.0 22.6 9.9
Healthcare support 16.2 7.1 24.0 17.0 14.3
Food preparation and serving 2.1 2.4 4.0 2.0 2.3
Personal care and service 1.1 0.0 0.0 0.9 1.7
Sales and related 4.1 2.4 12.0 4.3 3.5
Office and administrative 8.4 4.8 12.0 8.1 11.4
Construction and extraction 4.2 16.7 4.0 3.1 4.1
Installation, maintenance, and repair 3.6 7.1 0.0 3.6 3.9
Production 6.1 2.4 4.0 5.0 11.0
Transportation and material moving 21.2 31.0 4.0 20.9 26.7
Other occupations 5.1 9.5 0.0 5.0 6.2
Industry of employment
Construction 3.3 5.4 0.0 2.8 3.7
Manufacturing 7.3 14.9 4.1 6.0 9.5
Wholesale and retail trade 2.4 3.2 5.4 2.3 2.8
Transportation and warehousing 11.4 19.8 10.8 11.3 12.4
Information 0.6 0.9 0.0 0.6 0.5
Administrative, support, waste management and remediation services
13.4 17.6 10.8 13.2 15.7
Educational services 3.4 1.8 1.4 2.9 4.0
Health care and social assistance 32.4 12.6 51.4 35.0 24.5
Arts, entertainment, and recreation 1.5 0.0 1.4 1.5 1.1
Accommodation and food services 8.1 3.6 10.8 8.0 9.8
Other services, inc public administration 2.3 2.7 0.0 2.1 2.5
Other industry 14.1 17.6 4.1 14.2 13.6

Adults
PY 2019 Illinois State Data Book 111
Any Priority Group Veterans
Receives TANF Low Income
Basic Skills/English
Deficient
Types of Credentials Attained (among those with a credential attainment)2
Secondary school diploma/equivalency 0.2 0.0 2.4 0.2 0.4
AA, AS, BA, BS or other college 12.2 9.1 9.8 13.4 4.5
Postgraduate degree 37.8 30.3 34.1 38.6 36.1
Occupational credential 68.2 71.2 78.0 67.4 73.2
Other credential 0.0 0.0 0.0 0.0 0.0
Types of Skill Gains (among those with a measurable skill gain)3
Educational functional gains 2.7 1.6 0.0 2.3 4.4
Secondary school gains 0.0 0.0 0.0 0.0 0.0
Postsecondary school gains 24.7 9.5 18.8 26.8 17.9
Training milestone gains 20.3 28.6 15.6 19.4 23.6
Occupational skills progression 60.9 69.8 68.8 60.9 61.9
1 Based on those who exited from July 2018 to June 2019.
2 Based on those who exited from January 2018 to December 2018.
3 Based on those who participated between July 2019 and June 2020.
4 Based on those who exited from October 2018 to September 2019.
5 Based on those who exited from April 2018 to March 2019.
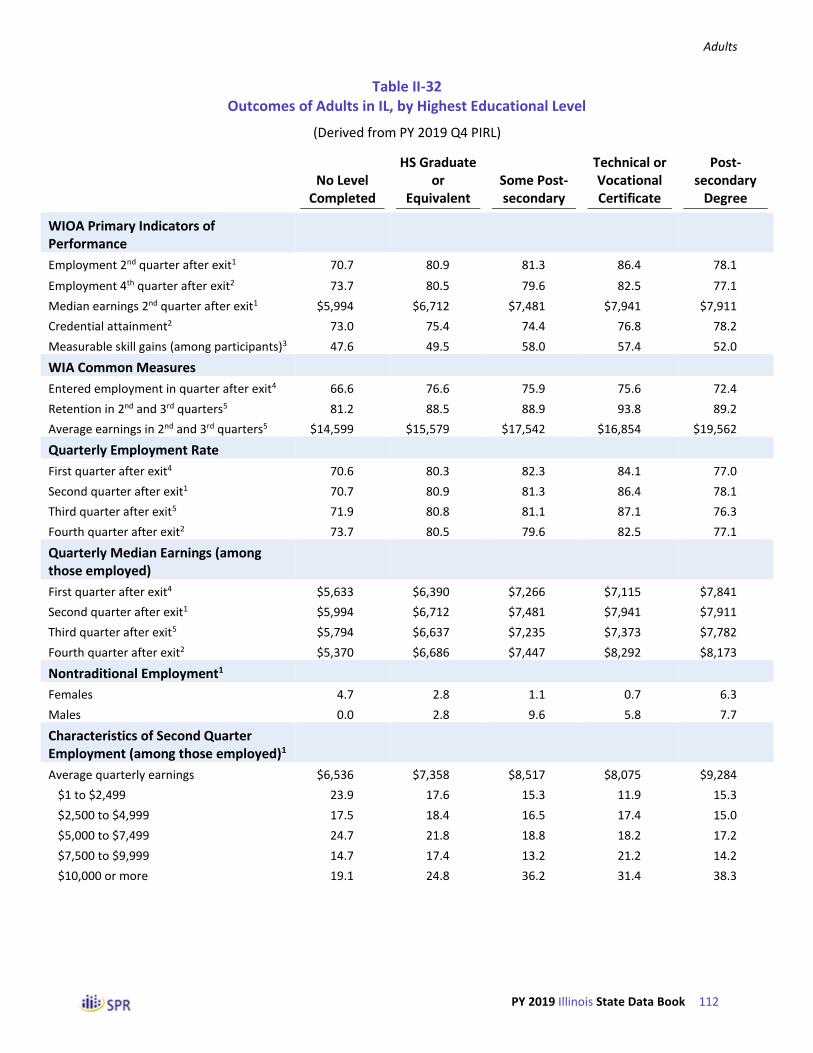
Adults
PY 2019 Illinois State Data Book 112
Table II-32 Outcomes of Adults in IL, by Highest Educational Level
(Derived from PY 2019 Q4 PIRL)
No Level Completed
HS Graduate or
Equivalent Some Post-secondary
Technical or Vocational Certificate
Post-secondary
Degree
WIOA Primary Indicators of Performance
Employment 2nd quarter after exit1 70.7 80.9 81.3 86.4 78.1
Employment 4th quarter after exit2 73.7 80.5 79.6 82.5 77.1
Median earnings 2nd quarter after exit1 $5,994 $6,712 $7,481 $7,941 $7,911
Credential attainment2 73.0 75.4 74.4 76.8 78.2
Measurable skill gains (among participants)3 47.6 49.5 58.0 57.4 52.0
WIA Common Measures
Entered employment in quarter after exit4 66.6 76.6 75.9 75.6 72.4
Retention in 2nd and 3rd quarters5 81.2 88.5 88.9 93.8 89.2
Average earnings in 2nd and 3rd quarters5 $14,599 $15,579 $17,542 $16,854 $19,562
Quarterly Employment Rate
First quarter after exit4 70.6 80.3 82.3 84.1 77.0
Second quarter after exit1 70.7 80.9 81.3 86.4 78.1
Third quarter after exit5 71.9 80.8 81.1 87.1 76.3
Fourth quarter after exit2 73.7 80.5 79.6 82.5 77.1
Quarterly Median Earnings (among those employed)
First quarter after exit4 $5,633 $6,390 $7,266 $7,115 $7,841
Second quarter after exit1 $5,994 $6,712 $7,481 $7,941 $7,911
Third quarter after exit5 $5,794 $6,637 $7,235 $7,373 $7,782
Fourth quarter after exit2 $5,370 $6,686 $7,447 $8,292 $8,173
Nontraditional Employment1
Females 4.7 2.8 1.1 0.7 6.3
Males 0.0 2.8 9.6 5.8 7.7
Characteristics of Second Quarter Employment (among those employed)1
Average quarterly earnings $6,536 $7,358 $8,517 $8,075 $9,284
$1 to $2,499 23.9 17.6 15.3 11.9 15.3
$2,500 to $4,999 17.5 18.4 16.5 17.4 15.0
$5,000 to $7,499 24.7 21.8 18.8 18.2 17.2
$7,500 to $9,999 14.7 17.4 13.2 21.2 14.2
$10,000 or more 19.1 24.8 36.2 31.4 38.3
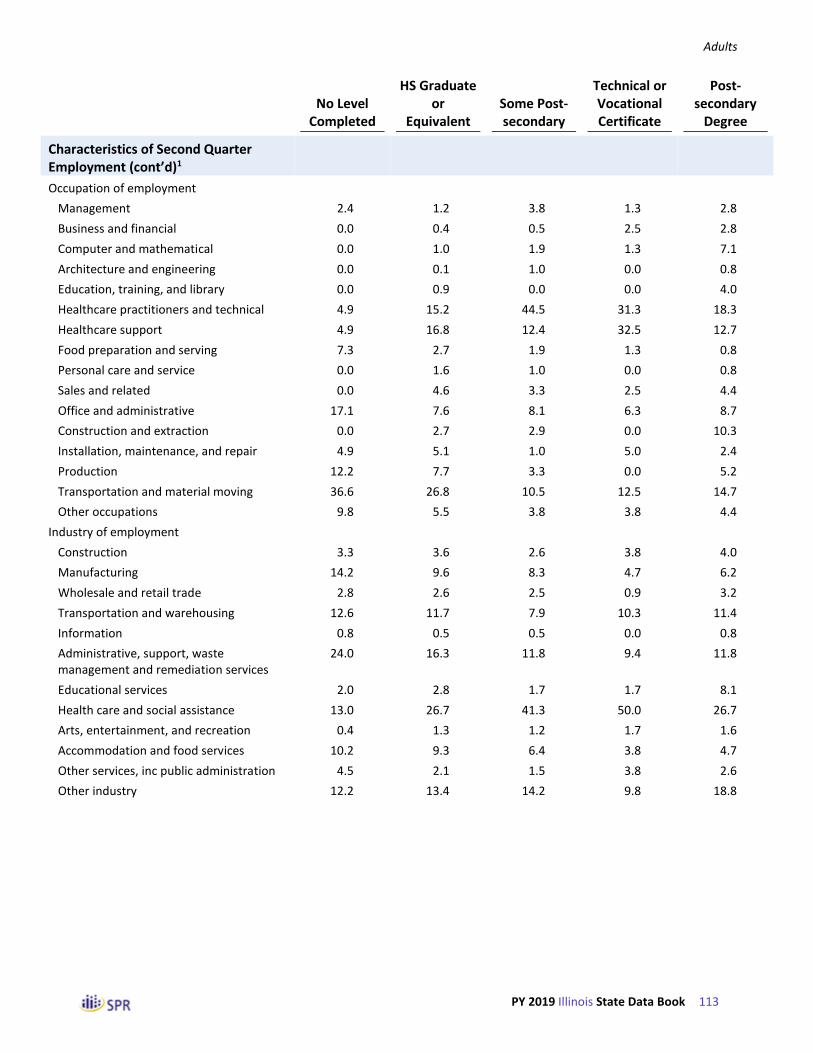
Adults
PY 2019 Illinois State Data Book 113
No Level Completed
HS Graduate or
Equivalent Some Post-secondary
Technical or Vocational Certificate
Post-secondary
Degree
Characteristics of Second Quarter Employment (cont’d)1
Occupation of employment
Management 2.4 1.2 3.8 1.3 2.8
Business and financial 0.0 0.4 0.5 2.5 2.8
Computer and mathematical 0.0 1.0 1.9 1.3 7.1
Architecture and engineering 0.0 0.1 1.0 0.0 0.8
Education, training, and library 0.0 0.9 0.0 0.0 4.0
Healthcare practitioners and technical 4.9 15.2 44.5 31.3 18.3
Healthcare support 4.9 16.8 12.4 32.5 12.7
Food preparation and serving 7.3 2.7 1.9 1.3 0.8
Personal care and service 0.0 1.6 1.0 0.0 0.8
Sales and related 0.0 4.6 3.3 2.5 4.4
Office and administrative 17.1 7.6 8.1 6.3 8.7
Construction and extraction 0.0 2.7 2.9 0.0 10.3
Installation, maintenance, and repair 4.9 5.1 1.0 5.0 2.4
Production 12.2 7.7 3.3 0.0 5.2
Transportation and material moving 36.6 26.8 10.5 12.5 14.7
Other occupations 9.8 5.5 3.8 3.8 4.4
Industry of employment
Construction 3.3 3.6 2.6 3.8 4.0
Manufacturing 14.2 9.6 8.3 4.7 6.2
Wholesale and retail trade 2.8 2.6 2.5 0.9 3.2
Transportation and warehousing 12.6 11.7 7.9 10.3 11.4
Information 0.8 0.5 0.5 0.0 0.8
Administrative, support, waste management and remediation services
24.0 16.3 11.8 9.4 11.8
Educational services 2.0 2.8 1.7 1.7 8.1
Health care and social assistance 13.0 26.7 41.3 50.0 26.7
Arts, entertainment, and recreation 0.4 1.3 1.2 1.7 1.6
Accommodation and food services 10.2 9.3 6.4 3.8 4.7
Other services, inc public administration 4.5 2.1 1.5 3.8 2.6
Other industry 12.2 13.4 14.2 9.8 18.8

Adults
PY 2019 Illinois State Data Book 114
No Level Completed
HS Graduate or
Equivalent Some Post-secondary
Technical or Vocational Certificate
Post-secondary
Degree
Types of Credentials Attained (among those with a credential attainment)2
Secondary school diploma/equivalency 3.1 0.1 0.0 0.0 0.0
AA, AS, BA, BS or other college 1.5 6.3 37.1 10.9 12.2
Postgraduate degree 43.1 35.6 44.1 61.3 31.0
Occupational credential 69.2 74.9 41.3 69.7 71.1
Other credential 0.0 0.0 0.0 0.0 0.0
Types of Skill Gains (among those with a measurable skill gain)3
Educational functional gains 5.6 4.1 0.4 0.0 1.2
Secondary school gains 0.0 0.0 0.0 0.0 0.0
Postsecondary school gains 5.6 15.7 50.4 28.4 26.6
Training milestone gains 24.4 26.3 9.5 12.8 20.0
Occupational skills progression 70.0 62.6 50.3 72.3 59.0
1 Based on those who exited from July 2018 to June 2019.
2 Based on those who exited from January 2018 to December 2018.
3 Based on those who participated between July 2019 and June 2020.
4 Based on those who exited from October 2018 to September 2019.
5 Based on those who exited from April 2018 to March 2019.

Adults
PY 2019 Illinois State Data Book 115
Table II-33 Outcomes of Adults in IL, by Selected Other Characteristics
(Derived from PY 2019 Q4 PIRL)
School Status Single
Attending Not Attending Ex-Offender Homeless Parents
WIOA Primary Indicators of Performance
Employment 2nd quarter after exit1 90.7 79.7 73.0 76.7 86.5
Employment 4th quarter after exit2 90.3 79.0 70.6 69.9 86.0
Median earnings 2nd quarter after exit1 $9,960 $6,877 $6,505 $5,292 $7,018
Credential attainment2 79.2 75.4 76.7 67.3 72.1
Measurable skill gains (among participants)3 60.5 51.1 56.2 43.4 56.0
WIA Common Measures
Entered employment in quarter after exit4 84.7 74.9 69.1 65.3 76.9
Retention in 2nd and 3rd quarters5 94.3 88.3 81.0 78.2 91.5
Average earnings in 2nd and 3rd quarters5 $20,913 $16,414 $16,287 $13,595 $16,471
Quarterly Employment Rate
First quarter after exit4 91.4 79.3 73.0 67.5 86.3
Second quarter after exit1 90.7 79.7 73.0 76.7 86.5
Third quarter after exit5 89.7 79.5 70.8 71.8 87.9
Fourth quarter after exit2 90.3 79.0 70.6 69.9 86.0
Quarterly Median Earnings (among those employed)
First quarter after exit4 $9,407 $6,632 $6,305 $4,913 $7,007
Second quarter after exit1 $9,961 $6,878 $6,505 $5,293 $7,019
Third quarter after exit5 $10,820 $6,840 $6,916 $4,893 $6,917
Fourth quarter after exit2 $10,102 $6,909 $7,247 $5,105 $6,961
Nontraditional Employment1
Females 0.0 3.2 7.4 11.8 1.1
Males 20.0 4.1 0.9 1.8 7.5
Characteristics of Second Quarter Employment (among those employed)1
Average quarterly earnings $9,707 $7,797 $7,316 $6,686 $7,969
$1 to $2,499 10.1 17.2 22.6 25.9 17.8
$2,500 to $4,999 12.2 17.6 16.4 23.5 16.0
$5,000 to $7,499 15.4 20.7 19.9 12.3 19.7
$7,500 to $9,999 13.8 16.3 16.4 18.5 14.7
$10,000 or more 48.4 28.3 24.7 19.8 31.8

Adults
PY 2019 Illinois State Data Book 116
School Status Single
Attending Not Attending Ex-Offender Homeless Parents
Characteristics of Second Quarter Employment (cont’d)1
Occupation of employment
Management 2.1 2.0 1.4 0.0 1.2
Business and financial 0.0 1.1 0.0 0.0 0.0
Computer and mathematical 0.0 2.6 2.8 0.0 0.8
Architecture and engineering 0.0 0.4 0.7 0.0 0.0
Education, training, and library 1.0 1.3 0.0 0.0 1.6
Healthcare practitioners and technical 69.8 17.4 6.2 6.7 40.2
Healthcare support 14.6 16.0 6.2 6.7 29.9
Food preparation and serving 2.1 2.2 0.7 0.0 1.6
Personal care and service 1.0 1.2 0.0 0.0 2.0
Sales and related 1.0 4.3 2.1 6.7 4.9
Office and administrative 3.1 8.5 3.4 20.0 4.9
Construction and extraction 0.0 4.3 0.7 0.0 0.0
Installation, maintenance, and repair 1.0 4.1 3.4 6.7 0.4
Production 1.0 6.6 13.1 6.7 2.5
Transportation and material moving 1.0 22.7 55.2 46.7 7.8
Other occupations 2.1 5.3 4.1 0.0 2.0
Industry of employment
Construction 0.0 3.6 4.6 2.6 1.4
Manufacturing 3.3 9.0 12.4 12.8 4.3
Wholesale and retail trade 0.0 2.7 3.5 2.6 1.6
Transportation and warehousing 1.6 11.3 19.0 14.1 7.1
Information 0.5 0.6 0.9 1.3 0.2
Administrative, support, waste management and remediation services
3.8 15.3 22.7 25.6 8.1
Educational services 2.2 3.4 0.2 0.0 3.1
Health care and social assistance 74.2 27.9 11.8 16.7 52.0
Arts, entertainment, and recreation 0.5 1.4 0.6 0.0 1.2
Accommodation and food services 4.9 7.9 8.5 7.7 7.0
Other services, inc public administration 1.1 2.3 3.9 0.0 1.4
Other industry 7.7 14.5 11.8 16.7 12.5
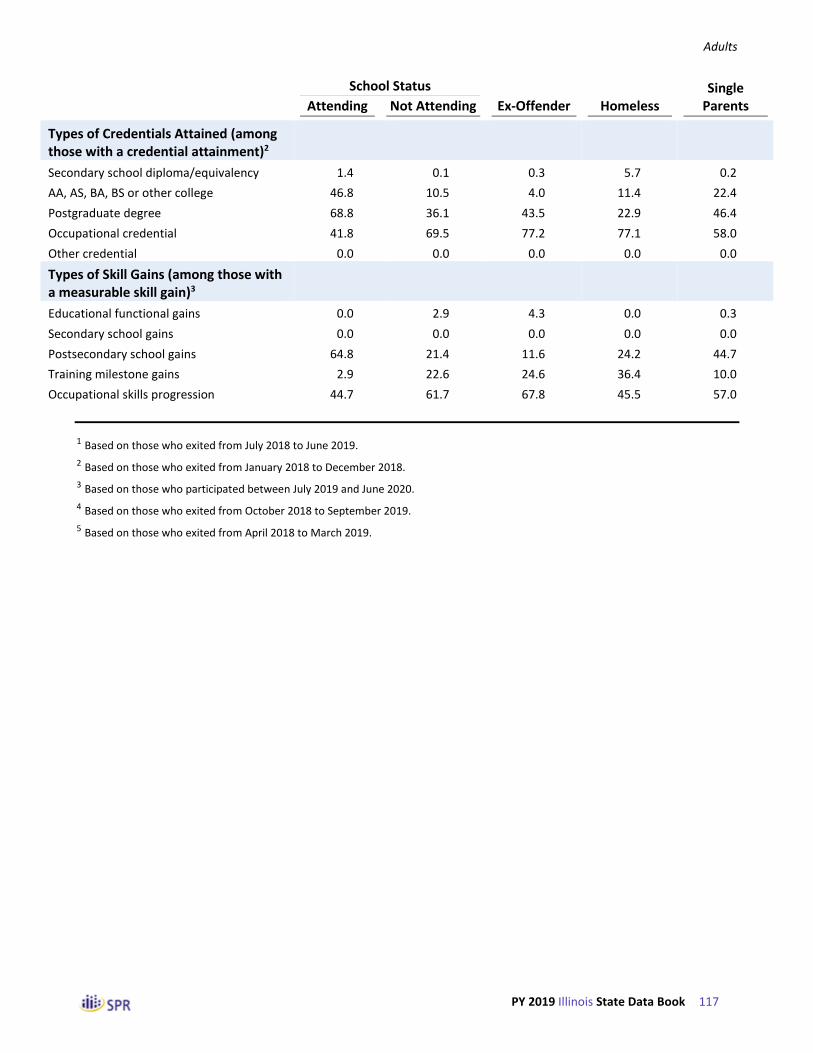
Adults
PY 2019 Illinois State Data Book 117
School Status Single
Attending Not Attending Ex-Offender Homeless Parents
Types of Credentials Attained (among those with a credential attainment)2
Secondary school diploma/equivalency 1.4 0.1 0.3 5.7 0.2
AA, AS, BA, BS or other college 46.8 10.5 4.0 11.4 22.4
Postgraduate degree 68.8 36.1 43.5 22.9 46.4
Occupational credential 41.8 69.5 77.2 77.1 58.0
Other credential 0.0 0.0 0.0 0.0 0.0
Types of Skill Gains (among those with a measurable skill gain)3
Educational functional gains 0.0 2.9 4.3 0.0 0.3
Secondary school gains 0.0 0.0 0.0 0.0 0.0
Postsecondary school gains 64.8 21.4 11.6 24.2 44.7
Training milestone gains 2.9 22.6 24.6 36.4 10.0
Occupational skills progression 44.7 61.7 67.8 45.5 57.0
1 Based on those who exited from July 2018 to June 2019.
2 Based on those who exited from January 2018 to December 2018.
3 Based on those who participated between July 2019 and June 2020.
4 Based on those who exited from October 2018 to September 2019.
5 Based on those who exited from April 2018 to March 2019.
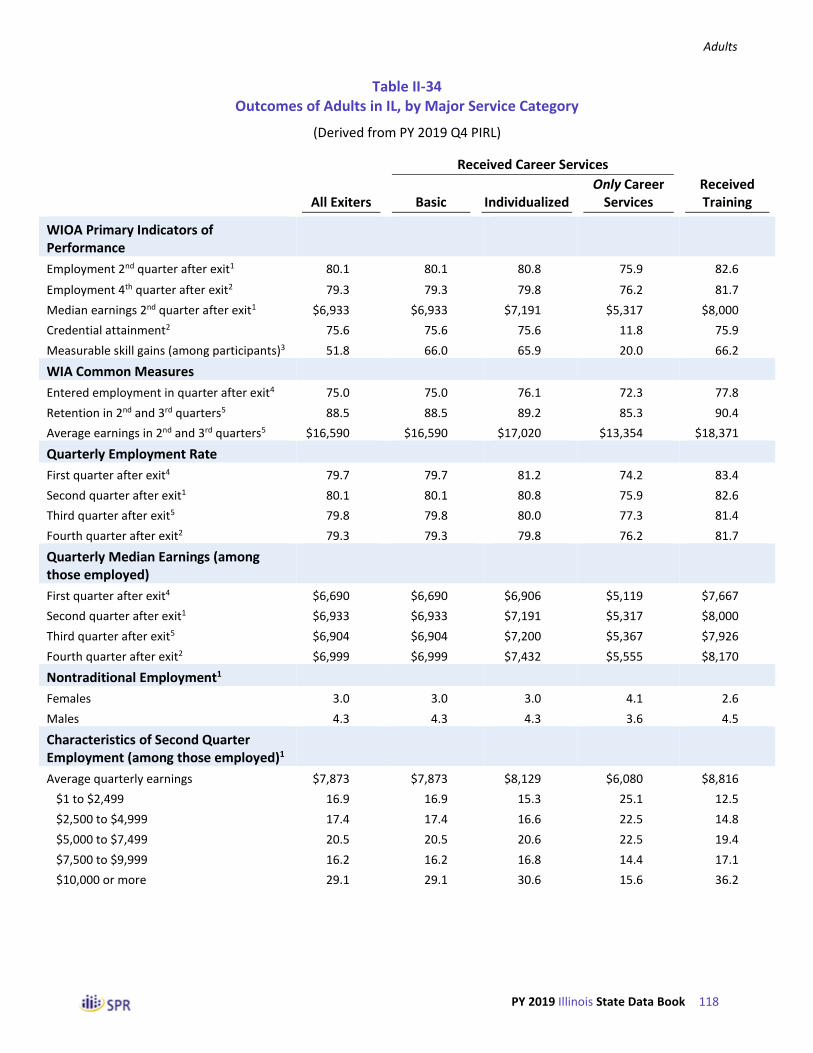
Adults
PY 2019 Illinois State Data Book 118
Table II-34 Outcomes of Adults in IL, by Major Service Category
(Derived from PY 2019 Q4 PIRL)
All Exiters
Received Career Services
Basic Individualized Only Career
Services Received Training
WIOA Primary Indicators of Performance
Employment 2nd quarter after exit1 80.1 80.1 80.8 75.9 82.6
Employment 4th quarter after exit2 79.3 79.3 79.8 76.2 81.7
Median earnings 2nd quarter after exit1 $6,933 $6,933 $7,191 $5,317 $8,000
Credential attainment2 75.6 75.6 75.6 11.8 75.9
Measurable skill gains (among participants)3 51.8 66.0 65.9 20.0 66.2
WIA Common Measures
Entered employment in quarter after exit4 75.0 75.0 76.1 72.3 77.8
Retention in 2nd and 3rd quarters5 88.5 88.5 89.2 85.3 90.4
Average earnings in 2nd and 3rd quarters5 $16,590 $16,590 $17,020 $13,354 $18,371
Quarterly Employment Rate
First quarter after exit4 79.7 79.7 81.2 74.2 83.4
Second quarter after exit1 80.1 80.1 80.8 75.9 82.6
Third quarter after exit5 79.8 79.8 80.0 77.3 81.4
Fourth quarter after exit2 79.3 79.3 79.8 76.2 81.7
Quarterly Median Earnings (among those employed)
First quarter after exit4 $6,690 $6,690 $6,906 $5,119 $7,667
Second quarter after exit1 $6,933 $6,933 $7,191 $5,317 $8,000
Third quarter after exit5 $6,904 $6,904 $7,200 $5,367 $7,926
Fourth quarter after exit2 $6,999 $6,999 $7,432 $5,555 $8,170
Nontraditional Employment1
Females 3.0 3.0 3.0 4.1 2.6
Males 4.3 4.3 4.3 3.6 4.5
Characteristics of Second Quarter Employment (among those employed)1
Average quarterly earnings $7,873 $7,873 $8,129 $6,080 $8,816
$1 to $2,499 16.9 16.9 15.3 25.1 12.5
$2,500 to $4,999 17.4 17.4 16.6 22.5 14.8
$5,000 to $7,499 20.5 20.5 20.6 22.5 19.4
$7,500 to $9,999 16.2 16.2 16.8 14.4 17.1
$10,000 or more 29.1 29.1 30.6 15.6 36.2

Adults
PY 2019 Illinois State Data Book 119
All Exiters
Received Career Services
Basic Individualized Only Career
Services Received Training
Characteristics of Second Quarter Employment (cont’d)1
Occupation of employment
Management 2.0 2.0 2.0 4.5 1.5
Business and financial 1.0 1.0 1.0 2.7 0.7
Computer and mathematical 2.4 2.4 2.4 4.5 1.9
Architecture and engineering 0.4 0.4 0.4 0.5 0.4
Education, training, and library 1.3 1.3 1.3 3.6 0.8
Healthcare practitioners and technical 21.4 21.4 21.3 6.3 24.6
Healthcare support 15.9 15.9 15.9 8.6 17.4
Food preparation and serving 2.2 2.2 2.2 3.6 1.9
Personal care and service 1.2 1.2 1.2 1.4 1.2
Sales and related 4.1 4.1 4.1 8.1 3.2
Office and administrative 8.1 8.1 8.1 18.5 5.9
Construction and extraction 4.0 4.0 4.0 7.7 3.2
Installation, maintenance, and repair 3.8 3.8 3.8 2.7 4.1
Production 6.1 6.1 6.1 7.2 5.9
Transportation and material moving 21.1 21.1 21.1 10.8 23.3
Other occupations 5.0 5.0 5.0 9.5 4.1
Industry of employment
Construction 3.5 3.5 3.3 3.9 3.3
Manufacturing 8.8 8.8 7.7 12.0 7.2
Wholesale and retail trade 2.6 2.6 2.6 2.3 2.8
Transportation and warehousing 10.9 10.9 11.3 8.2 12.4
Information 0.6 0.6 0.6 0.5 0.6
Administrative, support, waste management and remediation services
14.8 14.8 13.1 22.3 10.9
Educational services 3.4 3.4 3.6 2.9 3.6
Health care and social assistance 29.8 29.8 32.1 16.2 36.9
Arts, entertainment, and recreation 1.3 1.3 1.4 1.5 1.2
Accommodation and food services 7.8 7.8 7.9 10.9 6.2
Other services, inc public administration 2.3 2.3 2.4 2.3 2.3
Other industry 14.2 14.2 14.1 17.1 12.7

Adults
PY 2019 Illinois State Data Book 120
All Exiters
Received Career Services
Basic Individualized Only Career
Services Received Training
Types of Credentials Attained (among those with a credential attainment)2
Secondary school diploma/equivalency 0.2 0.2 0.2 0.0 0.2
AA, AS, BA, BS or other college 12.6 12.6 12.6 0.0 12.6
Postgraduate degree 38.0 38.0 38.0 100.0 37.9
Occupational credential 67.9 67.9 67.9 50.0 68.0
Other credential 0.0 0.0 0.0 0.0 0.0
Types of Skill Gains (among those with a measurable skill gain)3
Educational functional gains 2.6 2.5 2.5 0.0 2.5
Secondary school gains 0.0 0.0 0.0 0.0 0.0
Postsecondary school gains 25.2 7.7 7.6 100.0 7.6
Training milestone gains 20.9 26.6 26.6 0.0 26.7
Occupational skills progression 60.2 72.2 72.2 0.0 72.3
1 Based on those who exited from July 2018 to June 2019.
2 Based on those who exited from January 2018 to December 2018.
3 Based on those who participated between July 2019 and June 2020.
4 Based on those who exited from October 2018 to September 2019.
5 Based on those who exited from April 2018 to March 2019.

Adults
PY 2019 Illinois State Data Book 121
Table II-35 WIOA Primary Indicators of Performance for Adults, by State
(Derived from PY 2019 Q4 PIRL)
2nd Quarter Employment1
4th Quarter Employment2
Median Earnings1
Credential Attainment2
Measurable Skills Gains3
Nation 71.4 70.4 $6,514 69.7 53.2
Alabama 74.9 72.6 $6,877 80.2 63.9
Alaska 60.3 61.3 $10,050 69.0 29.6
Arizona 71.5 67.2 $6,692 76.0 54.5
Arkansas 83.4 82.9 $6,422 83.8 75.9
California 68.5 66.6 $6,701 57.7 50.7
Colorado 75.5 74.9 $7,175 78.2 56.0
Connecticut 68.5 67.9 $5,631 73.1 55.6
Delaware 76.8 78.6 $6,289 65.3 19.4
District of Columbia 71.1 72.2 $6,699 36.8 69.9
Florida 86.0 83.4 $8,279 78.4 47.7
Georgia 83.5 81.0 $6,181 76.7 34.0
Guam 62.7 57.5 $8,938 54.9 12.0
Hawaii 77.1 64.9 $6,309 58.2 14.2
Idaho 84.6 85.9 $6,583 74.0 28.8
Illinois 80.1 79.3 $6,933 75.6 51.8
Indiana 82.1 80.7 $6,772 74.0 62.7
Iowa 70.4 71.6 $5,432 67.9 54.3
Kansas 75.6 74.5 $6,274 72.6 59.6
Kentucky 60.9 60.6 $5,366 28.5 36.4
Louisiana 71.3 70.5 $6,093 73.1 64.5
Maine 71.3 70.0 $5,116 66.5 43.8
Maryland 80.4 77.1 $6,713 63.7 56.6
Massachusetts 77.1 76.2 $6,655 72.6 44.3
Michigan 74.6 74.8 $6,309 85.8 41.9
Minnesota 82.8 79.3 $7,804 76.5 55.7
Mississippi 86.2 85.3 $6,262 79.4 44.4
Missouri 75.7 77.3 $6,445 70.7 60.7
Montana 72.2 67.6 $6,402 59.8 55.1
Nebraska 79.2 78.3 $6,357 59.4 62.6
Nevada 73.0 73.4 $6,073 80.9 61.4
New Hampshire 80.1 84.8 $7,134 85.5 82.3
New Jersey 70.1 71.4 $5,619 64.6 43.5
New Mexico 78.1 75.9 $7,272 57.6 68.0
New York 68.5 67.6 $6,318 51.7 59.1
North Carolina 80.2 79.1 $6,147 60.3 60.4

Adults
PY 2019 Illinois State Data Book 122
2nd Quarter Employment1
4th Quarter Employment2
Median Earnings1
Credential Attainment2
Measurable Skills Gains3
North Dakota 82.7 76.9 $7,483 70.2 62.6
Northern Mariana Islands 73.2 74.4 $5,304 95.8 36.4
Ohio 83.0 82.8 $6,500 78.5 66.3
Oklahoma 70.6 68.8 $5,503 73.0 61.2
Oregon 68.1 68.6 $6,660 61.6 47.0
Palau 61.2 62.0 $1,820 16.7 100.0
Pennsylvania 76.6 74.8 $6,155 70.8 47.0
Puerto Rico - - - - -
Rhode Island 78.3 78.7 $6,220 62.6 53.1
South Carolina 78.6 78.3 $5,987 67.4 58.0
South Dakota 74.1 73.9 $5,030 63.6 64.7
Tennessee 86.8 86.6 $7,358 68.4 70.5
Texas 76.1 73.8 $5,491 71.6 62.2
Utah 80.8 73.5 $7,398 76.1 49.2
Vermont 72.5 68.5 $6,969 79.6 56.7
Virgin Islands 63.4 59.8 $5,699 39.3 66.3
Virginia 84.2 80.8 $5,732 77.3 66.9
Washington 68.2 68.7 $8,578 65.4 23.1
West Virginia 71.3 71.0 $5,840 79.0 35.1
Wisconsin 77.1 76.4 $6,339 68.0 40.5
Wyoming 77.8 77.3 $7,374 73.4 69.2
1 Based on those who exited from July 2018 to June 2019.
2 Based on those who exited from January 2018 to December 2018.
3 Based on those who participated between July 2019 and June 2020.

Adults
PY 2019 Illinois State Data Book 123
Table II-36 WIA Common Measures for Adults, by State
(Derived from PY 2019 Q4 PIRL)
Entered Employment1
Employment Retention2
Average Earnings2
Nation 65.5 84.5 $16,892
Alabama 71.1 84.9 $19,273
Alaska 74.3 79.9 $21,540
Arizona 67.6 85.7 $16,378
Arkansas 73.7 88.9 $14,845
California 65.0 84.1 $16,740
Colorado 73.9 82.3 $17,426
Connecticut 64.6 83.7 $13,896
Delaware 72.6 81.3 $15,289
District of Columbia 67.9 81.9 $16,652
Florida 77.6 91.5 $19,089
Georgia 80.9 88.7 $15,053
Guam 45.2 87.0 $38,554
Hawaii 62.2 81.3 $13,265
Idaho 86.9 89.2 $15,520
Illinois 75.0 88.5 $16,590
Indiana 79.1 89.0 $16,073
Iowa 60.0 85.9 $13,941
Kansas 70.5 85.0 $14,605
Kentucky 65.4 80.4 $14,477
Louisiana 60.8 85.5 $17,355
Maine 66.5 83.0 $11,669
Maryland 73.5 89.2 $17,017
Massachusetts 73.9 85.5 $15,725
Michigan 78.4 86.5 $15,328
Minnesota 78.4 89.2 $20,733
Mississippi 82.6 91.7 $14,558
Missouri 70.8 86.5 $28,671
Montana 70.1 82.2 $16,742
Nebraska 77.4 89.0 $14,773
Nevada 70.2 84.6 $16,211
New Hampshire 82.4 85.6 $15,536
New Jersey 66.4 81.5 $15,381
New Mexico 66.7 88.0 $17,125
New York 60.7 83.1 $16,266
North Carolina 73.6 89.0 $14,130

Adults
PY 2019 Illinois State Data Book 124
Entered Employment1
Employment Retention2
Average Earnings2
North Dakota 82.9 82.0 $18,693
Northern Mariana Islands 55.6 97.7 $10,524
Ohio 76.0 88.9 $14,724
Oklahoma 64.0 82.8 $14,762
Oregon 60.5 82.7 $17,913
Palau 22.2 100.0 $4,196
Pennsylvania 74.2 85.5 $14,513
Puerto Rico - - -
Rhode Island 79.6 80.0 $16,230
South Carolina 71.3 87.0 $14,293
South Dakota 73.2 83.6 $13,007
Tennessee 80.2 92.5 $16,388
Texas 75.7 80.7 $14,673
Utah 78.5 86.6 $18,028
Vermont 67.2 85.8 $15,141
Virgin Islands 49.3 70.8 $14,704
Virginia 77.9 89.5 $13,852
Washington 60.3 84.1 $25,479
West Virginia 63.0 81.8 $15,907
Wisconsin 73.8 84.7 $15,321
Wyoming 66.7 86.5 $19,205
1 Based on those who exited from October 2018 to September 2019.
2 Based on those who exited from April 2018 to March 2019.

Dislocated Workers
PY 2019 Illinois State Data Book 125
Part III: Dislocated Worker Program

Dislocated Workers
PY 2019 Illinois State Data Book 126
Table III-1 Trends in the Characteristics of Dislocated Worker Exiters, by Reporting Period
(Derived from WIASRD and PIRL Files)
Nation PY 2017
Nation PY 2018
Nation PY 2019
IL PY 2017
IL PY 2018
IL PY 2019
Number of Exiters
All exiters 320,450 289,662 238,793 4,702 4,448 4,418
Statewide programs 11,358 9,370 8,518 585 1,005 858
Local programs 318,502 287,888 236,877 4,550 4,271 3,958
Dislocated Worker Grants 10,216 7,660 6,535 339 85 173
Disaster Recovery 2,020 1,783 1,424 0 0 15
Economic Recovery 8,196 5,877 5,111 339 85 158
Age Categories
Under 22 1.9 1.8 1.8 0.7 0.8 1.0
22 to 29 16.4 15.7 16.0 12.2 10.0 11.8
30 to 44 34.7 35.2 35.4 32.5 33.9 34.3
45 to 54 23.8 23.4 22.6 31.3 31.8 29.6
55 and older 23.1 24.0 24.2 23.2 23.4 23.3
Gender
Females 48.3 49.4 50.2 40.0 39.1 42.3
Males 51.7 50.6 49.8 60.0 60.9 57.7
Race and Ethnicity
Hispanics/Latinos 16.6 17.5 20.0 17.5 18.0 21.5
American Indians/Alaska Natives 2.5 2.5 2.3 0.7 0.8 1.0
Asians 5.1 5.1 6.2 4.3 5.0 5.3
Blacks or African Americans 22.1 22.6 28.0 35.4 33.5 36.4
Native Hawaiians/Pacific Islanders 0.9 0.9 1.0 0.2 0.2 0.3
Whites 71.9 71.4 65.8 60.0 61.1 58.0
More than one race 2.2 2.2 2.9 0.6 0.6 1.0
Employment Status
Employed 7.5 8.4 6.9 0.2 0.2 0.3
Not employed or with layoff notice 92.5 91.6 93.1 99.8 99.8 99.7
Veteran Status
Veterans 6.5 6.0 4.8 8.4 7.6 7.3
Disabled veterans 1.2 1.2 1.0 1.0 0.9 1.1
Other eligible persons 0.1 0.2 0.1 0.0 0.0 0.0
Active duty military spouses -- -- 0.1 -- -- 1.9

Dislocated Workers
PY 2019 Illinois State Data Book 127
Nation PY 2017
Nation PY 2018
Nation PY 2019
IL PY 2017
IL PY 2018
IL PY 2019
Unemployment Compensation Status
Claimants referred by RESEA 19.2 36.0 45.5 4.3 4.7 5.0
Claimants referred by WPRS 27.8 13.1 17.7 61.5 63.3 61.2
Claimants not referred 26.1 25.2 15.3 6.4 4.9 9.6
Claimants exempt 0.2 0.2 0.2 0.0 0.0 0.0
Exhaustees 3.2 3.0 2.4 16.1 16.1 13.6
Neither claimants nor exhaustees 23.5 22.6 18.9 11.7 11.1 10.5
Highest Educational Level
No educational level completed 9.8 10.3 10.3 7.0 5.1 6.2
Secondary school equivalency 5.1 4.4 3.9 8.0 8.5 8.9
Secondary school graduates 31.2 30.9 29.1 34.4 35.1 34.4
Some postsecondary 16.8 15.8 15.9 15.0 13.2 12.8
Postsecondary technical or vocational certificate
2.2 2.1 2.0 2.2 3.3 3.1
Associate’s Degree 9.9 9.7 9.3 8.1 7.4 7.5
Bachelor’s Degree or higher 25.1 26.9 29.4 25.4 27.4 27.0
School Attendance
Attending school 3.4 3.2 3.3 1.0 0.6 0.7
Not attending 96.6 96.8 96.7 99.0 99.4 99.3
Preprogram Quarterly Earnings
Average Earnings $11,239 $11,695 $12,616 $12,156 $12,642 $12,574
None 7.5 6.8 5.9 9.3 8.8 8.4
$1 to $2,499 9.5 8.6 7.1 8.5 7.6 6.9
$2,500 to $4,999 15.4 14.6 13.2 11.2 9.8 10.0
$5,000 to $7,499 17.0 17.1 16.7 13.5 13.0 12.7
$7,500 to $9,999 14.2 14.6 15.0 13.2 13.3 14.9
$10,000 or more 36.4 38.3 42.1 44.3 47.4 47.2
Public Assistance Information
Any public assistance 14.4 14.7 12.7 12.0 10.6 10.1
SSI or SSDI 0.0 1.1 0.9 0.0 0.4 0.6
TANF 1.6 1.5 1.2 0.1 0.1 0.2
SNAP 14.1 14.0 11.8 11.9 10.6 9.7
Other public assistance 0.0 1.2 1.4 0.0 9.4 9.4

Dislocated Workers
PY 2019 Illinois State Data Book 128
Nation PY 2017
Nation PY 2018
Nation PY 2019
IL PY 2017
IL PY 2018
IL PY 2019
Other Characteristics
Individuals with a disability 5.2 5.0 4.7 1.6 1.7 1.4
Long-term unemployed 5.4 5.1 3.8 2.8 2.9 2.9
Exhausting TANF within 2 years 0.0 0.1 0.1 0.0 2.1 1.2
Homeless individuals or runaway youth 1.8 2.0 1.6 0.4 0.5 0.4
Ex-offenders 5.9 6.0 6.4 6.6 5.9 5.8
Low income 27.4 26.8 23.2 16.7 20.3 24.1
English language learners 2.6 3.2 3.3 1.4 1.7 2.4
Basic skills deficient 2.6 2.8 3.6 29.7 31.0 34.7
Facing substantial cultural barrier 0.4 0.6 0.8 0.2 0.1 0.3
Single parents 13.1 14.2 11.1 11.7 9.8 9.6
Displaced homemakers 2.9 2.9 1.7 0.8 0.6 0.6

Dislocated Workers
PY 2019 Illinois State Data Book 129
Table III-2 Trends in the Number of Dislocated Worker Exiters, by Reporting Period
(Derived from WIASRD and PIRL Files)
Nation PY 2017
Nation PY 2018
Nation PY 2019
IL PY 2017
IL PY 2018
IL PY 2019
Number of Exiters
All exiters 320,450 289,662 238,793 4,702 4,448 4,418
Statewide programs 11,358 9,370 8,518 585 1,005 858
Local programs 318,502 287,888 236,877 4,550 4,271 3,958
Dislocated Worker Grants 10,216 7,660 6,535 339 85 173
Disaster Recovery 2,020 1,783 1,424 0 0 15
Economic Recovery 8,196 5,877 5,111 339 85 158
Age Categories
Under 22 6,071 5,332 4,233 33 36 45
22 to 29 52,628 45,408 38,088 575 447 523
30 to 44 111,341 101,818 84,647 1,530 1,509 1,513
45 to 54 76,253 67,644 53,997 1,473 1,416 1,306
55 and older 74,153 69,455 57,822 1,091 1,040 1,030
Gender
Females 154,446 142,802 119,669 1,876 1,732 1,860
Males 165,389 146,149 118,584 2,810 2,696 2,542
Race and Ethnicity
Hispanics/Latinos 50,817 48,633 45,930 823 799 950
American Indians/Alaska Natives 6,725 6,220 4,642 29 30 38
Asians 13,907 12,537 12,647 179 193 199
Blacks or African Americans 59,694 55,329 56,890 1,475 1,305 1,373
Native Hawaiians/Pacific Islanders 2,328 2,140 2,092 10 9 10
Whites 194,650 175,148 133,797 2,504 2,377 2,187
More than one race 5,875 5,301 5,897 25 24 36
Employment Status
Employed 23,903 24,243 16,522 11 11 14
Not employed or with layoff notice 296,547 265,419 222,271 4,691 4,437 4,404
Veteran Status
Veterans 20,804 17,423 11,565 395 339 324
Disabled veterans 3,921 3,483 2,302 46 41 50
Other eligible persons 474 475 328 * 0 *
Active duty military spouses -- -- 245 -- -- 82

Dislocated Workers
PY 2019 Illinois State Data Book 130
Nation PY 2017
Nation PY 2018
Nation PY 2019
IL PY 2017
IL PY 2018
IL PY 2019
Unemployment Compensation Status
Claimants referred by RESEA 61,529 104,205 108,672 201 208 221
Claimants referred by WPRS 89,168 38,028 42,295 2,890 2,817 2,706
Claimants not referred 83,505 72,938 36,535 302 216 425
Claimants exempt 608 457 493 * 0 *
Exhaustees 10,371 8,623 5,716 756 714 599
Neither claimants nor exhaustees 75,269 65,411 45,082 552 493 466
Highest Educational Level
No educational level completed 31,379 29,714 24,677 328 228 272
Secondary school equivalency 16,216 12,767 9,213 375 379 394
Secondary school graduates 99,965 89,514 69,560 1,618 1,562 1,522
Some postsecondary 53,853 45,696 37,964 703 586 566
Postsecondary technical or vocational certificate
6,974 6,061 4,785 103 145 138
Associate’s Degree 31,583 28,016 22,294 379 328 333
Bachelor’s Degree or higher 80,480 77,894 70,300 1,196 1,220 1,193
School Attendance
Attending school 10,737 9,317 7,800 46 28 31
Not attending 309,701 280,333 230,981 4,656 4,420 4,387
Preprogram Quarterly Earnings
None 24,142 19,717 14,073 437 393 369
$1 to $2,499 30,355 24,822 16,997 402 336 303
$2,500 to $4,999 49,222 42,296 31,556 526 438 440
$5,000 to $7,499 54,392 49,584 39,923 636 580 560
$7,500 to $9,999 45,613 42,412 35,768 620 592 660
$10,000 or more 116,398 110,799 100,425 2,081 2,109 2,086
Public Assistance Information
Any public assistance 46,200 42,540 30,330 562 473 445
SSI or SSDI 0 1,579 1,979 0 * 17
TANF 5,048 4,269 2,901 * * *
SNAP 45,237 40,444 28,062 560 470 430
Other public assistance 0 1,739 3,169 0 64 280
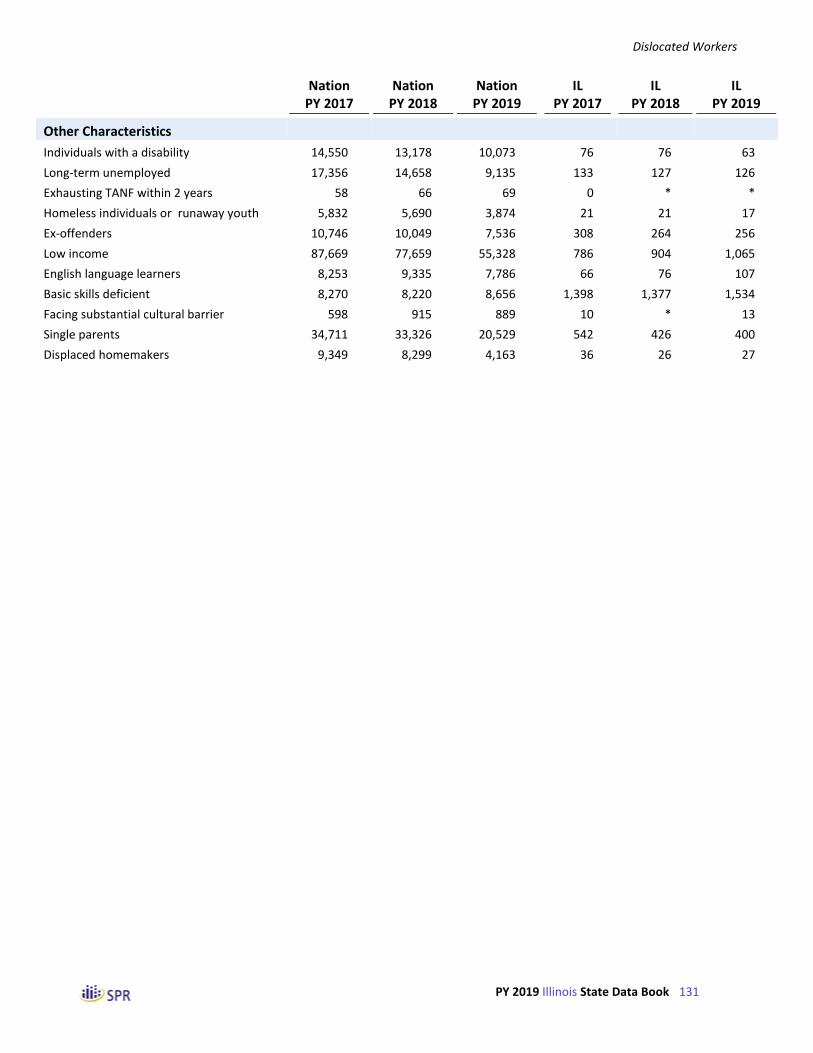
Dislocated Workers
PY 2019 Illinois State Data Book 131
Nation PY 2017
Nation PY 2018
Nation PY 2019
IL PY 2017
IL PY 2018
IL PY 2019
Other Characteristics
Individuals with a disability 14,550 13,178 10,073 76 76 63
Long-term unemployed 17,356 14,658 9,135 133 127 126
Exhausting TANF within 2 years 58 66 69 0 * *
Homeless individuals or runaway youth 5,832 5,690 3,874 21 21 17
Ex-offenders 10,746 10,049 7,536 308 264 256
Low income 87,669 77,659 55,328 786 904 1,065
English language learners 8,253 9,335 7,786 66 76 107
Basic skills deficient 8,270 8,220 8,656 1,398 1,377 1,534
Facing substantial cultural barrier 598 915 889 10 * 13
Single parents 34,711 33,326 20,529 542 426 400
Displaced homemakers 9,349 8,299 4,163 36 26 27

Dislocated Workers
PY 2019 Illinois State Data Book 132
Table III-3 Characteristics of Dislocated Workers Who Exited from April 2019 to March 2020 in IL,
by Funding Source
(Derived from PY 2019 Q4 PIRL)
Formula Funds
Total All Local Statewide DWG
Number of Exiters
All exiters 4,418 4,418 3,958 858 173
Statewide programs 858 858 398 858 *
Local programs 3,958 3,958 3,958 398 173
Dislocated Worker Grants 173 173 173 * 173
Disaster Recovery 15 15 15 0 15
Economic Recovery 158 158 158 * 158
Age Categories
Under 22 1.0 1.0 1.1 0.2 0.6
22 to 29 11.8 11.8 12.1 8.9 14.5
30 to 44 34.3 34.3 35.4 25.8 34.1
45 to 54 29.6 29.6 29.3 31.0 29.5
55 and older 23.3 23.3 22.1 34.1 21.4
Gender
Females 42.3 42.3 41.8 42.5 32.9
Males 57.7 57.7 58.2 57.5 67.1
Race and Ethnicity
Hispanics/Latinos 21.5 21.5 19.2 27.9 31.2
American Indians/Alaska Natives 1.0 1.0 1.0 0.8 0.7
Asians 5.3 5.3 4.8 11.6 5.4
Blacks or African Americans 36.4 36.4 35.7 29.6 39.5
Native Hawaiians/Pacific Islanders 0.3 0.3 0.3 0.0 0.7
Whites 58.0 58.0 59.3 58.9 55.1
More than one race 1.0 1.0 1.0 0.6 1.4
Employment Status
Employed 0.3 0.3 0.4 0.2 0.0
Not employed or with layoff notice 99.7 99.7 99.6 99.8 100.0
Veteran Status
Veterans 7.3 7.3 7.7 4.9 2.9
Disabled veterans 1.1 1.1 1.2 0.8 0.0
Other eligible persons 0.0 0.0 0.1 0.0 0.0
Active duty military spouses 1.9 1.9 0.3 8.4 0.0

Dislocated Workers
PY 2019 Illinois State Data Book 133
Formula Funds
Total All Local Statewide DWG
Unemployment Compensation Status
Claimants referred by RESEA 5.0 5.0 5.4 1.4 4.0
Claimants referred by WPRS 61.2 61.2 61.7 63.9 66.5
Claimants not referred 9.6 9.6 10.7 0.3 0.0
Claimants exempt 0.0 0.0 0.0 0.0 0.0
Exhaustees 13.6 13.6 13.3 13.9 11.6
Neither claimants nor exhaustees 10.5 10.5 8.8 20.5 17.9
Highest Educational Level
No educational level completed 6.2 6.2 3.3 17.5 3.5
Secondary school equivalency 8.9 8.9 9.1 7.3 8.1
Secondary school graduates 34.4 34.4 35.2 33.8 49.1
Some postsecondary 12.8 12.8 13.4 9.4 6.9
Postsecondary technical or vocational certificate
3.1 3.1 3.2 2.8 3.5
Associate’s Degree 7.5 7.5 8.0 5.2 4.6
Bachelor’s Degree or higher 27.0 27.0 27.8 23.9 24.3
School Attendance
Attending school 0.7 0.7 0.8 0.1 0.0
Not attending 99.3 99.3 99.2 99.9 100.0
Preprogram Quarterly Earnings
Average Earnings $12,574 $12,574 $12,348 $15,324 $12,089
None 8.4 8.4 8.5 5.8 6.4
$1 to $2,499 6.9 6.9 7.2 3.1 4.6
$2,500 to $4,999 10.0 10.0 10.5 5.5 8.7
$5,000 to $7,499 12.7 12.7 12.9 9.6 9.8
$7,500 to $9,999 14.9 14.9 14.9 14.5 20.2
$10,000 or more 47.2 47.2 46.0 61.5 50.3
Public Assistance Information
Any public assistance 10.1 10.1 10.6 4.4 6.4
SSI or SSDI 0.6 0.6 0.5 1.3 0.7
TANF 0.2 0.2 0.2 0.0 0.0
SNAP 9.7 9.7 10.2 4.2 5.8
Other public assistance 9.4 9.4 9.3 7.6 3.3

Dislocated Workers
PY 2019 Illinois State Data Book 134
Formula Funds
Total All Local Statewide DWG
Other Characteristics
Individuals with a disability 1.4 1.4 1.5 0.5 0.0
Long-term unemployed 2.9 2.9 3.2 0.2 5.8
Exhausting TANF within 2 years 1.2 1.2 1.2 0.0 50.0
Homeless individuals or runaway youth 0.4 0.4 0.4 0.2 0.0
Ex-offenders 5.8 5.8 6.2 4.0 2.3
Low income 24.1 24.1 26.1 5.7 32.9
English language learners 2.4 2.4 1.4 7.2 1.2
Basic skills deficient 34.7 34.7 32.4 44.4 49.1
Facing substantial cultural barrier 0.3 0.3 0.2 0.5 0.6
Single parents 9.6 9.6 8.4 16.3 3.5
Displaced homemakers 0.6 0.6 0.7 0.2 0.6

Dislocated Workers
PY 2019 Illinois State Data Book 135
Table III-4 Characteristics of Dislocated Workers Who Exited from April 2019 to March 2020 in IL,
by Age at Program Entry
(Derived from PY 2019 Q4 PIRL)
Under 22 22 to 29 30 to 44 45 to 54 55 and older
Number of Exiters
All exiters 45 523 1,513 1,306 1,030
Statewide programs * 76 221 266 293
Local programs 45 478 1,400 1,160 874
Dislocated Worker Grants * 25 59 51 37
Disaster Recovery 0 * * * *
Economic Recovery * 22 54 47 34
Age Categories
Under 22 100.0 0.0 0.0 0.0 0.0
22 to 29 0.0 100.0 0.0 0.0 0.0
30 to 44 0.0 0.0 100.0 0.0 0.0
45 to 54 0.0 0.0 0.0 100.0 0.0
55 and older 0.0 0.0 0.0 0.0 100.0
Gender
Females 24.4 32.2 38.4 47.2 47.5
Males 75.6 67.8 61.6 52.8 52.5
Race and Ethnicity
Hispanics/Latinos 33.3 31.4 25.2 18.3 14.9
American Indians/Alaska Natives 0.0 1.8 1.1 1.2 0.3
Asians 0.0 1.8 4.1 7.1 6.5
Blacks or African Americans 28.9 45.5 42.7 33.6 27.2
Native Hawaiians/Pacific Islanders 0.0 0.9 0.2 0.2 0.2
Whites 73.7 51.6 52.9 59.2 66.2
More than one race 2.6 1.1 1.0 1.2 0.4
Employment Status
Employed 0.0 0.6 0.2 0.4 0.3
Not employed or with layoff notice 100.0 99.4 99.8 99.6 99.7
Veteran Status
Veterans 6.7 10.1 6.6 7.4 6.9
Disabled veterans 0.0 1.5 0.9 1.1 1.5
Other eligible persons 0.0 0.0 0.0 0.0 0.2
Active duty military spouses 0.0 3.4 1.5 2.1 1.3
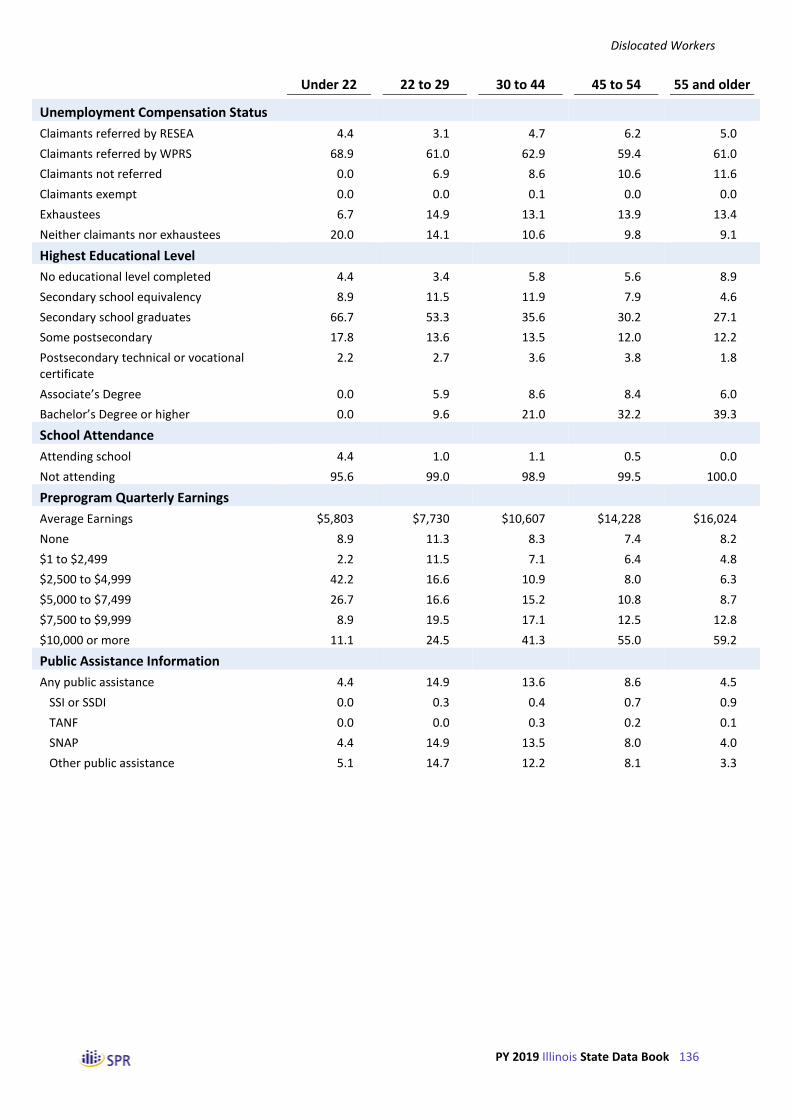
Dislocated Workers
PY 2019 Illinois State Data Book 136
Under 22 22 to 29 30 to 44 45 to 54 55 and older
Unemployment Compensation Status
Claimants referred by RESEA 4.4 3.1 4.7 6.2 5.0
Claimants referred by WPRS 68.9 61.0 62.9 59.4 61.0
Claimants not referred 0.0 6.9 8.6 10.6 11.6
Claimants exempt 0.0 0.0 0.1 0.0 0.0
Exhaustees 6.7 14.9 13.1 13.9 13.4
Neither claimants nor exhaustees 20.0 14.1 10.6 9.8 9.1
Highest Educational Level
No educational level completed 4.4 3.4 5.8 5.6 8.9
Secondary school equivalency 8.9 11.5 11.9 7.9 4.6
Secondary school graduates 66.7 53.3 35.6 30.2 27.1
Some postsecondary 17.8 13.6 13.5 12.0 12.2
Postsecondary technical or vocational certificate
2.2 2.7 3.6 3.8 1.8
Associate’s Degree 0.0 5.9 8.6 8.4 6.0
Bachelor’s Degree or higher 0.0 9.6 21.0 32.2 39.3
School Attendance
Attending school 4.4 1.0 1.1 0.5 0.0
Not attending 95.6 99.0 98.9 99.5 100.0
Preprogram Quarterly Earnings
Average Earnings $5,803 $7,730 $10,607 $14,228 $16,024
None 8.9 11.3 8.3 7.4 8.2
$1 to $2,499 2.2 11.5 7.1 6.4 4.8
$2,500 to $4,999 42.2 16.6 10.9 8.0 6.3
$5,000 to $7,499 26.7 16.6 15.2 10.8 8.7
$7,500 to $9,999 8.9 19.5 17.1 12.5 12.8
$10,000 or more 11.1 24.5 41.3 55.0 59.2
Public Assistance Information
Any public assistance 4.4 14.9 13.6 8.6 4.5
SSI or SSDI 0.0 0.3 0.4 0.7 0.9
TANF 0.0 0.0 0.3 0.2 0.1
SNAP 4.4 14.9 13.5 8.0 4.0
Other public assistance 5.1 14.7 12.2 8.1 3.3

Dislocated Workers
PY 2019 Illinois State Data Book 137
Under 22 22 to 29 30 to 44 45 to 54 55 and older
Other Characteristics
Individuals with a disability 2.2 0.6 1.5 1.8 1.3
Long-term unemployed 4.4 4.0 3.0 3.1 1.7
Exhausting TANF within 2 years 0.0 0.0 1.3 2.4 0.0
Homeless individuals or runaway youth 0.0 0.0 0.5 0.3 0.6
Ex-offenders 2.2 7.3 9.3 4.5 1.9
Low income 26.7 33.5 30.3 21.1 14.0
English language learners 0.0 1.3 2.5 2.1 3.3
Basic skills deficient 46.7 36.1 36.1 32.9 33.7
Facing substantial cultural barrier 0.0 0.4 0.5 0.2 0.2
Single parents 4.7 10.1 12.8 8.8 6.0
Displaced homemakers 2.2 1.0 0.7 0.5 0.3

Dislocated Workers
PY 2019 Illinois State Data Book 138
Table III-5 Characteristics of Dislocated Workers Who Exited from April 2019 to March 2020 in IL,
by Ethnicity and Race (Derived from PY 2019 Q4 PIRL)
Ethnicity Race
Hispanic Not Hispanic White Only Black Only Other
Number of Exiters
All exiters 950 3,459 2,159 1,352 257
Statewide programs 239 619 388 195 83
Local programs 758 3,191 2,023 1,213 220
Dislocated Worker Grants 54 119 80 56 11
Disaster Recovery * 13 10 * *
Economic Recovery 52 106 70 53 9
Age Categories
Under 22 1.6 0.9 1.3 0.7 0.4
22 to 29 17.3 10.4 10.4 14.6 8.2
30 to 44 40.0 32.6 30.4 39.1 28.0
45 to 54 25.1 30.8 30.4 27.6 37.7
55 and older 16.1 25.3 27.5 18.0 25.7
Gender
Females 34.9 44.3 38.9 49.2 46.3
Males 65.1 55.7 61.1 50.8 53.7
Race and Ethnicity
Hispanics/Latinos 100.0 0.0 19.5 1.6 10.5
American Indians/Alaska Natives 3.4 0.7 0.0 0.0 14.8
Asians 1.1 5.9 0.0 0.0 77.4
Blacks or African Americans 4.9 40.9 0.0 100.0 8.2
Native Hawaiians/Pacific Islanders 1.1 0.2 0.0 0.0 3.9
Whites 91.3 53.3 100.0 0.0 10.9
More than one race 1.7 0.8 0.0 0.0 14.0
Employment Status
Employed 0.2 0.3 0.3 0.4 0.8
Not employed or with layoff notice 99.8 99.7 99.7 99.6 99.2
Veteran Status
Veterans 6.9 7.5 7.6 8.1 4.3
Disabled veterans 0.8 1.2 1.3 1.3 1.2
Other eligible persons 0.0 0.1 0.0 0.1 0.0
Active duty military spouses 2.9 1.6 1.3 2.9 0.4

Dislocated Workers
PY 2019 Illinois State Data Book 139
Ethnicity Race
Hispanic Not Hispanic White Black Other Race
Unemployment Compensation Status
Claimants referred by RESEA 3.7 5.3 6.5 3.3 1.9
Claimants referred by WPRS 68.3 59.5 61.9 57.0 73.9
Claimants not referred 8.0 9.9 8.2 11.1 4.3
Claimants exempt 0.0 0.0 0.0 0.0 0.0
Exhaustees 9.4 14.7 11.9 18.4 12.8
Neither claimants nor exhaustees 10.6 10.5 11.5 10.2 7.0
Highest Educational Level
No educational level completed 19.2 2.5 3.6 3.6 3.5
Secondary school equivalency 15.9 7.0 8.1 8.8 3.9
Secondary school graduates 37.9 33.5 34.0 39.3 17.5
Some postsecondary 8.0 14.1 13.6 13.7 8.2
Postsecondary technical or vocational certificate
1.8 3.4 3.8 3.2 0.4
Associate’s Degree 5.2 8.2 8.1 8.7 3.9
Bachelor’s Degree or higher 12.1 31.2 28.9 22.9 62.6
School Attendance
Attending school 0.2 0.8 1.0 0.4 0.4
Not attending 99.8 99.2 99.0 99.6 99.6
Preprogram Quarterly Earnings
Average Earnings $11,166 $12,986 $13,687 $10,062 $19,535
None 5.2 9.3 7.6 10.4 9.3
$1 to $2,499 4.5 7.5 5.3 10.9 3.9
$2,500 to $4,999 7.3 10.7 7.8 15.2 6.6
$5,000 to $7,499 15.4 11.9 12.1 13.2 6.6
$7,500 to $9,999 20.3 13.5 15.2 14.0 7.4
$10,000 or more 47.4 47.2 52.0 36.4 66.1
Public Assistance Information
Any public assistance 6.0 11.2 7.8 15.6 7.0
SSI or SSDI 0.2 0.7 0.6 0.6 0.6
TANF 0.3 0.1 0.1 0.1 0.4
SNAP 5.7 10.8 7.5 15.4 6.2
Other public assistance 5.5 10.4 6.9 14.8 5.9

Dislocated Workers
PY 2019 Illinois State Data Book 140
Ethnicity Race
Hispanic Not Hispanic White Only Black Only Other
Other Characteristics
Individuals with a disability 1.4 1.4 1.6 1.1 1.9
Long-term unemployed 1.6 3.2 1.6 5.2 4.7
Exhausting TANF within 2 years 0.0 1.5 1.4 1.1 0.0
Homeless individuals or runaway youth 0.2 0.4 0.2 0.7 0.4
Ex-offenders 4.0 6.3 5.4 8.0 2.7
Low income 24.9 23.9 17.6 36.1 16.7
English language learners 8.4 0.8 1.8 0.6 2.7
Basic skills deficient 52.6 29.9 29.9 37.9 26.8
Facing substantial cultural barrier 0.4 0.3 0.1 0.4 0.8
Single parents 8.9 9.9 8.6 11.7 8.0
Displaced homemakers 0.1 0.8 0.9 0.3 0.4

Dislocated Workers
PY 2019 Illinois State Data Book 141
Table III-6 Characteristics of Dislocated Workers Who Exited from April 2019 to March 2020 in IL,
by Gender, Employment Status, and Disability Status (Derived from PY 2019 Q4 PIRL)
Gender Employment Status Has a
Female Male Employed Not Employed Disability
Number of Exiters
All exiters 1,860 2,542 14 4,404 63
Statewide programs 364 492 * 856 *
Local programs 1,649 2,295 14 3,944 61
Dislocated Worker Grants 57 116 0 173 0
Disaster Recovery * 10 0 15 0
Economic Recovery 52 106 0 158 0
Age Categories
Under 22 0.6 1.3 0.0 1.0 1.6
22 to 29 9.0 13.9 21.4 11.8 4.8
30 to 44 31.1 36.5 21.4 34.3 34.9
45 to 54 33.0 27.0 35.7 29.5 38.1
55 and older 26.3 21.2 21.4 23.3 20.6
Gender
Females 100.0 0.0 28.6 42.3 33.3
Males 0.0 100.0 71.4 57.7 66.7
Race and Ethnicity
Hispanics/Latinos 17.8 24.3 14.3 21.6 20.6
American Indians/Alaska Natives 0.7 1.2 0.0 1.0 5.5
Asians 6.0 4.7 14.3 5.2 3.6
Blacks or African Americans 41.5 32.6 35.7 36.4 29.1
Native Hawaiians/Pacific Islanders 0.2 0.3 0.0 0.3 0.0
Whites 52.4 62.3 57.1 58.0 65.5
More than one race 0.9 1.0 7.1 0.9 3.6
Employment Status
Employed 0.2 0.4 100.0 0.0 0.0
Not employed or with layoff notice 99.8 99.6 0.0 100.0 100.0
Veteran Status
Veterans 2.8 10.7 21.4 7.3 58.7
Disabled veterans 0.6 1.5 0.0 1.1 55.6
Other eligible persons 0.1 0.0 0.0 0.0 0.0
Active duty military spouses 1.9 1.8 0.0 1.9 0.0

Dislocated Workers
PY 2019 Illinois State Data Book 142
Gender Employment Status Has a
Female Male Employed Not Employed Disability
Unemployment Compensation Status
Claimants referred by RESEA 7.0 3.4 0.0 5.0 6.3
Claimants referred by WPRS 59.4 62.8 42.9 61.3 38.1
Claimants not referred 9.8 9.3 35.7 9.5 27.0
Claimants exempt 0.0 0.0 0.0 0.0 0.0
Exhaustees 13.8 13.4 7.1 13.6 12.7
Neither claimants nor exhaustees 9.9 11.0 14.3 10.5 15.9
Highest Educational Level
No educational level completed 6.2 6.1 0.0 6.2 1.6
Secondary school equivalency 7.9 9.6 7.1 8.9 4.8
Secondary school graduates 28.7 38.7 35.7 34.4 27.0
Some postsecondary 14.4 11.5 28.6 12.8 11.1
Postsecondary technical or vocational certificate
3.2 3.0 7.1 3.1 1.6
Associate’s Degree 8.0 7.3 0.0 7.6 17.5
Bachelor’s Degree or higher 31.6 23.7 21.4 27.0 36.5
School Attendance
Attending school 0.9 0.6 7.1 0.7 3.2
Not attending 99.1 99.4 92.9 99.3 96.8
Preprogram Quarterly Earnings
Average Earnings $11,524 $13,374 $7,961 $12,590 $8,044
None 7.7 8.8 0.0 8.4 9.5
$1 to $2,499 8.7 5.4 14.3 6.8 23.8
$2,500 to $4,999 12.3 8.3 28.6 9.9 9.5
$5,000 to $7,499 14.8 11.2 14.3 12.7 12.7
$7,500 to $9,999 14.5 15.2 7.1 15.0 22.2
$10,000 or more 42.0 51.1 35.7 47.3 22.2
Public Assistance Information
Any public assistance 14.2 7.0 14.3 10.1 15.9
SSI or SSDI 0.7 0.5 0.0 0.6 4.2
TANF 0.3 0.1 0.0 0.2 0.0
SNAP 13.8 6.8 14.3 9.7 14.3
Other public assistance 14.1 6.5 12.5 9.4 6.3

Dislocated Workers
PY 2019 Illinois State Data Book 143
Gender Employment Status Has a
Female Male Employed Not Employed Disability
Other Characteristics
Individuals with a disability 1.1 1.7 0.0 1.4 100.0
Long-term unemployed 3.0 2.8 0.0 2.9 7.9
Exhausting TANF within 2 years 1.4 1.0 0.0 1.2 3.7
Homeless individuals or runaway youth 0.3 0.5 7.1 0.4 4.8
Ex-offenders 2.5 8.3 23.1 5.8 4.8
Low income 27.0 22.1 28.6 24.1 25.4
English language learners 3.4 1.7 14.3 2.4 1.6
Basic skills deficient 34.6 34.9 21.4 34.8 15.9
Facing substantial cultural barrier 0.5 0.2 0.0 0.3 0.0
Single parents 15.2 5.5 18.2 9.6 14.8
Displaced homemakers 1.1 0.3 0.0 0.6 3.2

Dislocated Workers
PY 2019 Illinois State Data Book 144
Table III-7 Characteristics of Dislocated Workers Who Exited from April 2019 to March 2020 in IL,
by Other Employment Characteristics
(Derived from PY 2019 Q4 PIRL)
Unemployment Compensation Status Long-Term Displaced Claimant Exhaustee Neither Unemployed Homemaker
Number of Exiters
All exiters 3,353 599 466 126 27
Statewide programs 563 119 176 * *
Local programs 3,080 528 350 126 26
Dislocated Worker Grants 122 20 31 10 *
Disaster Recovery 9 0 * 0 0
Economic Recovery 113 20 25 10 *
Age Categories
Under 22 1.0 0.5 1.9 1.6 3.7
22 to 29 11.1 13.0 15.9 16.7 18.5
30 to 44 34.4 33.1 34.5 35.7 40.7
45 to 54 29.7 30.4 27.5 31.7 25.9
55 and older 23.8 23.0 20.2 14.3 11.1
Gender
Females 42.5 43.0 39.9 43.7 74.1
Males 57.5 57.0 60.1 56.3 25.9
Race and Ethnicity
Hispanics/Latinos 22.7 14.9 21.7 11.9 3.7
American Indians/Alaska Natives 0.9 1.5 1.0 2.6 0.0
Asians 5.8 4.1 3.2 6.9 4.0
Blacks or African Americans 34.7 47.1 34.4 62.1 16.0
Native Hawaiians/Pacific Islanders 0.3 0.2 0.2 0.9 0.0
Whites 59.3 48.8 61.9 30.2 80.0
More than one race 0.8 1.7 0.7 2.6 0.0
Employment Status
Employed 0.3 0.2 0.4 0.0 0.0
Not employed or with layoff notice 99.7 99.8 99.6 100.0 100.0
Veteran Status
Veterans 6.0 7.0 17.4 7.1 11.1
Disabled veterans 1.1 0.8 1.9 0.0 0.0
Other eligible persons 0.1 0.0 0.0 0.0 0.0
Active duty military spouses 0.7 0.2 12.4 0.0 7.4

Dislocated Workers
PY 2019 Illinois State Data Book 145
Unemployment Compensation Status Long-Term Displaced Claimant Exhaustee Neither Unemployed Homemaker
Unemployment Compensation Status
Claimants referred by RESEA 6.6 0.0 0.0 3.2 3.7
Claimants referred by WPRS 80.7 0.0 0.0 34.1 14.8
Claimants not referred 12.7 0.0 0.0 1.6 0.0
Claimants exempt 0.0 0.0 0.0 0.0 0.0
Exhaustees 0.0 100.0 0.0 57.9 7.4
Neither claimants nor exhaustees 0.0 0.0 100.0 3.2 74.1
Highest Educational Level
No educational level completed 6.9 3.8 3.9 2.4 0.0
Secondary school equivalency 8.6 10.9 8.6 10.3 7.4
Secondary school graduates 33.1 32.7 46.1 34.1 29.6
Some postsecondary 12.6 12.7 14.6 11.9 14.8
Postsecondary technical or vocational certificate
3.0 3.0 3.9 3.2 3.7
Associate’s Degree 7.8 5.0 9.0 6.3 11.1
Bachelor’s Degree or higher 27.9 31.9 13.9 31.7 33.3
School Attendance
Attending school 0.4 1.0 2.1 1.6 3.7
Not attending 99.6 99.0 97.9 98.4 96.3
Preprogram Quarterly Earnings
Average Earnings $13,059 $9,199 $12,160 $9,329 $8,705
None 3.6 30.6 13.9 36.5 51.9
$1 to $2,499 5.1 16.7 6.9 16.7 7.4
$2,500 to $4,999 9.1 14.5 10.1 8.7 14.8
$5,000 to $7,499 13.2 11.0 11.2 7.9 7.4
$7,500 to $9,999 16.6 6.8 13.7 9.5 7.4
$10,000 or more 52.4 20.4 44.2 20.6 11.1
Public Assistance Information
Any public assistance 8.9 17.7 8.8 17.5 25.9
SSI or SSDI 0.4 0.9 1.5 0.0 0.0
TANF 0.2 0.0 0.0 0.0 0.0
SNAP 8.6 17.7 7.9 17.5 25.9
Other public assistance 8.0 20.9 7.1 13.5 12.5

Dislocated Workers
PY 2019 Illinois State Data Book 146
Unemployment Compensation Status Long-Term Displaced Claimant Exhaustee Neither Unemployed Homemaker
Other Characteristics
Individuals with a disability 1.3 1.3 2.2 4.0 7.4
Long-term unemployed 1.5 12.2 0.9 100.0 7.4
Exhausting TANF within 2 years 0.7 0.0 7.3 0.0 0.0
Homeless individuals or runaway youth 0.5 0.0 0.2 0.0 0.0
Ex-offenders 5.8 7.2 4.5 3.2 3.7
Low income 22.8 33.7 21.2 44.4 29.6
English language learners 2.3 1.8 3.9 1.6 3.7
Basic skills deficient 34.2 37.1 35.2 42.1 18.5
Facing substantial cultural barrier 0.2 0.0 1.1 0.8 3.7
Single parents 9.1 10.4 12.5 2.4 44.4
Displaced homemakers 0.1 0.3 4.3 1.6 100.0

Dislocated Workers
PY 2019 Illinois State Data Book 147
Table III-8 Characteristics of Dislocated Workers Who Exited from April 2019 to March 2020 in IL,
by Veteran Status and Selected Barriers to Employment
(Derived from PY 2019 Q4 PIRL)
Veterans Receives
TANF Low
Income
Basic Skills/English
Deficient
Number of Exiters
All exiters 324 * 1,065 1,567
Statewide programs 42 * 49 395
Local programs 304 * 1,033 1,306
Dislocated Worker Grants * * 57 86
Disaster Recovery 0 * * 12
Economic Recovery * * 55 74
Age Categories
Under 22 0.9 * 1.1 1.3
22 to 29 16.4 * 16.4 12.3
30 to 44 30.9 * 43.0 35.6
45 to 54 29.9 * 25.8 28.2
55 and older 21.9 * 13.5 22.6
Gender
Females 16.1 * 47.2 42.3
Males 83.9 * 52.8 57.7
Race and Ethnicity
Hispanics/Latinos 20.4 * 22.3 33.1
American Indians/Alaska Natives 2.1 * 1.5 1.3
Asians 1.8 * 2.5 3.9
Blacks or African Americans 39.1 * 54.6 42.1
Native Hawaiians/Pacific Islanders 0.0 * 0.3 0.3
Whites 59.2 * 42.7 53.5
More than one race 2.1 * 1.4 1.0
Employment Status
Employed 0.9 * 0.4 0.3
Not employed or with layoff notice 99.1 * 99.6 99.7
Veteran Status
Veterans 100.0 * 8.7 4.7
Disabled veterans 15.4 * 1.0 0.5
Other eligible persons 0.0 * 0.0 0.0
Active duty military spouses 2.5 * 0.4 2.0

Dislocated Workers
PY 2019 Illinois State Data Book 148
Veterans Receives
TANF Low
Income
Basic Skills/English
Deficient
Unemployment Compensation Status
Claimants referred by RESEA 2.8 * 3.8 4.5
Claimants referred by WPRS 34.9 * 62.2 68.8
Claimants not referred 24.1 * 5.8 1.3
Claimants exempt 0.3 * 0.0 0.0
Exhaustees 13.0 * 19.0 14.4
Neither claimants nor exhaustees 25.0 * 9.3 11.0
Highest Educational Level
No educational level completed 0.3 * 4.2 12.4
Secondary school equivalency 5.9 * 12.9 12.1
Secondary school graduates 40.4 * 40.0 44.2
Some postsecondary 16.7 * 11.0 10.0
Postsecondary technical or vocational certificate
3.7 * 3.0 3.0
Associate’s Degree 12.3 * 7.0 6.8
Bachelor’s Degree or higher 20.7 * 21.9 11.6
School Attendance
Attending school 0.9 * 0.8 0.4
Not attending 99.1 * 99.2 99.6
Preprogram Quarterly Earnings
Average Earnings $11,867 * $8,805 $10,717
None 20.1 * 12.4 7.3
$1 to $2,499 9.6 * 13.0 7.0
$2,500 to $4,999 5.9 * 16.2 10.5
$5,000 to $7,499 10.8 * 15.1 15.3
$7,500 to $9,999 13.9 * 15.7 17.8
$10,000 or more 39.8 * 27.7 42.0
Public Assistance Information
Any public assistance 7.4 * 41.6 12.3
SSI or SSDI 1.1 * 1.8 0.4
TANF 0.0 * 0.7 0.2
SNAP 6.8 * 40.4 12.1
Other public assistance 3.8 * 34.2 12.7

Dislocated Workers
PY 2019 Illinois State Data Book 149
Veterans Receives
TANF Low
Income
Basic Skills/English
Deficient
Other Characteristics
Individuals with a disability 11.5 * 1.5 0.6
Long-term unemployed 2.8 * 5.3 3.4
Exhausting TANF within 2 years 2.2 * 3.1 0.0
Homeless individuals or runaway youth 3.1 * 1.3 0.3
Ex-offenders 4.0 * 8.8 8.2
Low income 28.7 * 100.0 28.7
English language learners 1.2 * 1.4 6.8
Basic skills deficient 22.2 * 41.9 97.9
Facing substantial cultural barrier 0.0 * 0.7 0.6
Single parents 8.5 * 10.1 11.6
Displaced homemakers 0.9 * 0.8 0.4

Dislocated Workers
PY 2019 Illinois State Data Book 150
Table III-9 Characteristics of Dislocated Workers Who Exited from April 2019 to March 2020 in IL,
by Highest Educational Level
(Derived from PY 2019 Q4 PIRL)
No Level Completed
HS Graduate or
Equivalent Some Post-secondary
Technical or Vocational Certificate
Post-secondary
Degree
Number of Exiters
All exiters 272 1,916 566 138 1,526
Statewide programs 150 353 81 24 250
Local programs 131 1,752 531 127 1,417
Dislocated Worker Grants * 99 12 * 50
Disaster Recovery 0 * 0 0 *
Economic Recovery * 91 12 * 43
Age Categories
Under 22 0.7 1.8 1.4 0.7 0.0
22 to 29 6.6 17.7 12.5 10.1 5.3
30 to 44 32.0 37.5 36.0 39.9 29.4
45 to 54 26.8 26.0 27.7 35.5 34.7
55 and older 33.8 17.0 22.3 13.8 30.6
Gender
Females 42.6 35.6 47.9 43.8 48.3
Males 57.4 64.4 52.1 56.2 51.7
Race and Ethnicity
Hispanics/Latinos 67.7 26.7 13.5 12.5 10.7
American Indians/Alaska Natives 1.5 1.2 1.2 0.8 0.6
Asians 5.2 1.5 2.0 0.0 11.2
Blacks or African Americans 35.8 40.8 38.2 34.4 31.0
Native Hawaiians/Pacific Islanders 0.0 0.4 0.4 0.0 0.1
Whites 57.5 57.0 60.0 65.6 57.9
More than one race 0.0 0.9 1.6 0.8 0.9
Employment Status
Employed 0.0 0.3 0.7 0.7 0.2
Not employed or with layoff notice 100.0 99.7 99.3 99.3 99.8
Veteran Status
Veterans 0.4 7.8 9.5 8.7 7.0
Disabled veterans 0.0 1.1 1.2 0.7 1.4
Other eligible persons 0.0 0.1 0.0 0.0 0.1
Active duty military spouses 2.6 2.3 2.3 1.4 1.0

Dislocated Workers
PY 2019 Illinois State Data Book 151
No Level Completed
HS Grad or Equivalent
Some Post-secondary
Tech/Voc Certificate
Post-Sec. Degree
Unemployment Compensation Status
Claimants referred by RESEA 2.9 5.5 8.0 5.1 3.7
Claimants referred by WPRS 73.2 60.4 46.3 52.9 66.5
Claimants not referred 8.8 7.2 20.3 15.9 8.3
Claimants exempt 0.0 0.1 0.0 0.0 0.0
Exhaustees 8.5 13.6 13.4 13.0 14.5
Neither claimants nor exhaustees 6.6 13.3 12.0 13.0 7.0
Highest Educational Level
No educational level completed 100.0 0.0 0.0 0.0 0.0
Secondary school equivalency 0.0 20.6 0.0 0.0 0.0
Secondary school graduates 0.0 79.4 0.0 0.0 0.0
Some postsecondary 0.0 0.0 100.0 0.0 0.0
Postsecondary technical or vocational certificate
0.0 0.0 0.0 100.0 0.0
Associate’s Degree 0.0 0.0 0.0 0.0 21.8
Bachelor’s Degree or higher 0.0 0.0 0.0 0.0 78.2
School Attendance
Attending school 0.4 0.5 1.8 1.4 0.5
Not attending 99.6 99.5 98.2 98.6 99.5
Preprogram Quarterly Earnings
Average Earnings $9,707 $10,131 $10,106 $10,284 $17,341
None 5.1 8.2 8.7 5.8 9.2
$1 to $2,499 5.1 8.0 7.4 11.6 5.0
$2,500 to $4,999 8.1 11.3 14.0 10.9 7.1
$5,000 to $7,499 18.4 15.6 13.6 13.8 7.5
$7,500 to $9,999 23.9 18.0 15.7 13.0 9.4
$10,000 or more 39.3 38.8 40.6 44.9 61.8
Public Assistance Information
Any public assistance 8.1 11.9 11.3 15.2 7.2
SSI or SSDI 1.7 0.4 0.5 2.2 0.6
TANF 0.0 0.2 0.0 0.0 0.2
SNAP 7.7 11.6 11.0 14.5 6.8
Other public assistance 8.6 11.7 8.5 17.6 6.1

Dislocated Workers
PY 2019 Illinois State Data Book 152
No Level Completed
HS Grad or Equivalent
Some Post-secondary
Tech/Voc Certificate
Post-Sec. Degree
Other Characteristics
Individuals with a disability 0.4 1.0 1.2 0.7 2.2
Long-term unemployed 1.1 2.9 2.7 2.9 3.1
Exhausting TANF within 2 years 0.0 1.9 1.4 0.0 0.6
Homeless individuals or runaway youth 0.7 0.2 0.4 0.7 0.6
Ex-offenders 5.9 8.1 7.0 13.2 1.9
Low income 16.5 29.4 20.7 23.2 20.2
English language learners 15.1 2.1 1.6 2.2 0.9
Basic skills deficient 68.8 45.4 26.5 33.3 18.5
Facing substantial cultural barrier 0.7 0.3 0.2 0.0 0.3
Single parents 13.3 9.2 14.0 13.6 7.7
Displaced homemakers 0.0 0.5 0.7 0.7 0.8

Dislocated Workers
PY 2019 Illinois State Data Book 153
Table III-10 Characteristics of Dislocated Workers Who Exited from April 2019 to March 2020 in IL,
by Selected Other Characteristics
(Derived from PY 2019 Q4 PIRL)
School Status Single
Attending Not Attending Ex-Offenders Homeless Parents
Number of Exiters
All exiters 31 4,387 256 17 400
Statewide programs * 857 34 * 140
Local programs 31 3,927 246 16 311
Dislocated Worker Grants 0 173 * 0 *
Disaster Recovery 0 15 * 0 *
Economic Recovery 0 158 * 0 *
Age Categories
Under 22 6.5 1.0 0.4 0.0 0.5
22 to 29 16.1 11.8 14.8 0.0 12.3
30 to 44 54.8 34.1 54.7 41.2 45.6
45 to 54 22.6 29.6 22.7 23.5 27.1
55 and older 0.0 23.5 7.4 35.3 14.5
Gender
Females 54.8 42.2 18.0 29.4 67.1
Males 45.2 57.8 82.0 70.6 32.9
Race and Ethnicity
Hispanics/Latinos 6.5 21.7 14.9 11.8 19.8
American Indians/Alaska Natives 3.6 1.0 2.2 0.0 1.5
Asians 0.0 5.3 0.4 6.7 3.8
Blacks or African Americans 21.4 36.6 47.2 66.7 43.9
Native Hawaiians/Pacific Islanders 0.0 0.3 0.0 0.0 0.3
Whites 75.0 57.9 51.9 26.7 52.0
More than one race 0.0 1.0 1.7 0.0 1.2
Employment Status
Employed 3.2 0.3 1.2 5.9 0.5
Not employed or with layoff notice 96.8 99.7 98.8 94.1 99.5
Veteran Status
Veterans 9.7 7.3 5.1 58.8 6.3
Disabled veterans 3.2 1.1 0.4 17.6 1.3
Other eligible persons 0.0 0.0 0.0 0.0 0.0
Active duty military spouses 3.2 1.8 0.8 0.0 4.3

Dislocated Workers
PY 2019 Illinois State Data Book 154
School Status Single
Attending Not Attending Ex-Offenders Homeless Parents
Unemployment Compensation Status
Claimants referred by RESEA 0.0 5.0 5.9 0.0 3.0
Claimants referred by WPRS 41.9 61.4 64.5 47.1 60.3
Claimants not referred 6.5 9.6 4.7 47.1 7.8
Claimants exempt 0.0 0.0 0.0 0.0 0.0
Exhaustees 19.4 13.5 16.8 0.0 15.5
Neither claimants nor exhaustees 32.3 10.4 8.2 5.9 13.5
Highest Educational Level
No educational level completed 3.2 6.2 6.3 11.8 8.5
Secondary school equivalency 3.2 9.0 23.8 11.8 10.3
Secondary school graduates 29.0 34.5 36.3 5.9 32.0
Some postsecondary 32.3 12.7 15.2 11.8 17.3
Postsecondary technical or vocational certificate
6.5 3.1 7.0 5.9 4.3
Associate’s Degree 16.1 7.5 4.7 0.0 10.5
Bachelor’s Degree or higher 9.7 27.1 6.6 52.9 17.3
School Attendance
Attending school 100.0 0.0 1.6 0.0 2.0
Not attending 0.0 100.0 98.4 100.0 98.0
Preprogram Quarterly Earnings
Average Earnings $5,877 $12,617 $8,129 $8,168 $10,082
None 16.1 8.3 7.4 23.5 6.3
$1 to $2,499 22.6 6.7 12.5 23.5 10.5
$2,500 to $4,999 22.6 9.9 14.8 0.0 14.3
$5,000 to $7,499 9.7 12.7 18.4 17.6 15.0
$7,500 to $9,999 19.4 14.9 18.8 17.6 16.8
$10,000 or more 9.7 47.5 28.1 17.6 37.3
Public assistance Information
Any public assistance 25.8 10.0 28.1 29.4 24.3
SSI or SSDI 0.0 0.6 1.0 8.3 1.4
TANF 0.0 0.2 0.4 0.0 0.3
SNAP 25.8 9.6 27.0 29.4 24.0
Other public assistance 21.1 9.3 26.0 0.0 24.5
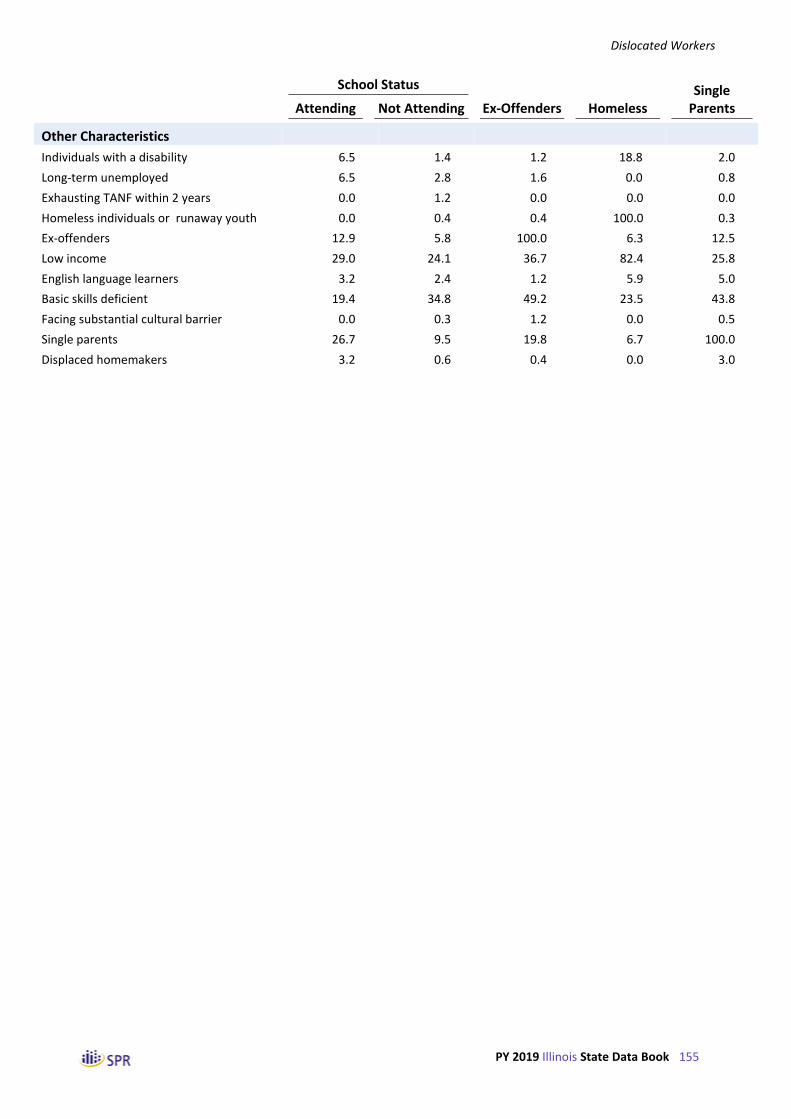
Dislocated Workers
PY 2019 Illinois State Data Book 155
School Status Single
Attending Not Attending Ex-Offenders Homeless Parents
Other Characteristics
Individuals with a disability 6.5 1.4 1.2 18.8 2.0
Long-term unemployed 6.5 2.8 1.6 0.0 0.8
Exhausting TANF within 2 years 0.0 1.2 0.0 0.0 0.0
Homeless individuals or runaway youth 0.0 0.4 0.4 100.0 0.3
Ex-offenders 12.9 5.8 100.0 6.3 12.5
Low income 29.0 24.1 36.7 82.4 25.8
English language learners 3.2 2.4 1.2 5.9 5.0
Basic skills deficient 19.4 34.8 49.2 23.5 43.8
Facing substantial cultural barrier 0.0 0.3 1.2 0.0 0.5
Single parents 26.7 9.5 19.8 6.7 100.0
Displaced homemakers 3.2 0.6 0.4 0.0 3.0

Dislocated Workers
PY 2019 Illinois State Data Book 156
Table III-11 Characteristics of Dislocated Workers Who Exited from April 2019 to March 2020 in IL,
by Major Service Categories
(Derived from PY 2019 Q4 PIRL)
Received Career Services
All Exiters Basic Individualized
Only Career Services
Received Training
Number of Exiters
All exiters 4,418 4,417 3,977 1,512 2,905
Statewide programs 858 858 858 185 673
Local programs 3,958 3,957 3,517 1,384 2,573
Dislocated Worker Grants 173 173 173 42 131
Disaster Recovery 15 15 15 0 15
Economic Recovery 158 158 158 42 116
Age Categories
Under 22 1.0 1.0 1.1 0.8 1.1
22 to 29 11.8 11.8 12.1 10.5 12.6
30 to 44 34.3 34.3 34.3 29.5 36.8
45 to 54 29.6 29.6 29.5 31.0 28.8
55 and older 23.3 23.3 23.0 28.3 20.7
Gender
Females 42.3 42.2 42.0 46.5 40.0
Males 57.7 57.8 58.0 53.5 60.0
Race and Ethnicity
Hispanics/Latinos 21.5 21.6 21.8 20.6 22.1
American Indians/Alaska Natives 1.0 1.0 1.1 1.3 0.8
Asians 5.3 5.3 5.7 2.9 6.5
Blacks or African Americans 36.4 36.4 35.7 41.3 34.0
Native Hawaiians/Pacific Islanders 0.3 0.3 0.2 0.3 0.2
Whites 58.0 58.0 58.4 55.3 59.4
More than one race 1.0 1.0 1.1 1.1 0.9
Employment Status
Employed 0.3 0.3 0.3 0.4 0.3
Not employed or with layoff notice 99.7 99.7 99.7 99.6 99.7
Veteran Status
Veterans 7.3 7.3 6.8 9.7 6.1
Disabled veterans 1.1 1.1 1.1 2.1 0.7
Other eligible persons 0.0 0.0 0.0 0.1 0.0
Active duty military spouses 1.9 1.9 2.1 1.5 2.0
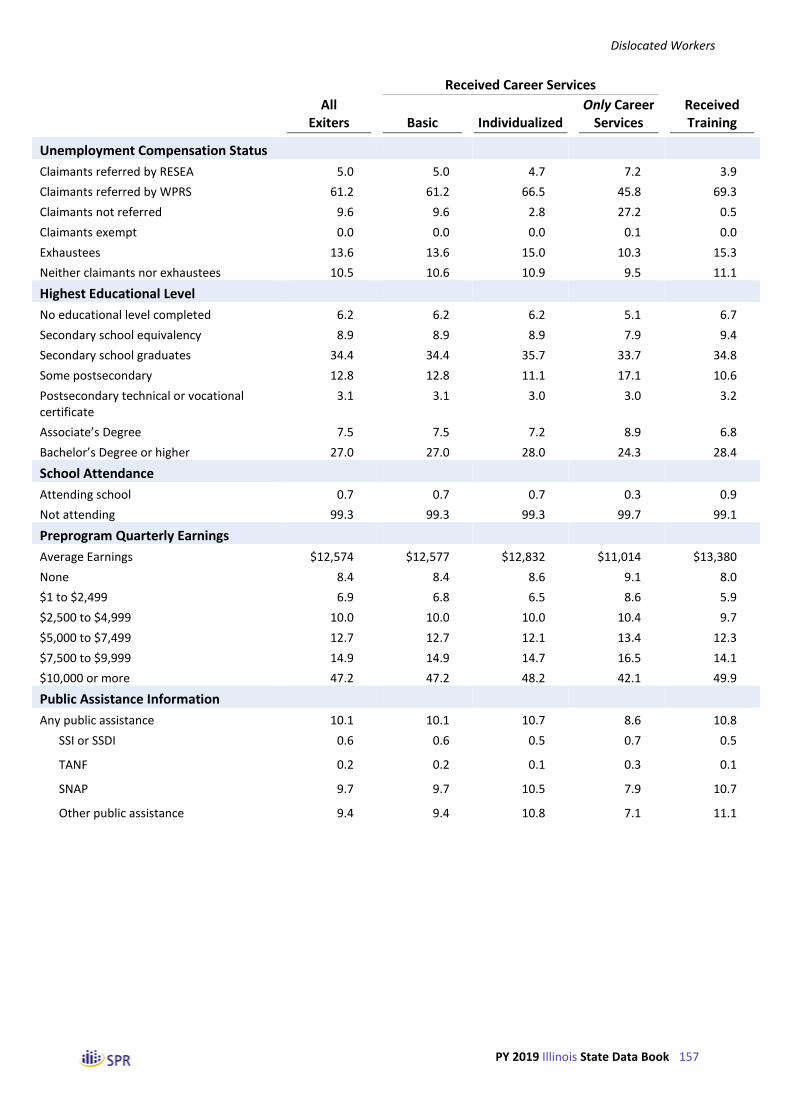
Dislocated Workers
PY 2019 Illinois State Data Book 157
Received Career Services
All Exiters Basic Individualized
Only Career Services
Received Training
Unemployment Compensation Status
Claimants referred by RESEA 5.0 5.0 4.7 7.2 3.9
Claimants referred by WPRS 61.2 61.2 66.5 45.8 69.3
Claimants not referred 9.6 9.6 2.8 27.2 0.5
Claimants exempt 0.0 0.0 0.0 0.1 0.0
Exhaustees 13.6 13.6 15.0 10.3 15.3
Neither claimants nor exhaustees 10.5 10.6 10.9 9.5 11.1
Highest Educational Level
No educational level completed 6.2 6.2 6.2 5.1 6.7
Secondary school equivalency 8.9 8.9 8.9 7.9 9.4
Secondary school graduates 34.4 34.4 35.7 33.7 34.8
Some postsecondary 12.8 12.8 11.1 17.1 10.6
Postsecondary technical or vocational certificate
3.1 3.1 3.0 3.0 3.2
Associate’s Degree 7.5 7.5 7.2 8.9 6.8
Bachelor’s Degree or higher 27.0 27.0 28.0 24.3 28.4
School Attendance
Attending school 0.7 0.7 0.7 0.3 0.9
Not attending 99.3 99.3 99.3 99.7 99.1
Preprogram Quarterly Earnings
Average Earnings $12,574 $12,577 $12,832 $11,014 $13,380
None 8.4 8.4 8.6 9.1 8.0
$1 to $2,499 6.9 6.8 6.5 8.6 5.9
$2,500 to $4,999 10.0 10.0 10.0 10.4 9.7
$5,000 to $7,499 12.7 12.7 12.1 13.4 12.3
$7,500 to $9,999 14.9 14.9 14.7 16.5 14.1
$10,000 or more 47.2 47.2 48.2 42.1 49.9
Public Assistance Information
Any public assistance 10.1 10.1 10.7 8.6 10.8
SSI or SSDI 0.6 0.6 0.5 0.7 0.5
TANF 0.2 0.2 0.1 0.3 0.1
SNAP 9.7 9.7 10.5 7.9 10.7
Other public assistance 9.4 9.4 10.8 7.1 11.1

Dislocated Workers
PY 2019 Illinois State Data Book 158
Received Career Services
All Exiters Basic Individualized
Only Career Services
Received Training
Other Characteristics
Individuals with a disability 1.4 1.4 1.4 2.7 0.8
Long-term unemployed 2.9 2.9 3.1 2.6 3.0
Exhausting TANF within 2 years 1.2 1.2 0.6 1.1 1.9
Homeless individuals or runaway youth 0.4 0.4 0.4 0.7 0.2
Ex-offenders 5.8 5.8 6.3 3.7 6.9
Low income 24.1 24.1 25.4 22.4 25.0
English language learners 2.4 2.4 2.4 1.9 2.7
Basic skills deficient 34.7 34.7 38.4 29.2 37.6
Facing substantial cultural barrier 0.3 0.3 0.3 0.3 0.3
Single parents 9.6 9.6 9.5 8.2 10.3
Displaced homemakers 0.6 0.6 0.7 0.3 0.8

Dislocated Workers
PY 2019 Illinois State Data Book 159
Table III-12 Number of Dislocated Workers Who Exited from April 2019 to March 2020 in IL,
by Major Service Categories
(Derived from PY 2019 Q4 PIRL)
Received Career Services
All Exiters Basic Individualized
Only Career Services
Received Training
Number of Exiters
All exiters 4,418 4,417 3,977 1,512 2,905
Statewide programs 858 858 858 185 673
Local programs 3,958 3,957 3,517 1,384 2,573
Dislocated Worker Grants 173 173 173 42 131
Disaster Recovery 15 15 15 0 15
Economic Recovery 158 158 158 42 116
Age Categories
Under 22 45 45 44 12 33
22 to 29 523 523 482 158 365
30 to 44 1,513 1,513 1,362 445 1,068
45 to 54 1,306 1,306 1,174 469 837
55 and older 1,030 1,029 914 427 602
Gender
Females 1,860 1,859 1,664 699 1,160
Males 2,542 2,542 2,302 803 1,739
Race and Ethnicity
Hispanics/Latinos 950 950 866 309 641
American Indians/Alaska Natives 38 38 36 17 21
Asians 199 199 196 37 162
Blacks or African Americans 1,373 1,373 1,224 525 848
Native Hawaiians/Pacific Islanders 10 10 * * *
Whites 2,187 2,186 2,002 704 1,482
More than one race 36 36 36 14 22
Employment Status
Employed 14 14 11 * *
Not employed or with layoff notice 4,404 4,403 3,966 1,506 2,897
Veteran Status
Veterans 324 324 272 147 177
Disabled veterans 50 50 44 31 19
Other eligible persons * * * * *
Active duty military spouses 82 82 82 23 59

Dislocated Workers
PY 2019 Illinois State Data Book 160
Received Career Services
All Exiters Basic Individualized
Only Career Services
Received Training
Unemployment Compensation Status
Claimants referred by RESEA 221 221 188 109 112
Claimants referred by WPRS 2,706 2,705 2,646 692 2,013
Claimants not referred 425 425 112 411 14
Claimants exempt * * * * 0
Exhaustees 599 599 597 155 444
Neither claimants nor exhaustees 466 466 433 144 322
Highest Educational Level
No educational level completed 272 272 245 77 195
Secondary school equivalency 394 394 353 120 274
Secondary school graduates 1,522 1,521 1,420 509 1,012
Some postsecondary 566 566 441 259 307
Postsecondary technical or vocational certificate
138 138 118 45 93
Associate’s Degree 333 333 288 135 198
Bachelor’s Degree or higher 1,193 1,193 1,112 367 826
School Attendance
Attending school 31 31 29 * 26
Not attending 4,387 4,386 3,948 1,507 2,879
Preprogram Quarterly Earnings
None 369 369 341 137 232
$1 to $2,499 303 302 259 130 172
$2,500 to $4,999 440 440 396 157 283
$5,000 to $7,499 560 560 483 202 358
$7,500 to $9,999 660 660 583 249 411
$10,000 or more 2,086 2,086 1,915 637 1,449
Public Assistance Information
Any public assistance 445 445 427 130 315
SSI or SSDI 17 17 13 9 *
TANF * * * * *
SNAP 430 430 417 120 310
Other public assistance 280 280 278 92 188

Dislocated Workers
PY 2019 Illinois State Data Book 161
Received Career Services
All Exiters Basic Individualized
Only Career Services
Received Training
Other Characteristics
Individuals with a disability 63 63 55 40 23
Long-term unemployed 126 126 123 39 87
Exhausting TANF within 2 years * * * * *
Homeless individuals or runaway youth 17 17 15 10 *
Ex-offenders 256 256 252 55 201
Low income 1,065 1,065 1,010 338 727
English language learners 107 107 95 28 79
Basic skills deficient 1,534 1,534 1,528 442 1,092
Facing substantial cultural barrier 13 13 13 * *
Single parents 400 400 373 102 298
Displaced homemakers 27 27 26 * 23
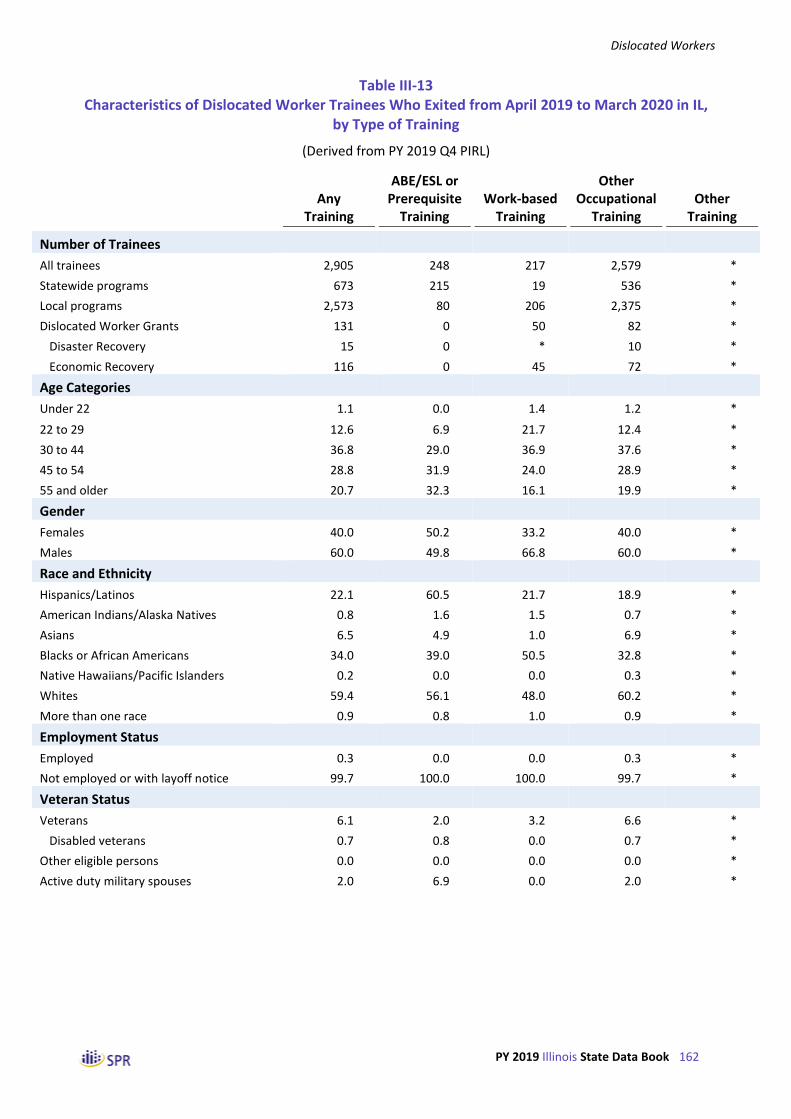
Dislocated Workers
PY 2019 Illinois State Data Book 162
Table III-13 Characteristics of Dislocated Worker Trainees Who Exited from April 2019 to March 2020 in IL,
by Type of Training
(Derived from PY 2019 Q4 PIRL)
Any
Training
ABE/ESL or Prerequisite
Training
Work-based
Training
Other Occupational
Training
Other
Training
Number of Trainees
All trainees 2,905 248 217 2,579 *
Statewide programs 673 215 19 536 *
Local programs 2,573 80 206 2,375 *
Dislocated Worker Grants 131 0 50 82 *
Disaster Recovery 15 0 * 10 *
Economic Recovery 116 0 45 72 *
Age Categories
Under 22 1.1 0.0 1.4 1.2 *
22 to 29 12.6 6.9 21.7 12.4 *
30 to 44 36.8 29.0 36.9 37.6 *
45 to 54 28.8 31.9 24.0 28.9 *
55 and older 20.7 32.3 16.1 19.9 *
Gender
Females 40.0 50.2 33.2 40.0 *
Males 60.0 49.8 66.8 60.0 *
Race and Ethnicity
Hispanics/Latinos 22.1 60.5 21.7 18.9 *
American Indians/Alaska Natives 0.8 1.6 1.5 0.7 *
Asians 6.5 4.9 1.0 6.9 *
Blacks or African Americans 34.0 39.0 50.5 32.8 *
Native Hawaiians/Pacific Islanders 0.2 0.0 0.0 0.3 *
Whites 59.4 56.1 48.0 60.2 *
More than one race 0.9 0.8 1.0 0.9 *
Employment Status
Employed 0.3 0.0 0.0 0.3 *
Not employed or with layoff notice 99.7 100.0 100.0 99.7 *
Veteran Status
Veterans 6.1 2.0 3.2 6.6 *
Disabled veterans 0.7 0.8 0.0 0.7 *
Other eligible persons 0.0 0.0 0.0 0.0 *
Active duty military spouses 2.0 6.9 0.0 2.0 *

Dislocated Workers
PY 2019 Illinois State Data Book 163
Any
Training
ABE/ESL or Prerequisite
Training
Work-based
Training
Other Occupational
Training
Other
Training
Unemployment Compensation Status
Claimants referred by RESEA 3.9 0.8 1.4 4.3 *
Claimants referred by WPRS 69.3 73.0 55.8 69.4 *
Claimants not referred 0.5 0.4 0.0 0.5 *
Claimants exempt 0.0 0.0 0.0 0.0 *
Exhaustees 15.3 13.3 24.9 15.0 *
Neither claimants nor exhaustees 11.1 12.5 18.0 10.7 *
Highest Educational Level
No educational level completed 6.7 49.2 0.5 3.4 *
Secondary school equivalency 9.4 10.1 12.0 9.3 *
Secondary school graduates 34.8 33.1 56.2 34.5 *
Some postsecondary 10.6 4.0 9.2 11.1 *
Postsecondary technical or vocational certificate
3.2 2.4 3.2 3.3 *
Associate’s Degree 6.8 0.8 9.7 6.9 *
Bachelor’s Degree or higher 28.4 0.4 9.2 31.4 *
School Attendance
Attending school 0.9 0.4 0.0 1.0 *
Not attending 99.1 99.6 100.0 99.0 *
Preprogram Quarterly Earnings
Average Earnings $13,380 $10,491 $10,105 $13,812 *
None 8.0 5.6 6.9 8.4 *
$1 to $2,499 5.9 3.2 6.5 6.1 *
$2,500 to $4,999 9.7 4.8 15.2 9.7 *
$5,000 to $7,499 12.3 21.0 12.9 11.6 *
$7,500 to $9,999 14.1 20.6 18.9 13.2 *
$10,000 or more 49.9 44.8 39.6 51.1 *
Public Assistance Information
Any public assistance 10.8 8.9 6.5 11.5 *
SSI or SSDI 0.5 0.0 0.0 0.5 *
TANF 0.1 0.0 0.0 0.1 *
SNAP 10.7 8.9 6.5 11.3 *
Other public assistance 11.1 20.6 5.1 12.0 *

Dislocated Workers
PY 2019 Illinois State Data Book 164
Any
Training
ABE/ESL or Prerequisite
Training
Work-based
Training
Other Occupational
Training
Other
Training
Other Characteristics
Individuals with a disability 0.8 0.4 0.5 0.8 *
Long-term unemployed 3.0 0.8 6.5 2.9 *
Exhausting TANF within 2 years 1.9 0.0 0.0 1.9 *
Homeless individuals or runaway youth 0.2 0.4 0.0 0.2 *
Ex-offenders 6.9 4.8 3.2 7.4 *
Low income 25.0 11.7 41.0 24.7 *
English language learners 2.7 15.7 0.5 1.9 *
Basic skills deficient 37.6 74.2 48.4 34.3 *
Facing substantial cultural barrier 0.3 0.4 0.5 0.2 *
Single parents 10.3 15.3 2.8 10.6 *
Displaced homemakers 0.8 0.8 0.0 0.9 *

Dislocated Workers
PY 2019 Illinois State Data Book 165
Table III-14 Trends in Services Received by Dislocated Worker Exiters, by Reporting Period
(Derived from WIASRD and PIRL Files)
Nation PY 2017
Nation PY 2018
Nation PY 2019
IL PY 2017
IL PY 2018
IL PY 2019
Number of exiters 320,450 289,662 238,793 4,702 4,448 4,418
Coenrollment
Any coenrollment 94.5 94.6 94.0 12.7 11.6 17.4
WIOA Adult 28.6 28.2 14.9 2.6 2.4 6.3
WIOA Youth 0.1 0.1 0.1 0.0 0.0 0.0
Wagner-Peyser 70.0 70.2 84.3 11.5 9.9 16.0
Vocational Rehabilitation 0.0 0.1 0.1 0.0 0.1 0.0
Adult Education 0.1 0.2 0.2 0.0 0.1 0.0
WIOA National Farmworker Jobs 0.0 0.0 0.0 0.0 0.0 0.0
WIOA Indian and Native American 0.0 0.0 0.0 0.0 0.0 0.0
Veterans’ programs 1.3 1.1 1.2 0.5 0.9 1.2
Vocational Education 0.0 0.1 0.0 0.0 0.0 0.1
Senior Community Services 0.0 0.0 0.0 0.0 0.0 0.0
Basic Career Services
Self-services or informational services 77.2 88.8 92.8 49.6 42.6 34.2
Any staff-assisted basic career service 99.7 99.7 99.5 100.0 99.8 100.0
Workforce information services 60.5 61.0 74.6 4.4 3.7 4.3
Career guidance 61.6 57.6 43.1 59.3 60.6 59.3
Staff-assisted job search 61.8 63.0 76.6 19.9 15.9 20.5
Referred to employment 50.4 48.5 56.0 19.5 16.8 21.3
Referred to Federal training 12.3 11.6 12.5 90.6 92.6 87.5
Assistance with UI 1.6 1.7 2.4 1.4 3.1 2.9
Other basic services 61.1 62.3 76.5 0.1 0.1 0.4
Individualized Career Services
Any individualized career service 63.4 63.6 73.9 91.5 94.6 90.0
IEP created 27.4 26.7 29.3 0.1 0.7 0.9
Internship or work experience 0.6 0.5 0.7 8.6 6.3 5.9
Employment, excluding transitional jobs
0.4 0.3 0.4 8.6 6.3 5.9
Transitional jobs 0.1 0.1 0.1 0.0 0.0 0.0
Other work experience 0.2 0.2 0.3 0.0 0.0 0.0
Financial literacy services 0.3 0.2 0.3 0.1 0.1 0.2
English as a second language services 0.4 0.4 0.5 0.1 0.0 0.0
Pre-vocational services 3.6 3.8 4.1 2.1 0.7 0.2
Other individualized services 34.5 35.4 43.0 80.8 86.9 82.9

Dislocated Workers
PY 2019 Illinois State Data Book 166
Nation PY 2017
Nation PY 2018
Nation PY 2019
IL PY 2017
IL PY 2018
IL PY 2019
Weeks Participated
Average number of weeks 17.3 17.1 18.1 50.3 60.3 61.4
4 or fewer weeks 37.2 37.4 32.8 9.0 6.2 8.4
5 to 13 weeks 25.6 25.6 28.2 9.4 8.4 9.6
14 to 26 weeks 19.4 20.0 20.9 17.0 17.3 18.3
27 to 52 weeks 9.2 8.8 9.9 24.4 23.4 25.1
53 to 104 weeks 6.0 5.5 5.5 29.5 22.9 20.1
More than 104 weeks 2.6 2.7 2.7 10.7 21.7 18.6
Other Assistance
Needs-related payments 0.0 0.0 0.0 0.0 0.0 0.0
Supportive services 5.3 5.3 5.6 0.0 0.0 0.0
Rapid response 5.0 5.5 6.1 23.5 29.1 26.2
Disaster relief employment 0.1 0.1 0.2 0.0 0.0 0.0
Other Reason for Exit
Institutionalized, including criminal offenders
0.0 0.0 0.0 0.1 0.1 0.1
Health/medical 0.3 0.3 0.3 0.9 1.0 0.9
Deceased 0.0 0.0 0.0 0.1 0.1 0.1
Reserve called to active duty 0.0 0.0 0.0 0.0 0.0 0.0
Training Services
Received any training 13.5 13.4 14.3 61.7 69.2 65.8
Characteristics of Training (among trainees)
Number of trainees 43,167 38,788 34,244 2,901 3,076 2,905
Type of training
On-the-job training 11.5 9.3 7.9 9.3 6.8 6.7
Skill upgrading 15.7 15.8 16.8 77.2 71.6 72.4
Entrepreneurial training 0.2 0.1 0.1 0.0 0.0 0.0
ABE or ESL with other training 1.1 0.8 0.8 0.0 0.0 0.1
Customized training 1.0 1.3 1.1 0.6 0.5 1.2
Other occupational skills training 71.2 73.1 73.5 13.6 22.4 17.1
Prerequisite training 0.4 0.4 0.2 0.0 0.0 0.0
Registered apprenticeship 0.6 0.8 0.7 0.4 0.2 0.7
Other non-occupational training 0.3 0.5 0.5 0.0 0.0 0.0
Job readiness training in conjunction with other training
-- -- 0.1 -- -- 0.0
Completed training 80.3 80.5 80.6 81.4 82.9 81.8
ITA established 66.5 66.5 67.5 15.7 13.1 8.2
Pell grant recipients 4.1 4.1 3.7 3.9 3.8 3.8
Program(s) operated by the private sector -- -- 28.9 -- -- 55.1

Dislocated Workers
PY 2019 Illinois State Data Book 167
Nation PY 2017
Nation PY 2018
Nation PY 2019
IL PY 2017
IL PY 2018
IL PY 2019
Characteristics of Training (among trainees) cont’d)
Weeks of training
Average number of weeks 29.3 31.0 29.3 33.9 39.6 38.7
4 or fewer weeks 13.3 13.3 14.0 6.3 6.0 5.0
5 to 13 weeks 30.0 28.7 30.1 28.0 24.7 27.0
14 to 26 weeks 22.2 21.6 21.5 24.5 22.5 22.9
27 to 52 weeks 17.9 17.6 17.5 20.6 19.5 19.7
53 to 104 weeks 12.3 14.0 12.6 15.1 19.9 17.2
More than 104 weeks 4.4 4.8 4.4 5.4 7.3 8.1
Occupation of training
Management 10.1 10.6 10.2 16.2 14.5 13.4
Business and financial 3.9 4.2 4.6 4.0 3.6 4.8
Computer and mathematical 11.7 12.1 11.7 15.9 18.7 16.8
Architecture and engineering 2.9 2.8 2.5 1.8 1.1 1.4
Education, training, and library 1.5 1.8 1.8 0.5 1.1 3.5
Healthcare practitioners and technical 8.3 9.0 8.5 8.1 8.3 7.5
Healthcare support 8.3 8.4 8.2 3.7 3.9 4.1
Food preparation and serving related 0.4 0.3 0.4 0.1 0.1 0.3
Personal care and service 0.9 0.9 0.8 0.1 0.2 0.1
Sales and related 1.0 1.0 0.9 0.2 0.2 0.2
Office and administrative support 11.3 11.0 10.9 6.1 5.6 4.3
Construction and extraction 3.7 3.5 3.1 1.0 1.0 1.1
Installation, maintenance, and repair 5.5 5.4 4.3 7.1 8.7 6.9
Production 8.9 7.6 6.6 10.8 9.4 11.2
Transportation and material moving 18.1 18.0 21.4 23.7 23.8 24.9
Other occupations 5.1 5.4 5.8 1.4 1.5 1.6

Dislocated Workers
PY 2019 Illinois State Data Book 168
Table III-15 Trends in the Number of Dislocated Worker Exiters Who Received Various Services,
by Reporting Period
(Derived from PIRL and WIASRD Files)
Nation PY 2017
Nation PY 2018
Nation PY 2019
IL PY 2017
IL PY 2018
IL PY 2019
Number of exiters 320,450 289,662 238,793 4,702 4,448 4,418
Coenrollment
Any coenrollment 302,668 273,986 224,386 596 516 770
WIOA Adult 91,529 81,826 35,583 122 107 277
WIOA Youth 206 168 203 0 * *
Wagner-Peyser 224,453 203,477 201,283 539 440 708
Vocational Rehabilitation 155 203 189 0 * 0
Adult Education 414 455 571 * * *
WIOA National Farmworker Jobs 13 27 97 0 0 0
WIOA Indian and Native American 2 5 4 0 0 0
Veterans’ programs 4,167 3,158 2,822 24 40 55
Vocational Education 132 157 108 0 * *
Senior Community Services 4 2 3 0 0 0
Basic Career Services
Self-services or informational services 247,538 257,252 221,674 2,333 1,896 1,511
Any staff-assisted basic career service 319,513 288,754 237,519 4,700 4,439 4,417
Workforce information services 193,976 176,597 178,169 206 163 190
Career guidance 197,282 166,813 102,807 2,789 2,694 2,621
Staff-assisted job search 197,910 182,574 182,941 937 707 907
Referred to employment 161,600 140,538 133,817 917 746 941
Referred to Federal training 39,353 33,676 29,858 4,259 4,117 3,867
Assistance with UI 5,001 5,059 5,835 64 140 129
Other basic services 195,675 180,451 182,589 * * 19
Individualized Career Services
Any individualized career service 203,205 184,228 176,368 4,302 4,209 3,977
IEP created 87,748 77,352 69,867 * 29 41
Internship or work experience 1,911 1,557 1,571 404 282 260
Employment, excluding transitional jobs
1,179 864 855 404 282 260
Transitional jobs 295 282 185 0 0 0
Other work experience 535 484 599 0 0 0
Financial literacy services 842 694 829 * * *
English as a second language services 1,316 1,075 1,187 * 0 *
Pre-vocational services 11,453 11,136 9,842 98 32 *
Other individualized services 110,438 102,495 102,750 3,799 3,864 3,661

Dislocated Workers
PY 2019 Illinois State Data Book 169
Nation PY 2017
Nation PY 2018
Nation PY 2019
IL PY 2017
IL PY 2018
IL PY 2019
Weeks Participated
4 or fewer weeks 119,224 108,474 78,254 425 277 373
5 to 13 weeks 82,120 74,092 67,337 440 375 422
14 to 26 weeks 62,011 57,920 49,999 799 770 807
27 to 52 weeks 29,552 25,391 23,614 1,145 1,042 1,110
53 to 104 weeks 19,082 16,073 13,050 1,389 1,018 886
More than 104 weeks 8,461 7,712 6,539 504 966 820
Other Assistance
Needs-related payments 109 70 96 0 0 0
Supportive services 17,020 15,257 13,325 0 * *
Rapid response 16,152 15,887 14,462 1,105 1,295 1,156
Disaster relief employment 258 262 397 0 0 0
Reason for Exit
Institutionalized, including criminal offenders
69 51 49 * * *
Health/medical 860 789 757 44 46 38
Deceased 91 97 70 * * *
Reserve called to active duty 12 10 4 0 0 *
Training Services
Received any training 43,167 38,788 34,244 2,901 3,076 2,905
Characteristics of Training (among trainees)
Number of trainees 43,167 38,788 34,244 2,901 3,076 2,905
Type of training
On-the-job training 4,978 3,592 2,716 270 208 195
Skill upgrading 6,762 6,119 5,745 2,239 2,201 2,104
Entrepreneurial training 83 37 43 0 0 0
ABE or ESL with other training 488 315 274 * 0 *
Customized training 427 485 382 18 16 35
Other occupational skills training 30,716 28,355 25,160 395 688 498
Prerequisite training 161 155 76 0 0 0
Registered apprenticeship 263 309 227 11 * 20
Other non-occupational training 132 181 183 0 0 0
Job readiness training in conjunction with other training
-- -- 30 -- -- 0
Completed training 34,674 31,218 27,596 2,361 2,550 2,377
ITA established 28,690 25,813 23,127 455 402 239
Pell grant recipients 1,789 1,588 1,265 112 116 109
Program(s) operated by the private sector -- -- 9,902 -- -- 1,601

Dislocated Workers
PY 2019 Illinois State Data Book 170
Nation PY 2017
Nation PY 2018
Nation PY 2019
IL PY 2017
IL PY 2018
IL PY 2019
Characteristics of Training (among trainees) cont’d)
Weeks of training
4 or fewer weeks 5,720 5,170 4,785 184 184 146
5 to 13 weeks 12,947 11,139 10,300 811 760 785
14 to 26 weeks 9,590 8,385 7,360 712 693 665
27 to 52 weeks 7,715 6,816 5,985 599 600 573
53 to 104 weeks 5,294 5,433 4,304 438 613 501
More than 104 weeks 1,901 1,845 1,509 157 226 235
Occupation of training
Management 4,128 3,947 3,383 467 446 390
Business and financial 1,608 1,553 1,542 115 111 139
Computer and mathematical 4,776 4,526 3,891 458 574 488
Architecture and engineering 1,178 1,063 838 51 34 42
Education, training, and library 628 668 607 15 35 103
Healthcare practitioners and technical 3,382 3,366 2,836 233 254 219
Healthcare support 3,397 3,149 2,726 108 120 120
Food preparation and serving related 158 108 134 * * 10
Personal care and service 384 334 255 * * *
Sales and related 423 366 293 * * *
Office and administrative support 4,602 4,109 3,625 176 171 125
Construction and extraction 1,504 1,293 1,026 30 30 31
Installation, maintenance, and repair 2,226 2,010 1,440 205 267 199
Production 3,630 2,827 2,190 311 288 324
Transportation and material moving 7,375 6,718 7,136 684 731 724
Other occupations 2,064 2,016 1,916 40 45 45

Dislocated Workers
PY 2019 Illinois State Data Book 171
Table III-16 Services Received by Dislocated Workers Who Exited from April 2019 to March 2020 in IL,
by Funding Source
(Derived from PY 2019 Q4 PIRL)
Formula Funds
Total All Local Statewide DWG
Number of Exiters 4,418 4,418 3,958 858 173
Coenrollment
Any coenrollment 17.4 17.4 19.1 4.1 4.6
WIOA Adult 6.3 6.3 6.9 0.3 1.2
WIOA Youth 0.0 0.0 0.0 0.0 0.0
Wagner-Peyser 16.0 16.0 17.5 3.7 2.3
Vocational Rehabilitation 0.0 0.0 0.0 0.0 0.0
Adult Education 0.0 0.0 0.1 0.0 0.6
WIOA National Farmworker Jobs 0.0 0.0 0.0 0.0 0.0
WIOA Indian and Native American 0.0 0.0 0.0 0.0 0.0
Veterans’ programs 1.2 1.2 1.4 0.3 1.2
Vocational Education 0.1 0.1 0.1 0.1 0.0
Senior Community Services 0.0 0.0 0.0 0.0 0.0
Basic Career Services
Self-services or informational services 34.2 34.2 36.5 34.8 14.5
Any staff-assisted basic career service 100.0 100.0 100.0 100.0 100.0
Workforce information services 4.3 4.3 4.7 0.9 0.6
Career guidance 59.3 59.3 58.6 57.0 82.7
Staff-assisted job search 20.5 20.5 22.6 9.9 13.9
Referred to employment 21.3 21.3 23.4 3.5 31.8
Referred to Federal training 87.5 87.5 86.1 100.0 100.0
Assistance with UI 2.9 2.9 3.2 0.7 0.6
Other basic services 0.4 0.4 0.5 0.2 0.0
Individualized Career Services
Any individualized career service 90.0 90.0 88.9 100.0 100.0
IEP created 0.9 0.9 1.0 0.0 0.0
Internships or work experience 5.9 5.9 5.7 5.4 31.8
Employment, excluding transitional jobs 5.9 5.9 5.7 5.4 31.8
Transitional jobs 0.0 0.0 0.0 0.0 0.0
Other work experience 0.0 0.0 0.0 0.0 0.0
Financial literacy services 0.2 0.2 0.2 0.1 0.0
English as a second language services 0.0 0.0 0.0 0.2 0.0
Pre-vocational services 0.2 0.2 0.2 0.0 0.0
Other individualized services 82.9 82.9 81.8 94.4 68.2

Dislocated Workers
PY 2019 Illinois State Data Book 172
Formula Funds
Total All Local Statewide DWG
Weeks Participated
Average number of weeks 61.4 61.4 48.6 137.7 44.3
4 or fewer weeks 8.4 8.4 9.4 0.2 0.6
5 to 13 weeks 9.6 9.6 10.5 1.6 9.8
14 to 26 weeks 18.3 18.3 19.8 6.4 35.3
27 to 52 weeks 25.1 25.1 26.7 14.0 37.0
53 to 104 weeks 20.1 20.1 21.4 18.8 5.2
More than 104 weeks 18.6 18.6 12.2 59.0 12.1
Other Assistance
Needs-related payments 0.0 0.0 0.0 0.0 0.0
Supportive services 0.0 0.0 0.0 0.0 0.0
Rapid response 26.2 26.2 18.8 94.4 39.9
Disaster relief employment 0.0 0.0 0.0 0.0 0.0
Reason for Exit
Institutionalized, including criminal offenders
0.1 0.1 0.1 0.1 0.0
Health/medical 0.9 0.9 1.0 0.5 1.2
Deceased 0.1 0.1 0.1 0.1 0.0
Reserve called to active duty 0.0 0.0 0.0 0.0 0.0
Training Services
Received any training 65.8 65.8 65.0 78.4 75.7
Characteristics of Training (among trainees)
Number of trainees 2,905 2,905 2,573 673 131
Type of training
On-the-job training 6.7 6.7 7.3 2.4 37.4
Skill upgrading 72.4 72.4 80.5 11.3 61.1
Entrepreneurial training 0.0 0.0 0.0 0.0 0.0
ABE or ESL with other training 0.1 0.1 0.0 0.3 0.0
Customized training 1.2 1.2 1.4 0.0 11.5
Other occupational skills training 17.1 17.1 12.5 71.2 2.3
Prerequisite training 0.0 0.0 0.0 0.0 0.0
Registered apprenticeship 0.7 0.7 0.7 0.4 0.0
Other non-occupational training 0.0 0.0 0.0 0.0 0.0
Job readiness training in conjunction with other training
0.0 0.0 0.0 0.0 0.0
Completed training 81.8 81.8 85.3 68.1 93.1
ITA established 8.2 8.2 9.2 1.5 2.3
Pell grant recipients 3.8 3.8 4.2 1.0 3.1
Program(s) operated by the private sector 55.1 55.1 56.1 36.0 84.0

Dislocated Workers
PY 2019 Illinois State Data Book 173
Formula Funds
Total All Local Statewide DWG
Characteristics of Training (among trainees) (cont’d)
Weeks of training
Average number of weeks 38.7 38.7 34.5 67.3 25.5
4 or fewer weeks 5.0 5.0 5.2 4.3 3.8
5 to 13 weeks 27.0 27.0 29.8 12.0 38.9
14 to 26 weeks 22.9 22.9 24.0 12.3 35.9
27 to 52 weeks 19.7 19.7 20.2 16.0 13.0
53 to 104 weeks 17.2 17.2 15.1 33.1 0.8
More than 104 weeks 8.1 8.1 5.8 22.1 7.6
Occupation of training
Management 13.4 13.4 14.4 9.4 10.7
Business and financial 4.8 4.8 4.8 5.5 3.8
Computer and mathematical 16.8 16.8 17.1 17.9 9.2
Architecture and engineering 1.4 1.4 1.4 2.2 0.0
Education, training, and library 3.5 3.5 0.4 14.6 0.0
Healthcare practitioners and technical 7.5 7.5 8.2 5.4 10.7
Healthcare support 4.1 4.1 4.2 3.0 2.3
Food preparation and serving related 0.3 0.3 0.2 1.2 0.8
Personal care and service 0.1 0.1 0.1 0.4 0.0
Sales and related 0.2 0.2 0.2 0.4 0.8
Office and administrative support 4.3 4.3 4.3 4.8 1.5
Construction and extraction 1.1 1.1 0.9 1.6 0.0
Installation, maintenance, and repair 6.9 6.9 6.8 11.8 5.3
Production 11.2 11.2 8.9 19.5 33.6
Transportation and material moving 24.9 24.9 27.6 7.6 22.1
Other occupations 1.6 1.6 1.5 2.7 0.0

Dislocated Workers
PY 2019 Illinois State Data Book 174
Table III-17 Services Received by Dislocated Workers Who Exited from April 2019 to March 2020 in IL,
by Age at Program Entry
(Derived from PY 2019 Q4 PIRL)
Under 22 22 to 29 30 to 44 45 to 54 55 and older
Number of Exiters 45 523 1,513 1,306 1,030
Coenrollment
Any coenrollment 6.7 12.0 16.1 18.9 20.6
WIOA Adult 2.2 3.8 5.7 7.3 7.3
WIOA Youth 0.0 0.0 0.0 0.0 0.0
Wagner-Peyser 4.4 11.3 13.9 17.6 19.9
Vocational Rehabilitation 0.0 0.0 0.0 0.0 0.0
Adult Education 0.0 0.2 0.1 0.0 0.0
WIOA National Farmworker Jobs 0.0 0.0 0.0 0.0 0.0
WIOA Indian and Native American 0.0 0.0 0.0 0.0 0.0
Veterans’ programs 0.0 0.6 1.2 1.7 1.2
Vocational Education 0.0 0.0 0.1 0.2 0.0
Senior Community Services 0.0 0.0 0.0 0.0 0.0
Basic Career Services
Self-services or informational services 35.6 23.1 31.7 38.5 37.9
Any staff-assisted basic career service 100.0 100.0 100.0 100.0 99.9
Workforce information services 2.2 1.9 3.6 5.0 5.8
Career guidance 55.6 56.2 59.0 61.9 58.4
Staff-assisted job search 22.2 14.7 17.6 21.5 26.3
Referred to employment 22.2 24.9 20.2 21.3 21.1
Referred to Federal training 95.6 91.0 88.8 86.0 85.5
Assistance with UI 2.2 1.9 2.8 3.1 3.4
Other basic services 0.0 0.2 0.4 0.6 0.4
Individualized Career Services
Any individualized career service 97.8 92.2 90.0 89.9 88.7
IEP created 0.0 0.6 0.7 1.5 0.8
Internships or work experience 8.9 11.9 5.7 4.7 4.5
Employment, excluding transitional jobs 8.9 11.9 5.7 4.7 4.5
Transitional jobs 0.0 0.0 0.0 0.0 0.0
Other work experience 0.0 0.0 0.0 0.0 0.0
Financial literacy services 0.0 0.4 0.1 0.2 0.2
English as a second language services 0.0 0.0 0.0 0.1 0.1
Pre-vocational services 2.2 0.2 0.1 0.2 0.2
Other individualized services 86.7 79.5 83.4 83.4 83.0

Dislocated Workers
PY 2019 Illinois State Data Book 175
Under 22 22 to 29 30 to 44 45 to 54 55 and older
Weeks Participated
Average number of weeks 36.8 50.8 56.8 64.6 70.6
4 or fewer weeks 6.7 8.6 8.1 7.7 9.9
5 to 13 weeks 17.8 12.6 9.3 9.9 7.7
14 to 26 weeks 22.2 20.8 20.1 17.1 15.6
27 to 52 weeks 35.6 28.1 26.8 24.3 21.7
53 to 104 weeks 8.9 15.9 19.6 20.2 23.0
More than 104 weeks 8.9 14.0 16.1 20.8 22.0
Other Assistance
Needs-related payments 0.0 0.0 0.0 0.0 0.0
Supportive services 0.0 0.0 0.0 0.0 0.0
Rapid Response 26.7 16.8 21.5 28.3 35.1
Disaster relief employment 0.0 0.0 0.0 0.0 0.0
Reason for Exit
Institutionalized, including criminal offenders
0.0 0.2 0.1 0.0 0.1
Health/medical 0.0 0.6 0.5 0.9 1.5
Deceased 0.0 0.2 0.1 0.2 0.1
Reserve called to active duty 0.0 0.0 0.1 0.0 0.0
Training Services
Received any training 73.3 69.8 70.6 64.1 58.4
Characteristics of Training (among trainees)
Number of trainees 33 365 1,068 837 602
Type of training
On-the-job training 9.1 11.2 6.3 6.0 5.6
Skill upgrading 90.9 77.5 77.3 71.6 60.8
Entrepreneurial training 0.0 0.0 0.0 0.0 0.0
ABE or ESL with other training 0.0 0.0 0.0 0.1 0.2
Customized training 0.0 1.1 0.9 1.4 1.5
Other occupational skills training 0.0 10.4 14.3 18.5 25.2
Prerequisite training 0.0 0.0 0.0 0.0 0.0
Registered apprenticeship 0.0 1.9 1.0 0.2 0.0
Other non-occupational training 0.0 0.0 0.0 0.0 0.0
Job readiness training in conjunction with other training
0.0 0.0 0.0 0.0 0.0
Completed training 90.9 81.1 84.8 80.8 77.9
ITA established 6.1 11.2 6.6 8.5 9.1
Pell grant recipients 9.1 7.7 4.8 2.3 1.3
Program(s) operated by the private sector 54.5 49.6 57.0 55.4 54.7

Dislocated Workers
PY 2019 Illinois State Data Book 176
Under 22 22 to 29 30 to 44 45 to 54 55 and older
Characteristics of Training (among trainees) (cont’d)
Weeks of training
Average number of weeks 24.6 36.3 37.9 40.6 39.8
4 or fewer weeks 3.0 5.5 3.7 5.6 6.3
5 to 13 weeks 54.5 30.7 28.8 25.7 21.9
14 to 26 weeks 18.2 24.1 22.9 22.7 22.6
27 to 52 weeks 12.1 18.6 20.0 18.6 21.8
53 to 104 weeks 9.1 13.7 17.5 18.5 17.6
More than 104 weeks 3.0 7.4 6.9 8.8 9.8
Occupation of training
Management 0.0 2.8 11.3 17.0 19.4
Business and financial 3.0 1.7 3.9 5.9 6.8
Computer and mathematical 0.0 7.7 13.3 20.4 24.4
Architecture and engineering 3.0 1.4 1.8 1.2 1.2
Education, training, and library 0.0 1.4 2.8 3.9 5.8
Healthcare practitioners and technical 15.2 12.9 8.3 6.2 4.3
Healthcare support 6.1 6.1 4.8 4.1 1.8
Food preparation and serving related 0.0 0.3 0.3 0.4 0.5
Personal care and service 0.0 0.3 0.1 0.2 0.0
Sales and related 0.0 0.3 0.3 0.1 0.3
Office and administrative support 0.0 2.8 2.6 4.2 8.6
Construction and extraction 0.0 2.2 1.2 0.7 0.7
Installation, maintenance, and repair 6.1 12.7 8.1 4.7 4.3
Production 15.2 14.0 10.7 9.7 12.1
Transportation and material moving 48.5 33.6 31.0 22.2 11.5
Other occupations 3.0 1.9 1.4 1.8 1.2

Dislocated Workers
PY 2019 Illinois State Data Book 177
Table III-18 Services Received by Dislocated Workers Who Exited from April 2019 to March 2020 in IL,
by Ethnicity and Race
(Derived from PY 2019 Q4 PIRL)
Ethnicity Race
Hispanic Not Hispanic White Only Black Only Other
Number of exiters 950 3,459 2,159 1,352 257
Coenrollment
Any coenrollment 15.8 17.7 16.1 18.9 13.2
WIOA Adult 3.2 7.1 6.4 6.4 3.9
WIOA Youth 0.0 0.0 0.0 0.0 0.0
Wagner-Peyser 14.2 16.3 15.0 17.0 11.7
Vocational Rehabilitation 0.0 0.0 0.0 0.0 0.0
Adult Education 0.1 0.0 0.0 0.1 0.0
WIOA National Farmworker Jobs 0.0 0.0 0.0 0.0 0.0
WIOA Indian and Native American 0.0 0.0 0.0 0.0 0.0
Veterans’ programs 0.9 1.3 1.2 1.6 1.2
Vocational Education 0.0 0.1 0.0 0.1 0.0
Senior Community Services 0.0 0.0 0.0 0.0 0.0
Basic Career Services
Self-services or informational services 28.1 35.8 39.2 27.7 33.5
Any staff-assisted basic career service 100.0 100.0 100.0 100.0 100.0
Workforce information services 4.2 4.3 4.8 3.7 2.3
Career guidance 59.7 59.3 57.9 64.2 56.8
Staff-assisted job search 20.2 20.6 19.8 20.9 23.0
Referred to employment 19.8 21.7 18.4 26.7 18.3
Referred to Federal training 90.8 86.8 88.9 86.0 95.7
Assistance with UI 2.9 2.9 3.1 2.4 2.7
Other basic services 0.2 0.5 0.4 0.5 0.0
Individualized Career Services
Any individualized career service 91.2 89.9 91.4 89.0 96.9
IEP created 0.3 1.1 1.4 0.2 0.4
Internships or work experience 5.7 6.0 5.4 8.1 2.7
Employment, excluding transitional jobs 5.7 6.0 5.4 8.1 2.7
Transitional jobs 0.0 0.0 0.0 0.0 0.0
Other work experience 0.0 0.0 0.0 0.0 0.0
Financial literacy services 0.1 0.2 0.1 0.1 0.0
English as a second language services 0.2 0.0 0.0 0.0 0.0
Pre-vocational services 0.0 0.2 0.2 0.1 0.0
Other individualized services 84.9 82.5 84.3 80.3 93.8

Dislocated Workers
PY 2019 Illinois State Data Book 178
Ethnicity Race
Hispanic Not Hispanic White Only Black Only Other
Weeks Participated
Average number of weeks 73.5 58.2 58.8 57.9 61.7
4 or fewer weeks 7.5 8.6 7.1 10.4 5.8
5 to 13 weeks 9.3 9.6 9.8 8.9 9.7
14 to 26 weeks 18.2 18.3 18.9 19.0 14.4
27 to 52 weeks 24.4 25.4 24.5 26.7 29.2
53 to 104 weeks 16.6 21.0 21.9 18.7 22.2
More than 104 weeks 24.0 17.1 17.9 16.3 18.7
Other Assistance
Needs-related payments 0.0 0.0 0.0 0.0 0.0
Supportive services 0.0 0.0 0.0 0.0 0.0
Rapid Response 33.7 24.2 26.2 19.2 39.7
Disaster relief employment 0.0 0.0 0.0 0.0 0.0
Reason for Exit
Institutionalized, including criminal offenders
0.0 0.1 0.0 0.1 0.0
Health/medical 0.6 0.9 1.0 0.6 1.6
Deceased 0.1 0.1 0.1 0.2 0.0
Reserve called to active duty 0.0 0.0 0.0 0.0 0.4
Training Services
Received any training 67.5 65.5 67.8 62.0 75.1
Characteristics of Training (among trainees)
Number of trainees 641 2,264 1,464 838 193
Type of training
On-the-job training 6.7 6.7 5.9 10.5 3.1
Skill upgrading 63.3 75.0 75.8 75.2 64.2
Entrepreneurial training 0.0 0.0 0.0 0.0 0.0
ABE or ESL with other training 0.3 0.0 0.0 0.0 0.0
Customized training 1.9 1.0 0.8 1.9 1.0
Other occupational skills training 13.1 18.3 17.8 13.4 31.1
Prerequisite training 0.0 0.0 0.0 0.0 0.0
Registered apprenticeship 0.6 0.7 0.6 1.1 0.0
Other non-occupational training 0.0 0.0 0.0 0.0 0.0
Job readiness training in conjunction with other training
0.0 0.0 0.0 0.0 0.0
Completed training 73.5 84.2 84.4 81.3 90.2
ITA established 4.5 9.3 9.5 7.3 8.8
Pell grant recipients 1.4 4.4 5.2 2.5 1.0
Program(s) operated by the private sector 59.0 54.0 47.0 67.1 69.4

Dislocated Workers
PY 2019 Illinois State Data Book 179
Ethnicity Race
Hispanic Not Hispanic White Only Black Only Other
Characteristics of Training (among trainees) (cont’d)
Weeks of training
Average number of weeks 42.6 37.6 38.6 33.9 36.5
4 or fewer weeks 3.7 5.4 6.0 4.3 4.1
5 to 13 weeks 26.7 27.1 26.4 30.9 25.4
14 to 26 weeks 24.0 22.6 21.6 26.7 22.3
27 to 52 weeks 17.0 20.5 20.4 18.9 22.3
53 to 104 weeks 16.1 17.6 17.8 13.4 22.3
More than 104 weeks 12.5 6.8 7.9 5.8 3.6
Occupation of training
Management 7.3 15.2 15.0 10.8 21.4
Business and financial 2.7 5.4 5.2 4.5 4.7
Computer and mathematical 8.7 19.1 16.7 13.9 42.7
Architecture and engineering 0.3 1.8 2.2 0.5 2.6
Education, training, and library 10.5 1.6 1.6 3.1 0.0
Healthcare practitioners and technical 3.7 8.6 10.0 5.5 4.2
Healthcare support 3.1 4.4 2.7 7.2 3.1
Food preparation and serving related 0.5 0.3 0.3 0.5 0.0
Personal care and service 0.2 0.1 0.2 0.0 0.0
Sales and related 0.0 0.3 0.3 0.2 0.0
Office and administrative support 3.7 4.5 5.1 4.1 2.1
Construction and extraction 1.6 0.9 1.1 1.0 0.0
Installation, maintenance, and repair 9.5 6.1 6.8 6.3 3.1
Production 18.3 9.2 8.9 12.7 8.3
Transportation and material moving 32.4 22.8 23.6 31.2 7.8
Other occupations 0.8 1.8 1.8 1.6 1.0

Dislocated Workers
PY 2019 Illinois State Data Book 180
Table III-19 Services Received by Dislocated Workers Who Exited from April 2019 to March 2020 in IL,
by Gender, Employment Status, and Disability Status
(Derived from PY 2019 Q4 PIRL)
Gender Employment Status Has a
Female Male Employed Not Employed Disability
Number of exiters 1,860 2,542 14 4,404 63
Coenrollment
Any coenrollment 18.7 16.2 100.0 17.2 57.1
WIOA Adult 6.8 5.7 28.6 6.2 20.6
WIOA Youth 0.1 0.0 0.0 0.0 0.0
Wagner-Peyser 17.4 14.8 100.0 15.8 57.1
Vocational Rehabilitation 0.0 0.0 0.0 0.0 0.0
Adult Education 0.1 0.0 0.0 0.0 0.0
WIOA National Farmworker Jobs 0.0 0.0 0.0 0.0 0.0
WIOA Indian and Native American 0.0 0.0 0.0 0.0 0.0
Veterans’ programs 0.6 1.7 21.4 1.2 25.4
Vocational Education 0.1 0.0 0.0 0.1 0.0
Senior Community Services 0.0 0.0 0.0 0.0 0.0
Basic Career Services
Self-services or informational services 34.7 33.6 35.7 34.2 61.9
Any staff-assisted basic career service 99.9 100.0 100.0 100.0 100.0
Workforce information services 5.1 3.6 7.1 4.3 15.9
Career guidance 60.5 58.4 78.6 59.3 84.1
Staff-assisted job search 22.6 18.8 71.4 20.4 28.6
Referred to employment 24.0 19.3 50.0 21.2 31.7
Referred to Federal training 87.3 88.0 71.4 87.6 58.7
Assistance with UI 3.1 2.7 7.1 2.9 4.8
Other basic services 0.2 0.6 14.3 0.4 6.3
Individualized Career Services
Any individualized career service 89.5 90.6 78.6 90.1 87.3
IEP created 1.0 0.8 7.1 0.9 7.9
Internships or work experience 5.2 6.4 0.0 5.9 3.2
Employment, excluding transitional jobs 5.2 6.4 0.0 5.9 3.2
Transitional jobs 0.0 0.0 0.0 0.0 0.0
Other work experience 0.0 0.0 0.0 0.0 0.0
Financial literacy services 0.2 0.2 0.0 0.2 0.0
English as a second language services 0.0 0.1 0.0 0.0 0.0
Pre-vocational services 0.1 0.2 7.1 0.2 0.0
Other individualized services 83.1 82.9 64.3 82.9 76.2

Dislocated Workers
PY 2019 Illinois State Data Book 181
Gender Employment Status Has a
Female Male Employed Not Employed Disability
Weeks Participated
Average number of weeks 69.2 55.8 60.2 61.4 40.8
4 or fewer weeks 8.4 8.3 21.4 8.4 14.3
5 to 13 weeks 7.6 11.0 0.0 9.6 14.3
14 to 26 weeks 14.8 20.8 7.1 18.3 20.6
27 to 52 weeks 21.7 27.7 14.3 25.2 20.6
53 to 104 weeks 25.6 16.1 35.7 20.0 20.6
More than 104 weeks 21.9 16.1 21.4 18.6 9.5
Other Assistance
Needs-related payments 0.0 0.0 0.0 0.0 0.0
Supportive services 0.1 0.0 0.0 0.0 0.0
Rapid Response 25.5 26.7 21.4 26.2 12.7
Disaster relief employment 0.0 0.0 0.0 0.0 0.0
Reason for Exit
Institutionalized, including criminal offenders
0.0 0.1 0.0 0.1 0.0
Health/medical 1.0 0.7 0.0 0.9 1.6
Deceased 0.1 0.1 0.0 0.1 1.6
Reserve called to active duty 0.1 0.0 0.0 0.0 0.0
Training Services
Received any training 62.4 68.4 57.1 65.8 36.5
Characteristics of Training (among trainees)
Number of trainees 1,160 1,739 * 2,897 23
Type of training
On-the-job training 5.4 7.6 * 6.7 4.3
Skill upgrading 72.8 72.2 * 72.4 82.6
Entrepreneurial training 0.0 0.0 * 0.0 0.0
ABE or ESL with other training 0.0 0.1 * 0.1 0.0
Customized training 0.9 1.4 * 1.2 0.0
Other occupational skills training 16.6 17.4 * 17.1 8.7
Prerequisite training 0.0 0.0 * 0.0 0.0
Registered apprenticeship 0.7 0.7 * 0.7 0.0
Other non-occupational training 0.0 0.0 * 0.0 0.0
Job readiness training in conjunction with other training
0.0 0.0 * 0.0 0.0
Completed training 77.9 84.4 * 81.8 73.9
ITA established 9.0 7.7 * 8.2 17.4
Pell grant recipients 6.4 2.0 * 3.7 4.3
Program(s) operated by the private sector 45.3 61.8 * 55.1 39.1

Dislocated Workers
PY 2019 Illinois State Data Book 182
Gender Employment Status Has a
Female Male Employed Not Employed Disability
Characteristics of Training (among trainees) (cont’d)
Weeks of training
Average number of weeks 49.3 31.5 * 38.6 44.8
4 or fewer weeks 3.7 5.9 * 5.0 0.0
5 to 13 weeks 16.7 34.0 * 27.1 13.0
14 to 26 weeks 20.5 24.4 * 22.9 26.1
27 to 52 weeks 23.2 17.4 * 19.7 34.8
53 to 104 weeks 24.5 12.5 * 17.2 13.0
More than 104 weeks 11.4 5.8 * 8.1 13.0
Occupation of training
Management 15.5 12.0 * 13.4 8.7
Business and financial 8.5 2.3 * 4.8 4.3
Computer and mathematical 17.3 16.6 * 16.8 17.4
Architecture and engineering 0.8 1.9 * 1.5 0.0
Education, training, and library 5.5 2.1 * 3.6 4.3
Healthcare practitioners and technical 15.1 2.5 * 7.5 13.0
Healthcare support 9.6 0.5 * 4.1 4.3
Food preparation and serving related 0.8 0.1 * 0.3 0.0
Personal care and service 0.3 0.0 * 0.1 0.0
Sales and related 0.3 0.2 * 0.2 0.0
Office and administrative support 9.8 0.6 * 4.3 0.0
Construction and extraction 0.5 1.4 * 1.1 0.0
Installation, maintenance, and repair 1.6 10.4 * 6.8 8.7
Production 7.6 13.5 * 11.2 17.4
Transportation and material moving 7.3 36.7 * 25.0 17.4
Other occupations 2.8 0.7 * 1.5 4.3

Dislocated Workers
PY 2019 Illinois State Data Book 183
Table III-20 Services Received by Dislocated Workers Who Exited from April 2019 to March 2020 in IL,
by Other Employment Characteristics
(Derived from PY 2019 Q4 PIRL)
Unemployment Compensation Status Long-Term Displaced
Claimant Exhaustee Neither Unemployed Homemaker
Number of Exiters 3,353 599 466 126 27
Coenrollment
Any coenrollment 20.2 5.3 13.3 9.5 7.4
WIOA Adult 7.4 1.2 4.5 2.4 7.4
WIOA Youth 0.0 0.0 0.0 0.0 0.0
Wagner-Peyser 19.1 3.5 10.1 4.8 3.7
Vocational Rehabilitation 0.0 0.0 0.0 0.0 0.0
Adult Education 0.0 0.2 0.0 0.8 0.0
WIOA National Farmworker Jobs 0.0 0.0 0.0 0.0 0.0
WIOA Indian and Native American 0.0 0.0 0.0 0.0 0.0
Veterans’ programs 1.3 0.5 2.1 0.8 0.0
Vocational Education 0.0 0.3 0.2 1.6 0.0
Senior Community Services 0.0 0.0 0.0 0.0 0.0
Basic Career Services
Self-services or informational services 35.6 29.7 29.8 15.9 22.2
Any staff-assisted basic career service 100.0 100.0 100.0 100.0 100.0
Workforce information services 5.3 1.5 0.9 0.0 0.0
Career guidance 57.7 71.5 55.6 74.6 63.0
Staff-assisted job search 21.2 13.9 24.0 13.5 7.4
Referred to employment 21.9 21.2 17.0 31.0 14.8
Referred to Federal training 84.7 99.7 92.1 96.8 96.3
Assistance with UI 3.5 1.0 1.5 0.8 0.0
Other basic services 0.5 0.0 0.4 0.0 0.0
Individualized Career Services
Any individualized career service 87.9 99.7 92.9 97.6 96.3
IEP created 1.2 0.0 0.0 0.0 0.0
Internships or work experience 4.4 11.4 9.7 10.3 7.4
Employment, excluding transitional jobs 4.4 11.4 9.7 10.3 7.4
Transitional jobs 0.0 0.0 0.0 0.0 0.0
Other work experience 0.0 0.0 0.0 0.0 0.0
Financial literacy services 0.1 0.5 0.0 0.8 0.0
English as a second language services 0.1 0.0 0.0 0.0 0.0
Pre-vocational services 0.2 0.2 0.2 0.0 0.0
Other individualized services 82.0 87.6 83.0 86.5 88.9

Dislocated Workers
PY 2019 Illinois State Data Book 184
Unemployment Compensation Status Long-Term Displaced
Claimant Exhaustee Neither Unemployed Homemaker
Weeks Participated
Average number of weeks 57.0 69.9 82.4 53.1 70.3
4 or fewer weeks 10.1 2.2 4.5 4.8 7.4
5 to 13 weeks 10.7 7.0 4.3 12.7 11.1
14 to 26 weeks 19.0 16.2 15.9 15.1 11.1
27 to 52 weeks 24.8 24.5 28.5 27.0 14.8
53 to 104 weeks 19.3 27.9 15.7 27.0 22.2
More than 104 weeks 16.2 22.2 31.1 13.5 33.3
Other Assistance
Needs-related payments 0.0 0.0 0.0 0.0 0.0
Supportive services 0.0 0.0 0.0 0.0 0.0
Rapid Response 22.5 23.7 55.6 8.7 3.7
Disaster relief employment 0.0 0.0 0.0 0.0 0.0
Reason for Exit
Institutionalized, including criminal offenders
0.0 0.2 0.2 0.0 0.0
Health/medical 0.7 2.5 0.2 4.0 0.0
Deceased 0.1 0.2 0.2 0.0 0.0
Reserve called to active duty 0.0 0.0 0.0 0.0 0.0
Training Services
Received any training 63.8 74.1 69.1 69.0 85.2
Characteristics of Training (among trainees)
Number of trainees 2,139 444 322 87 23
Type of training
On-the-job training 5.1 10.6 12.1 14.9 0.0
Skill upgrading 74.0 73.4 60.6 82.8 100.0
Entrepreneurial training 0.0 0.0 0.0 0.0 0.0
ABE or ESL with other training 0.1 0.0 0.0 0.0 0.0
Customized training 0.8 2.7 1.6 1.1 0.0
Other occupational skills training 16.4 14.4 26.1 4.6 4.3
Prerequisite training 0.0 0.0 0.0 0.0 0.0
Registered apprenticeship 0.6 1.6 0.0 1.1 0.0
Other non-occupational training 0.0 0.0 0.0 0.0 0.0
Job readiness training in conjunction with other training
0.0 0.0 0.0 0.0 0.0
Completed training 81.0 84.5 83.5 78.2 87.0
ITA established 9.0 6.3 5.6 8.0 21.7
Pell grant recipients 2.6 6.5 7.8 1.1 21.7
Program(s) operated by the private sector 57.4 59.5 33.9 69.0 43.5

Dislocated Workers
PY 2019 Illinois State Data Book 185
Unemployment Compensation Status Long-Term Displaced
Claimant Exhaustee Neither Unemployed Homemaker
Characteristics of Training (among trainees) (cont’d)
Weeks of training
Average number of weeks 37.8 39.3 44.3 32.3 51.7
4 or fewer weeks 5.1 5.6 3.4 5.7 13.0
5 to 13 weeks 29.1 23.9 17.7 27.6 13.0
14 to 26 weeks 21.3 25.0 30.4 21.8 17.4
27 to 52 weeks 20.1 19.6 17.7 24.1 17.4
53 to 104 weeks 16.3 19.1 20.8 18.4 21.7
More than 104 weeks 8.1 6.8 9.9 2.3 17.4
Occupation of training
Management 14.6 13.3 5.6 11.5 13.6
Business and financial 4.8 5.9 3.4 2.3 4.5
Computer and mathematical 17.7 19.0 8.1 26.4 13.6
Architecture and engineering 1.4 1.4 2.2 0.0 0.0
Education, training, and library 3.3 4.1 4.7 2.3 0.0
Healthcare practitioners and technical 6.0 9.5 15.2 8.0 40.9
Healthcare support 3.9 5.6 3.4 4.6 9.1
Food preparation and serving related 0.3 0.0 0.9 0.0 0.0
Personal care and service 0.1 0.2 0.0 0.0 0.0
Sales and related 0.2 0.0 0.6 1.1 0.0
Office and administrative support 4.6 4.5 2.2 1.1 0.0
Construction and extraction 1.1 0.9 1.2 0.0 0.0
Installation, maintenance, and repair 5.1 4.5 21.4 5.7 4.5
Production 10.1 11.7 17.4 17.2 9.1
Transportation and material moving 27.6 20.1 14.0 20.7 4.5
Other occupations 1.4 1.1 3.4 0.0 0.0
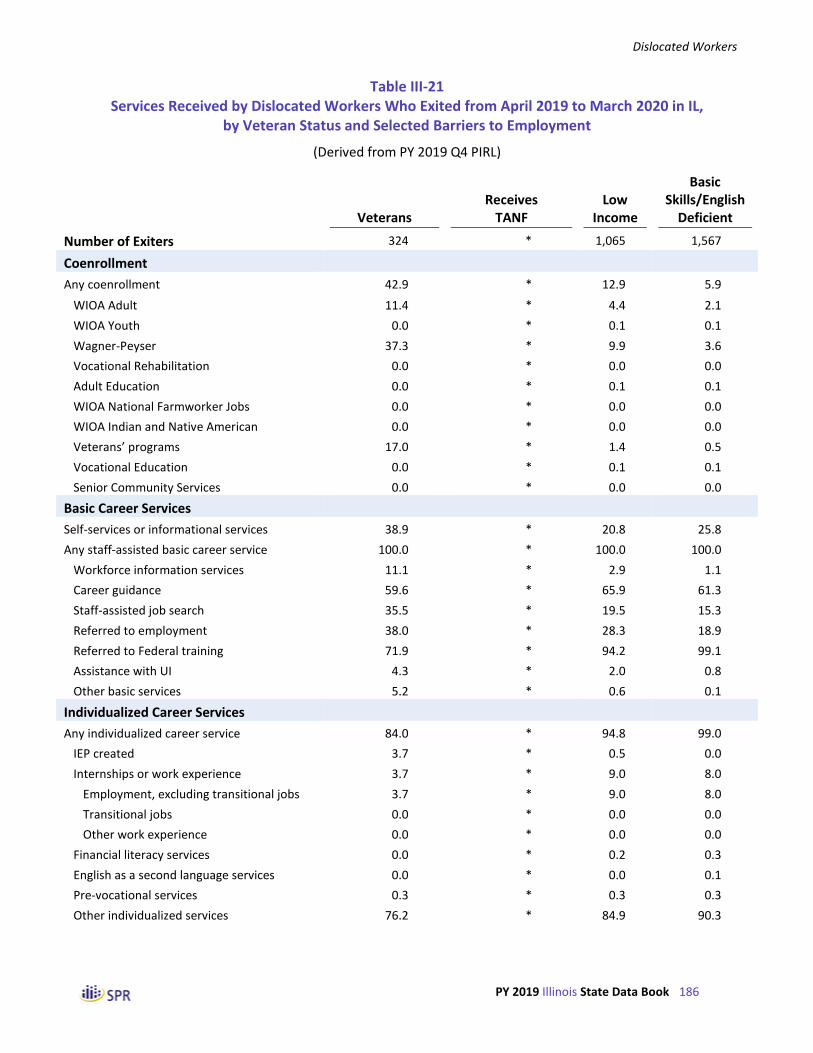
Dislocated Workers
PY 2019 Illinois State Data Book 186
Table III-21 Services Received by Dislocated Workers Who Exited from April 2019 to March 2020 in IL,
by Veteran Status and Selected Barriers to Employment
(Derived from PY 2019 Q4 PIRL)
Veterans Receives
TANF Low
Income
Basic Skills/English
Deficient
Number of Exiters 324 * 1,065 1,567
Coenrollment
Any coenrollment 42.9 * 12.9 5.9
WIOA Adult 11.4 * 4.4 2.1
WIOA Youth 0.0 * 0.1 0.1
Wagner-Peyser 37.3 * 9.9 3.6
Vocational Rehabilitation 0.0 * 0.0 0.0
Adult Education 0.0 * 0.1 0.1
WIOA National Farmworker Jobs 0.0 * 0.0 0.0
WIOA Indian and Native American 0.0 * 0.0 0.0
Veterans’ programs 17.0 * 1.4 0.5
Vocational Education 0.0 * 0.1 0.1
Senior Community Services 0.0 * 0.0 0.0
Basic Career Services
Self-services or informational services 38.9 * 20.8 25.8
Any staff-assisted basic career service 100.0 * 100.0 100.0
Workforce information services 11.1 * 2.9 1.1
Career guidance 59.6 * 65.9 61.3
Staff-assisted job search 35.5 * 19.5 15.3
Referred to employment 38.0 * 28.3 18.9
Referred to Federal training 71.9 * 94.2 99.1
Assistance with UI 4.3 * 2.0 0.8
Other basic services 5.2 * 0.6 0.1
Individualized Career Services
Any individualized career service 84.0 * 94.8 99.0
IEP created 3.7 * 0.5 0.0
Internships or work experience 3.7 * 9.0 8.0
Employment, excluding transitional jobs 3.7 * 9.0 8.0
Transitional jobs 0.0 * 0.0 0.0
Other work experience 0.0 * 0.0 0.0
Financial literacy services 0.0 * 0.2 0.3
English as a second language services 0.0 * 0.0 0.1
Pre-vocational services 0.3 * 0.3 0.3
Other individualized services 76.2 * 84.9 90.3

Dislocated Workers
PY 2019 Illinois State Data Book 187
Veterans Receives TANF Low
Income
Basic Skills/English
Deficient
Weeks Participated
Average number of weeks 43.7 * 47.8 68.2
4 or fewer weeks 18.5 * 6.4 2.9
5 to 13 weeks 11.1 * 9.0 10.1
14 to 26 weeks 12.7 * 21.6 22.6
27 to 52 weeks 34.9 * 31.1 25.7
53 to 104 weeks 12.0 * 22.3 17.2
More than 104 weeks 10.8 * 9.7 21.5
Other Assistance
Needs-related payments 0.0 * 0.0 0.0
Supportive services 0.0 * 0.1 0.1
Rapid Response 18.2 * 11.2 34.4
Disaster relief employment 0.0 * 0.0 0.0
Reason for Exit
Institutionalized, including criminal offenders 0.0 * 0.0 0.1
Health/medical 0.3 * 1.2 0.7
Deceased 0.0 * 0.2 0.1
Reserve called to active duty 0.3 * 0.1 0.0
Training Services
Received any training 54.6 * 68.3 71.1
Characteristics of Training (among trainees)
Number of trainees 177 * 727 1,114
Type of training
On-the-job training 3.4 * 11.0 9.1
Skill upgrading 81.9 * 84.9 67.4
Entrepreneurial training 0.0 * 0.0 0.0
ABE or ESL with other training 0.0 * 0.0 0.2
Customized training 0.0 * 2.5 2.1
Other occupational skills training 15.3 * 2.8 14.6
Prerequisite training 0.0 * 0.0 0.0
Registered apprenticeship 0.6 * 1.1 0.4
Other non-occupational training 0.0 * 0.0 0.0
Job readiness training in conjunction with other training
0.0 * 0.0 0.0
Completed training 85.9 * 82.7 79.4
ITA established 11.3 * 5.9 6.6
Pell grant recipients 4.5 * 5.5 2.7
Program(s) operated by the private sector 37.3 * 61.6 58.9

Dislocated Workers
PY 2019 Illinois State Data Book 188
Veterans Receives TANF Low
Income
Basic Skills/English
Deficient
Characteristics of Training (among trainees) (cont’d)
Weeks of training
Average number of weeks 29.3 * 32.2 36.8
4 or fewer weeks 5.6 * 3.9 5.7
5 to 13 weeks 26.6 * 27.8 32.7
14 to 26 weeks 35.6 * 29.4 21.9
27 to 52 weeks 19.8 * 21.9 16.1
53 to 104 weeks 9.0 * 12.9 15.0
More than 104 weeks 3.4 * 4.1 8.7
Occupation of training
Management 9.0 * 10.1 6.6
Business and financial 2.3 * 3.9 3.1
Computer and mathematical 14.1 * 13.2 8.7
Architecture and engineering 1.1 * 0.6 1.1
Education, training, and library 2.3 * 1.8 7.1
Healthcare practitioners and technical 5.6 * 7.4 4.5
Healthcare support 0.6 * 8.0 5.8
Food preparation and serving related 0.0 * 0.3 0.4
Personal care and service 0.0 * 0.0 0.2
Sales and related 0.0 * 0.1 0.4
Office and administrative support 1.1 * 3.7 5.2
Construction and extraction 1.7 * 1.1 1.0
Installation, maintenance, and repair 32.2 * 8.7 6.7
Production 6.2 * 12.3 16.1
Transportation and material moving 23.2 * 28.7 35.7
Other occupations 1.1 * 1.5 1.3

Dislocated Workers
PY 2019 Illinois State Data Book 189
Table III-22 Services Received by Dislocated Workers Who Exited from April 2019 to March 2020 in IL,
by Highest Educational Level
(Derived from PY 2019 Q4 PIRL)
No Level
Completed
HS Graduate or
Equivalent Some Post-secondary
Technical or Vocational Certificate
Post-secondary
Degree
Number of Exiters 272 1,916 566 138 1,526
Coenrollment
Any coenrollment 14.0 13.4 35.9 24.6 15.6
WIOA Adult 4.8 4.8 15.0 10.1 4.8
WIOA Youth 0.0 0.1 0.0 0.0 0.0
Wagner-Peyser 11.4 12.1 34.3 21.7 14.5
Vocational Rehabilitation 0.0 0.0 0.0 0.0 0.0
Adult Education 0.4 0.1 0.0 0.0 0.0
WIOA National Farmworker Jobs 0.0 0.0 0.0 0.0 0.0
WIOA Indian and Native American 0.0 0.0 0.0 0.0 0.0
Veterans’ programs 0.4 1.1 2.3 0.7 1.2
Vocational Education 0.0 0.1 0.0 0.7 0.1
Senior Community Services 0.0 0.0 0.0 0.0 0.0
Basic Career Services
Self-services or informational services 23.9 31.3 43.6 44.2 35.3
Any staff-assisted basic career service 100.0 99.9 100.0 100.0 100.0
Workforce information services 1.8 4.0 8.3 4.3 3.6
Career guidance 50.4 60.1 55.8 54.3 61.7
Staff-assisted job search 15.1 16.7 24.6 18.8 25.0
Referred to employment 8.5 22.7 24.6 13.0 21.4
Referred to Federal training 90.1 90.8 70.7 81.9 89.7
Assistance with UI 1.5 2.4 6.4 3.6 2.5
Other basic services 0.0 0.4 1.1 0.0 0.3
Individualized Career Services
Any individualized career service 90.1 92.5 77.9 85.5 91.7
IEP created 0.4 0.8 2.1 0.0 0.9
Internships or work experience 0.7 8.5 6.0 6.5 3.4
Employment, excluding transitional jobs 0.7 8.5 6.0 6.5 3.4
Transitional jobs 0.0 0.0 0.0 0.0 0.0
Other work experience 0.0 0.0 0.0 0.0 0.0
Financial literacy services 0.0 0.2 0.2 0.7 0.1
English as a second language services 0.7 0.0 0.0 0.0 0.0
Pre-vocational services 0.4 0.2 0.2 0.0 0.1
Other individualized services 87.9 82.9 69.4 78.3 87.3
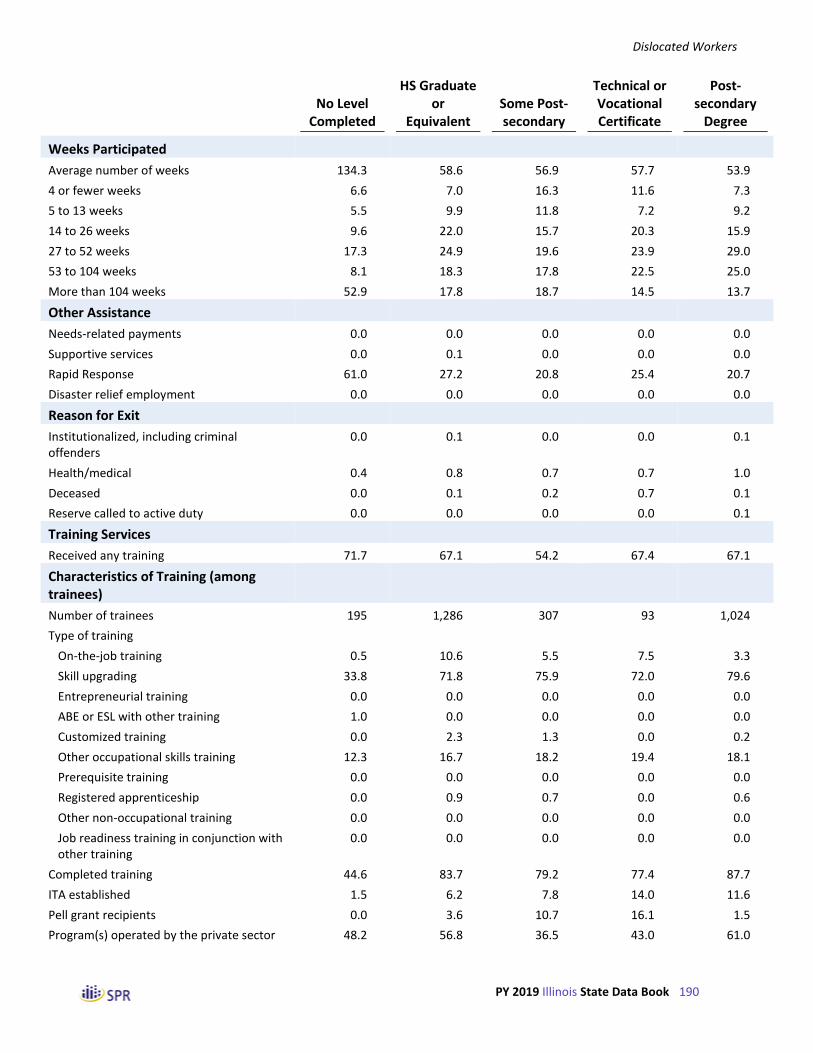
Dislocated Workers
PY 2019 Illinois State Data Book 190
No Level
Completed
HS Graduate or
Equivalent Some Post-secondary
Technical or Vocational Certificate
Post-secondary
Degree
Weeks Participated
Average number of weeks 134.3 58.6 56.9 57.7 53.9
4 or fewer weeks 6.6 7.0 16.3 11.6 7.3
5 to 13 weeks 5.5 9.9 11.8 7.2 9.2
14 to 26 weeks 9.6 22.0 15.7 20.3 15.9
27 to 52 weeks 17.3 24.9 19.6 23.9 29.0
53 to 104 weeks 8.1 18.3 17.8 22.5 25.0
More than 104 weeks 52.9 17.8 18.7 14.5 13.7
Other Assistance
Needs-related payments 0.0 0.0 0.0 0.0 0.0
Supportive services 0.0 0.1 0.0 0.0 0.0
Rapid Response 61.0 27.2 20.8 25.4 20.7
Disaster relief employment 0.0 0.0 0.0 0.0 0.0
Reason for Exit
Institutionalized, including criminal offenders
0.0 0.1 0.0 0.0 0.1
Health/medical 0.4 0.8 0.7 0.7 1.0
Deceased 0.0 0.1 0.2 0.7 0.1
Reserve called to active duty 0.0 0.0 0.0 0.0 0.1
Training Services
Received any training 71.7 67.1 54.2 67.4 67.1
Characteristics of Training (among trainees)
Number of trainees 195 1,286 307 93 1,024
Type of training
On-the-job training 0.5 10.6 5.5 7.5 3.3
Skill upgrading 33.8 71.8 75.9 72.0 79.6
Entrepreneurial training 0.0 0.0 0.0 0.0 0.0
ABE or ESL with other training 1.0 0.0 0.0 0.0 0.0
Customized training 0.0 2.3 1.3 0.0 0.2
Other occupational skills training 12.3 16.7 18.2 19.4 18.1
Prerequisite training 0.0 0.0 0.0 0.0 0.0
Registered apprenticeship 0.0 0.9 0.7 0.0 0.6
Other non-occupational training 0.0 0.0 0.0 0.0 0.0
Job readiness training in conjunction with other training
0.0 0.0 0.0 0.0 0.0
Completed training 44.6 83.7 79.2 77.4 87.7
ITA established 1.5 6.2 7.8 14.0 11.6
Pell grant recipients 0.0 3.6 10.7 16.1 1.5
Program(s) operated by the private sector 48.2 56.8 36.5 43.0 61.0

Dislocated Workers
PY 2019 Illinois State Data Book 191
No Level
Completed
HS Graduate or
Equivalent Some Post-secondary
Technical or Vocational Certificate
Post-secondary
Degree
Characteristics of Training (among trainees) (cont’d)
Weeks of training
Average number of weeks 65.5 35.8 50.0 36.6 34.1
4 or fewer weeks 4.6 5.7 2.9 4.3 5.0
5 to 13 weeks 15.9 33.2 24.8 24.7 22.3
14 to 26 weeks 13.3 23.3 16.9 25.8 25.7
27 to 52 weeks 10.8 16.3 19.5 21.5 25.6
53 to 104 weeks 26.2 13.8 24.4 17.2 17.8
More than 104 weeks 29.2 7.7 11.4 6.5 3.7
Occupation of training
Management 1.5 5.8 11.4 3.2 26.9
Business and financial 0.5 2.8 4.9 3.2 8.2
Computer and mathematical 2.6 5.6 16.0 5.4 34.9
Architecture and engineering 0.0 1.6 2.6 1.1 1.2
Education, training, and library 27.7 3.0 1.6 3.2 0.3
Healthcare practitioners and technical 1.0 6.9 17.0 20.4 5.6
Healthcare support 5.1 5.4 5.6 9.7 1.4
Food preparation and serving related 0.0 0.5 0.3 0.0 0.3
Personal care and service 0.5 0.1 0.0 0.0 0.2
Sales and related 0.0 0.2 0.3 0.0 0.4
Office and administrative support 4.6 5.1 3.9 5.4 3.2
Construction and extraction 1.5 1.5 0.7 1.1 0.6
Installation, maintenance, and repair 4.6 10.1 4.9 12.9 3.2
Production 31.8 15.1 7.8 8.6 3.5
Transportation and material moving 24.1 38.4 20.3 25.8 9.5
Other occupations 1.0 1.3 2.9 2.2 1.5

Dislocated Workers
PY 2019 Illinois State Data Book 192
Table III-23 Services Received by Dislocated Workers Who Exited from April 2019 to March 2020 in IL,
by Selected Other Characteristics
(Derived from PY 2019 Q4 PIRL)
School Status Single
Attending Not Attending Ex-Offenders Homeless Parents
Number of Exiters 31 4,387 256 17 400
Coenrollment
Any coenrollment 12.9 17.5 10.5 76.5 18.0
WIOA Adult 6.5 6.3 6.6 17.6 5.8
WIOA Youth 0.0 0.0 0.0 0.0 0.3
Wagner-Peyser 12.9 16.0 6.6 70.6 15.8
Vocational Rehabilitation 0.0 0.0 0.0 0.0 0.0
Adult Education 0.0 0.0 0.4 0.0 0.0
WIOA National Farmworker Jobs 0.0 0.0 0.0 0.0 0.0
WIOA Indian and Native American 0.0 0.0 0.0 0.0 0.0
Veterans’ programs 3.2 1.2 2.7 23.5 1.0
Vocational Education 0.0 0.1 0.0 0.0 0.3
Senior Community Services 0.0 0.0 0.0 0.0 0.0
Basic Career Services
Self-services or informational services 67.7 34.0 44.5 47.1 47.0
Any staff-assisted basic career service 100.0 100.0 100.0 100.0 100.0
Workforce information services 6.5 4.3 3.5 29.4 2.8
Career guidance 45.2 59.4 56.3 82.4 58.5
Staff-assisted job search 12.9 20.6 15.6 35.3 20.8
Referred to employment 6.5 21.4 10.5 23.5 8.5
Referred to Federal training 87.1 87.5 95.3 52.9 91.5
Assistance with UI 6.5 2.9 0.8 5.9 2.8
Other basic services 0.0 0.4 1.6 11.8 0.0
Individualized Career Services
Any individualized career service 93.5 90.0 98.4 88.2 93.3
IEP created 3.2 0.9 0.4 11.8 0.8
Internships or work experience 3.2 5.9 5.5 0.0 4.3
Employment, excluding transitional jobs 3.2 5.9 5.5 0.0 4.3
Transitional jobs 0.0 0.0 0.0 0.0 0.0
Other work experience 0.0 0.0 0.0 0.0 0.0
Financial literacy services 0.0 0.2 0.0 0.0 0.0
English as a second language services 0.0 0.0 0.0 0.0 0.0
Pre-vocational services 0.0 0.2 0.8 0.0 0.3
Other individualized services 87.1 82.8 91.8 76.5 88.0

Dislocated Workers
PY 2019 Illinois State Data Book 193
School Status Single
Attending Not Attending Ex-Offenders Homeless Parents
Weeks Participated
Average number of weeks 65.7 61.4 46.0 51.5 88.0
4 or fewer weeks 6.5 8.5 2.0 23.5 5.5
5 to 13 weeks 9.7 9.6 13.7 17.6 7.8
14 to 26 weeks 9.7 18.3 25.4 0.0 12.3
27 to 52 weeks 22.6 25.1 31.3 17.6 19.0
53 to 104 weeks 29.0 20.0 17.6 29.4 22.5
More than 104 weeks 22.6 18.5 10.2 11.8 33.0
Other Assistance
Needs-related payments 0.0 0.0 0.0 0.0 0.0
Supportive services 0.0 0.0 0.0 0.0 0.3
Rapid Response 9.7 26.3 20.7 17.6 38.5
Disaster relief employment 0.0 0.0 0.0 0.0 0.0
Reason for Exit
Institutionalized, including criminal offenders
0.0 0.1 0.4 0.0 0.0
Health/medical 0.0 0.9 0.4 0.0 1.0
Deceased 0.0 0.1 0.0 0.0 0.3
Reserve called to active duty 0.0 0.0 0.0 0.0 0.0
Training Services
Received any training 83.9 65.6 78.5 41.2 74.5
Characteristics of Training (among trainees)
Number of trainees 26 2,879 201 * 298
Type of training
On-the-job training 0.0 6.8 2.5 * 2.0
Skill upgrading 96.2 72.2 85.6 * 65.4
Entrepreneurial training 0.0 0.0 0.0 * 0.0
ABE or ESL with other training 0.0 0.1 0.0 * 0.0
Customized training 0.0 1.2 0.5 * 0.0
Other occupational skills training 3.8 17.3 10.4 * 26.8
Prerequisite training 0.0 0.0 0.0 * 0.0
Registered apprenticeship 0.0 0.7 0.5 * 0.0
Other non-occupational training 0.0 0.0 0.0 * 0.0
Job readiness training in conjunction with other training
0.0 0.0 0.0 * 0.0
Completed training 76.9 81.9 82.6 * 78.9
ITA established 15.4 8.2 8.5 * 8.4
Pell grant recipients 69.2 3.2 9.5 * 12.8
Program(s) operated by the private sector 26.9 55.4 46.8 * 33.2
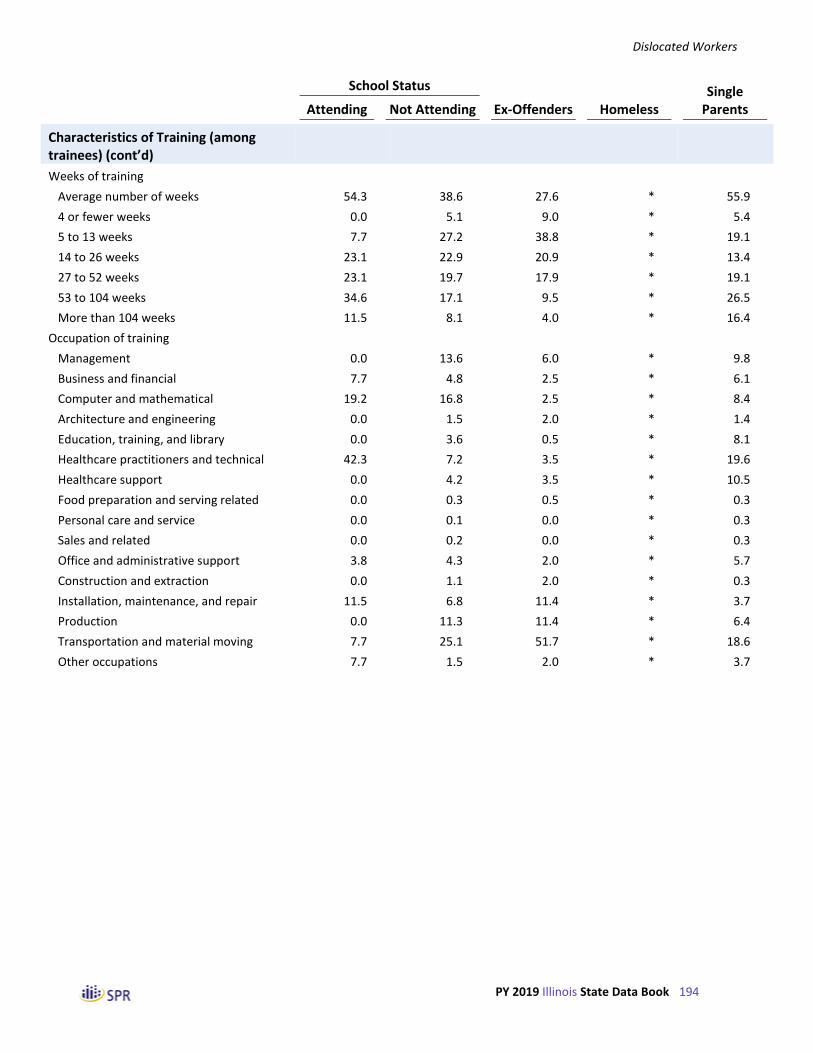
Dislocated Workers
PY 2019 Illinois State Data Book 194
School Status Single
Attending Not Attending Ex-Offenders Homeless Parents
Characteristics of Training (among trainees) (cont’d)
Weeks of training
Average number of weeks 54.3 38.6 27.6 * 55.9
4 or fewer weeks 0.0 5.1 9.0 * 5.4
5 to 13 weeks 7.7 27.2 38.8 * 19.1
14 to 26 weeks 23.1 22.9 20.9 * 13.4
27 to 52 weeks 23.1 19.7 17.9 * 19.1
53 to 104 weeks 34.6 17.1 9.5 * 26.5
More than 104 weeks 11.5 8.1 4.0 * 16.4
Occupation of training
Management 0.0 13.6 6.0 * 9.8
Business and financial 7.7 4.8 2.5 * 6.1
Computer and mathematical 19.2 16.8 2.5 * 8.4
Architecture and engineering 0.0 1.5 2.0 * 1.4
Education, training, and library 0.0 3.6 0.5 * 8.1
Healthcare practitioners and technical 42.3 7.2 3.5 * 19.6
Healthcare support 0.0 4.2 3.5 * 10.5
Food preparation and serving related 0.0 0.3 0.5 * 0.3
Personal care and service 0.0 0.1 0.0 * 0.3
Sales and related 0.0 0.2 0.0 * 0.3
Office and administrative support 3.8 4.3 2.0 * 5.7
Construction and extraction 0.0 1.1 2.0 * 0.3
Installation, maintenance, and repair 11.5 6.8 11.4 * 3.7
Production 0.0 11.3 11.4 * 6.4
Transportation and material moving 7.7 25.1 51.7 * 18.6
Other occupations 7.7 1.5 2.0 * 3.7

Dislocated Workers
PY 2019 Illinois State Data Book 195
Table III-25 Services Received by Dislocated Workers Who Exited from April 2019 to March 2020, by State
(Derived from PY 2019 Q4 PIRL)
Received Career Services
Number of Exiters
Basic
Individualized
Only Career Services
Received Training
Nation 238,793 99.8 73.9 85.5 14.3
Alabama 353 100.0 100.0 4.0 96.0
Alaska 178 100.0 100.0 23.6 76.4
Arizona 707 100.0 68.2 68.0 32.0
Arkansas 263 98.9 97.0 40.3 59.7
California 16,910 100.0 99.0 66.9 33.1
Colorado 753 100.0 99.3 44.9 55.1
Connecticut 976 100.0 100.0 43.2 56.8
Delaware 246 100.0 74.4 23.6 76.4
District of Columbia 347 100.0 100.0 72.0 28.0
Florida 1,588 100.0 97.9 20.5 79.5
Georgia 1,205 100.0 73.5 40.5 59.5
Guam 4 100.0 100.0 100.0 0.0
Hawaii 71 100.0 100.0 52.1 47.9
Idaho 292 100.0 99.0 40.1 59.9
Illinois 4,418 100.0 90.0 34.2 65.8
Indiana 3,433 100.0 94.7 90.5 9.5
Iowa 287 100.0 100.0 19.5 80.5
Kansas 300 99.0 69.0 67.7 32.3
Kentucky 1,542 100.0 99.5 62.1 37.9
Louisiana 1,436 100.0 89.6 73.1 26.9
Maine 136 100.0 97.1 30.1 69.9
Maryland 589 100.0 100.0 46.0 54.0
Massachusetts 1,730 100.0 99.9 44.6 55.4
Michigan 1,382 98.9 98.3 46.2 52.8
Minnesota 1,419 99.9 100.0 61.4 38.6
Mississippi 2,649 100.0 80.6 88.2 11.8
Missouri 358 100.0 100.0 15.4 84.6
Montana 62 100.0 100.0 51.6 48.4
Nebraska 158 100.0 100.0 41.1 58.9
Nevada 395 100.0 100.0 25.3 74.7
New Hampshire 150 100.0 98.0 34.7 65.3
New Jersey 2,909 95.5 82.9 20.3 79.3
New Mexico 415 100.0 100.0 31.8 68.2
New York 143,158 100.0 74.5 98.0 2.0
North Carolina 1,819 100.0 100.0 35.1 64.9
North Dakota 22 100.0 100.0 9.1 90.9

Dislocated Workers
PY 2019 Illinois State Data Book 196
Received Career Services
Number of Exiters
Basic
Individualized
Only Career Services
Received Training
Northern Mariana Islands 31 100.0 100.0 90.3 9.7
Ohio 2,620 99.6 45.0 73.8 26.2
Oklahoma 275 100.0 97.5 30.9 69.1
Oregon 22,210 99.7 8.0 96.1 3.5
Palau 16 100.0 100.0 75.0 25.0
Pennsylvania 5,069 100.0 99.2 57.5 42.5
Puerto Rico - - - - -
Rhode Island 283 100.0 100.0 42.0 58.0
South Carolina 633 100.0 100.0 48.8 51.2
South Dakota 1,065 100.0 100.0 95.6 4.4
Tennessee 1,242 100.0 99.8 47.3 52.7
Texas 2,988 100.0 98.8 50.0 50.0
Utah 479 100.0 99.8 35.7 64.3
Vermont 45 100.0 100.0 15.6 84.4
Virgin Islands 180 100.0 100.0 63.3 36.7
Virginia 843 100.0 100.0 37.7 62.3
Washington 5,955 96.9 87.2 79.5 17.4
West Virginia 1,104 87.8 60.0 50.6 37.1
Wisconsin 1,040 100.0 99.1 53.8 46.3
Wyoming 55 100.0 100.0 32.7 67.3

Dislocated Workers
PY 2019 Illinois State Data Book 197
Table III-26 Training Services Received by Dislocated Worker Trainees Who Exited
from April 2019 to March 2020, by State
(Derived from PY 2019 Q4 PIRL)
Number of
Trainees
ABE/GED or Prerequisite
Training Work-based
Training
Other Occupational
Training Other
Training
Nation 34,244 2.4 9.3 89.8 0.7
Alabama 339 0.3 34.5 67.0 7.7
Alaska 136 0.7 49.3 52.2 0.7
Arizona 226 3.1 11.9 85.8 0.4
Arkansas 157 2.5 1.3 98.7 0.0
California 5,599 0.4 7.8 93.0 0.7
Colorado 415 0.5 10.4 91.8 0.0
Connecticut 554 0.4 7.0 93.3 8.8
Delaware 188 0.0 1.6 98.9 0.0
District of Columbia 97 0.0 4.1 96.9 0.0
Florida 1,263 0.2 13.7 86.1 1.1
Georgia 717 0.1 6.7 93.2 0.0
Guam 0 - - - -
Hawaii 34 0.0 5.9 97.1 0.0
Idaho 175 2.9 6.9 89.7 2.3
Illinois 2,905 8.5 7.5 88.8 0.0
Indiana 325 9.8 5.5 86.5 0.0
Iowa 231 2.6 2.2 97.4 2.2
Kansas 97 1.0 9.3 90.7 0.0
Kentucky 584 0.0 1.7 98.3 0.0
Louisiana 387 0.0 14.7 85.8 0.0
Maine 95 0.0 8.4 92.6 0.0
Maryland 318 0.9 2.2 97.2 0.3
Massachusetts 958 8.8 0.3 93.1 0.6
Michigan 730 0.0 14.8 85.1 0.5
Minnesota 548 0.0 1.5 98.9 0.0
Mississippi 312 0.3 57.1 42.9 0.0
Missouri 303 3.6 16.2 84.5 0.7
Montana 30 0.0 20.0 80.0 0.0
Nebraska 93 0.0 30.1 71.0 0.0
Nevada 295 0.0 8.8 99.7 0.3
New Hampshire 98 0.0 10.2 89.8 0.0
New Jersey 2,307 1.5 1.6 96.8 0.6
New Mexico 283 0.0 16.3 85.5 0.0
New York 2,831 3.2 7.5 90.1 0.6
North Carolina 1,181 0.3 13.7 86.9 0.0

Dislocated Workers
PY 2019 Illinois State Data Book 198
Number of
Trainees
ABE/GED or Prerequisite
Training Work-based
Training
Other Occupational
Training Other
Training
North Dakota 20 0.0 0.0 100.0 0.0
Northern Mariana Islands 3 0.0 0.0 100.0 0.0
Ohio 687 0.0 10.5 89.5 0.0
Oklahoma 190 0.5 1.6 98.4 0.0
Oregon 787 2.2 19.4 80.6 0.0
Palau 4 0.0 100.0 0.0 0.0
Pennsylvania 2,156 6.0 13.7 83.6 0.0
Puerto Rico - - - - -
Rhode Island 164 1.2 15.2 86.6 0.0
South Carolina 324 4.6 14.2 86.4 0.0
South Dakota 47 0.0 38.3 42.6 21.3
Tennessee 655 0.3 11.1 89.0 0.0
Texas 1,495 5.2 8.8 91.1 0.1
Utah 308 0.6 2.9 83.1 14.9
Vermont 38 0.0 0.0 100.0 0.0
Virgin Islands 66 6.1 25.8 69.7 0.0
Virginia 525 0.0 3.6 96.8 0.0
Washington 1,036 0.0 10.2 91.2 0.9
West Virginia 410 0.0 5.1 94.9 0.0
Wisconsin 481 1.7 4.8 94.0 0.6
Wyoming 37 0.0 0.0 100.0 0.0
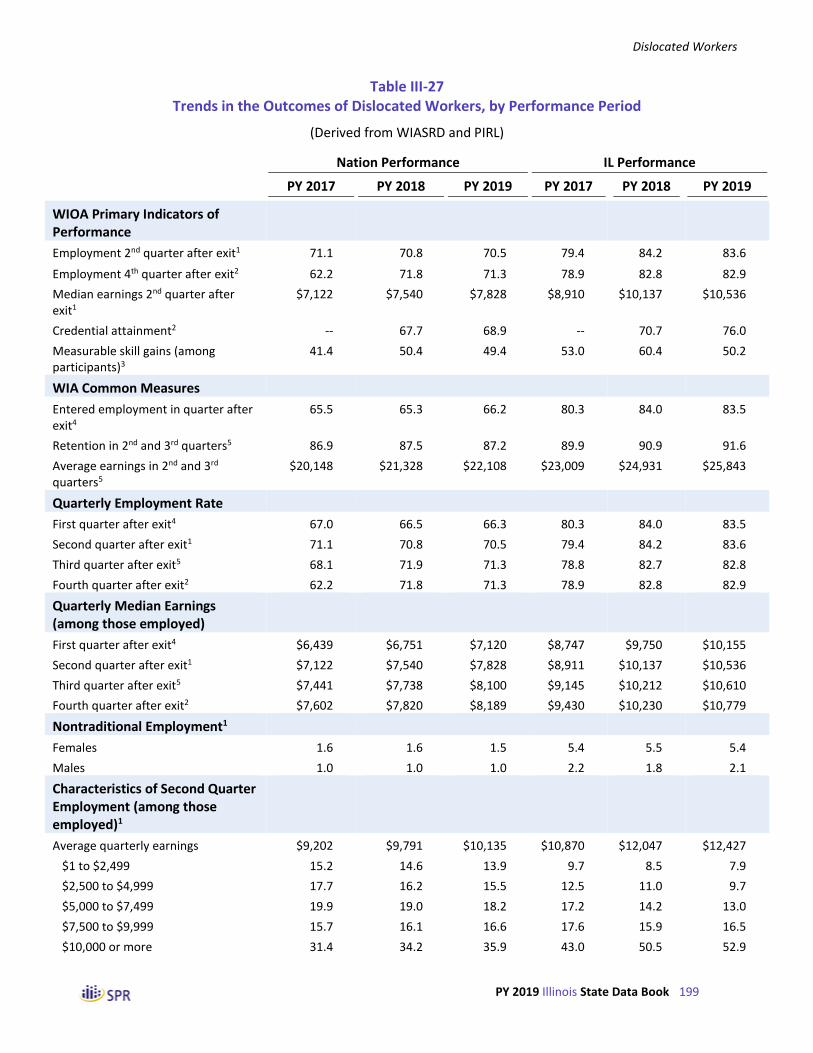
Dislocated Workers
PY 2019 Illinois State Data Book 199
Table III-27 Trends in the Outcomes of Dislocated Workers, by Performance Period
(Derived from WIASRD and PIRL)
Nation Performance IL Performance
PY 2017 PY 2018 PY 2019 PY 2017 PY 2018 PY 2019
WIOA Primary Indicators of Performance
Employment 2nd quarter after exit1 71.1 70.8 70.5 79.4 84.2 83.6
Employment 4th quarter after exit2 62.2 71.8 71.3 78.9 82.8 82.9
Median earnings 2nd quarter after exit1
$7,122 $7,540 $7,828 $8,910 $10,137 $10,536
Credential attainment2 -- 67.7 68.9 -- 70.7 76.0
Measurable skill gains (among participants)3
41.4 50.4 49.4 53.0 60.4 50.2
WIA Common Measures
Entered employment in quarter after exit4
65.5 65.3 66.2 80.3 84.0 83.5
Retention in 2nd and 3rd quarters5 86.9 87.5 87.2 89.9 90.9 91.6
Average earnings in 2nd and 3rd quarters5
$20,148 $21,328 $22,108 $23,009 $24,931 $25,843
Quarterly Employment Rate
First quarter after exit4 67.0 66.5 66.3 80.3 84.0 83.5
Second quarter after exit1 71.1 70.8 70.5 79.4 84.2 83.6
Third quarter after exit5 68.1 71.9 71.3 78.8 82.7 82.8
Fourth quarter after exit2 62.2 71.8 71.3 78.9 82.8 82.9
Quarterly Median Earnings (among those employed)
First quarter after exit4 $6,439 $6,751 $7,120 $8,747 $9,750 $10,155
Second quarter after exit1 $7,122 $7,540 $7,828 $8,911 $10,137 $10,536
Third quarter after exit5 $7,441 $7,738 $8,100 $9,145 $10,212 $10,610
Fourth quarter after exit2 $7,602 $7,820 $8,189 $9,430 $10,230 $10,779
Nontraditional Employment1
Females 1.6 1.6 1.5 5.4 5.5 5.4
Males 1.0 1.0 1.0 2.2 1.8 2.1
Characteristics of Second Quarter Employment (among those employed)1
Average quarterly earnings $9,202 $9,791 $10,135 $10,870 $12,047 $12,427
$1 to $2,499 15.2 14.6 13.9 9.7 8.5 7.9
$2,500 to $4,999 17.7 16.2 15.5 12.5 11.0 9.7
$5,000 to $7,499 19.9 19.0 18.2 17.2 14.2 13.0
$7,500 to $9,999 15.7 16.1 16.6 17.6 15.9 16.5
$10,000 or more 31.4 34.2 35.9 43.0 50.5 52.9

Dislocated Workers
PY 2019 Illinois State Data Book 200
Nation Performance IL Performance
PY 2017 PY 2018 PY 2019 PY 2017 PY 2018 PY 2019
Characteristics of Second Quarter Employment (cont’d)1
Occupation of employment
Management 7.2 7.9 8.5 4.9 6.9 9.1
Business and financial 4.6 4.8 4.9 3.0 3.7 3.5
Computer and mathematical 5.7 5.9 6.0 4.7 8.7 10.4
Architecture and engineering 2.5 2.6 2.1 2.1 2.7 1.3
Education, training, and library 1.8 2.1 2.9 0.9 1.2 1.7
Healthcare practitioners and technical
4.4 4.3 5.0 4.0 4.6 4.4
Healthcare support 5.0 4.8 4.8 5.0 2.5 3.6
Food preparation and serving 1.8 1.9 2.2 1.7 0.8 0.7
Personal care and service 1.4 1.5 1.4 0.9 0.8 0.6
Sales and related 5.1 5.6 5.5 4.5 3.3 3.9
Office and administrative 18.7 19.1 18.3 11.4 11.4 12.3
Construction and extraction 3.4 3.0 3.0 2.6 2.7 5.9
Installation, maintenance, and repair
4.0 4.4 3.9 3.6 7.7 6.8
Production 13.3 11.4 10.2 22.8 18.4 12.1
Transportation and material moving 12.6 12.3 13.2 21.8 19.4 19.4
Other occupations 8.5 8.5 8.3 6.0 5.2 4.5
Industry of employment
Construction 5.9 5.6 5.6 2.8 3.3 4.2
Manufacturing 11.0 10.0 9.0 18.0 19.3 19.1
Wholesale and retail trade 4.2 4.2 4.1 5.0 4.9 5.4
Transportation and warehousing 4.9 4.8 5.0 10.0 10.3 10.4
Information 1.9 2.0 2.1 1.2 1.2 1.4
Administrative, support, waste management and remediation services
17.8 17.5 17.1 17.5 15.0 13.6
Educational services 3.6 3.4 4.6 4.4 4.6 4.8
Health care and social assistance 13.9 14.9 15.3 12.1 11.4 11.2
Arts, entertainment, and recreation 1.5 1.5 1.6 1.0 0.9 1.0
Accommodation and food services 6.7 6.9 6.6 2.9 2.9 2.9
Other services, inc public administration
2.7 2.7 2.6 2.4 3.0 2.3
Other industry 26.1 26.5 26.4 22.7 23.2 23.8

Dislocated Workers
PY 2019 Illinois State Data Book 201
Nation Performance IL Performance
PY 2017 PY 2018 PY 2019 PY 2017 PY 2018 PY 2019
Types of Credentials Attained (among those with a credential attainment)2
Secondary school diploma/equivalency
-- 0.4 0.5 -- 0.1 0.3
AA, AS, BA, BS or other college -- 10.1 12.0 -- 10.4 15.0
Postgraduate degree -- 17.9 17.8 -- 25.0 24.2
Occupational credential -- 77.1 75.5 -- 76.5 71.8
Other credential -- 0.0 0.0 -- 0.0 0.0
Types of Skill Gains (among those with a measurable skill gain)3
Educational functional gains 0.1 0.3 0.9 0.0 0.3 1.6
Secondary school gains 0.0 0.1 0.2 0.0 0.0 0.0
Postsecondary school gains 11.8 12.8 21.5 7.8 9.6 14.8
Training milestone gains 6.2 14.1 31.0 1.9 9.5 21.8
Occupational skills progression 9.8 24.1 58.2 16.2 33.3 70.8
1 Measured for a four-quarter exit cohort ending with those who exited four quarters prior to the end of the performance quarter.
2 Measured for a four-quarter exit cohort ending with those who exited six quarters prior to the end of the performance quarter.
3 Measured for those who participated during this program year.
4 Measured for a four-quarter exit cohort ending with those who exited three quarters prior to the end of the performance quarter.
5 Measured for a four-quarter exit cohort ending with those who exited five quarters prior to the end of the performance quarter.

Dislocated Workers
PY 2019 Illinois State Data Book 202
Table III-28 Trends in the Number of Dislocated Workers Who Achieved Various Outcomes,
by Performance Period
(Derived from WIASRD and PIRL Files)
Nation Performance IL Performance
PY 2017 PY 2018 PY 2019 PY 2017 PY 2018 PY 2019
WIOA Primary Indicators of Performance
Employment 2nd quarter after exit1 254,344 217,798 198,572 4,406 3,830 3,575
Employment 4th quarter after exit2 227,536 236,197 210,603 4,475 3,909 3,774
Credential attainment2 -- 26,506 25,051 -- 1,843 2,227
Measurable skill gains (among participants)3
10,162 27,186 24,210 823 2,232 1,926
WIA Common Measures
Entered employment in quarter after exit4
194,027 155,023 128,004 3,964 3,846 3,453
Retention in 2nd and 3rd quarters5 193,327 168,480 136,594 4,100 3,482 3,366
Quarterly Employment Rate
First quarter after exit4 231,715 200,255 180,075 3,970 3,857 3,462
Second quarter after exit1 254,344 217,798 198,572 4,406 3,830 3,575
Third quarter after exit5 245,055 229,730 205,833 4,569 3,820 3,637
Fourth quarter after exit2 227,536 236,197 210,603 4,475 3,909 3,774
Nontraditional Employment1
Females 822 471 408 79 77 74
Males 626 328 269 49 39 42
Characteristics of Second Quarter Employment (among those employed)1
Quarterly earnings
$1 to $2,499 38,759 31,737 27,565 432 328 282
$2,500 to $4,999 45,130 35,286 30,719 554 426 348
$5,000 to $7,499 50,648 41,391 36,129 764 548 467
$7,500 to $9,999 39,969 35,150 32,959 780 613 593
$10,000 or more 79,949 74,491 71,437 1,909 1,951 1,896

Dislocated Workers
PY 2019 Illinois State Data Book 203
Nation Performance IL Performance
PY 2017 PY 2018 PY 2019 PY 2017 PY 2018 PY 2019
Characteristics of Second Quarter Employment (cont’d)1
Occupation of employment
Management 1,527 1,673 1,528 39 60 87
Business and financial 970 1,011 875 24 32 33
Computer and mathematical 1,215 1,253 1,077 38 75 99
Architecture and engineering 538 539 374 17 23 12
Education, training, and library 390 447 517 7 10 16
Healthcare practitioners and technical
931 916 898 32 40 42
Healthcare support 1,068 1,023 858 40 22 34
Food preparation and serving 384 404 388 14 7 7
Personal care and service 307 312 256 7 7 6
Sales and related 1,081 1,176 992 36 29 37
Office and administrative 3,975 4,036 3,293 91 99 118
Construction and extraction 731 626 540 21 23 56
Installation, maintenance, and repair
851 925 707 29 67 65
Production 2,833 2,408 1,841 183 159 116
Transportation and material moving 2,670 2,591 2,382 175 168 185
Other occupations 1,801 1,789 1,492 48 45 43
Industry of employment
Construction 13,435 11,069 10,136 119 123 144
Manufacturing 25,007 19,975 16,434 777 723 662
Wholesale and retail trade 9,611 8,428 7,485 216 184 186
Transportation and warehousing 11,150 9,458 9,098 434 384 360
Information 4,273 4,029 3,859 53 46 47
Administrative, support, waste management and remediation services
40,546 34,763 31,280 756 560 473
Educational services 8,146 6,789 8,480 191 173 165
Health care and social assistance 31,680 29,665 27,870 523 426 389
Arts, entertainment, and recreation 3,431 3,074 2,850 42 34 35
Accommodation and food services 15,395 13,662 12,122 126 107 100
Other services, inc public administration
6,075 5,453 4,818 103 112 81
Other industry 59,518 52,658 48,190 983 869 824

Dislocated Workers
PY 2019 Illinois State Data Book 204
Nation Performance IL Performance
PY 2017 PY 2018 PY 2019 PY 2017 PY 2018 PY 2019
Types of Credentials Attained (among those with a credential attainment)2
Secondary school diploma/equivalency
-- 110 128 -- 2 6
AA, AS, BA, BS or other college -- 2,676 2,996 -- 191 335
Postgraduate degree -- 4,755 4,451 -- 460 538
Occupational credential -- 20,435 18,903 -- 1,409 1,600
Other credential -- 0 0 -- 0 0
Types of Skill Gains (among those with a measurable skill gain)3
Educational functional gains 14 80 208 0 7 31
Secondary school gains 4 21 42 0 0 0
Postsecondary school gains 1,195 3,467 5,212 64 214 285
Training milestone gains 625 3,836 7,505 16 213 419
Occupational skills progression 994 6,552 14,083 133 744 1,364
1 Measured for a four-quarter exit cohort ending with those who exited four quarters prior to the end of the performance quarter.
2 Measured for a four-quarter exit cohort ending with those who exited six quarters prior to the end of the performance quarter.
3 Measured for those who participated during this program year.
4 Measured for a four-quarter exit cohort ending with those who exited three quarters prior to the end of the performance quarter.
5 Measured for a four-quarter exit cohort ending with those who exited five quarters prior to the end of the performance quarter.

Dislocated Workers
PY 2019 Illinois State Data Book 205
Table III-29 Outcomes of Dislocated Workers in IL, by Funding Source
(Derived from PY 2019 Q4 PIRL)
Formula Funds
Total All Local Statewide DWG
WIOA Primary Indicators of Performance
Employment 2nd quarter after exit1 83.6 83.6 83.8 82.4 85.4
Employment 4th quarter after exit2 82.9 82.9 82.9 84.2 79.5
Median earnings 2nd quarter after exit1 $10,536 $10,536 $10,467 $11,351 $11,216
Credential attainment2 76.0 76.0 76.1 76.1 83.2
Measurable skill gains (among participants)3 50.2 50.2 51.7 36.4 48.6
WIA Common Measures
Entered employment in quarter after exit4 83.5 83.5 83.8 81.4 92.0
Retention in 2nd and 3rd quarters5 91.6 91.6 91.6 95.2 91.5
Average earnings in 2nd and 3rd quarters5 $25,843 $25,843 $25,769 $27,507 $20,538
Quarterly Employment Rate
First quarter after exit4 83.5 83.5 83.8 81.4 92.0
Second quarter after exit1 83.6 83.6 83.8 82.4 85.4
Third quarter after exit5 82.8 82.8 82.7 84.2 83.3
Fourth quarter after exit2 82.9 82.9 82.9 84.2 79.5
Quarterly Median Earnings (among those employed)
First quarter after exit4 $10,155 $10,155 $10,087 $11,238 $10,426
Second quarter after exit1 $10,536 $10,536 $10,468 $11,352 $11,217
Third quarter after exit5 $10,610 $10,610 $10,527 $11,539 $9,636
Fourth quarter after exit2 $10,779 $10,779 $10,745 $11,310 $9,804
Nontraditional Employment1
Females 5.4 5.4 5.3 8.5 8.7
Males 2.1 2.1 2.0 1.3 1.9
Characteristics of Second Quarter Employment (among those employed)1
Average quarterly earnings $12,427 $12,427 $12,409 $13,483 $12,578
$1 to $2,499 7.9 7.9 8.0 5.2 7.9
$2,500 to $4,999 9.7 9.7 9.8 7.8 6.6
$5,000 to $7,499 13.0 13.0 13.1 13.0 7.9
$7,500 to $9,999 16.5 16.5 16.6 16.8 14.5
$10,000 or more 52.9 52.9 52.5 57.3 63.2

Dislocated Workers
PY 2019 Illinois State Data Book 206
Formula Funds
Total All Local Statewide DWG
Characteristics of Second Quarter Employment (cont’d)1
Occupation of employment
Management 9.1 9.1 9.1 1.7 13.3
Business and financial 3.5 3.5 3.5 1.1 0.0
Computer and mathematical 10.4 10.4 10.3 4.5 6.7
Architecture and engineering 1.3 1.3 1.3 1.1 0.0
Education, training, and library 1.7 1.7 1.7 3.4 0.0
Healthcare practitioners and technical 4.4 4.4 4.4 2.8 20.0
Healthcare support 3.6 3.6 3.6 1.1 6.7
Food preparation and serving 0.7 0.7 0.7 0.6 0.0
Personal care and service 0.6 0.6 0.6 0.6 0.0
Sales and related 3.9 3.9 3.9 1.1 6.7
Office and administrative 12.3 12.3 12.4 10.2 0.0
Construction and extraction 5.9 5.9 5.9 3.4 0.0
Installation, maintenance, and repair 6.8 6.8 6.8 20.5 6.7
Production 12.1 12.1 12.1 30.1 20.0
Transportation and material moving 19.4 19.4 19.4 12.5 13.3
Other occupations 4.5 4.5 4.5 5.1 6.7
Industry of employment
Construction 4.2 4.2 4.1 2.9 4.1
Manufacturing 19.1 19.1 18.0 39.8 41.9
Wholesale and retail trade 5.4 5.4 5.2 4.7 4.1
Transportation and warehousing 10.4 10.4 10.5 6.9 2.7
Information 1.4 1.4 1.4 1.7 0.0
Administrative, support, waste management and remediation services
13.6 13.6 13.7 9.4 12.2
Educational services 4.8 4.8 5.0 4.2 10.8
Health care and social assistance 11.2 11.2 11.6 7.0 12.2
Arts, entertainment, and recreation 1.0 1.0 1.0 0.8 0.0
Accommodation and food services 2.9 2.9 2.9 2.0 1.4
Other services, inc public administration 2.3 2.3 2.4 2.7 0.0
Other industry 23.8 23.8 24.3 18.1 10.8

Dislocated Workers
PY 2019 Illinois State Data Book 207
Formula Funds
Total All Local Statewide DWG
Types of Credentials Attained (among those with a credential attainment)2
Secondary school diploma/equivalency 0.3 0.3 0.2 1.0 0.0
AA, AS, BA, BS or other college 15.0 15.0 15.1 41.0 16.7
Postgraduate degree 24.2 24.2 24.2 12.8 29.8
Occupational credential 71.8 71.8 71.9 52.2 66.7
Other credential 0.0 0.0 0.0 0.0 0.0
Types of Skill Gains (among those with a measurable skill gain)3
Educational functional gains 1.6 1.6 1.7 1.3 1.1
Secondary school gains 0.0 0.0 0.0 0.0 0.0
Postsecondary school gains 14.8 14.8 14.0 30.2 0.0
Training milestone gains 21.8 21.8 22.1 6.0 43.7
Occupational skills progression 70.8 70.8 71.3 68.9 57.5
1 Based on those who exited from July 2018 to June 2019.
2 Based on those who exited from January 2018 to December 2018.
3 Based on those who participated between July 2019 and June 2020.
4 Based on those who exited from October 2018 to September 2019.
5 Based on those who exited from April 2018 to March 2019.
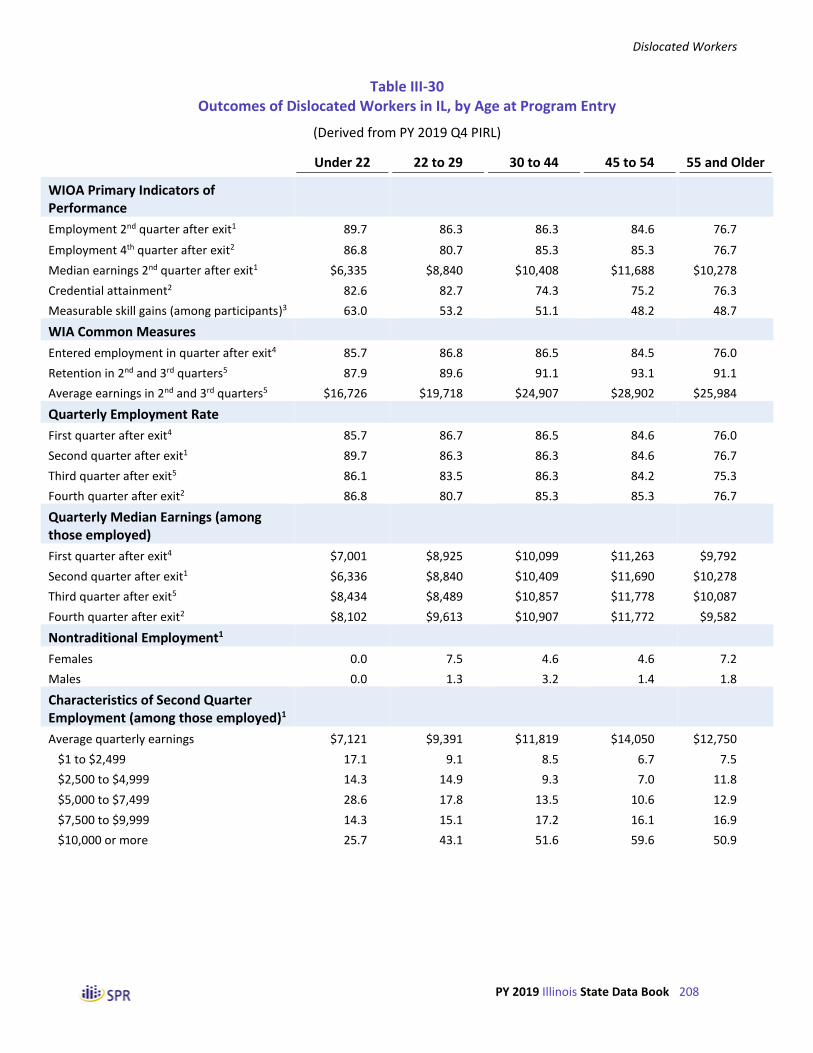
Dislocated Workers
PY 2019 Illinois State Data Book 208
Table III-30 Outcomes of Dislocated Workers in IL, by Age at Program Entry
(Derived from PY 2019 Q4 PIRL)
Under 22 22 to 29 30 to 44 45 to 54 55 and Older
WIOA Primary Indicators of Performance
Employment 2nd quarter after exit1 89.7 86.3 86.3 84.6 76.7
Employment 4th quarter after exit2 86.8 80.7 85.3 85.3 76.7
Median earnings 2nd quarter after exit1 $6,335 $8,840 $10,408 $11,688 $10,278
Credential attainment2 82.6 82.7 74.3 75.2 76.3
Measurable skill gains (among participants)3 63.0 53.2 51.1 48.2 48.7
WIA Common Measures
Entered employment in quarter after exit4 85.7 86.8 86.5 84.5 76.0
Retention in 2nd and 3rd quarters5 87.9 89.6 91.1 93.1 91.1
Average earnings in 2nd and 3rd quarters5 $16,726 $19,718 $24,907 $28,902 $25,984
Quarterly Employment Rate
First quarter after exit4 85.7 86.7 86.5 84.6 76.0
Second quarter after exit1 89.7 86.3 86.3 84.6 76.7
Third quarter after exit5 86.1 83.5 86.3 84.2 75.3
Fourth quarter after exit2 86.8 80.7 85.3 85.3 76.7
Quarterly Median Earnings (among those employed)
First quarter after exit4 $7,001 $8,925 $10,099 $11,263 $9,792
Second quarter after exit1 $6,336 $8,840 $10,409 $11,690 $10,278
Third quarter after exit5 $8,434 $8,489 $10,857 $11,778 $10,087
Fourth quarter after exit2 $8,102 $9,613 $10,907 $11,772 $9,582
Nontraditional Employment1
Females 0.0 7.5 4.6 4.6 7.2
Males 0.0 1.3 3.2 1.4 1.8
Characteristics of Second Quarter Employment (among those employed)1
Average quarterly earnings $7,121 $9,391 $11,819 $14,050 $12,750
$1 to $2,499 17.1 9.1 8.5 6.7 7.5
$2,500 to $4,999 14.3 14.9 9.3 7.0 11.8
$5,000 to $7,499 28.6 17.8 13.5 10.6 12.9
$7,500 to $9,999 14.3 15.1 17.2 16.1 16.9
$10,000 or more 25.7 43.1 51.6 59.6 50.9

Dislocated Workers
PY 2019 Illinois State Data Book 209
Under 22 22 to 29 30 to 44 45 to 54 55 and Older
Characteristics of Second Quarter Employment (cont’d)1
Occupation of employment
Management 11.1 1.9 6.3 12.2 13.2
Business and financial 0.0 1.9 2.6 3.0 6.9
Computer and mathematical 0.0 4.7 8.6 12.2 14.3
Architecture and engineering 0.0 0.0 1.7 1.3 1.1
Education, training, and library 0.0 2.8 0.9 3.0 0.5
Healthcare practitioners and technical 22.2 9.3 6.9 1.3 1.1
Healthcare support 0.0 3.7 4.3 4.0 1.6
Food preparation and serving 0.0 0.0 1.4 0.3 0.5
Personal care and service 11.1 0.0 0.3 1.0 0.5
Sales and related 0.0 4.7 2.9 4.0 5.3
Office and administrative 0.0 10.3 12.4 10.6 16.9
Construction and extraction 0.0 18.7 6.6 4.3 0.0
Installation, maintenance, and repair 0.0 7.5 6.0 9.2 4.2
Production 22.2 7.5 13.8 11.9 11.6
Transportation and material moving 22.2 25.2 20.7 17.8 15.9
Other occupations 11.1 1.9 4.6 4.0 6.3
Industry of employment
Construction 5.9 9.8 5.6 2.8 1.0
Manufacturing 8.8 12.5 17.6 23.0 19.3
Wholesale and retail trade 2.9 6.8 4.7 6.0 4.9
Transportation and warehousing 14.7 14.9 12.8 7.7 8.0
Information 0.0 0.5 1.2 1.6 1.7
Administrative, support, waste management and remediation services
5.9 11.7 13.8 13.2 15.5
Educational services 0.0 3.0 4.2 5.2 6.2
Health care and social assistance 20.6 13.6 12.6 8.8 11.0
Arts, entertainment, and recreation 2.9 0.8 1.3 0.4 1.4
Accommodation and food services 5.9 4.9 3.3 2.7 1.4
Other services, inc public administration 2.9 1.6 2.4 2.1 2.9
Other industry 29.4 19.8 20.6 26.5 26.7

Dislocated Workers
PY 2019 Illinois State Data Book 210
Under 22 22 to 29 30 to 44 45 to 54 55 and Older
Types of Credentials Attained (among those with a credential attainment)2
Secondary school diploma/equivalency 0.0 0.0 0.1 0.5 0.2
AA, AS, BA, BS or other college 21.1 14.9 18.5 15.2 8.4
Postgraduate degree 57.9 35.1 29.3 18.8 15.9
Occupational credential 57.9 68.3 64.2 75.5 82.1
Other credential 0.0 0.0 0.0 0.0 0.0
Types of Skill Gains (among those with a measurable skill gain)3
Educational functional gains 0.0 3.0 1.8 0.6 1.8
Secondary school gains 0.0 0.0 0.0 0.0 0.0
Postsecondary school gains 31.0 11.4 17.7 14.4 10.9
Training milestone gains 24.1 28.1 22.4 19.3 19.2
Occupational skills progression 62.1 70.7 69.4 72.0 72.7
1 Based on those who exited from July 2018 to June 2019.
2 Based on those who exited from January 2018 to December 2018.
3 Based on those who participated between July 2019 and June 2020.
4 Based on those who exited from October 2018 to September 2019.
5 Based on those who exited from April 2018 to March 2019.

Dislocated Workers
PY 2019 Illinois State Data Book 211
Table III-31 Outcomes of Dislocated Workers in IL, by Ethnicity and Race6
(Derived from PY 2019 Q4 PIRL)
Ethnicity Race
Hispanic Not Hispanic White Only Black Only Other
WIOA Primary Indicators of Performance
Employment 2nd quarter after exit1 81.3 84.2 84.9 83.2 81.0
Employment 4th quarter after exit2 80.2 83.4 84.3 82.0 78.4
Median earnings 2nd quarter after exit1 $10,233 $10,613 $11,244 $8,950 $14,446
Credential attainment2 75.7 76.0 77.5 73.0 78.5
Measurable skill gains (among participants)3 47.9 50.8 52.2 47.5 53.0
WIA Common Measures
Entered employment in quarter after exit4 83.6 83.5 85.3 82.7 83.3
Retention in 2nd and 3rd quarters5 89.6 92.0 93.3 88.8 93.8
Average earnings in 2nd and 3rd quarters5 $23,272 $26,384 $27,087 $22,263 $35,278
Quarterly Employment Rate
First quarter after exit4 83.6 83.5 85.3 82.7 83.3
Second quarter after exit1 81.3 84.2 84.9 83.2 81.0
Third quarter after exit5 80.9 83.2 84.0 82.2 81.3
Fourth quarter after exit2 80.2 83.4 84.3 82.0 78.4
Quarterly Median Earnings (among those employed)
First quarter after exit4 $10,400 $10,105 $10,688 $8,842 $16,022
Second quarter after exit1 $10,234 $10,614 $11,246 $8,951 $14,446
Third quarter after exit5 $10,284 $10,725 $11,286 $8,841 $15,000
Fourth quarter after exit2 $10,760 $10,793 $11,440 $9,591 $15,627
Nontraditional Employment1
Females 5.0 5.5 5.6 4.2 12.5
Males 2.0 2.1 2.1 1.8 2.8
Characteristics of Second Quarter Employment (among those employed)1
Average quarterly earnings $11,305 $12,680 $13,263 $10,609 $16,845
$1 to $2,499 7.2 8.0 6.4 10.3 5.6
$2,500 to $4,999 8.6 9.9 8.2 13.2 6.6
$5,000 to $7,499 13.9 12.8 11.1 15.7 11.2
$7,500 to $9,999 19.1 16.0 16.5 17.0 8.6
$10,000 or more 51.3 53.3 57.7 43.7 68.0
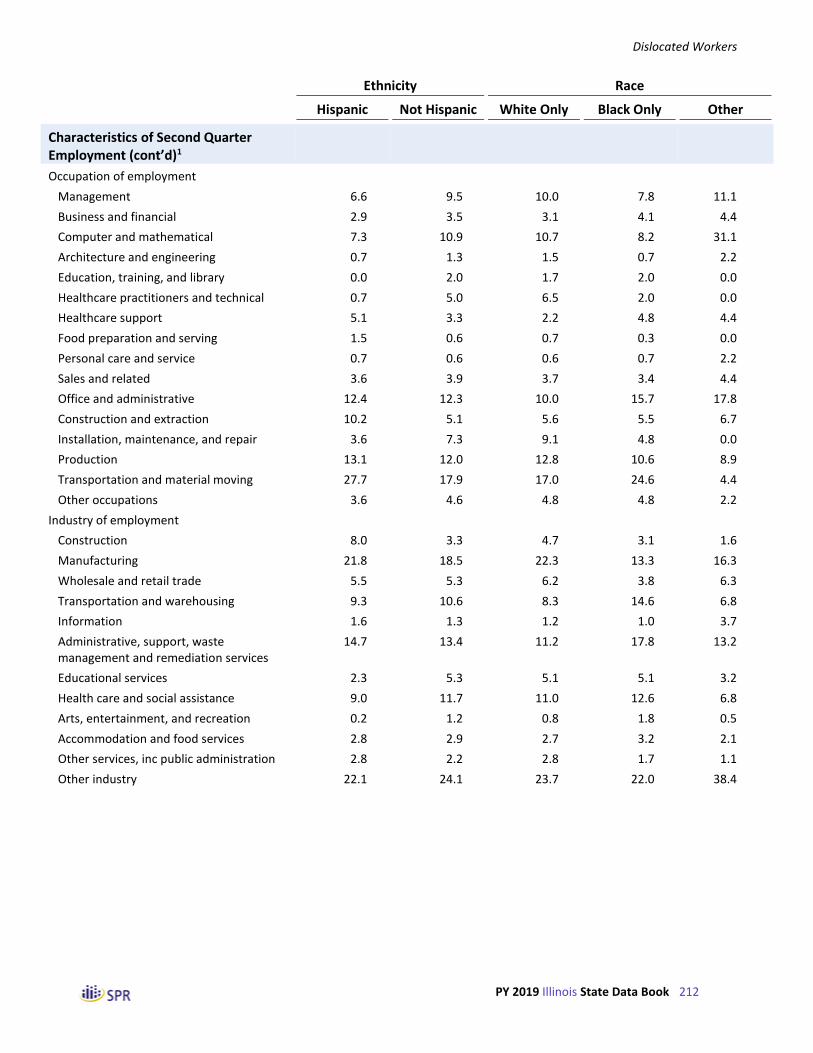
Dislocated Workers
PY 2019 Illinois State Data Book 212
Ethnicity Race
Hispanic Not Hispanic White Only Black Only Other
Characteristics of Second Quarter Employment (cont’d)1
Occupation of employment
Management 6.6 9.5 10.0 7.8 11.1
Business and financial 2.9 3.5 3.1 4.1 4.4
Computer and mathematical 7.3 10.9 10.7 8.2 31.1
Architecture and engineering 0.7 1.3 1.5 0.7 2.2
Education, training, and library 0.0 2.0 1.7 2.0 0.0
Healthcare practitioners and technical 0.7 5.0 6.5 2.0 0.0
Healthcare support 5.1 3.3 2.2 4.8 4.4
Food preparation and serving 1.5 0.6 0.7 0.3 0.0
Personal care and service 0.7 0.6 0.6 0.7 2.2
Sales and related 3.6 3.9 3.7 3.4 4.4
Office and administrative 12.4 12.3 10.0 15.7 17.8
Construction and extraction 10.2 5.1 5.6 5.5 6.7
Installation, maintenance, and repair 3.6 7.3 9.1 4.8 0.0
Production 13.1 12.0 12.8 10.6 8.9
Transportation and material moving 27.7 17.9 17.0 24.6 4.4
Other occupations 3.6 4.6 4.8 4.8 2.2
Industry of employment
Construction 8.0 3.3 4.7 3.1 1.6
Manufacturing 21.8 18.5 22.3 13.3 16.3
Wholesale and retail trade 5.5 5.3 6.2 3.8 6.3
Transportation and warehousing 9.3 10.6 8.3 14.6 6.8
Information 1.6 1.3 1.2 1.0 3.7
Administrative, support, waste management and remediation services
14.7 13.4 11.2 17.8 13.2
Educational services 2.3 5.3 5.1 5.1 3.2
Health care and social assistance 9.0 11.7 11.0 12.6 6.8
Arts, entertainment, and recreation 0.2 1.2 0.8 1.8 0.5
Accommodation and food services 2.8 2.9 2.7 3.2 2.1
Other services, inc public administration 2.8 2.2 2.8 1.7 1.1
Other industry 22.1 24.1 23.7 22.0 38.4

Dislocated Workers
PY 2019 Illinois State Data Book 213
Ethnicity Race
Hispanic Not Hispanic White Only Black Only Other
Types of Credentials Attained (among those with a credential attainment)2
Secondary school diploma/equivalency 1.3 0.1 0.1 0.0 0.0
AA, AS, BA, BS or other college 8.1 16.5 20.5 6.7 5.0
Postgraduate degree 32.0 22.5 23.2 29.2 7.2
Occupational credential 68.2 72.6 68.1 76.2 90.6
Other credential 0.0 0.0 0.0 0.0 0.0
Types of Skill Gains (among those with a measurable skill gain)3
Educational functional gains 2.8 1.3 1.0 2.7 1.5
Secondary school gains 0.0 0.0 0.0 0.0 0.0
Postsecondary school gains 9.4 16.2 19.8 8.3 7.5
Training milestone gains 25.3 20.8 19.1 27.6 19.4
Occupational skills progression 74.4 69.9 69.4 70.5 76.1
1 Based on those who exited from July 2018 to June 2019.
2 Based on those who exited from January 2018 to December 2018.
3 Based on those who participated between July 2019 and June 2020.
4 Based on those who exited from October 2018 to September 2019.
5 Based on those who exited from April 2018 to March 2019.
6 See table I-4 for large number not self-identified.

Dislocated Workers
PY 2019 Illinois State Data Book 214
Table III-32 Outcomes of Dislocated Workers in IL, by Gender, Employment Status, and Disability Status
(Derived from PY 2019 Q4 PIRL)
Gender Employment Status Has a
Female Male Employed Not Employed Disability
WIOA Primary Indicators of Performance
Employment 2nd quarter after exit1 84.7 82.9 87.5 83.6 71.2
Employment 4th quarter after exit2 83.1 82.7 80.0 82.9 71.1
Median earnings 2nd quarter after exit1 $8,674 $11,775 $9,456 $10,537 $9,052
Credential attainment2 72.0 78.4 100.0 76.0 64.6
Measurable skill gains (among participants)3
46.5 53.1 20.0 50.2 56.1
WIA Common Measures
Entered employment in quarter after exit4 83.9 83.4 83.5 68.8
Retention in 2nd and 3rd quarters5 91.8 91.4 100.0 91.5 90.4
Average earnings in 2nd and 3rd quarters5 $22,182 $28,249 $21,888 $25,853 $22,657
Quarterly Employment Rate
First quarter after exit4 83.9 83.4 77.8 83.5 69.7
Second quarter after exit1 84.7 82.9 87.5 83.6 71.2
Third quarter after exit5 83.4 82.4 81.8 82.8 73.3
Fourth quarter after exit2 83.1 82.7 80.0 82.9 71.1
Quarterly Median Earnings (among those employed)
First quarter after exit4 $8,707 $11,325 $8,582 $10,168 $8,819
Second quarter after exit1 $8,675 $11,776 $9,457 $10,537 $9,052
Third quarter after exit5 $8,542 $11,960 $10,613 $10,610 $9,345
Fourth quarter after exit2 $8,845 $12,206 $8,664 $10,785 $10,900
Nontraditional Employment1
Females 5.4 0.0 5.4 15.4
Males 2.1 0.0 2.1 4.2
Characteristics of Second Quarter Employment (among those employed)
Average quarterly earnings1 $10,706 $13,643 $12,268 $12,427 $10,469
$1 to $2,499 9.1 7.0 0.0 7.9 8.5
$2,500 to $4,999 13.4 7.1 28.6 9.7 10.6
$5,000 to $7,499 17.9 9.5 0.0 13.0 12.8
$7,500 to $9,999 18.7 15.0 28.6 16.5 27.7
$10,000 or more 40.9 61.3 42.9 52.9 40.4

Dislocated Workers
PY 2019 Illinois State Data Book 215
Gender Employment Status Has a
Female Male Employed Not Employed Disability
Characteristics of Second Quarter Employment (cont’d)
Occupation of employment1
Management 12.2 7.1 0.0 9.1 12.5
Business and financial 5.8 1.9 0.0 3.5 25.0
Computer and mathematical 9.5 10.9 0.0 10.4 12.5
Architecture and engineering 0.8 1.6 0.0 1.3 0.0
Education, training, and library 2.9 0.9 0.0 1.7 0.0
Healthcare practitioners and technical 9.3 1.2 0.0 4.4 0.0
Healthcare support 8.2 0.5 0.0 3.6 0.0
Food preparation and serving 1.3 0.3 0.0 0.7 0.0
Personal care and service 1.3 0.2 0.0 0.6 0.0
Sales and related 4.2 3.6 0.0 3.9 0.0
Office and administrative 23.3 5.2 0.0 12.3 0.0
Construction and extraction 1.9 8.5 0.0 5.9 0.0
Installation, maintenance, and repair 0.8 10.7 0.0 6.8 0.0
Production 6.3 15.9 0.0 12.1 12.5
Transportation and material moving 7.7 27.0 0.0 19.4 25.0
Other occupations 4.5 4.5 0.0 4.5 12.5
Industry of employment1
Construction 1.7 5.8 14.3 4.1 4.3
Manufacturing 10.7 24.9 28.6 19.1 13.0
Wholesale and retail trade 3.8 6.4 0.0 5.4 10.9
Transportation and warehousing 5.3 13.9 42.9 10.3 13.0
Information 1.1 1.5 0.0 1.4 0.0
Administrative, support, waste management and remediation services
14.5 13.1 0.0 13.7 10.9
Educational services 6.7 3.4 0.0 4.8 4.3
Health care and social assistance 21.4 4.2 0.0 11.2 6.5
Arts, entertainment, and recreation 1.2 0.9 14.3 1.0 0.0
Accommodation and food services 3.6 2.3 0.0 2.9 2.2
Other services, inc public administration 2.9 2.0 0.0 2.3 0.0
Other industry 27.0 21.6 0.0 23.8 34.8

Dislocated Workers
PY 2019 Illinois State Data Book 216
Gender Employment Status Has a
Female Male Employed Not Employed Disability
Types of Credentials Attained (among those with a credential attainment)2
Secondary school diploma/equivalency 0.3 0.3 0.0 0.3 0.0
AA, AS, BA, BS or other college 19.9 12.5 0.0 15.1 19.4
Postgraduate degree 13.6 29.7 0.0 24.2 12.9
Occupational credential 75.2 70.1 100.0 71.8 67.7
Other credential 0.0 0.0 0.0 0.0 0.0
Types of Skill Gains (among those with a measurable skill gain)3
Educational functional gains 0.8 2.2 0.0 1.6 0.0
Secondary school gains 0.0 0.0 0.0 0.0 0.0
Postsecondary school gains 24.7 8.3 0.0 14.8 34.8
Training milestone gains 20.3 22.5 0.0 21.8 13.0
Occupational skills progression 63.0 76.1 100.0 70.8 56.5
1 Based on those who exited from July 2018 to June 2019.
2 Based on those who exited from January 2018 to December 2018.
3 Based on those who participated between July 2019 and June 2020.
4 Based on those who exited from October 2018 to September 2019.
5 Based on those who exited from April 2018 to March 2019.

Dislocated Workers
PY 2019 Illinois State Data Book 217
Table III-33 Outcomes of Dislocated Workers in IL, by Other Employment Characteristics
(Derived from PY 2019 Q4 PIRL)
Unemployment Compensation Status Long-term Displaced
Claimant Exhaustee Other Unemployed Homemaker
WIOA Primary Indicators of Performance
Employment 2nd quarter after exit1 83.9 80.2 86.7 74.8 88.5
Employment 4th quarter after exit2 83.4 78.4 85.5 72.9 81.5
Median earnings 2nd quarter after exit1 $10,527 $10,092 $10,982 $10,154 $8,113
Credential attainment2 75.3 76.1 81.6 74.0 75.0
Measurable skill gains (among participants)3 50.6 46.7 52.8 44.0 40.6
WIA Common Measures
Entered employment in quarter after exit4 83.9 80.7 85.6 75.4 76.9
Retention in 2nd and 3rd quarters5 91.8 90.6 91.3 87.9 100.0
Average earnings in 2nd and 3rd quarters5 $26,164 $25,110 $24,723 $24,969 $22,713
Quarterly Employment Rate
First quarter after exit4 83.8 80.7 85.6 75.6 76.9
Second quarter after exit1 83.9 80.2 86.7 74.8 88.5
Third quarter after exit5 83.7 77.5 84.9 74.8 82.6
Fourth quarter after exit2 83.4 78.4 85.5 72.9 81.5
Quarterly Median Earnings (among those employed)
First quarter after exit4 $10,113 $9,690 $11,261 $10,078 $7,344
Second quarter after exit1 $10,528 $10,093 $10,982 $10,155 $8,114
Third quarter after exit5 $10,610 $10,173 $11,037 $9,775 $11,047
Fourth quarter after exit2 $10,843 $10,456 $10,907 $9,971 $10,323
Nontraditional Employment1
Females 5.7 5.4 3.1 2.2 0.0
Males 1.7 3.2 3.1 0.0 0.0
Characteristics of Second Quarter Employment (among those employed)1
Average quarterly earnings $12,614 $11,771 $12,131 $11,258 $8,881
$1 to $2,499 7.6 10.3 5.9 6.3 8.7
$2,500 to $4,999 9.6 10.2 9.8 13.5 13.0
$5,000 to $7,499 13.5 12.3 11.2 12.5 21.7
$7,500 to $9,999 16.4 16.8 16.8 17.7 26.1
$10,000 or more 52.8 50.4 56.3 50.0 30.4

Dislocated Workers
PY 2019 Illinois State Data Book 218
Unemployment Compensation Status Long-term Displaced
Claimant Exhaustee Other Unemployed Homemaker
Characteristics of Second Quarter Employment (cont’d)1
Occupation of employment
Management 10.3 6.3 4.9 4.9 12.5
Business and financial 4.0 2.9 0.0 2.4 0.0
Computer and mathematical 10.9 12.6 1.2 14.6 0.0
Architecture and engineering 1.1 0.0 4.9 0.0 0.0
Education, training, and library 1.3 2.9 2.4 2.4 0.0
Healthcare practitioners and technical 3.4 5.2 11.0 2.4 50.0
Healthcare support 2.7 5.7 6.1 2.4 12.5
Food preparation and serving 0.7 1.1 0.0 0.0 0.0
Personal care and service 0.7 0.0 1.2 2.4 0.0
Sales and related 3.4 5.2 4.9 7.3 0.0
Office and administrative 12.1 14.4 9.8 9.8 0.0
Construction and extraction 7.0 3.4 1.2 9.8 0.0
Installation, maintenance, and repair 6.0 4.6 18.3 4.9 0.0
Production 11.6 11.5 18.3 9.8 0.0
Transportation and material moving 19.9 20.1 13.4 19.5 12.5
Other occupations 4.9 4.0 2.4 7.3 12.5
Industry of employment
Construction 4.8 3.3 1.5 3.3 0.0
Manufacturing 17.5 18.1 30.3 12.1 18.2
Wholesale and retail trade 5.5 4.6 5.3 5.5 0.0
Transportation and warehousing 10.7 11.6 6.8 9.9 0.0
Information 1.3 1.8 1.0 0.0 0.0
Administrative, support, waste management and remediation services
14.0 14.9 9.5 15.4 9.1
Educational services 4.6 4.2 6.8 2.2 4.5
Health care and social assistance 10.9 12.9 11.0 13.2 45.5
Arts, entertainment, and recreation 1.1 0.9 0.8 2.2 0.0
Accommodation and food services 3.0 2.8 2.5 2.2 9.1
Other services, inc public administration 2.5 1.8 1.8 0.0 0.0
Other industry 24.1 22.9 22.8 34.1 13.6

Dislocated Workers
PY 2019 Illinois State Data Book 219
Unemployment Compensation Status Long-term Displaced
Claimant Exhaustee Other Unemployed Homemaker
Types of Credentials Attained (among those with a credential attainment)2
Secondary school diploma/equivalency 0.2 0.6 0.0 0.0 0.0
AA, AS, BA, BS or other college 15.6 9.5 19.8 1.8 27.8
Postgraduate degree 24.2 24.9 22.6 14.0 38.9
Occupational credential 71.0 76.5 70.5 89.5 55.6
Other credential 0.0 0.0 0.0 0.0 0.0
Types of Skill Gains (among those with a measurable skill gain)3
Educational functional gains 1.6 1.9 1.1 3.9 7.7
Secondary school gains 0.0 0.0 0.0 0.0 0.0
Postsecondary school gains 12.6 18.5 27.2 3.9 23.1
Training milestone gains 19.4 25.5 36.1 58.8 23.1
Occupational skills progression 72.8 63.3 65.6 41.2 53.8
1 Based on those who exited from July 2018 to June 2019.
2 Based on those who exited from January 2018 to December 2018.
3 Based on those who participated between July 2019 and June 2020.
4 Based on those who exited from October 2018 to September 2019.
5 Based on those who exited from April 2018 to March 2019.

Dislocated Workers
PY 2019 Illinois State Data Book 220
Table III-34 Outcomes of Dislocated Workers in IL, by Selected Barriers to Employment
(Derived from PY 2019 Q4 PIRL)
Veterans Receives
TANF Low Income
Basic Skills/English
Deficient
WIOA Primary Indicators of Performance
Employment 2nd quarter after exit1 83.4 75.0 84.6 83.6
Employment 4th quarter after exit2 80.8 80.0 82.2 81.6
Median earnings 2nd quarter after exit1 $12,213 $7,485 $8,926 $9,236
Credential attainment2 79.8 100.0 77.1 73.8
Measurable skill gains (among participants)3 55.8 60.0 47.8 50.5
WIA Common Measures
Entered employment in quarter after exit4 81.8 66.7 85.5 83.9
Retention in 2nd and 3rd quarters5 89.4 100.0 90.2 91.7
Average earnings in 2nd and 3rd quarters5 $27,096 $14,653 $21,760 $21,259
Quarterly Employment Rate
First quarter after exit4 81.6 66.7 85.4 83.9
Second quarter after exit1 83.4 75.0 84.6 83.6
Third quarter after exit5 80.7 80.0 83.7 83.0
Fourth quarter after exit2 80.8 80.0 82.2 81.6
Quarterly Median Earnings (among those employed)
First quarter after exit4 $11,648 $7,755 $8,884 $9,140
Second quarter after exit1 $12,214 $7,485 $8,927 $9,237
Third quarter after exit5 $11,649 $6,055 $9,055 $9,000
Fourth quarter after exit2 $13,229 $5,086 $9,514 $9,364
Nontraditional Employment1
Females 6.1 0.0 5.0 5.6
Males 2.3 0.0 2.7 0.9
Characteristics of Second Quarter Employment (among those employed)1
Average quarterly earnings $12,914 $7,030 $10,348 $10,477
$1 to $2,499 8.0 16.7 10.3 7.9
$2,500 to $4,999 7.2 0.0 13.2 11.6
$5,000 to $7,499 6.5 33.3 15.4 16.4
$7,500 to $9,999 12.3 33.3 19.1 19.7
$10,000 or more 65.9 16.7 42.0 44.4

Dislocated Workers
PY 2019 Illinois State Data Book 221
Veterans Receives
TANF Low Income
Basic Skills/English
Deficient
Characteristics of Second Quarter Employment (cont’d)1
Occupation of employment
Management 7.7 0.0 7.4 6.8
Business and financial 1.5 0.0 1.9 2.0
Computer and mathematical 1.5 0.0 6.6 5.7
Architecture and engineering 3.1 0.0 0.4 0.7
Education, training, and library 3.1 0.0 1.2 0.3
Healthcare practitioners and technical 3.1 100.0 3.9 1.7
Healthcare support 1.5 0.0 4.3 5.1
Food preparation and serving 1.5 0.0 1.6 0.3
Personal care and service 0.0 0.0 0.0 1.0
Sales and related 1.5 0.0 5.4 3.0
Office and administrative 7.7 0.0 16.3 15.9
Construction and extraction 7.7 0.0 8.5 4.7
Installation, maintenance, and repair 13.8 0.0 4.3 4.4
Production 15.4 0.0 10.9 14.5
Transportation and material moving 27.7 0.0 22.5 30.1
Other occupations 3.1 0.0 5.0 3.7
Industry of employment
Construction 1.5 0.0 6.1 4.2
Manufacturing 18.3 16.7 11.9 20.3
Wholesale and retail trade 3.7 0.0 4.0 5.5
Transportation and warehousing 13.1 0.0 13.2 12.3
Information 0.7 0.0 0.8 0.9
Administrative, support, waste management and remediation services
13.1 0.0 15.2 14.6
Educational services 5.6 33.3 3.7 4.2
Health care and social assistance 3.7 33.3 15.5 11.9
Arts, entertainment, and recreation 0.4 0.0 1.7 0.7
Accommodation and food services 1.9 0.0 4.5 3.8
Other services, inc public administration 1.5 16.7 1.8 1.9
Other industry 36.6 0.0 21.7 19.6

Dislocated Workers
PY 2019 Illinois State Data Book 222
Veterans Receives
TANF Low Income
Basic Skills/English
Deficient
Types of Credentials Attained (among those with a credential attainment)2
Secondary school diploma/equivalency 0.0 0.0 0.2 0.8
AA, AS, BA, BS or other college 12.9 0.0 8.9 11.7
Postgraduate degree 20.3 50.0 32.4 32.9
Occupational credential 77.7 100.0 71.7 66.7
Other credential 0.0 0.0 0.0 0.0
Types of Skill Gains (among those with a measurable skill gain)3
Educational functional gains 0.0 0.0 2.1 3.0
Secondary school gains 0.0 0.0 0.0 0.0
Postsecondary school gains 13.1 66.7 10.0 11.2
Training milestone gains 46.9 33.3 38.9 25.6
Occupational skills progression 79.2 33.3 63.4 69.3
1 Based on those who exited from July 2018 to June 2019.
2 Based on those who exited from January 2018 to December 2018.
3 Based on those who participated between July 2019 and June 2020.
4 Based on those who exited from October 2018 to September 2019.
5 Based on those who exited from April 2018 to March 2019.

Dislocated Workers
PY 2019 Illinois State Data Book 223
Table III-35 Outcomes of Dislocated Workers in IL, by Highest Educational Level
(Derived from PY 2019 Q4 PIRL)
No Level Completed
HS Graduate or
Equivalent Some Post-secondary
Technical or Vocational Certificate
Post-Secondary
Degree
WIOA Primary Indicators of Performance
Employment 2nd quarter after exit1 72.5 86.2 80.3 84.9 83.1
Employment 4th quarter after exit2 76.0 84.1 82.2 81.5 82.7
Median earnings 2nd quarter after exit1 $8,581 $9,542 $9,190 $10,667 $14,016
Credential attainment2 64.8 75.9 74.2 79.0 78.2
Measurable skill gains (among participants)3 29.0 52.4 51.9 41.7 50.6
WIA Common Measures
Entered employment in quarter after exit4 73.3 85.6 80.1 83.7 83.4
Retention in 2nd and 3rd quarters5 90.2 92.1 87.2 94.9 92.4
Average earnings in 2nd and 3rd quarters5 $21,783 $21,791 $22,582 $25,122 $32,840
Quarterly Employment Rate
First quarter after exit4 73.3 85.6 79.8 83.7 83.4
Second quarter after exit1 72.5 86.2 80.3 84.9 83.1
Third quarter after exit5 74.8 84.8 80.6 87.5 81.9
Fourth quarter after exit2 76.0 84.1 82.2 81.5 82.7
Quarterly Median Earnings (among those employed)
First quarter after exit4 $9,338 $9,250 $8,856 $9,839 $13,074
Second quarter after exit1 $8,582 $9,543 $9,191 $10,668 $14,018
Third quarter after exit5 $8,843 $9,370 $9,832 $9,573 $13,824
Fourth quarter after exit2 $9,568 $9,750 $10,080 $10,734 $13,963
Nontraditional Employment1
Females 10.0 3.5 6.3 2.2 6.9
Males 2.1 1.9 3.4 1.6 2.1
Characteristics of Second Quarter Employment (among those employed)1
Average quarterly earnings $10,019 $10,455 $10,502 $12,589 $16,003
$1 to $2,499 7.6 8.7 10.1 11.0 5.7
$2,500 to $4,999 13.3 10.6 12.2 11.0 7.0
$5,000 to $7,499 18.4 15.5 15.4 11.0 8.4
$7,500 to $9,999 22.8 18.8 18.0 14.4 12.4
$10,000 or more 38.0 46.4 44.2 52.5 66.4

Dislocated Workers
PY 2019 Illinois State Data Book 224
No Level Completed
HS Graduate or
Equivalent Some Post-secondary
Technical or Vocational Certificate
Post-Secondary
Degree
Characteristics of Second Quarter Employment (cont’d)1
Occupation of employment
Management 2.9 3.0 8.3 0.0 18.7
Business and financial 2.9 0.5 1.9 0.0 8.2
Computer and mathematical 8.6 2.3 3.7 2.5 23.7
Architecture and engineering 0.0 0.7 0.9 0.0 2.3
Education, training, and library 0.0 0.7 0.0 0.0 3.8
Healthcare practitioners and technical 0.0 2.3 13.9 15.0 3.2
Healthcare support 5.7 5.8 1.9 0.0 1.5
Food preparation and serving 2.9 1.2 0.9 0.0 0.0
Personal care and service 0.0 0.7 1.9 0.0 0.3
Sales and related 0.0 3.5 2.8 5.0 5.0
Office and administrative 8.6 11.4 13.9 15.0 13.2
Construction and extraction 5.7 8.6 5.6 0.0 3.2
Installation, maintenance, and repair 2.9 9.7 6.5 17.5 2.3
Production 17.1 18.1 13.9 15.0 3.2
Transportation and material moving 37.1 28.3 19.4 27.5 5.3
Other occupations 5.7 3.2 4.6 2.5 6.1
Industry of employment
Construction 4.6 6.2 3.1 1.8 2.0
Manufacturing 23.8 24.0 16.7 22.8 12.5
Wholesale and retail trade 7.9 5.3 4.8 2.6 5.6
Transportation and warehousing 8.6 13.5 12.6 15.8 5.2
Information 0.7 0.5 1.4 0.9 2.6
Administrative, support, waste management and remediation services
20.5 11.8 9.8 11.4 16.8
Educational services 6.0 3.2 4.3 2.6 7.1
Health care and social assistance 10.6 10.9 16.7 17.5 9.2
Arts, entertainment, and recreation 1.3 0.8 1.4 1.8 1.0
Accommodation and food services 2.6 3.5 4.3 1.8 1.7
Other services, inc public administration 2.0 2.0 2.9 4.4 2.5
Other industry 11.3 18.4 22.1 16.7 33.8

Dislocated Workers
PY 2019 Illinois State Data Book 225
No Level Completed
HS Graduate or
Equivalent Some Post-secondary
Technical or Vocational Certificate
Post-Secondary
Degree
Types of Credentials Attained (among those with a credential attainment)2
Secondary school diploma/equivalency 5.6 0.0 0.0 0.0 0.0
AA, AS, BA, BS or other college 0.9 18.1 32.8 20.3 7.1
Postgraduate degree 36.4 32.5 27.3 31.3 10.7
Occupational credential 66.4 64.8 53.9 67.2 87.3
Other credential 0.0 0.0 0.0 0.0 0.0
Types of Skill Gains (among those with a measurable skill gain)3
Educational functional gains 5.9 2.9 0.5 0.0 0.4
Secondary school gains 0.0 0.0 0.0 0.0 0.0
Postsecondary school gains 3.9 15.2 27.5 24.0 11.3
Training milestone gains 37.3 23.7 16.5 22.0 20.0
Occupational skills progression 74.5 68.6 61.0 70.0 75.4
1 Based on those who exited from July 2018 to June 2019.
2 Based on those who exited from January 2018 to December 2018.
3 Based on those who participated between July 2019 and June 2020.
4 Based on those who exited from October 2018 to September 2019.
5 Based on those who exited from April 2018 to March 2019.

Dislocated Workers
PY 2019 Illinois State Data Book 226
Table III-36 Outcomes of Dislocated Workers in IL, by Selected Other Characteristics
(Derived from PY 2019 Q4 PIRL)
School Status Single
Attending Not Attending Ex-Offender Homeless Parents
WIOA Primary Indicators of Performance
Employment 2nd quarter after exit1 82.8 83.6 83.4 66.7 88.8
Employment 4th quarter after exit2 91.2 82.8 81.0 65.2 88.0
Median earnings 2nd quarter after exit1 $10,550 $10,536 $9,284 $6,385 $8,934
Credential attainment2 78.8 75.9 78.5 75.0 70.1
Measurable skill gains (among participants)3 50.0 50.2 56.6 50.0 49.2
WIA Common Measures
Entered employment in quarter after exit4 84.0 83.5 88.5 76.9 88.7
Retention in 2nd and 3rd quarters5 96.2 91.5 88.7 66.7 92.8
Average earnings in 2nd and 3rd quarters5 $22,334 $25,869 $21,258 $24,631 $22,700
Quarterly Employment Rate
First quarter after exit4 84.0 83.5 88.5 71.4 88.7
Second quarter after exit1 82.8 83.6 83.4 66.7 88.8
Third quarter after exit5 92.6 82.7 85.3 61.9 87.3
Fourth quarter after exit2 91.2 82.8 81.0 65.2 88.0
Quarterly Median Earnings (among those employed)
First quarter after exit4 $8,210 $10,168 $8,979 $8,527 $8,946
Second quarter after exit1 $10,551 $10,536 $9,285 $6,385 $8,935
Third quarter after exit5 $8,632 $10,628 $9,503 $5,053 $9,437
Fourth quarter after exit2 $9,501 $10,793 $9,524 $4,188 $9,770
Nontraditional Employment1
Females 0.0 5.5 5.9 0.0 6.7
Males 27.3 2.0 1.2 0.0 3.9
Characteristics of Second Quarter Employment (among those employed)1
Average quarterly earnings $10,870 $12,437 $10,007 $8,144 $10,865
$1 to $2,499 0.0 7.9 10.4 10.0 7.0
$2,500 to $4,999 12.5 9.7 11.4 20.0 14.3
$5,000 to $7,499 12.5 13.0 14.4 30.0 18.8
$7,500 to $9,999 20.8 16.5 19.3 10.0 18.0
$10,000 or more 54.2 52.9 44.6 30.0 41.9

Dislocated Workers
PY 2019 Illinois State Data Book 227
School Status Single
Attending Not Attending Ex-Offender Homeless Parents
Characteristics of Second Quarter Employment (cont’d)1
Occupation of employment
Management 7.1 9.1 0.0 0.0 4.1
Business and financial 0.0 3.5 1.5 0.0 0.0
Computer and mathematical 14.3 10.3 3.0 0.0 5.4
Architecture and engineering 7.1 1.2 3.0 0.0 4.1
Education, training, and library 0.0 1.7 0.0 50.0 1.4
Healthcare practitioners and technical 42.9 3.8 4.5 0.0 17.6
Healthcare support 7.1 3.5 1.5 0.0 6.8
Food preparation and serving 0.0 0.7 1.5 0.0 4.1
Personal care and service 0.0 0.6 0.0 0.0 1.4
Sales and related 0.0 3.9 1.5 0.0 1.4
Office and administrative 7.1 12.4 4.5 0.0 10.8
Construction and extraction 0.0 5.9 3.0 0.0 1.4
Installation, maintenance, and repair 0.0 6.9 11.9 0.0 6.8
Production 7.1 12.2 16.4 0.0 10.8
Transportation and material moving 0.0 19.6 41.8 50.0 23.0
Other occupations 7.1 4.5 6.0 0.0 1.4
Industry of employment
Construction 0.0 4.2 5.2 0.0 2.9
Manufacturing 0.0 19.2 15.5 10.0 15.9
Wholesale and retail trade 0.0 5.4 8.8 0.0 6.1
Transportation and warehousing 4.2 10.4 24.4 10.0 7.0
Information 0.0 1.4 1.0 0.0 1.7
Administrative, support, waste management and remediation services
16.7 13.6 18.1 30.0 11.9
Educational services 8.3 4.7 1.6 0.0 4.3
Health care and social assistance 37.5 11.0 7.3 20.0 19.7
Arts, entertainment, and recreation 4.2 1.0 0.5 20.0 1.4
Accommodation and food services 4.2 2.9 5.7 0.0 5.5
Other services, inc public administration 0.0 2.4 1.6 0.0 1.7
Other industry 25.0 23.8 10.4 10.0 21.7

Dislocated Workers
PY 2019 Illinois State Data Book 228
School Status Single
Attending Not Attending Ex-Offender Homeless Parents
Types of Credentials Attained (among those with a credential attainment)2
Secondary school diploma/equivalency 0.0 0.3 0.0 0.0 0.0
AA, AS, BA, BS or other college 50.0 14.6 13.7 11.1 24.2
Postgraduate degree 50.0 23.9 44.0 33.3 28.9
Occupational credential 42.3 72.2 67.9 55.6 63.0
Other credential 0.0 0.0 0.0 0.0 0.0
Types of Skill Gains (among those with a measurable skill gain)3
Educational functional gains 0.0 1.6 4.3 0.0 0.0
Secondary school gains 0.0 0.0 0.0 0.0 0.0
Postsecondary school gains 50.0 14.4 8.5 0.0 28.2
Training milestone gains 0.0 22.0 14.9 40.0 17.1
Occupational skills progression 63.6 70.9 85.1 60.0 65.7
1 Based on those who exited from July 2018 to June 2019.
2 Based on those who exited from January 2018 to December 2018.
3 Based on those who participated between July 2019 and June 2020.
4 Based on those who exited from October 2018 to September 2019.
5 Based on those who exited from April 2018 to March 2019.

Dislocated Workers
PY 2019 Illinois State Data Book 229
Table III-37 Outcomes of Dislocated Workers in IL, by Major Service Category
(Derived from PY 2019 Q4 PIRL)
Received Career Services
All Basic Individualized Only Career
Services Received Training
WIOA Primary Indicators of Performance
Employment 2nd quarter after exit1 83.6 83.6 84.6 82.3 84.2
Employment 4th quarter after exit2 82.9 82.9 83.3 80.4 84.0
Median earnings 2nd quarter after exit1 $10,536 $10,536 $10,637 $8,674 $11,318
Credential attainment2 76.0 76.0 76.0 0.0 76.0
Measurable skill gains (among participants)3
50.2 69.5 69.5 0.0 69.5
WIA Common Measures
Entered employment in quarter after exit4 83.5 83.5 84.8 80.1 85.0
Retention in 2nd and 3rd quarters5 91.6 91.6 92.1 89.1 92.6
Average earnings in 2nd and 3rd quarters5 $25,843 $25,857 $26,084 $22,494 $27,201
Quarterly Employment Rate
First quarter after exit4 83.5 83.5 84.8 80.0 85.1
Second quarter after exit1 83.6 83.6 84.6 82.3 84.2
Third quarter after exit5 82.8 82.8 83.5 80.4 83.9
Fourth quarter after exit2 82.9 82.9 83.3 80.4 84.0
Quarterly Median Earnings (among those employed)
First quarter after exit4 $10,155 $10,155 $10,297 $8,642 $10,980
Second quarter after exit1 $10,536 $10,536 $10,638 $8,675 $11,319
Third quarter after exit5 $10,610 $10,619 $10,863 $8,725 $11,510
Fourth quarter after exit2 $10,779 $10,779 $10,956 $9,001 $11,838
Nontraditional Employment1
Females 5.4 5.4 5.4 5.0 5.6
Males 2.1 2.1 2.1 2.6 2.0
Characteristics of Second Quarter Employment (among those employed)1
Average quarterly earnings $12,427 $12,427 $12,599 $10,431 $13,217
$1 to $2,499 7.9 7.9 7.2 10.4 6.9
$2,500 to $4,999 9.7 9.7 9.4 13.1 8.4
$5,000 to $7,499 13.0 13.0 12.8 17.0 11.4
$7,500 to $9,999 16.5 16.5 16.7 19.8 15.3
$10,000 or more 52.9 52.9 53.9 39.7 58.1

Dislocated Workers
PY 2019 Illinois State Data Book 230
Received Career Services
All Basic Individualized Only Career
Services Received Training
Characteristics of Second Quarter Employment (cont’d)1
Occupation of employment
Management 9.1 9.1 9.1 12.8 7.8
Business and financial 3.5 3.5 3.5 5.4 2.8
Computer and mathematical 10.4 10.4 10.4 4.5 12.3
Architecture and engineering 1.3 1.3 1.3 0.0 1.7
Education, training, and library 1.7 1.7 1.7 1.2 1.8
Healthcare practitioners and technical 4.4 4.4 4.4 1.2 5.5
Healthcare support 3.6 3.6 3.6 2.5 3.9
Food preparation and serving 0.7 0.7 0.7 1.2 0.6
Personal care and service 0.6 0.6 0.6 0.8 0.6
Sales and related 3.9 3.9 3.9 7.0 2.8
Office and administrative 12.3 12.3 12.3 20.7 9.5
Construction and extraction 5.9 5.9 5.9 13.6 3.2
Installation, maintenance, and repair 6.8 6.8 6.8 4.1 7.7
Production 12.1 12.1 12.1 11.6 12.3
Transportation and material moving 19.4 19.4 19.4 7.0 23.5
Other occupations 4.5 4.5 4.5 6.2 3.9
Industry of employment
Construction 4.2 4.2 4.2 5.4 3.7
Manufacturing 19.1 19.1 19.2 18.0 19.5
Wholesale and retail trade 5.4 5.4 5.4 4.2 5.8
Transportation and warehousing 10.4 10.4 10.6 5.3 12.4
Information 1.4 1.4 1.4 1.2 1.4
Administrative, support, waste management and remediation services
13.6 13.6 13.3 16.3 12.6
Educational services 4.8 4.8 4.8 5.3 4.5
Health care and social assistance 11.2 11.2 11.2 11.4 11.2
Arts, entertainment, and recreation 1.0 1.0 1.0 1.3 0.9
Accommodation and food services 2.9 2.9 2.8 3.8 2.5
Other services, inc public administration 2.3 2.3 2.4 2.9 2.1
Other industry 23.8 23.8 23.9 24.9 23.3
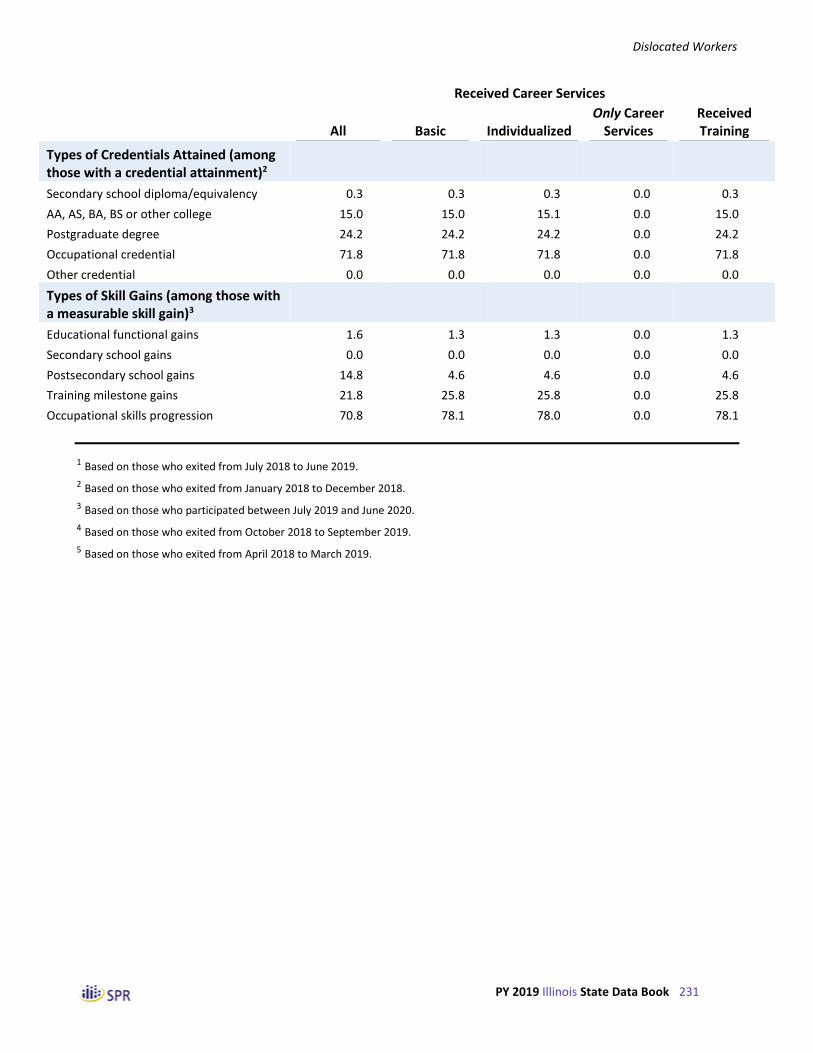
Dislocated Workers
PY 2019 Illinois State Data Book 231
Received Career Services
All Basic Individualized Only Career
Services Received Training
Types of Credentials Attained (among those with a credential attainment)2
Secondary school diploma/equivalency 0.3 0.3 0.3 0.0 0.3
AA, AS, BA, BS or other college 15.0 15.0 15.1 0.0 15.0
Postgraduate degree 24.2 24.2 24.2 0.0 24.2
Occupational credential 71.8 71.8 71.8 0.0 71.8
Other credential 0.0 0.0 0.0 0.0 0.0
Types of Skill Gains (among those with a measurable skill gain)3
Educational functional gains 1.6 1.3 1.3 0.0 1.3
Secondary school gains 0.0 0.0 0.0 0.0 0.0
Postsecondary school gains 14.8 4.6 4.6 0.0 4.6
Training milestone gains 21.8 25.8 25.8 0.0 25.8
Occupational skills progression 70.8 78.1 78.0 0.0 78.1
1 Based on those who exited from July 2018 to June 2019.
2 Based on those who exited from January 2018 to December 2018.
3 Based on those who participated between July 2019 and June 2020.
4 Based on those who exited from October 2018 to September 2019.
5 Based on those who exited from April 2018 to March 2019.

Dislocated Workers
PY 2019 Illinois State Data Book 232
Table III-38 WIOA Primary Indicators of Performance for Dislocated Workers, by State
(Derived from PY 2019 Q4 PIRL)
2nd Quarter Employment1
4th Quarter Employment2
Median Earnings1
Credential Attainment2
Measurable Skills Gains3
Nation 70.5 71.3 $7,828 68.9 49.4
Alabama 77.9 78.6 $9,826 79.9 46.8
Alaska 81.1 67.6 $10,727 58.5 44.4
Arizona 81.0 74.7 $8,878 76.3 42.1
Arkansas 84.3 86.5 $6,758 82.1 70.0
California 74.7 72.8 $8,641 62.7 46.4
Colorado 78.1 77.6 $10,394 71.5 49.9
Connecticut 75.7 77.5 $8,839 74.8 58.4
Delaware 80.9 78.4 $8,928 63.7 19.7
District of Columbia 76.5 70.8 $7,566 32.4 80.6
Florida 83.4 85.2 $8,820 81.6 41.7
Georgia 82.9 81.2 $8,442 76.2 25.7
Guam 50.0 0.0 $8,580 0.0 0.0
Hawaii 90.2 74.4 $9,108 79.3 26.5
Idaho 80.4 83.8 $7,679 78.2 21.6
Illinois 83.6 82.9 $10,536 76.0 50.2
Indiana 80.4 80.4 $7,800 72.7 67.4
Iowa 85.0 88.4 $8,762 74.8 54.5
Kansas 87.5 83.9 $9,806 87.9 46.0
Kentucky 67.8 65.7 $6,624 43.2 100.0
Louisiana 72.7 72.0 $7,898 77.3 63.0
Maine 84.7 83.6 $6,765 75.0 44.1
Maryland 84.5 83.8 $9,507 60.6 61.6
Massachusetts 81.7 80.4 $10,982 75.7 42.2
Michigan 88.7 85.0 $8,613 80.7 49.2
Minnesota 87.6 86.1 $12,270 79.7 68.1
Mississippi 77.8 77.0 $5,574 67.8 45.1
Missouri 79.7 80.7 $8,780 73.3 56.8
Montana 75.9 68.1 $10,339 63.2 56.0
Nebraska 90.3 89.3 $8,349 63.7 69.3
Nevada 85.0 83.5 $8,412 82.0 57.8
New Hampshire 86.1 84.0 $9,854 91.0 88.8
New Jersey 73.8 74.9 $8,657 71.3 50.2
New Mexico 70.4 71.1 $7,570 57.8 57.5
New York 66.7 68.4 $7,813 40.8 71.2
North Carolina 73.6 76.9 $7,046 60.5 65.6
North Dakota 80.0 83.3 $8,587 76.0 78.4
Northern Mariana Islands 60.0 100.0 $4,329 66.7 0.0
Ohio 84.2 86.5 $8,416 82.1 62.4
Oklahoma 77.1 74.2 $7,603 75.5 61.1
Oregon 69.2 69.7 $6,945 63.8 42.5

Dislocated Workers
PY 2019 Illinois State Data Book 233
2nd Quarter Employment1
4th Quarter Employment2
Median Earnings1
Credential Attainment2
Measurable Skills Gains3
Palau 50.0 20.0 $2,415 0.0 80.0
Pennsylvania 84.5 83.6 $8,773 75.0 37.8
Puerto Rico - - - - -
Rhode Island 88.0 88.8 $8,878 70.7 52.0
South Carolina 79.1 81.2 $7,717 68.3 58.8
South Dakota 80.5 79.5 $7,009 82.4 87.7
Tennessee 85.1 85.3 $8,570 67.6 60.6
Texas 74.1 72.4 $8,484 72.8 58.7
Utah 81.6 84.7 $9,284 74.7 44.4
Vermont 80.0 74.6 $9,095 72.5 73.9
Virgin Islands 58.4 62.4 $6,794 37.5 67.6
Virginia 87.3 87.0 $8,888 78.0 55.8
Washington 71.1 72.1 $9,705 74.9 19.2
West Virginia 76.6 78.3 $8,684 75.9 39.9
Wisconsin 84.9 84.6 $8,458 73.4 50.9
Wyoming 90.0 85.7 $7,714 65.6 81.7
1 Based on those who exited from July 2018 to June 2019.
2 Based on those who exited from January 2018 to December 2018.
3 Based on those who participated between July 2019 and June 2020.

Dislocated Workers
PY 2019 Illinois State Data Book 234
Table III-39 WIA Common Measures for Dislocated Workers, by State
(Derived from PY 2019 Q4 PIRL)
Entered Employment1
Employment Retention2
Average Earnings2
Nation 66.2 87.2 $22,108
Alabama 80.1 91.4 $24,592
Alaska 88.2 85.0 $25,764
Arizona 82.4 92.7 $21,317
Arkansas 80.4 91.4 $16,183
California 71.5 87.8 $24,231
Colorado 76.7 86.0 $25,637
Connecticut 80.2 87.4 $21,373
Delaware 74.6 84.1 $19,542
District of Columbia 67.3 86.6 $23,606
Florida 82.2 91.5 $20,834
Georgia 81.2 90.8 $22,217
Guam 100.0 100.0 $12,870
Hawaii 90.0 88.1 $17,521
Idaho 81.3 89.8 $17,954
Illinois 83.5 91.6 $25,843
Indiana 79.2 90.4 $19,323
Iowa 86.0 95.0 $18,870
Kansas 83.2 94.7 $23,427
Kentucky 69.2 86.1 $16,381
Louisiana 63.5 90.6 $20,073
Maine 77.6 90.7 $17,955
Maryland 85.8 92.4 $23,518
Massachusetts 79.8 92.2 $28,003
Michigan 91.7 91.9 $19,591
Minnesota 86.1 94.3 $30,598
Mississippi 73.6 89.3 $13,881
Missouri 77.6 93.1 $40,855
Montana 77.0 87.9 $22,964
Nebraska 86.6 94.7 $19,155
Nevada 81.5 90.9 $19,334
New Hampshire 84.7 88.3 $25,111
New Jersey 67.6 87.2 $23,121
New Mexico 68.7 88.0 $18,106
New York 60.6 87.4 $24,892
North Carolina 72.4 89.0 $17,794
North Dakota 75.0 87.1 $21,519
Northern Mariana Islands 55.6 81.8 $10,280
Ohio 77.7 92.1 $21,851
Oklahoma 71.0 91.4 $19,377
Oregon 60.8 83.7 $18,881
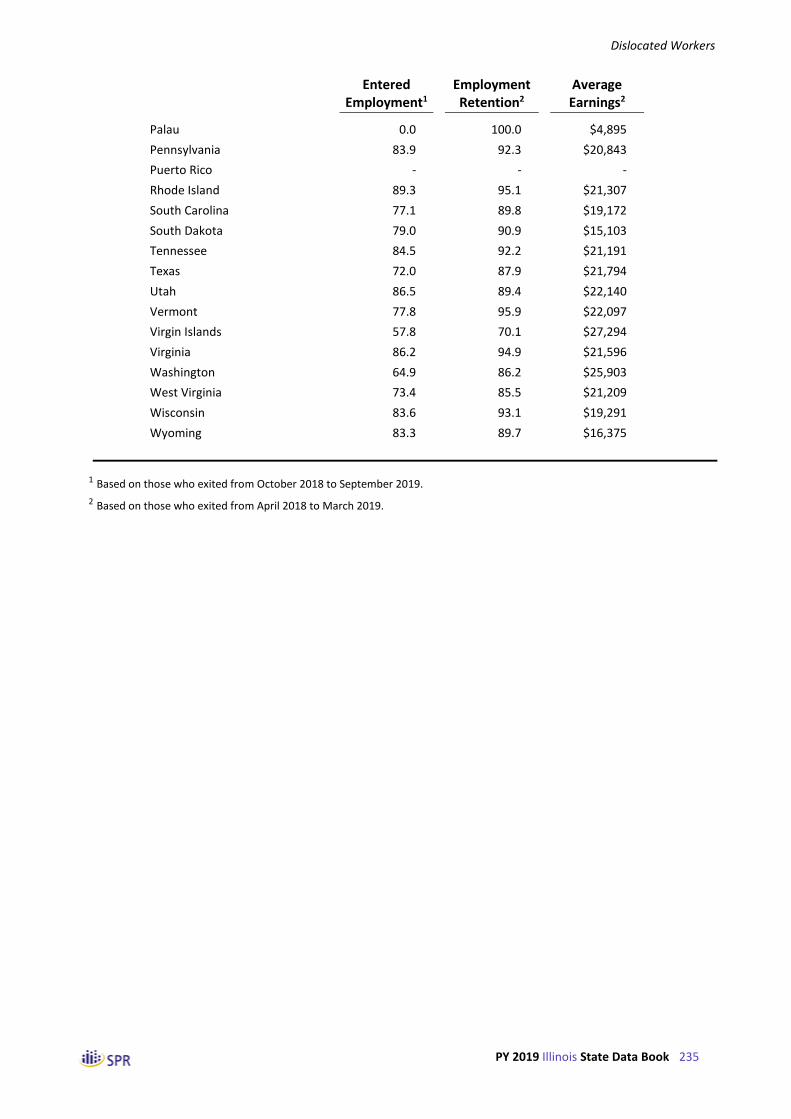
Dislocated Workers
PY 2019 Illinois State Data Book 235
Entered Employment1
Employment Retention2
Average Earnings2
Palau 0.0 100.0 $4,895
Pennsylvania 83.9 92.3 $20,843
Puerto Rico - - -
Rhode Island 89.3 95.1 $21,307
South Carolina 77.1 89.8 $19,172
South Dakota 79.0 90.9 $15,103
Tennessee 84.5 92.2 $21,191
Texas 72.0 87.9 $21,794
Utah 86.5 89.4 $22,140
Vermont 77.8 95.9 $22,097
Virgin Islands 57.8 70.1 $27,294
Virginia 86.2 94.9 $21,596
Washington 64.9 86.2 $25,903
West Virginia 73.4 85.5 $21,209
Wisconsin 83.6 93.1 $19,291
Wyoming 83.3 89.7 $16,375
1 Based on those who exited from October 2018 to September 2019.
2 Based on those who exited from April 2018 to March 2019.


Dislocated Worker Grants
PY 2019 Illinois State Data Book 237
Part IV: Dislocated Worker Grants

Dislocated Worker Grants
PY 2019 Illinois State Data Book 238
Table IV-1 Characteristics of Dislocated Worker Grant Exiters, Comparing Nation to State by DWG Type
(Derived from PY 2019 Q4 PIRL)
All DWG PY 2019
Disaster Recovery PY 2019
Economic Recovery PY 2019
Nation IL Nation IL Nation IL
Number of Exiters
All DWGs 14,957 173 6,107 15 8,850 158
Disaster Recovery 6,107 15 6,107 15
Economic Recovery 8,850 158 8,850 158
Age Categories
Under 22 4.7 0.6 7.1 0.0 3.1 0.6
22 to 29 20.9 14.5 23.6 20.0 19.0 13.9
30 to 44 34.5 34.1 35.9 33.3 33.6 34.2
45 to 54 21.4 29.5 18.6 26.7 23.2 29.7
55 and older 18.5 21.4 14.8 20.0 21.1 21.5
Gender
Females 42.0 32.9 38.4 33.3 44.5 32.9
Males 58.0 67.1 61.6 66.7 55.5 67.1
Race and Ethnicity
Hispanics/Latinos 23.1 31.2 25.8 13.3 21.2 32.9
American Indians/Alaska Natives 4.7 0.7 7.5 0.0 2.5 0.8
Asians 5.5 5.4 1.9 13.3 8.1 4.5
Blacks or African Americans 35.1 39.5 31.5 20.0 37.8 41.7
Native Hawaiians/Pacific Islanders 1.2 0.7 0.6 0.0 1.6 0.8
Whites 57.8 55.1 61.9 66.7 54.7 53.8
More than one race 3.7 1.4 2.9 0.0 4.2 1.5
Employment Status
Employed 10.3 0.0 5.9 0.0 13.3 0.0
Not employed or with layoff notice 89.7 100.0 94.1 100.0 86.7 100.0
Veteran Status
Veterans 7.1 2.9 10.0 0.0 5.1 3.2
Disabled veterans 1.0 0.0 1.2 0.0 0.9 0.0
Other eligible persons 0.2 0.0 0.2 0.0 0.1 0.0
Active duty military spouses 1.1 0.0 2.1 0.0 0.4 0.0
Unemployment Compensation Status
Claimants referred by RESEA 12.4 4.0 6.6 6.7 16.4 3.8
Claimants referred by WPRS 9.2 66.5 6.0 53.3 11.4 67.7
Claimants not referred 14.7 0.0 15.7 0.0 14.1 0.0
Claimants exempt 0.3 0.0 0.3 0.0 0.3 0.0
Exhaustees 5.2 11.6 6.2 0.0 4.5 12.7
Neither claimants nor exhaustees 58.2 17.9 65.3 40.0 53.3 15.8

Dislocated Worker Grants
PY 2019 Illinois State Data Book 239
All DWG PY 2019
Disaster Recovery PY 2019
Economic Recovery PY 2019
Nation IL Nation IL Nation IL
Highest Educational Level
No educational level completed 9.5 3.5 10.2 0.0 9.1 3.8
Secondary school equivalency 7.8 8.1 8.9 0.0 7.1 8.9
Secondary school graduates 33.9 49.1 37.0 53.3 31.8 48.7
Some postsecondary 16.7 6.9 16.5 0.0 16.8 7.6
Postsecondary technical or vocational certificate
4.1 3.5 5.4 0.0 3.2 3.8
Associate’s Degree 8.1 4.6 7.3 0.0 8.7 5.1
Bachelor’s Degree or higher 19.9 24.3 14.8 46.7 23.4 22.2
School Attendance
Attending school 4.7 0.0 2.4 0.0 6.4 0.0
Not attending 95.3 100.0 97.6 100.0 93.6 100.0
Preprogram Quarterly Earnings
Average Earnings $9,454 $12,089 $6,648 $14,720 $10,915 $11,859
None 27.5 6.4 39.3 13.3 19.3 5.7
$1 to $2,499 15.7 4.6 19.3 6.7 13.2 4.4
$2,500 to $4,999 12.6 8.7 12.5 6.7 12.6 8.9
$5,000 to $7,499 11.6 9.8 9.4 20.0 13.1 8.9
$7,500 to $9,999 9.7 20.2 6.8 13.3 11.7 20.9
$10,000 or more 23.0 50.3 12.7 40.0 30.2 51.3
Public Assistance Information
TANF 1.8 0.0 1.5 0.0 2.1 0.0
Other Characteristics
Individuals with a disability 4.6 0.0 4.2 0.0 5.0 0.0
Long-term unemployed 12.5 5.8 20.6 0.0 7.0 6.3
Exhausting TANF within 2 years 0.3 50.0 0.4 0.0 0.1 50.0
Homeless individuals or runaway youth
4.3 0.0 5.6 0.0 3.5 0.0
Ex-offenders 7.5 2.3 10.2 6.7 4.5 1.9
Low income 47.2 32.9 61.2 13.3 37.5 34.8
English language learners 4.9 1.2 7.0 0.0 3.4 1.3
Basic skills deficient 4.4 49.1 3.5 80.0 5.0 46.2
Facing substantial cultural barrier 4.1 0.6 6.9 0.0 1.4 0.6
Single parents 9.8 3.5 10.7 13.3 9.2 2.5
Displaced homemakers 3.0 0.6 0.8 0.0 4.5 0.6


Dislocated Worker Grants
PY 2019 Illinois State Data Book 241
Table IV-2 Number of Dislocated Worker Grant Exiters, Comparing Nation to State by DWG Type
(Derived from PY 2019 Q4 PIRL)
All DWG PY 2019
Disaster Recovery PY 2019
Economic Recovery PY 2019
Nation IL Nation IL Nation IL
Number of Exiters
All DWGs 14,957 173 6,107 15 8,850 158
Disaster Recovery 6,107 15 6,107 15
Economic Recovery 8,850 158 8,850 158
Age Categories
Under 22 705 * 432 0 273 *
22 to 29 3,122 25 1,441 * 1,681 22
30 to 44 5,166 59 2,192 * 2,974 54
45 to 54 3,193 51 1,138 * 2,055 47
55 and older 2,769 37 904 * 1,865 34
Gender
Females 6,219 57 2,334 * 3,885 52
Males 8,587 116 3,749 10 4,838 106
Race and Ethnicity
Hispanics/Latinos 3,306 54 1,540 * 1,766 52
American Indians/Alaska Natives 550 * 377 0 173 *
Asians 646 * 97 * 549 *
Blacks or African Americans 4,148 58 1,584 * 2,564 55
Native Hawaiians/Pacific Islanders 141 * 29 0 112 *
Whites 6,830 81 3,114 10 3,716 71
More than one race 433 * 148 0 285 *
Employment Status
Employed 1,539 0 360 0 1,179 0
Not employed or with layoff notice 13,418 173 5,747 15 7,671 158
Veteran Status
Veterans 1,059 * 612 0 447 *
Disabled veterans 154 0 75 0 79 0
Other eligible persons 26 0 14 0 12 0
Active duty military spouses 169 0 131 0 38 0
Unemployment Compensation Status
Claimants referred by RESEA 1,857 * 403 * 1,454 *
Claimants referred by WPRS 1,379 115 367 * 1,012 107
Claimants not referred 2,203 0 956 0 1,247 0
Claimants exempt 47 0 18 0 29 0
Exhaustees 771 20 377 0 394 20
Neither claimants nor exhaustees 8,700 31 3,986 * 4,714 25
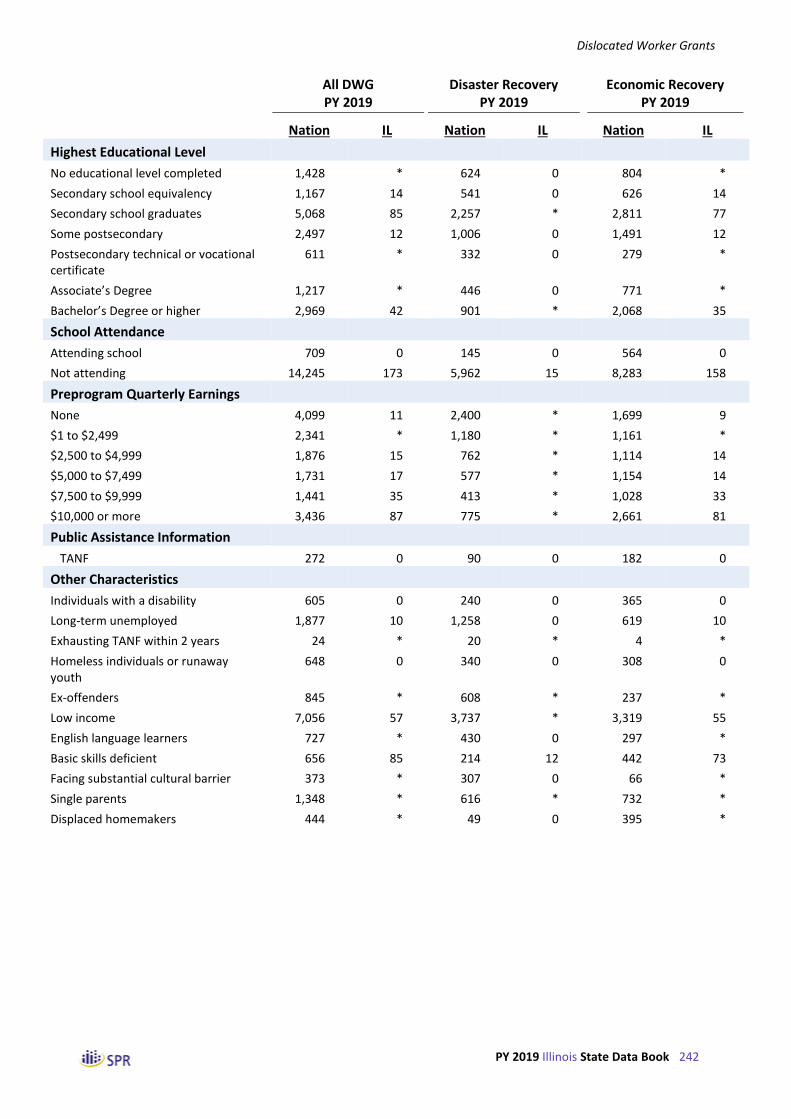
Dislocated Worker Grants
PY 2019 Illinois State Data Book 242
All DWG PY 2019
Disaster Recovery PY 2019
Economic Recovery PY 2019
Nation IL Nation IL Nation IL
Highest Educational Level
No educational level completed 1,428 * 624 0 804 *
Secondary school equivalency 1,167 14 541 0 626 14
Secondary school graduates 5,068 85 2,257 * 2,811 77
Some postsecondary 2,497 12 1,006 0 1,491 12
Postsecondary technical or vocational certificate
611 * 332 0 279 *
Associate’s Degree 1,217 * 446 0 771 *
Bachelor’s Degree or higher 2,969 42 901 * 2,068 35
School Attendance
Attending school 709 0 145 0 564 0
Not attending 14,245 173 5,962 15 8,283 158
Preprogram Quarterly Earnings
None 4,099 11 2,400 * 1,699 9
$1 to $2,499 2,341 * 1,180 * 1,161 *
$2,500 to $4,999 1,876 15 762 * 1,114 14
$5,000 to $7,499 1,731 17 577 * 1,154 14
$7,500 to $9,999 1,441 35 413 * 1,028 33
$10,000 or more 3,436 87 775 * 2,661 81
Public Assistance Information
TANF 272 0 90 0 182 0
Other Characteristics
Individuals with a disability 605 0 240 0 365 0
Long-term unemployed 1,877 10 1,258 0 619 10
Exhausting TANF within 2 years 24 * 20 * 4 *
Homeless individuals or runaway youth
648 0 340 0 308 0
Ex-offenders 845 * 608 * 237 *
Low income 7,056 57 3,737 * 3,319 55
English language learners 727 * 430 0 297 *
Basic skills deficient 656 85 214 12 442 73
Facing substantial cultural barrier 373 * 307 0 66 *
Single parents 1,348 * 616 * 732 *
Displaced homemakers 444 * 49 0 395 *

Dislocated Worker Grants
PY 2019 Illinois State Data Book 243
Table IV-3 Characteristics of Dislocated Worker Grant Exiters Who Exited from April 2018 to March 2019 in
IL, by Major Service Categories
(Derived from PY 2019 Q4 PIRL)
Received Career Services
All Exiters Basic Individualized
Only Career Services
Received Training
Number of Exiters
All DWGs 173 173 173 42 131
Disaster Recovery 15 15 15 0 15
Economic Recovery 158 158 158 42 116
Age Categories
Under 22 0.6 0.6 0.6 0.0 0.8
22 to 29 14.5 14.5 14.5 9.5 16.0
30 to 44 34.1 34.1 34.1 23.8 37.4
45 to 54 29.5 29.5 29.5 28.6 29.8
55 and older 21.4 21.4 21.4 38.1 16.0
Gender
Females 32.9 32.9 32.9 47.6 28.2
Males 67.1 67.1 67.1 52.4 71.8
Race and Ethnicity
Hispanics/Latinos 31.2 31.2 31.2 42.9 27.5
American Indians/Alaska Natives 0.7 0.7 0.7 0.0 0.9
Asians 5.4 5.4 5.4 3.1 6.1
Blacks or African Americans 39.5 39.5 39.5 46.9 37.4
Native Hawaiians/Pacific Islanders 0.7 0.7 0.7 0.0 0.9
Whites 55.1 55.1 55.1 53.1 55.7
More than one race 1.4 1.4 1.4 3.1 0.9
Employment Status
Employed 0.0 0.0 0.0 0.0 0.0
Not employed or with layoff notice 100.0 100.0 100.0 100.0 100.0
Veteran Status
Veterans 2.9 2.9 2.9 2.4 3.1
Disabled veterans 0.0 0.0 0.0 0.0 0.0
Other eligible persons 0.0 0.0 0.0 0.0 0.0
Active duty military spouses 0.0 0.0 0.0 0.0 0.0
Unemployment Compensation Status
Claimants referred by RESEA 4.0 4.0 4.0 4.8 3.8
Claimants referred by WPRS 66.5 66.5 66.5 83.3 61.1
Claimants not referred 0.0 0.0 0.0 0.0 0.0
Claimants exempt 0.0 0.0 0.0 0.0 0.0
Exhaustees 11.6 11.6 11.6 4.8 13.7
Neither claimants nor exhaustees 17.9 17.9 17.9 7.1 21.4
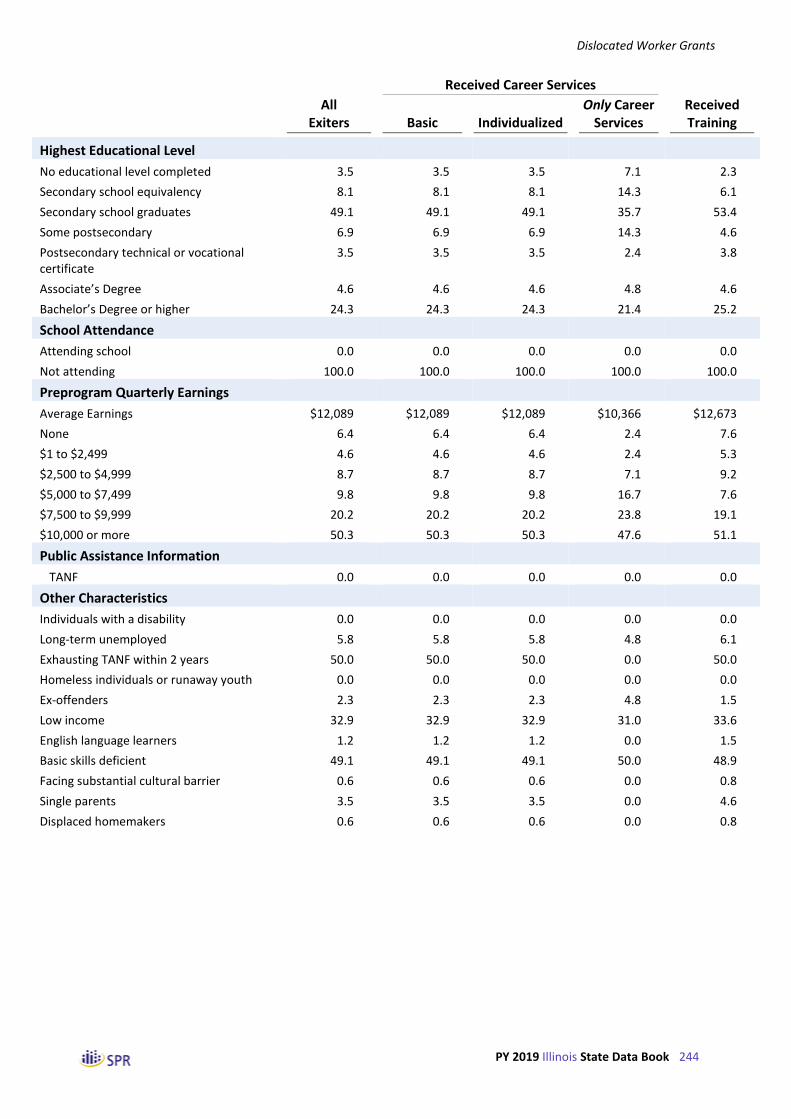
Dislocated Worker Grants
PY 2019 Illinois State Data Book 244
Received Career Services
All Exiters Basic Individualized
Only Career Services
Received Training
Highest Educational Level
No educational level completed 3.5 3.5 3.5 7.1 2.3
Secondary school equivalency 8.1 8.1 8.1 14.3 6.1
Secondary school graduates 49.1 49.1 49.1 35.7 53.4
Some postsecondary 6.9 6.9 6.9 14.3 4.6
Postsecondary technical or vocational certificate
3.5 3.5 3.5 2.4 3.8
Associate’s Degree 4.6 4.6 4.6 4.8 4.6
Bachelor’s Degree or higher 24.3 24.3 24.3 21.4 25.2
School Attendance
Attending school 0.0 0.0 0.0 0.0 0.0
Not attending 100.0 100.0 100.0 100.0 100.0
Preprogram Quarterly Earnings
Average Earnings $12,089 $12,089 $12,089 $10,366 $12,673
None 6.4 6.4 6.4 2.4 7.6
$1 to $2,499 4.6 4.6 4.6 2.4 5.3
$2,500 to $4,999 8.7 8.7 8.7 7.1 9.2
$5,000 to $7,499 9.8 9.8 9.8 16.7 7.6
$7,500 to $9,999 20.2 20.2 20.2 23.8 19.1
$10,000 or more 50.3 50.3 50.3 47.6 51.1
Public Assistance Information
TANF 0.0 0.0 0.0 0.0 0.0
Other Characteristics
Individuals with a disability 0.0 0.0 0.0 0.0 0.0
Long-term unemployed 5.8 5.8 5.8 4.8 6.1
Exhausting TANF within 2 years 50.0 50.0 50.0 0.0 50.0
Homeless individuals or runaway youth 0.0 0.0 0.0 0.0 0.0
Ex-offenders 2.3 2.3 2.3 4.8 1.5
Low income 32.9 32.9 32.9 31.0 33.6
English language learners 1.2 1.2 1.2 0.0 1.5
Basic skills deficient 49.1 49.1 49.1 50.0 48.9
Facing substantial cultural barrier 0.6 0.6 0.6 0.0 0.8
Single parents 3.5 3.5 3.5 0.0 4.6
Displaced homemakers 0.6 0.6 0.6 0.0 0.8

Dislocated Worker Grants
PY 2019 Illinois State Data Book 245
Table IV-4 Number of Dislocated Worker Grant Exiters Who Exited from April 2018 to March 2019 in IL,
by Major Service Categories
(Derived from PY 2019 Q4 PIRL)
Received Career Services
All Exiters Basic Individualized
Only Career Services
Received Training
Number of Exiters
All DWGs 173 173 173 42 131
Disaster Recovery 15 15 15 0 15
Economic Recovery 158 158 158 42 116
Age Categories
Under 22 * * * 0 *
22 to 29 25 25 25 * 21
30 to 44 59 59 59 10 49
45 to 54 51 51 51 12 39
55 and older 37 37 37 16 21
Gender
Females 57 57 57 20 37
Males 116 116 116 22 94
Race and Ethnicity
Hispanics/Latinos 54 54 54 18 36
American Indians/Alaska Natives * * * 0 *
Asians * * * * *
Blacks or African Americans 58 58 58 15 43
Native Hawaiians/Pacific Islanders * * * 0 *
Whites 81 81 81 17 64
More than one race * * * * *
Employment Status
Employed 0 0 0 0 0
Not employed or with layoff notice 173 173 173 42 131
Veteran Status
Veterans * * * * *
Disabled veterans 0 0 0 0 0
Other eligible persons 0 0 0 0 0
Active duty military spouses 0 0 0 0 0
Unemployment Compensation Status
Claimants referred by RESEA * * * * *
Claimants referred by WPRS 115 115 115 35 80
Claimants not referred 0 0 0 0 0
Claimants exempt 0 0 0 0 0
Exhaustees 20 20 20 * 18
Neither claimants nor exhaustees 31 31 31 * 28

Dislocated Worker Grants
PY 2019 Illinois State Data Book 246
Received Career Services
All Exiters Basic Individualized
Only Career Services
Received Training
Highest Educational Level
No educational level completed * * * * *
Secondary school equivalency 14 14 14 * *
Secondary school graduates 85 85 85 15 70
Some postsecondary 12 12 12 * *
Postsecondary technical or vocational certificate
* * * * *
Associate’s Degree * * * * *
Bachelor’s Degree or higher 42 42 42 9 33
School Attendance
Attending school 0 0 0 0 0
Not attending 173 173 173 42 131
Preprogram Quarterly Earnings
None 11 11 11 * 10
$1 to $2,499 * * * * *
$2,500 to $4,999 15 15 15 * 12
$5,000 to $7,499 17 17 17 * 10
$7,500 to $9,999 35 35 35 10 25
$10,000 or more 87 87 87 20 67
Public Assistance Information
TANF 0 0 0 0 0
Other Characteristics
Individuals with a disability 0 0 0 0 0
Long-term unemployed 10 10 10 * *
Exhausting TANF within 2 years * * * 0 *
Homeless individuals or runaway youth 0 0 0 0 0
Ex-offenders * * * * *
Low income 57 57 57 13 44
English language learners * * * 0 *
Basic skills deficient 85 85 85 21 64
Facing substantial cultural barrier * * * 0 *
Single parents * * * 0 *
Displaced homemakers * * * 0 *

Dislocated Worker Grants
PY 2019 Illinois State Data Book 247
Table IV-5 Characteristics of Dislocated Worker Grant Trainees Who Exited from April 2018 to March 2019 in
IL, by Type of Training
(Derived from PY 2019 Q4 PIRL)
Any
Training
ABE/ESL or Prerequisite
Training
Work-based
Training
Other Occupational
Training
Other
Training
Number of Trainees
All Dislocated Worker Grant trainees 131 * 50 82 *
Disaster Recovery 15 * * 10 *
Economic Recovery 116 * 45 72 *
Age Categories
Under 22 0.8 * 0.0 1.2 *
22 to 29 16.0 * 16.0 15.9 *
30 to 44 37.4 * 30.0 41.5 *
45 to 54 29.8 * 36.0 25.6 *
55 and older 16.0 * 18.0 15.9 *
Gender
Females 28.2 * 26.0 30.5 *
Males 71.8 * 74.0 69.5 *
Race and Ethnicity
Hispanics/Latinos 27.5 * 32.0 24.4 *
American Indians/Alaska Natives 0.9 * 2.2 0.0 *
Asians 6.1 * 0.0 10.0 *
Blacks or African Americans 37.4 * 41.3 34.3 *
Native Hawaiians/Pacific Islanders 0.9 * 0.0 1.4 *
Whites 55.7 * 58.7 54.3 *
More than one race 0.9 * 2.2 0.0 *
Employment Status
Employed 0.0 * 0.0 0.0 *
Not employed or with layoff notice 100.0 * 100.0 100.0 *
Veteran Status
Veterans 3.1 * 0.0 4.9 *
Disabled veterans 0.0 * 0.0 0.0 *
Other eligible persons 0.0 * 0.0 0.0 *
Active duty military spouses 0.0 * 0.0 0.0 *
Unemployment Compensation Status
Claimants referred by RESEA 3.8 * 0.0 6.1 *
Claimants referred by WPRS 61.1 * 38.0 75.6 *
Claimants not referred 0.0 * 0.0 0.0 *
Claimants exempt 0.0 * 0.0 0.0 *
Exhaustees 13.7 * 16.0 12.2 *
Neither claimants nor exhaustees 21.4 * 46.0 6.1 *
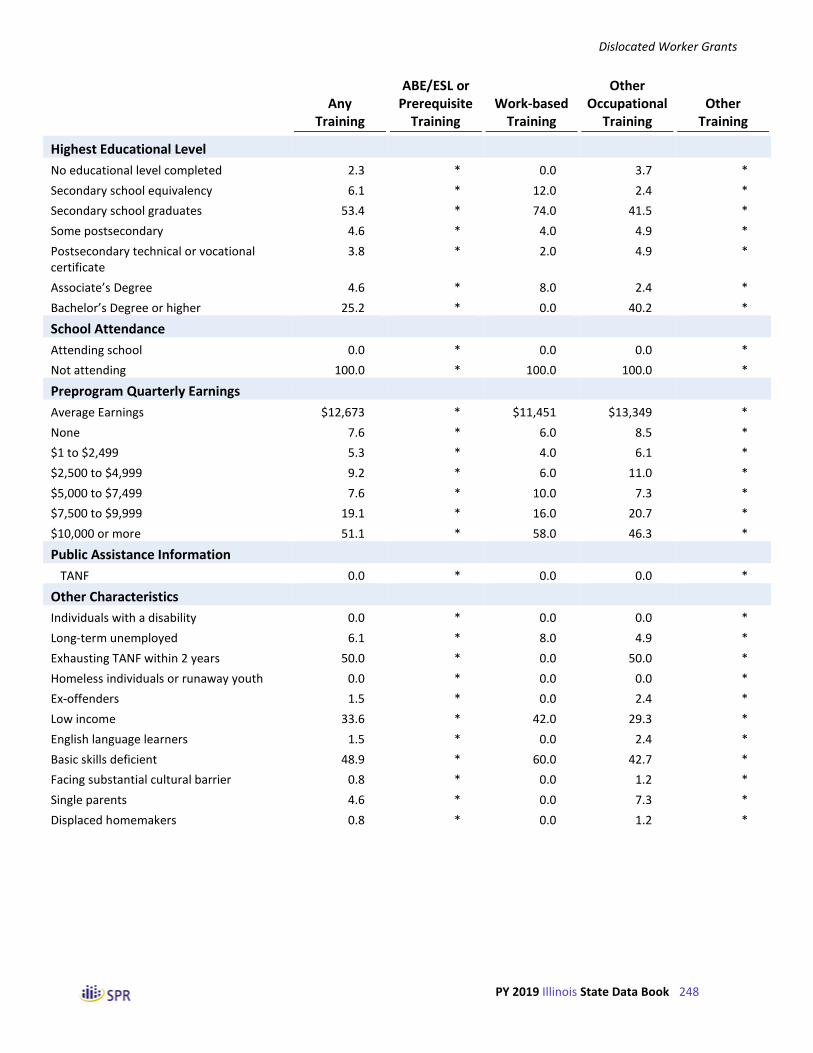
Dislocated Worker Grants
PY 2019 Illinois State Data Book 248
Any
Training
ABE/ESL or Prerequisite
Training
Work-based
Training
Other Occupational
Training
Other
Training
Highest Educational Level
No educational level completed 2.3 * 0.0 3.7 *
Secondary school equivalency 6.1 * 12.0 2.4 *
Secondary school graduates 53.4 * 74.0 41.5 *
Some postsecondary 4.6 * 4.0 4.9 *
Postsecondary technical or vocational certificate
3.8 * 2.0 4.9 *
Associate’s Degree 4.6 * 8.0 2.4 *
Bachelor’s Degree or higher 25.2 * 0.0 40.2 *
School Attendance
Attending school 0.0 * 0.0 0.0 *
Not attending 100.0 * 100.0 100.0 *
Preprogram Quarterly Earnings
Average Earnings $12,673 * $11,451 $13,349 *
None 7.6 * 6.0 8.5 *
$1 to $2,499 5.3 * 4.0 6.1 *
$2,500 to $4,999 9.2 * 6.0 11.0 *
$5,000 to $7,499 7.6 * 10.0 7.3 *
$7,500 to $9,999 19.1 * 16.0 20.7 *
$10,000 or more 51.1 * 58.0 46.3 *
Public Assistance Information
TANF 0.0 * 0.0 0.0 *
Other Characteristics
Individuals with a disability 0.0 * 0.0 0.0 *
Long-term unemployed 6.1 * 8.0 4.9 *
Exhausting TANF within 2 years 50.0 * 0.0 50.0 *
Homeless individuals or runaway youth 0.0 * 0.0 0.0 *
Ex-offenders 1.5 * 0.0 2.4 *
Low income 33.6 * 42.0 29.3 *
English language learners 1.5 * 0.0 2.4 *
Basic skills deficient 48.9 * 60.0 42.7 *
Facing substantial cultural barrier 0.8 * 0.0 1.2 *
Single parents 4.6 * 0.0 7.3 *
Displaced homemakers 0.8 * 0.0 1.2 *
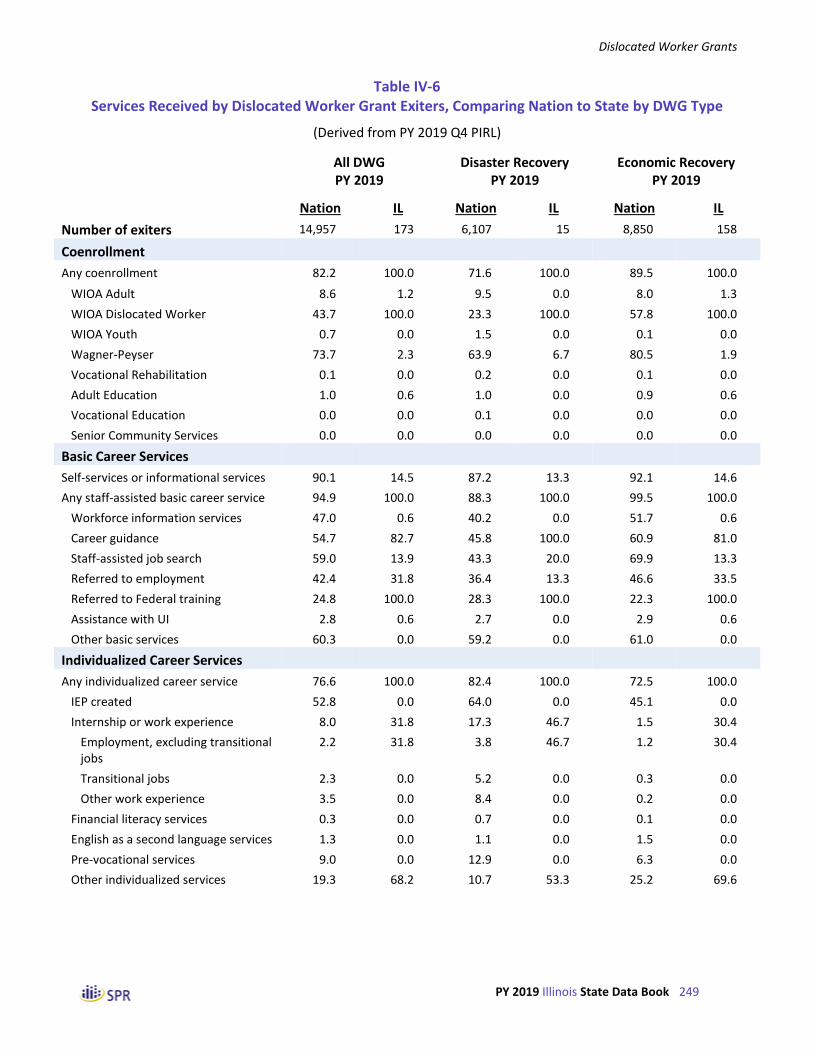
Dislocated Worker Grants
PY 2019 Illinois State Data Book 249
Table IV-6 Services Received by Dislocated Worker Grant Exiters, Comparing Nation to State by DWG Type
(Derived from PY 2019 Q4 PIRL)
All DWG PY 2019
Disaster Recovery PY 2019
Economic Recovery PY 2019
Nation IL Nation IL Nation IL
Number of exiters 14,957 173 6,107 15 8,850 158
Coenrollment
Any coenrollment 82.2 100.0 71.6 100.0 89.5 100.0
WIOA Adult 8.6 1.2 9.5 0.0 8.0 1.3
WIOA Dislocated Worker 43.7 100.0 23.3 100.0 57.8 100.0
WIOA Youth 0.7 0.0 1.5 0.0 0.1 0.0
Wagner-Peyser 73.7 2.3 63.9 6.7 80.5 1.9
Vocational Rehabilitation 0.1 0.0 0.2 0.0 0.1 0.0
Adult Education 1.0 0.6 1.0 0.0 0.9 0.6
Vocational Education 0.0 0.0 0.1 0.0 0.0 0.0
Senior Community Services 0.0 0.0 0.0 0.0 0.0 0.0
Basic Career Services
Self-services or informational services 90.1 14.5 87.2 13.3 92.1 14.6
Any staff-assisted basic career service 94.9 100.0 88.3 100.0 99.5 100.0
Workforce information services 47.0 0.6 40.2 0.0 51.7 0.6
Career guidance 54.7 82.7 45.8 100.0 60.9 81.0
Staff-assisted job search 59.0 13.9 43.3 20.0 69.9 13.3
Referred to employment 42.4 31.8 36.4 13.3 46.6 33.5
Referred to Federal training 24.8 100.0 28.3 100.0 22.3 100.0
Assistance with UI 2.8 0.6 2.7 0.0 2.9 0.6
Other basic services 60.3 0.0 59.2 0.0 61.0 0.0
Individualized Career Services
Any individualized career service 76.6 100.0 82.4 100.0 72.5 100.0
IEP created 52.8 0.0 64.0 0.0 45.1 0.0
Internship or work experience 8.0 31.8 17.3 46.7 1.5 30.4
Employment, excluding transitional jobs
2.2 31.8 3.8 46.7 1.2 30.4
Transitional jobs 2.3 0.0 5.2 0.0 0.3 0.0
Other work experience 3.5 0.0 8.4 0.0 0.2 0.0
Financial literacy services 0.3 0.0 0.7 0.0 0.1 0.0
English as a second language services 1.3 0.0 1.1 0.0 1.5 0.0
Pre-vocational services 9.0 0.0 12.9 0.0 6.3 0.0
Other individualized services 19.3 68.2 10.7 53.3 25.2 69.6

Dislocated Worker Grants
PY 2019 Illinois State Data Book 250
All DWG PY 2019
Disaster Recovery PY 2019
Economic Recovery PY 2019
Nation IL Nation IL Nation IL
Weeks Participated
Average number of weeks 29.9 44.3 36.7 36.9 25.2 45.0
4 or fewer weeks 19.6 0.6 6.0 0.0 29.0 0.6
5 to 13 weeks 20.0 9.8 15.9 0.0 22.8 10.8
14 to 26 weeks 23.6 35.3 27.0 33.3 21.2 35.4
27 to 52 weeks 20.2 37.0 27.7 46.7 15.0 36.1
53 to 104 weeks 11.4 5.2 19.1 13.3 6.2 4.4
More than 104 weeks 5.2 12.1 4.3 6.7 5.8 12.7
Other Assistance
Needs-related payments 0.0 0.0 0.0 0.0 0.1 0.0
Supportive services 21.3 0.0 35.8 0.0 11.4 0.0
Rapid response 7.8 39.9 2.4 13.3 11.5 42.4
Disaster relief employment 11.3 0.0 27.8 0.0 0.0 0.0
Other Reason for Exit
Institutionalized, including criminal offender
0.3 0.0 0.5 0.0 0.1 0.0
Health/medical 0.7 1.2 0.9 0.0 0.5 1.3
Deceased 0.0 0.0 0.1 0.0 0.0 0.0
Reserve called to active duty 0.0 0.0 0.0 0.0 0.0 0.0
Training Services
Received any training 31.6 75.7 27.1 100.0 34.7 73.4
Characteristics of Training (among trainees)
Number of trainees 4,728 131 1,656 15 3,072 116
Type of training
On-the-job training 12.9 37.4 16.5 33.3 10.9 37.9
Skill upgrading 7.5 61.1 5.9 66.7 8.4 60.3
Entrepreneurial training 0.1 0.0 0.0 0.0 0.2 0.0
ABE or ESL with other training 0.9 0.0 1.9 0.0 0.4 0.0
Customized training 1.8 11.5 1.3 0.0 2.0 12.9
Other occupational skills training 77.9 2.3 76.6 0.0 78.6 2.6
Prerequisite training 0.2 0.0 0.1 0.0 0.2 0.0
Registered apprenticeship 2.4 0.0 3.7 0.0 1.7 0.0
Other non-occupational training 0.1 0.0 0.1 0.0 0.2 0.0
Job readiness training in conjunction with other training
0.1 0.0 0.0 0.0 0.1 0.0
Completed training 81.5 93.1 75.7 86.7 84.7 94.0
ITA established 57.8 2.3 69.6 13.3 51.4 0.9
Pell grant recipients 3.3 3.1 3.3 0.0 3.3 3.4
Program(s) operated by the private sector
26.0 84.0 10.3 53.3 34.5 87.9

Dislocated Worker Grants
PY 2019 Illinois State Data Book 251
All DWG PY 2019
Disaster Recovery PY 2019
Economic Recovery PY 2019
Nation IL Nation IL Nation IL
Characteristics of Training (among trainees) cont’d)
Weeks of training
Average number of weeks 24.7 25.5 22.3 19.8 26.1 26.2
4 or fewer weeks 21.6 3.8 18.4 0.0 23.3 4.3
5 to 13 weeks 32.0 38.9 37.3 13.3 29.2 42.2
14 to 26 weeks 19.7 35.9 19.2 60.0 20.0 32.8
27 to 52 weeks 13.6 13.0 15.3 26.7 12.7 11.2
53 to 104 weeks 8.4 0.8 6.7 0.0 9.3 0.9
More than 104 weeks 4.7 7.6 3.2 0.0 5.5 8.6
Occupation of training
Management 11.2 10.7 7.5 20.0 13.0 9.5
Business and financial 2.9 3.8 3.0 6.7 2.8 3.4
Computer and mathematical 12.2 9.2 7.7 6.7 14.5 9.5
Architecture and engineering 5.4 0.0 1.8 0.0 7.2 0.0
Education, training, and library 1.0 0.0 1.8 0.0 0.7 0.0
Healthcare practitioners and technical
8.8 10.7 9.4 20.0 8.5 9.5
Healthcare support 6.1 2.3 4.4 0.0 6.9 2.6
Food preparation and serving related 0.3 0.8 0.3 0.0 0.4 0.9
Personal care and service 0.2 0.0 0.1 0.0 0.2 0.0
Sales and related 0.9 0.8 1.1 6.7 0.8 0.0
Office and administrative support 10.5 1.5 6.5 6.7 12.5 0.9
Construction and extraction 6.6 0.0 10.5 0.0 4.6 0.0
Installation, maintenance, and repair 5.8 5.3 11.2 6.7 3.1 5.2
Production 8.3 33.6 8.7 20.0 8.1 35.3
Transportation and material moving 16.3 22.1 20.9 6.7 13.9 24.1
Other occupations 6.3 0.0 6.7 0.0 6.1 0.0

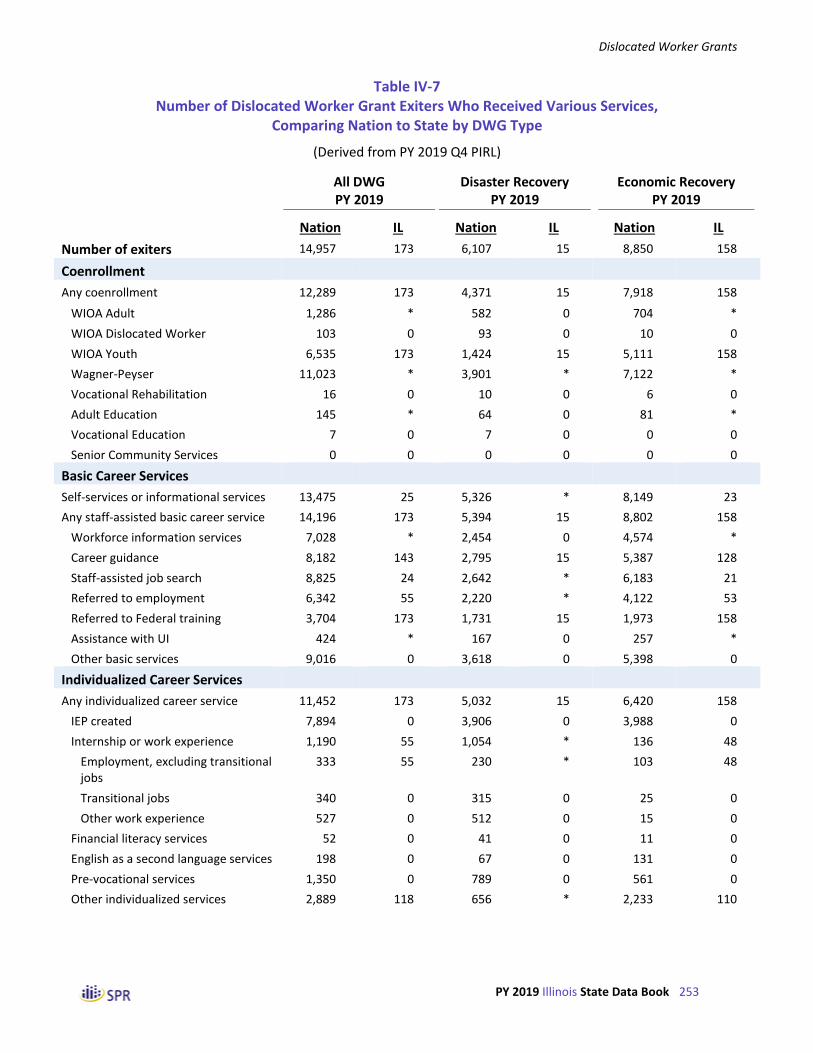
Dislocated Worker Grants
PY 2019 Illinois State Data Book 253
Table IV-7 Number of Dislocated Worker Grant Exiters Who Received Various Services,
Comparing Nation to State by DWG Type
(Derived from PY 2019 Q4 PIRL)
All DWG PY 2019
Disaster Recovery PY 2019
Economic Recovery PY 2019
Nation IL Nation IL Nation IL
Number of exiters 14,957 173 6,107 15 8,850 158
Coenrollment
Any coenrollment 12,289 173 4,371 15 7,918 158
WIOA Adult 1,286 * 582 0 704 *
WIOA Dislocated Worker 103 0 93 0 10 0
WIOA Youth 6,535 173 1,424 15 5,111 158
Wagner-Peyser 11,023 * 3,901 * 7,122 *
Vocational Rehabilitation 16 0 10 0 6 0
Adult Education 145 * 64 0 81 *
Vocational Education 7 0 7 0 0 0
Senior Community Services 0 0 0 0 0 0
Basic Career Services
Self-services or informational services 13,475 25 5,326 * 8,149 23
Any staff-assisted basic career service 14,196 173 5,394 15 8,802 158
Workforce information services 7,028 * 2,454 0 4,574 *
Career guidance 8,182 143 2,795 15 5,387 128
Staff-assisted job search 8,825 24 2,642 * 6,183 21
Referred to employment 6,342 55 2,220 * 4,122 53
Referred to Federal training 3,704 173 1,731 15 1,973 158
Assistance with UI 424 * 167 0 257 *
Other basic services 9,016 0 3,618 0 5,398 0
Individualized Career Services
Any individualized career service 11,452 173 5,032 15 6,420 158
IEP created 7,894 0 3,906 0 3,988 0
Internship or work experience 1,190 55 1,054 * 136 48
Employment, excluding transitional jobs
333 55 230 * 103 48
Transitional jobs 340 0 315 0 25 0
Other work experience 527 0 512 0 15 0
Financial literacy services 52 0 41 0 11 0
English as a second language services 198 0 67 0 131 0
Pre-vocational services 1,350 0 789 0 561 0
Other individualized services 2,889 118 656 * 2,233 110

Dislocated Worker Grants
PY 2019 Illinois State Data Book 254
All DWG PY 2019
Disaster Recovery PY 2019
Economic Recovery PY 2019
Nation IL Nation IL Nation IL
Weeks Participated
4 or fewer weeks 2,936 * 367 0 2,569 *
5 to 13 weeks 2,987 17 973 0 2,014 17
14 to 26 weeks 3,525 61 1,650 * 1,875 56
27 to 52 weeks 3,016 64 1,689 * 1,327 57
53 to 104 weeks 1,712 9 1,164 * 548 *
More than 104 weeks 781 21 264 * 517 20
Other Assistance
Needs-related payments 6 0 1 0 5 0
Supportive services 3,190 0 2,185 0 1,005 0
Rapid response 1,163 69 148 * 1,015 67
Disaster relief employment 1,695 0 1,695 0 0 0
Other Reason for Exit
Institutionalized, including criminal offender
40 0 32 0 8 0
Health/medical 100 * 54 0 46 *
Deceased 7 0 6 0 1 0
Reserve called to active duty 0 0 0 0 0 0
Training Services
Received any training 4,728 131 1,656 15 3,072 116
Characteristics of Training (among trainees)
Number of trainees 4,728 131 1,656 15 3,072 116
Type of training
On-the-job training 608 49 273 * 335 44
Skill upgrading 356 80 97 10 259 70
Entrepreneurial training 5 0 0 0 5 0
ABE or ESL with other training 44 0 31 0 13 0
Customized training 83 15 21 0 62 15
Other occupational skills training 3,685 * 1,269 0 2,416 *
Prerequisite training 8 0 2 0 6 0
Registered apprenticeship 112 0 61 0 51 0
Other non-occupational training 7 0 1 0 6 0
Job readiness training in conjunction with other training
3 0 0 0 3 0
Completed training 3,855 122 1,253 13 2,602 109
ITA established 2,732 * 1,152 * 1,580 *
Pell grant recipients 156 * 55 0 101 *
Program(s) operated by the private sector
1,231 110 171 * 1,060 102
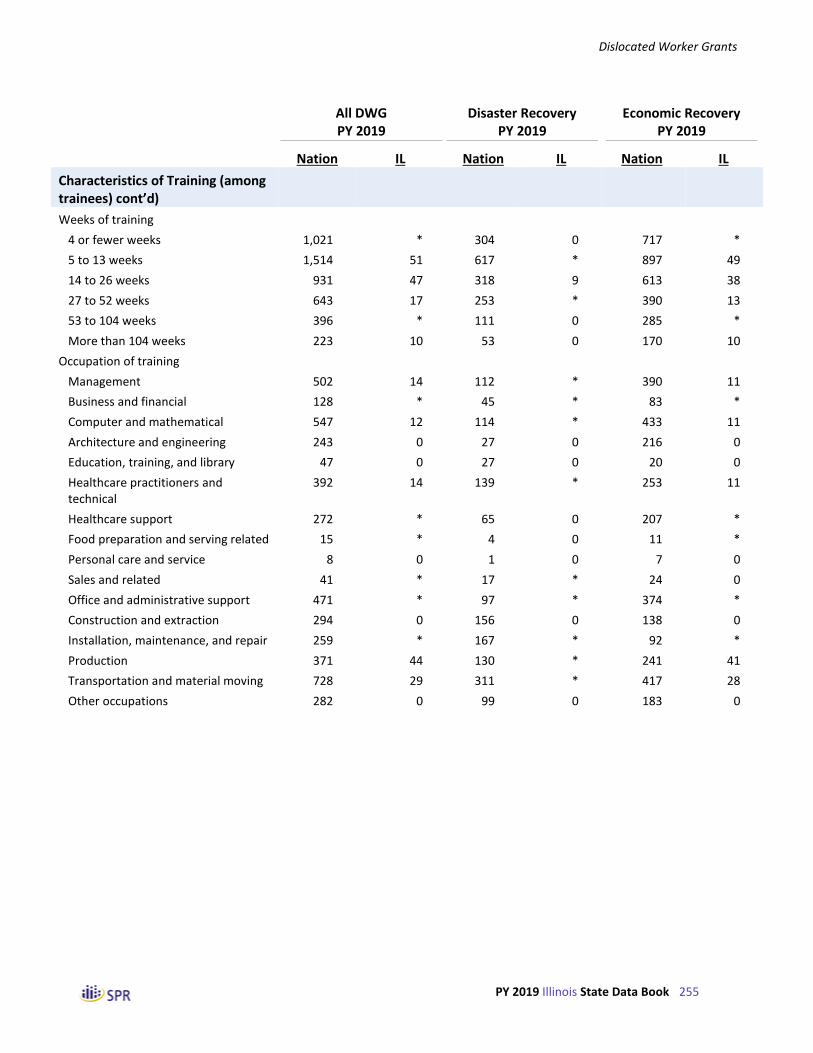
Dislocated Worker Grants
PY 2019 Illinois State Data Book 255
All DWG PY 2019
Disaster Recovery PY 2019
Economic Recovery PY 2019
Nation IL Nation IL Nation IL
Characteristics of Training (among trainees) cont’d)
Weeks of training
4 or fewer weeks 1,021 * 304 0 717 *
5 to 13 weeks 1,514 51 617 * 897 49
14 to 26 weeks 931 47 318 9 613 38
27 to 52 weeks 643 17 253 * 390 13
53 to 104 weeks 396 * 111 0 285 *
More than 104 weeks 223 10 53 0 170 10
Occupation of training
Management 502 14 112 * 390 11
Business and financial 128 * 45 * 83 *
Computer and mathematical 547 12 114 * 433 11
Architecture and engineering 243 0 27 0 216 0
Education, training, and library 47 0 27 0 20 0
Healthcare practitioners and technical
392 14 139 * 253 11
Healthcare support 272 * 65 0 207 *
Food preparation and serving related 15 * 4 0 11 *
Personal care and service 8 0 1 0 7 0
Sales and related 41 * 17 * 24 0
Office and administrative support 471 * 97 * 374 *
Construction and extraction 294 0 156 0 138 0
Installation, maintenance, and repair 259 * 167 * 92 *
Production 371 44 130 * 241 41
Transportation and material moving 728 29 311 * 417 28
Other occupations 282 0 99 0 183 0

Dislocated Worker Grants
PY 2019 Illinois State Data Book 256
Table IV-15 Services Received by Dislocated Worker Grant Exiters Who Exited from April 2018 to March 2019,
by State
(Derived from PY 2019 Q4 PIRL)
Received Career Services
Number of Exiters
Basic
Individualized
Only Career Services
Received Training
Nation 14,957 98.8 76.6 67.3 31.6
Alabama 0 - - - -
Alaska 152 100.0 100.0 12.5 87.5
Arizona 0 - - - -
Arkansas 49 98.0 40.8 98.0 2.0
California 2,721 99.9 75.5 76.6 23.4
Colorado 0 - - - -
Connecticut 140 100.0 100.0 51.4 48.6
Delaware 20 95.0 50.0 5.0 90.0
District of Columbia 0 - - - -
Florida 904 100.0 88.9 74.8 25.2
Georgia 17 100.0 100.0 82.4 17.6
Guam 1 100.0 100.0 100.0 0.0
Hawaii 7 100.0 100.0 100.0 0.0
Idaho 12 100.0 100.0 16.7 83.3
Illinois 173 100.0 100.0 24.3 75.7
Indiana 61 100.0 100.0 88.5 11.5
Iowa 52 100.0 100.0 9.6 90.4
Kansas 18 100.0 38.9 100.0 0.0
Kentucky 499 100.0 100.0 95.2 4.8
Louisiana 3 100.0 100.0 0.0 100.0
Maine 0 - - - -
Maryland 331 100.0 99.4 48.6 51.4
Massachusetts 319 100.0 100.0 67.7 32.3
Michigan 257 93.4 90.7 60.7 33.1
Minnesota 64 100.0 100.0 21.9 78.1
Mississippi 0 - - - -
Missouri 34 100.0 100.0 79.4 20.6
Montana 10 100.0 100.0 50.0 50.0
Nebraska 81 100.0 98.8 53.1 46.9
Nevada 0 - - - -
New Hampshire 0 - - - -
New Jersey 110 91.8 86.4 1.8 98.2
New Mexico 0 - - - -
New York 4,387 100.0 46.4 86.8 13.2
North Carolina 509 100.0 100.0 92.7 7.3

Dislocated Worker Grants
PY 2019 Illinois State Data Book 257
Received Career Services
Number of Exiters
Basic
Individualized
Only Career Services
Received Training
North Dakota 0 - - - -
Northern Mariana Islands 32 100.0 100.0 90.6 9.4
Ohio 595 75.0 65.2 39.0 37.8
Oklahoma 186 99.5 98.4 10.8 89.2
Oregon 35 100.0 91.4 11.4 88.6
Palau 0 - - - -
Pennsylvania 213 100.0 100.0 2.8 97.2
Puerto Rico - - - - -
Rhode Island 504 100.0 100.0 1.0 99.0
South Carolina 25 100.0 100.0 92.0 8.0
South Dakota 0 - - - -
Tennessee 413 100.0 100.0 48.9 51.1
Texas 1,420 100.0 98.7 58.4 41.6
Utah 0 - - - -
Vermont 1 100.0 100.0 0.0 100.0
Virgin Islands 100 100.0 99.0 59.0 41.0
Virginia 17 100.0 100.0 29.4 70.6
Washington 151 100.0 98.7 24.5 75.5
West Virginia 175 100.0 66.9 62.3 37.7
Wisconsin 156 100.0 99.4 59.0 41.0
Wyoming 3 100.0 100.0 0.0 100.0
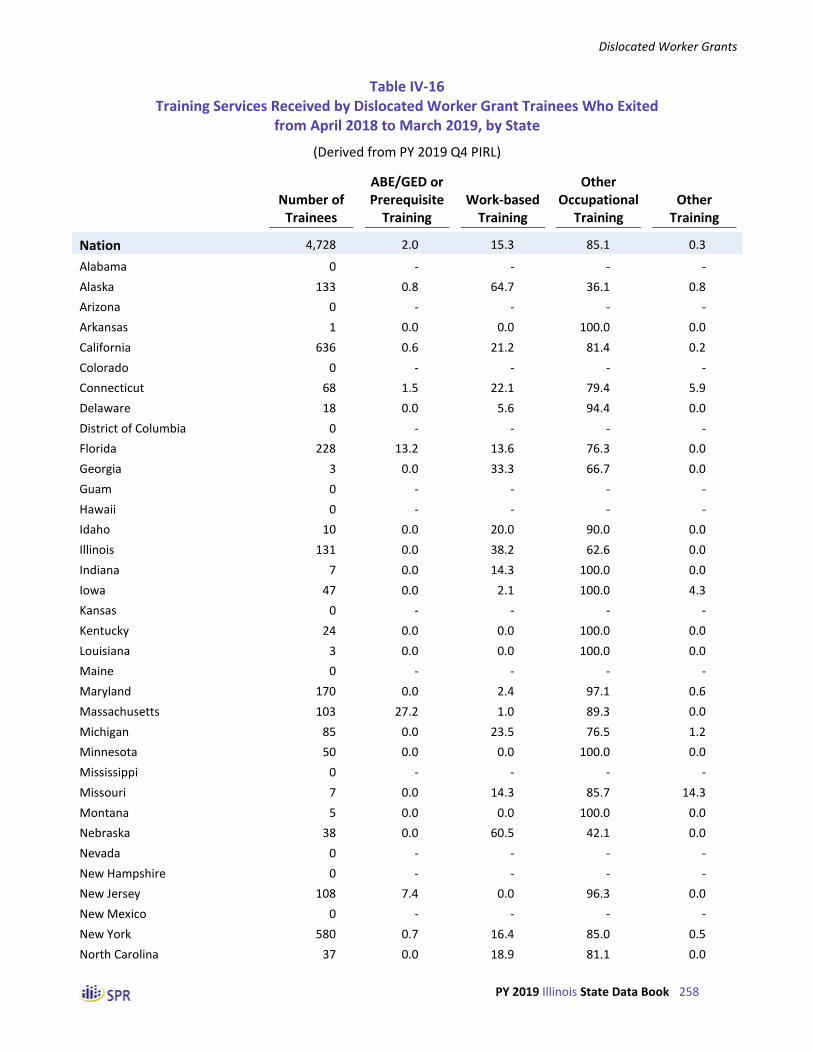
Dislocated Worker Grants
PY 2019 Illinois State Data Book 258
Table IV-16 Training Services Received by Dislocated Worker Grant Trainees Who Exited
from April 2018 to March 2019, by State
(Derived from PY 2019 Q4 PIRL)
Number of
Trainees
ABE/GED or Prerequisite
Training Work-based
Training
Other Occupational
Training Other
Training
Nation 4,728 2.0 15.3 85.1 0.3
Alabama 0 - - - -
Alaska 133 0.8 64.7 36.1 0.8
Arizona 0 - - - -
Arkansas 1 0.0 0.0 100.0 0.0
California 636 0.6 21.2 81.4 0.2
Colorado 0 - - - -
Connecticut 68 1.5 22.1 79.4 5.9
Delaware 18 0.0 5.6 94.4 0.0
District of Columbia 0 - - - -
Florida 228 13.2 13.6 76.3 0.0
Georgia 3 0.0 33.3 66.7 0.0
Guam 0 - - - -
Hawaii 0 - - - -
Idaho 10 0.0 20.0 90.0 0.0
Illinois 131 0.0 38.2 62.6 0.0
Indiana 7 0.0 14.3 100.0 0.0
Iowa 47 0.0 2.1 100.0 4.3
Kansas 0 - - - -
Kentucky 24 0.0 0.0 100.0 0.0
Louisiana 3 0.0 0.0 100.0 0.0
Maine 0 - - - -
Maryland 170 0.0 2.4 97.1 0.6
Massachusetts 103 27.2 1.0 89.3 0.0
Michigan 85 0.0 23.5 76.5 1.2
Minnesota 50 0.0 0.0 100.0 0.0
Mississippi 0 - - - -
Missouri 7 0.0 14.3 85.7 14.3
Montana 5 0.0 0.0 100.0 0.0
Nebraska 38 0.0 60.5 42.1 0.0
Nevada 0 - - - -
New Hampshire 0 - - - -
New Jersey 108 7.4 0.0 96.3 0.0
New Mexico 0 - - - -
New York 580 0.7 16.4 85.0 0.5
North Carolina 37 0.0 18.9 81.1 0.0
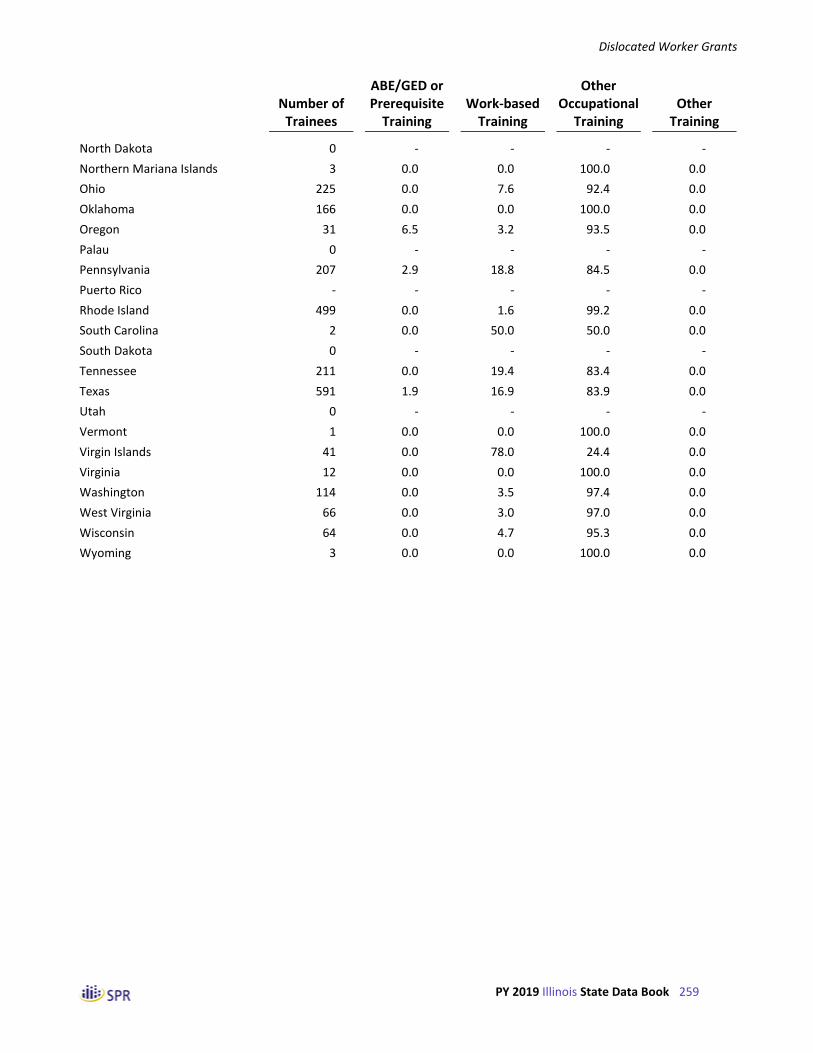
Dislocated Worker Grants
PY 2019 Illinois State Data Book 259
Number of
Trainees
ABE/GED or Prerequisite
Training Work-based
Training
Other Occupational
Training Other
Training
North Dakota 0 - - - -
Northern Mariana Islands 3 0.0 0.0 100.0 0.0
Ohio 225 0.0 7.6 92.4 0.0
Oklahoma 166 0.0 0.0 100.0 0.0
Oregon 31 6.5 3.2 93.5 0.0
Palau 0 - - - -
Pennsylvania 207 2.9 18.8 84.5 0.0
Puerto Rico - - - - -
Rhode Island 499 0.0 1.6 99.2 0.0
South Carolina 2 0.0 50.0 50.0 0.0
South Dakota 0 - - - -
Tennessee 211 0.0 19.4 83.4 0.0
Texas 591 1.9 16.9 83.9 0.0
Utah 0 - - - -
Vermont 1 0.0 0.0 100.0 0.0
Virgin Islands 41 0.0 78.0 24.4 0.0
Virginia 12 0.0 0.0 100.0 0.0
Washington 114 0.0 3.5 97.4 0.0
West Virginia 66 0.0 3.0 97.0 0.0
Wisconsin 64 0.0 4.7 95.3 0.0
Wyoming 3 0.0 0.0 100.0 0.0

Dislocated Worker Grants
PY 2019 Illinois State Data Book 260
Table IV-17 Outcomes of Dislocated Worker Grant Exiters, Comparing Nation to State by DWG Type
(Derived from PY 2019 Q4 PIRL)
All DWG PY 2019
Disaster Recovery PY 2019
Economic Recovery PY 2019
Nation Performance
IL Performance
Nation Performance
IL Performance
Nation Performance
IL Performance
WIOA Core Performance Indicators
Employment 2nd quarter after exit1 70.3 85.4 65.3 100.0 74.3 85.2
Employment 4th quarter after exit2 72.0 79.5 67.9 - 74.2 79.5
Median earnings 2nd quarter after exit1 $7,800 $11,216 $6,760 $14,804 $8,612 $11,168
Credential attainment2 65.8 83.2 65.6 - 65.9 83.2
Measurable skill gains (among participants)3
42.7 48.6 51.8 70.0 37.4 45.9
WIA Common Measures
Entered employment in quarter after exit4
67.8 92.0 65.3 50.0 70.6 92.9
Retention in 2nd and 3rd quarters5 86.0 91.5 82.4 - 88.2 91.5
Average earnings in 2nd and 3rd quarters5
$21,879 $20,538 $18,979 - $23,543 $20,538
1 Measured for a four-quarter exit cohort ending with those who exited four quarters prior to the end of the performance period.
2 Measured for a four-quarter exit cohort ending with those who exited six quarters prior to the end of the performance period.
3 Measured for those who participated during this program year.
4 Measured for a four-quarter exit cohort ending with those who exited three quarters prior to the end of the performance period.
5 Measured for a four-quarter exit cohort ending with those who exited five quarters prior to the end of the performance period.

Dislocated Worker Grants
PY 2019 Illinois State Data Book 261
Table IV-18 Number of Dislocated Worker Grant Exiters Who Achieved Various Outcomes,
Comparing Nation to State by DWG Type
(Derived from PY 2019 Q4 PIRL)
All DWG PY 2019
Disaster Recovery PY 2019
Economic Recovery PY 2019
Nation Performance
IL Performance Nation Performance
IL Performance
Nation Performance
IL Performance
WIOA Core Performance Indicators
Employment 2nd quarter after exit1 9,482 76 3,941 1 5,541 75
Employment 4th quarter after exit2 13,102 105 4,286 - 8,816 105
Credential attainment2 3,607 84 916 - 2,691 84
Measurable skill gains (among participants)3
3,355 87 1,491 14 1,864 73
WIA Common Measures
Entered employment in quarter after exit4
7,395 92 3,694 1 3,701 91
Retention in 2nd and 3rd quarters5 8,972 65 3,271 - 5,701 65
1 Measured for a four-quarter exit cohort ending with those who exited four quarters prior to the end of the performance period.
2 Measured for a four-quarter exit cohort ending with those who exited six quarters prior to the end of the performance period.
3 Measured for those who participated during this program year.
4 Measured for a four-quarter exit cohort ending with those who exited three quarters prior to the end of the performance period.
5 Measured for a four-quarter exit cohort ending with those who exited five quarters prior to the end of the performance period.


Dislocated Worker Grants
PY 2019 Illinois State Data Book 263
Table IV-26 Outcomes of Dislocated Worker Grant Exiters in IL, by Major Service Category
(Derived from PY 2019 Q4 PIRL)
Received Career Services
All Basic Individualized Only Career
Services Received Training
WIOA Core Performance Indicators
Employment 2nd quarter after exit1 85.4 85.4 85.4 100.0 84.5
Employment 4th quarter after exit2 79.5 79.5 79.5 75.0 80.0
Median earnings 2nd quarter after exit1 $11,216 $11,216 $11,216 $7,800 $11,264
Credential attainment2 83.2 83.2 83.2 0.0 83.2
Measurable skill gains (among participants)3
48.6 74.0 74.0 0.0 74.0
WIA Common Measures
Entered employment in quarter after exit4 92.0 92.0 92.0 100.0 90.6
Retention in 2nd and 3rd quarters5 91.5 91.5 91.5 100.0 91.4
Average earnings in 2nd and 3rd quarters5 $20,538 $20,538 $20,538 $4,442 $20,789
1 Measured for a four-quarter exit cohort ending with those who exited four quarters prior to the end of the performance period.
2 Measured for a four-quarter exit cohort ending with those who exited six quarters prior to the end of the performance period.
3 Measured for those who participated during this program year.
4 Measured for a four-quarter exit cohort ending with those who exited three quarters prior to the end of the performance period.
5 Measured for a four-quarter exit cohort ending with those who exited five quarters prior to the end of the performance period.

Dislocated Worker Grants
PY 2019 Illinois State Data Book 264
Table IV-27 WIOA Core Performance Indicators for Dislocated Worker Grant Exiters, by State
(Derived from PY 2019 Q4 PIRL)
2nd Quarter Employment1
4th Quarter Employment2
Median Earnings1
Credential Attainment2
Measurable Skills Gains3
Nation 70.3 72.0 $7,800 65.8 42.7
Alabama 0.0 0.0 - 0.0 0.0
Alaska 84.2 57.1 $9,942 56.5 46.3
Arizona 0.0 0.0 - 0.0 0.0
Arkansas 72.6 59.1 $5,424 83.3 0.0
California 56.2 61.4 $7,209 68.1 42.6
Colorado 0.0 0.0 - 0.0 0.0
Connecticut 81.7 85.1 $10,282 71.2 43.5
Delaware 75.0 74.2 $9,512 40.0 8.7
District of Columbia 0.0 0.0 - 0.0 0.0
Florida 79.0 74.9 $6,210 73.1 32.4
Georgia 81.8 75.0 $6,010 0.0 0.0
Guam 0.0 0.0 - 0.0 0.0
Hawaii 71.4 71.4 $8,000 100.0 0.0
Idaho 89.1 87.9 $7,350 76.1 22.2
Illinois 85.4 79.5 $11,216 83.2 48.6
Indiana 62.5 50.0 $8,474 83.3 33.3
Iowa 87.9 88.0 $9,473 76.3 28.9
Kansas 85.7 89.5 $9,675 0.0 17.3
Kentucky 52.4 62.5 $5,614 75.0 0.0
Louisiana 77.8 75.0 $3,952 66.7 0.0
Maine 0.0 0.0 - 0.0 0.0
Maryland 71.0 69.4 $19,282 34.2 46.6
Massachusetts 69.3 71.2 $8,246 65.2 31.8
Michigan 81.8 76.2 $7,704 77.2 47.3
Minnesota 87.9 87.1 $10,090 83.5 61.2
Mississippi 0.0 0.0 - 0.0 16.7
Missouri 65.5 72.4 $6,548 80.0 62.0
Montana 80.0 50.0 $11,086 42.9 70.0
Nebraska 71.4 87.5 $6,198 40.0 74.3
Nevada 0.0 66.7 - 100.0 0.0
New Hampshire 0.0 74.5 - 96.6 0.0
New Jersey 58.3 60.0 $10,173 52.2 2.4
New Mexico 0.0 0.0 - 0.0 0.0
New York 71.6 72.2 $6,669 63.6 49.6
North Carolina 65.5 69.1 $5,972 57.6 61.1
North Dakota 0.0 0.0 - 0.0 0.0
Northern Mariana Islands 59.1 66.7 $4,362 0.0 0.0
Ohio 65.9 77.4 $7,413 85.3 43.7
Oklahoma 66.7 100.0 $11,435 0.0 44.8
Oregon 64.0 60.6 $8,436 74.1 84.6

Dislocated Worker Grants
PY 2019 Illinois State Data Book 265
2nd Quarter Employment1
4th Quarter Employment2
Median Earnings1
Credential Attainment2
Measurable Skills Gains3
Palau 0.0 0.0 - 0.0 0.0
Pennsylvania 89.1 87.9 $12,950 78.3 32.1
Puerto Rico - - - - -
Rhode Island 72.3 79.7 $8,050 20.7 9.3
South Carolina 83.3 81.8 $8,637 60.0 100.0
South Dakota 0.0 0.0 - 0.0 0.0
Tennessee 91.7 100.0 $11,506 0.0 65.9
Texas 73.1 72.8 $7,990 62.3 59.5
Utah 0.0 0.0 - 0.0 0.0
Vermont 20.0 65.4 $14,906 33.3 0.0
Virgin Islands 48.7 48.9 $6,760 0.0 24.2
Virginia 84.8 86.2 $8,301 70.6 33.3
Washington 69.8 68.3 $11,874 77.1 9.6
West Virginia 80.5 66.7 $9,375 100.0 0.0
Wisconsin 78.6 77.8 $5,811 87.5 58.7
Wyoming 83.3 72.7 $12,844 54.5 77.8
1 Based on those who exited from July 2018 to June 2019.
2 Based on those who exited from January 2018 to December 2018.
3 Based on those who participated between July 2019 and June 2020.

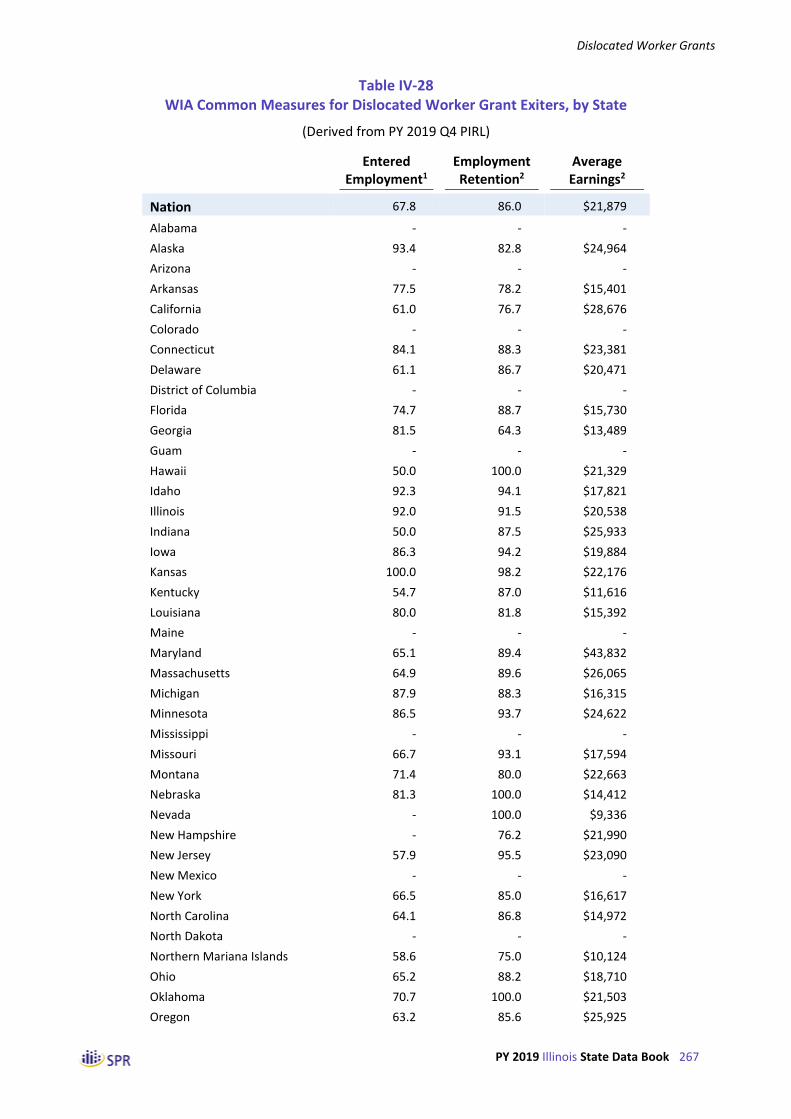
Dislocated Worker Grants
PY 2019 Illinois State Data Book 267
Table IV-28 WIA Common Measures for Dislocated Worker Grant Exiters, by State
(Derived from PY 2019 Q4 PIRL)
Entered Employment1
Employment Retention2
Average Earnings2
Nation 67.8 86.0 $21,879
Alabama - - -
Alaska 93.4 82.8 $24,964
Arizona - - -
Arkansas 77.5 78.2 $15,401
California 61.0 76.7 $28,676
Colorado - - -
Connecticut 84.1 88.3 $23,381
Delaware 61.1 86.7 $20,471
District of Columbia - - -
Florida 74.7 88.7 $15,730
Georgia 81.5 64.3 $13,489
Guam - - -
Hawaii 50.0 100.0 $21,329
Idaho 92.3 94.1 $17,821
Illinois 92.0 91.5 $20,538
Indiana 50.0 87.5 $25,933
Iowa 86.3 94.2 $19,884
Kansas 100.0 98.2 $22,176
Kentucky 54.7 87.0 $11,616
Louisiana 80.0 81.8 $15,392
Maine - - -
Maryland 65.1 89.4 $43,832
Massachusetts 64.9 89.6 $26,065
Michigan 87.9 88.3 $16,315
Minnesota 86.5 93.7 $24,622
Mississippi - - -
Missouri 66.7 93.1 $17,594
Montana 71.4 80.0 $22,663
Nebraska 81.3 100.0 $14,412
Nevada - 100.0 $9,336
New Hampshire - 76.2 $21,990
New Jersey 57.9 95.5 $23,090
New Mexico - - -
New York 66.5 85.0 $16,617
North Carolina 64.1 86.8 $14,972
North Dakota - - -
Northern Mariana Islands 58.6 75.0 $10,124
Ohio 65.2 88.2 $18,710
Oklahoma 70.7 100.0 $21,503
Oregon 63.2 85.6 $25,925

Dislocated Worker Grants
PY 2019 Illinois State Data Book 268
Entered Employment1
Employment Retention2
Average Earnings2
Palau - - -
Pennsylvania 87.2 94.2 $28,847
Puerto Rico - - -
Rhode Island 56.7 89.2 $19,324
South Carolina 41.7 100.0 $15,098
South Dakota - - -
Tennessee 88.6 100.0 $22,163
Texas 68.8 86.1 $21,625
Utah - - -
Vermont 25.0 100.0 $22,446
Virgin Islands 54.1 50.0 $14,760
Virginia 83.9 88.9 $19,317
Washington 67.1 81.4 $28,971
West Virginia 79.0 90.6 $29,189
Wisconsin 80.5 91.7 $16,230
Wyoming 66.7 100.0 $24,750
1 Based on those who exited from October 2018 to September 2019.
2 Based on those who exited from April 2018 to March 2019.

Youth
PY 2019 Illinois State Data Book 269
Part V: Youth Program

Youth
PY 2019 Illinois State Data Book 270
Table V-1 Trends in the Characteristics of Youth Exiters, by Reporting Period
(Derived from WIASRD and PIRL Files)
Nation PY 2017
Nation PY 2018
Nation PY 2019
IL PY 2017
IL PY 2018
IL PY 2019
Number of Exiters
All exiters 81,467 81,365 80,693 3,453 3,964 3,586
Statewide programs 617 824 1,540 16 201 296
Local programs 81,301 80,885 79,539 3,437 3,763 3,290
Age Categories
14 to 15 2.1 1.4 1.8 0.5 0.4 0.4
16 to 17 21.6 20.5 20.0 21.5 20.4 19.4
18 18.7 18.6 19.4 19.4 17.7 19.4
19 to 21 36.0 36.8 36.4 36.1 35.7 35.5
22 to 24 21.7 22.6 22.4 22.5 25.8 25.4
Gender
Females 54.1 53.5 52.8 52.3 54.3 51.6
Males 45.9 46.5 47.2 47.7 45.7 48.4
Race and Ethnicity
Hispanics/Latinos 24.6 25.4 26.9 20.6 22.5 21.6
American Indians/Alaska Natives 3.6 3.5 3.8 0.8 1.4 1.4
Asians 2.8 2.7 2.8 2.1 2.5 2.3
Blacks or African Americans 44.0 43.3 43.4 56.3 54.3 53.9
Native Hawaiians/Pacific Islanders 1.0 1.1 1.2 0.3 0.2 0.6
Whites 53.5 54.6 53.9 42.9 44.9 44.7
More than one race 4.3 4.5 4.4 2.4 2.7 2.7
Employment Status
Employed 15.8 17.9 18.4 22.0 22.3 24.6
Not employed or with layoff notice 84.2 82.1 81.6 78.0 77.7 75.4
Veteran Status
Veterans 0.3 0.3 0.3 0.4 0.6 0.9
Disabled veterans -- -- 0.1 -- -- 0.2
Other eligible persons 0.0 0.0 0.0 0.0 0.0 0.0
Active duty military spouses -- -- 0.1 -- -- 0.0
Unemployment Compensation Status
Claimants referred by RESEA 0.3 0.2 0.3 0.3 0.4 0.7
Claimants referred by WPRS 0.8 0.5 0.3 1.6 1.3 1.0
Claimants not referred 3.1 2.3 2.1 1.5 2.0 2.2
Claimants exempt 0.0 0.0 0.0 0.0 0.0 0.0
Exhaustees 0.4 0.2 0.2 0.2 0.2 0.1
Neither claimants nor exhaustees 95.5 96.7 97.1 96.4 96.1 96.0

Youth
PY 2019 Illinois State Data Book 271
Nation PY 2017
Nation PY 2018
Nation PY 2019
IL PY 2017
IL PY 2018
IL PY 2019
Highest Educational Level
8th grade or less 4.5 4.1 3.5 2.4 2.7 2.2
Some secondary school 47.6 46.5 44.7 44.5 45.3 40.4
Secondary school equivalency 5.7 4.9 4.6 4.1 4.0 4.0
Secondary school graduates 37.3 40.0 42.1 44.3 43.5 48.5
Some postsecondary 3.2 2.8 3.2 3.6 2.7 2.6
Postsecondary certificate or degree 1.6 1.7 1.9 1.1 1.7 2.4
School Status at Participation
In-school 19.7 16.6 17.3 15.7 13.2 14.0
Secondary school or less 16.4 13.9 14.5 15.1 12.8 13.6
Alternative school 1.7 1.3 1.5 0.0 0.1 0.0
Postsecondary school 1.6 1.4 1.4 0.5 0.3 0.3
Not attending 80.3 83.4 82.7 84.3 86.8 86.0
Secondary school dropout 31.6 32.4 29.3 32.6 36.6 30.5
Secondary school graduates or equivalent 46.3 48.0 50.2 51.7 50.3 55.5
Within age of compulsory attendance 2.4 3.0 3.1 0.0 0.0 0.0
Public Assistance Information
Any public assistance 30.8 30.1 26.4 50.2 46.1 35.4
TANF 5.0 4.8 4.1 4.1 2.9 1.7
SSI or SSDI 2.1 2.2 2.1 2.1 1.8 2.0
SNAP 23.6 23.9 20.8 48.0 44.4 33.7
Other public assistance 7.9 7.1 6.3 48.0 44.5 33.7
Other Characteristics
Pregnant or parenting youth 21.4 21.7 19.6 21.9 22.7 19.9
Single parents 14.0 13.7 13.0 11.6 9.7 8.3
Youth who need additional assistance 33.8 31.3 28.6 32.5 27.3 26.7
Foster care youth 3.2 3.9 4.0 0.8 0.4 0.4
Individuals with a disability 15.0 16.1 18.0 18.4 15.1 18.1
Exhausting TANF within 2 years -- -- 0.5 -- -- 2.0
Homeless individuals or runaway youth 6.4 7.2 7.7 4.9 5.5 6.5
Ex-offenders 10.8 11.5 11.1 8.0 6.1 6.4
Low income 81.7 84.1 84.6 66.7 60.8 51.8
English language learners 3.0 3.4 4.0 1.1 0.9 1.8
Basic skills deficient 56.2 57.2 58.2 70.1 69.4 74.6
Facing substantial cultural barrier 1.5 1.8 1.6 0.1 0.5 0.8
Displaced homemakers 0.1 0.1 0.1 0.0 0.0 0.0

Youth
PY 2019 Illinois State Data Book 272
Table V-2 Trends in the Number of Youth Exiters, by Reporting Period
(Derived from WIASRD and PIRL Files)
Nation PY 2017
Nation PY 2018
Nation PY 2019
IL PY 2017
IL PY 2018
IL PY 2019
Number of Exiters
All exiters 81,467 81,365 80,693 3,453 3,964 3,586
Statewide programs 617 824 1,540 16 201 296
Local programs 81,301 80,885 79,539 3,437 3,763 3,290
Age Categories
14 to 15 1,721 1,168 1,418 17 17 13
16 to 17 17,544 16,666 16,119 734 786 676
18 15,176 15,107 15,584 661 682 676
19 to 21 29,258 29,841 29,309 1,231 1,377 1,240
22 to 24 17,611 18,351 18,064 766 997 885
Gender
Females 43,684 43,222 42,301 1,804 2,151 1,846
Males 37,114 37,497 37,868 1,644 1,809 1,729
Race and Ethnicity
Hispanics/Latinos 19,257 20,031 21,046 713 893 774
American Indians/Alaska Natives 2,433 2,364 2,499 26 48 45
Asians 1,863 1,823 1,873 65 86 72
Blacks or African Americans 29,662 29,230 28,789 1,728 1,878 1,701
Native Hawaiians/Pacific Islanders 688 740 782 9 * 18
Whites 36,058 36,804 35,726 1,317 1,555 1,410
More than one race 2,928 3,055 2,937 74 95 84
Employment Status
Employed 12,903 14,582 14,842 758 885 882
Not employed or with layoff notice 68,564 66,783 65,851 2,695 3,079 2,704
Veteran Status
Veterans 213 227 272 14 22 34
Disabled veterans -- -- 46 -- -- *
Other eligible persons 25 23 16 0 0 0
Active duty military spouses -- -- 113 -- -- 0
Unemployment Compensation Status
Claimants referred by RESEA 204 189 278 9 16 25
Claimants referred by WPRS 618 388 255 56 50 36
Claimants not referred 2,544 1,880 1,681 53 79 79
Claimants exempt 30 36 29 0 0 *
Exhaustees 290 181 137 * 9 *
Neither claimants nor exhaustees 77,781 78,691 78,313 3,329 3,810 3,442

Youth
PY 2019 Illinois State Data Book 273
Nation PY 2017
Nation PY 2018
Nation PY 2019
IL PY 2017
IL PY 2018
IL PY 2019
Highest Educational Level
8th grade or less 3,662 3,348 2,859 82 107 79
Some secondary school 38,817 37,836 36,089 1,537 1,797 1,448
Secondary school equivalency 4,660 3,996 3,696 143 159 142
Secondary school graduates 30,410 32,580 33,944 1,530 1,724 1,738
Some postsecondary 2,602 2,241 2,551 123 108 93
Postsecondary certificate or degree 1,316 1,364 1,554 38 69 86
School Status at Participation
In-school 16,017 13,486 13,973 542 522 501
Secondary school or less 13,373 11,320 11,670 523 509 489
Alternative school 1,361 1,064 1,178 * * *
Postsecondary school 1,283 1,102 1,125 18 11 11
Not attending 65,394 67,809 66,714 2,911 3,442 3,085
Secondary school dropout 25,760 26,372 23,677 1,125 1,449 1,094
Secondary school graduates or equivalent 37,672 39,008 40,539 1,786 1,993 1,991
Within age of compulsory attendance 1,962 2,429 2,498 0 0 0
Public Assistance Information
Any public assistance 25,063 24,452 21,274 1,734 1,827 1,268
TANF 4,106 3,921 3,296 142 116 61
SSI or SSDI 1,716 1,808 1,699 71 71 70
SNAP 19,260 19,423 16,802 1,659 1,761 1,208
Other public assistance 6,422 5,779 5,056 1,659 1,762 1,210
Other Characteristics
Pregnant or parenting youth 17,170 17,507 15,735 756 901 712
Single parents 10,735 10,800 10,278 400 382 296
Youth who need additional assistance 27,562 25,455 23,081 1,123 1,082 959
Foster care youth 2,638 3,158 3,227 26 17 16
Individuals with a disability 11,656 12,627 13,933 634 597 650
Exhausting TANF within 2 years -- -- 299 -- -- *
Homeless individuals or runaway youth 5,215 5,844 6,207 169 217 234
Ex-offenders 8,399 9,043 8,595 276 241 229
Low income 66,553 68,463 68,289 2,304 2,412 1,859
English language learners 2,482 2,806 3,240 38 35 66
Basic skills deficient 45,766 46,557 46,952 2,419 2,751 2,675
Facing substantial cultural barrier 830 1,119 1,026 * 20 29
Displaced homemakers 81 94 93 0 * 0
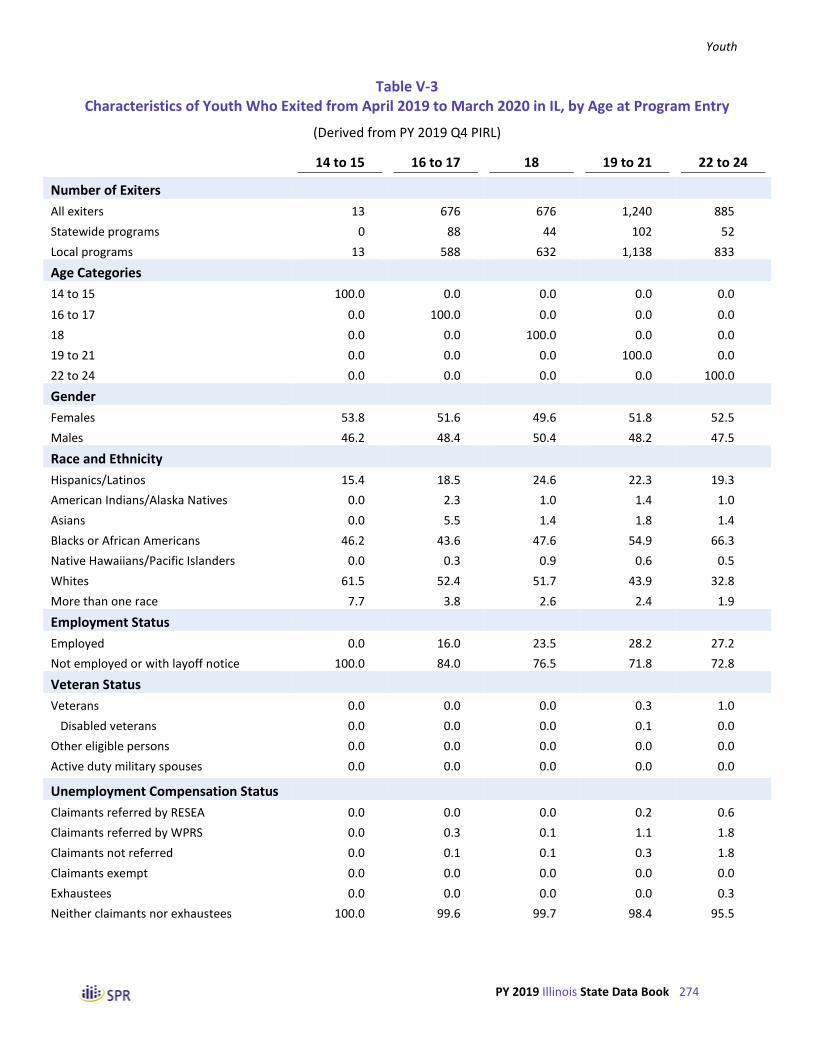
Youth
PY 2019 Illinois State Data Book 274
Table V-3 Characteristics of Youth Who Exited from April 2019 to March 2020 in IL, by Age at Program Entry
(Derived from PY 2019 Q4 PIRL)
14 to 15 16 to 17 18 19 to 21 22 to 24
Number of Exiters
All exiters 13 676 676 1,240 885
Statewide programs 0 88 44 102 52
Local programs 13 588 632 1,138 833
Age Categories
14 to 15 100.0 0.0 0.0 0.0 0.0
16 to 17 0.0 100.0 0.0 0.0 0.0
18 0.0 0.0 100.0 0.0 0.0
19 to 21 0.0 0.0 0.0 100.0 0.0
22 to 24 0.0 0.0 0.0 0.0 100.0
Gender
Females 53.8 51.6 49.6 51.8 52.5
Males 46.2 48.4 50.4 48.2 47.5
Race and Ethnicity
Hispanics/Latinos 15.4 18.5 24.6 22.3 19.3
American Indians/Alaska Natives 0.0 2.3 1.0 1.4 1.0
Asians 0.0 5.5 1.4 1.8 1.4
Blacks or African Americans 46.2 43.6 47.6 54.9 66.3
Native Hawaiians/Pacific Islanders 0.0 0.3 0.9 0.6 0.5
Whites 61.5 52.4 51.7 43.9 32.8
More than one race 7.7 3.8 2.6 2.4 1.9
Employment Status
Employed 0.0 16.0 23.5 28.2 27.2
Not employed or with layoff notice 100.0 84.0 76.5 71.8 72.8
Veteran Status
Veterans 0.0 0.0 0.0 0.3 1.0
Disabled veterans 0.0 0.0 0.0 0.1 0.0
Other eligible persons 0.0 0.0 0.0 0.0 0.0
Active duty military spouses 0.0 0.0 0.0 0.0 0.0
Unemployment Compensation Status
Claimants referred by RESEA 0.0 0.0 0.0 0.2 0.6
Claimants referred by WPRS 0.0 0.3 0.1 1.1 1.8
Claimants not referred 0.0 0.1 0.1 0.3 1.8
Claimants exempt 0.0 0.0 0.0 0.0 0.0
Exhaustees 0.0 0.0 0.0 0.0 0.3
Neither claimants nor exhaustees 100.0 99.6 99.7 98.4 95.5
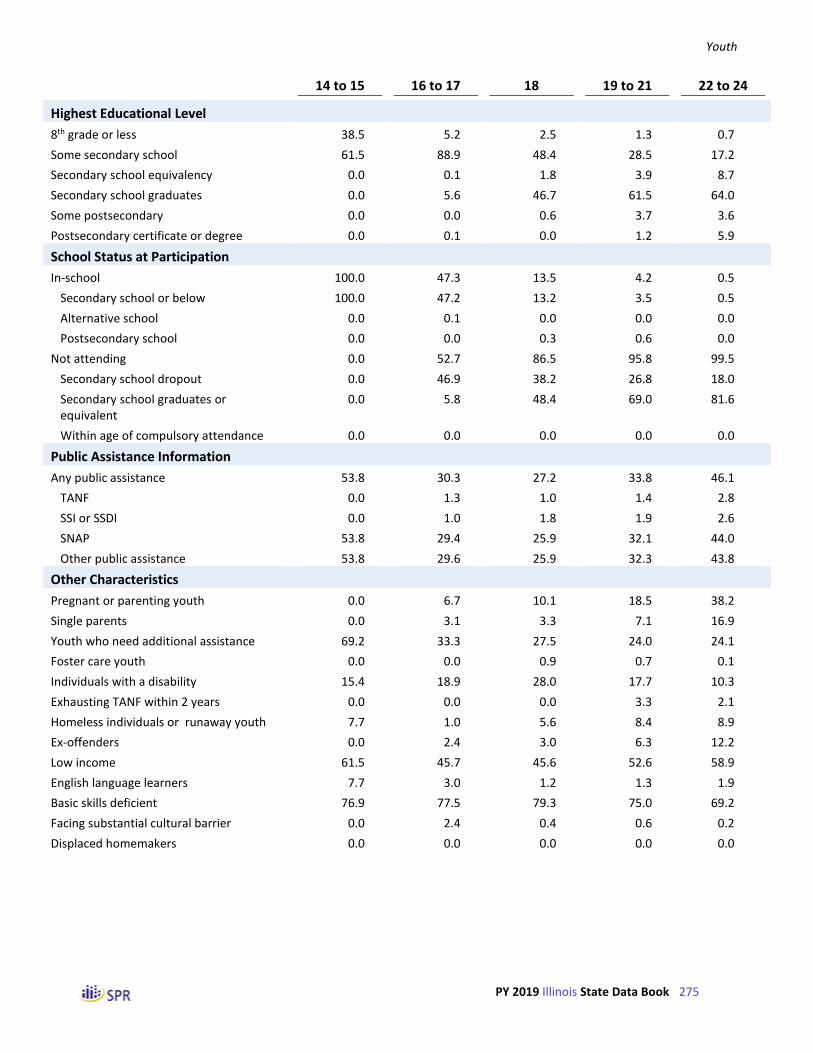
Youth
PY 2019 Illinois State Data Book 275
14 to 15 16 to 17 18 19 to 21 22 to 24
Highest Educational Level
8th grade or less 38.5 5.2 2.5 1.3 0.7
Some secondary school 61.5 88.9 48.4 28.5 17.2
Secondary school equivalency 0.0 0.1 1.8 3.9 8.7
Secondary school graduates 0.0 5.6 46.7 61.5 64.0
Some postsecondary 0.0 0.0 0.6 3.7 3.6
Postsecondary certificate or degree 0.0 0.1 0.0 1.2 5.9
School Status at Participation
In-school 100.0 47.3 13.5 4.2 0.5
Secondary school or below 100.0 47.2 13.2 3.5 0.5
Alternative school 0.0 0.1 0.0 0.0 0.0
Postsecondary school 0.0 0.0 0.3 0.6 0.0
Not attending 0.0 52.7 86.5 95.8 99.5
Secondary school dropout 0.0 46.9 38.2 26.8 18.0
Secondary school graduates or equivalent
0.0 5.8 48.4 69.0 81.6
Within age of compulsory attendance 0.0 0.0 0.0 0.0 0.0
Public Assistance Information
Any public assistance 53.8 30.3 27.2 33.8 46.1
TANF 0.0 1.3 1.0 1.4 2.8
SSI or SSDI 0.0 1.0 1.8 1.9 2.6
SNAP 53.8 29.4 25.9 32.1 44.0
Other public assistance 53.8 29.6 25.9 32.3 43.8
Other Characteristics
Pregnant or parenting youth 0.0 6.7 10.1 18.5 38.2
Single parents 0.0 3.1 3.3 7.1 16.9
Youth who need additional assistance 69.2 33.3 27.5 24.0 24.1
Foster care youth 0.0 0.0 0.9 0.7 0.1
Individuals with a disability 15.4 18.9 28.0 17.7 10.3
Exhausting TANF within 2 years 0.0 0.0 0.0 3.3 2.1
Homeless individuals or runaway youth 7.7 1.0 5.6 8.4 8.9
Ex-offenders 0.0 2.4 3.0 6.3 12.2
Low income 61.5 45.7 45.6 52.6 58.9
English language learners 7.7 3.0 1.2 1.3 1.9
Basic skills deficient 76.9 77.5 79.3 75.0 69.2
Facing substantial cultural barrier 0.0 2.4 0.4 0.6 0.2
Displaced homemakers 0.0 0.0 0.0 0.0 0.0

Youth
PY 2019 Illinois State Data Book 276
Table V-4 Characteristics of Youth Who Exited from April 2019 to March 2020 in IL, by Ethnicity and Race
(Derived from PY 2019 Q4 PIRL)
Ethnicity Race
Hispanic Not Hispanic White Only Black Only Other
Number of Exiters
All exiters 774 2,812 1,345 1,634 178
Statewide programs 44 252 50 204 20
Local programs 730 2,560 1,295 1,430 158
Age Categories
14 to 15 0.3 0.4 0.5 0.3 0.6
16 to 17 16.9 20.0 22.9 15.1 36.0
18 22.4 18.6 22.1 16.5 15.7
19 to 21 37.4 35.0 35.3 36.0 28.5
22 to 24 23.1 26.0 19.2 32.1 19.2
Gender
Females 50.3 52.0 50.5 54.0 48.9
Males 49.7 48.0 49.5 46.0 51.1
Race and Ethnicity
Hispanics/Latinos 100.0 0.0 26.2 2.5 14.0
American Indians/Alaska Natives 3.3 1.1 0.0 0.0 25.3
Asians 0.5 2.6 0.0 0.0 40.4
Blacks or African Americans 12.0 60.3 0.0 100.0 37.6
Native Hawaiians/Pacific Islanders 1.0 0.5 0.0 0.0 10.1
Whites 86.8 38.2 100.0 0.0 36.5
More than one race 2.9 2.6 0.0 0.0 47.2
Employment Status
Employed 27.6 23.8 31.2 18.8 24.2
Not employed or with layoff notice 72.4 76.2 68.8 81.2 75.8
Veteran Status
Veterans 1.7 0.7 1.0 0.8 2.2
Disabled veterans 0.4 0.1 0.2 0.1 0.6
Other eligible persons 0.0 0.0 0.0 0.0 0.0
Active duty military spouses 0.0 0.0 0.0 0.0 0.0
Unemployment Compensation Status
Claimants referred by RESEA 0.5 0.7 1.1 0.4 1.1
Claimants referred by WPRS 1.7 0.8 0.9 1.3 0.0
Claimants not referred 3.7 1.8 3.1 1.8 3.9
Claimants exempt 0.0 0.0 0.0 0.1 0.0
Exhaustees 0.0 0.1 0.1 0.1 0.0
Neither claimants nor exhaustees 94.1 96.5 94.8 96.2 94.9

Youth
PY 2019 Illinois State Data Book 277
Ethnicity Race
Hispanic Not Hispanic White Only Black Only Other
Highest Educational Level
8th grade or less 2.5 2.1 3.8 1.0 1.7
Some secondary school 35.4 41.7 51.2 30.6 55.6
Secondary school equivalency 4.4 3.8 3.3 4.5 3.4
Secondary school graduates 54.0 46.9 36.5 58.4 34.3
Some postsecondary 1.7 2.8 2.9 2.8 1.7
Postsecondary certificate or degree 2.1 2.5 2.3 2.7 3.4
School Status at Participation
In-school 9.6 15.2 14.0 13.6 34.3
Secondary school or below 9.2 14.9 13.5 13.5 33.7
Alternative school 0.0 0.0 0.0 0.1 0.0
Postsecondary school 0.4 0.3 0.4 0.1 0.6
Not attending 90.4 84.8 86.0 86.4 65.7
Secondary school dropout 31.0 30.4 43.9 19.2 27.0
Secondary school graduates or equivalent
59.4 54.4 42.1 67.2 38.8
Within age of compulsory attendance 0.0 0.0 0.0 0.0 0.0
Public Assistance Information
Any public assistance 26.5 37.8 31.2 42.5 34.3
TANF 0.8 2.0 0.8 2.7 2.2
SSI or SSDI 1.8 2.0 3.0 1.3 0.6
SNAP 25.3 36.0 28.6 41.2 33.7
Other public assistance 25.6 36.0 28.7 41.2 33.7
Other Characteristics
Pregnant or parenting youth 19.8 19.9 18.2 22.6 12.9
Single parents 7.1 8.6 8.6 8.6 9.1
Youth who need additional assistance 21.4 28.2 28.8 26.5 32.6
Foster care youth 0.1 0.5 0.7 0.4 0.0
Individuals with a disability 19.1 17.9 26.5 10.7 19.1
Exhausting TANF within 2 years 0.0 2.5 4.2 1.1 0.0
Homeless individuals or runaway youth 7.0 6.4 4.5 8.0 5.1
Ex-offenders 5.2 6.7 6.5 6.6 6.7
Low income 46.8 53.2 50.3 55.0 54.5
English language learners 4.3 1.2 1.6 0.4 10.7
Basic skills deficient 78.3 73.6 71.2 75.4 80.3
Facing substantial cultural barrier 1.4 0.6 0.3 1.0 0.6
Displaced homemakers 0.0 0.0 0.0 0.0 0.0

Youth
PY 2019 Illinois State Data Book 278
Table V-5 Characteristics of Youth Who Exited from April 2019 to March 2020 in IL,
by Gender, Employment Status, and Disability Status
(Derived from PY 2019 Q4 PIRL)
Gender Employment Status Has a
Female Male Employed Not Employed Disability
Number of Exiters
All exiters 1,846 1,729 882 2,704 650
Statewide programs 116 180 48 248 21
Local programs 1,730 1,549 834 2,456 629
Age Categories
14 to 15 0.4 0.4 0.0 0.5 0.3
16 to 17 19.4 19.3 12.6 21.6 20.3
18 18.7 20.2 18.5 19.6 30.0
19 to 21 35.7 35.3 40.8 33.8 34.9
22 to 24 25.8 24.9 28.1 24.5 14.4
Gender
Females 100.0 0.0 62.0 48.3 41.4
Males 0.0 100.0 38.0 51.7 58.6
Race and Ethnicity
Hispanics/Latinos 21.1 22.2 24.3 20.7 22.8
American Indians/Alaska Natives 0.9 2.1 1.4 1.4 1.2
Asians 2.1 2.5 1.4 2.6 2.8
Blacks or African Americans 55.7 51.8 42.5 57.6 32.2
Native Hawaiians/Pacific Islanders 0.5 0.6 0.6 0.5 0.7
Whites 43.6 45.9 57.5 40.5 65.3
More than one race 2.7 2.7 3.4 2.4 2.1
Employment Status
Employed 29.5 19.3 100.0 0.0 18.8
Not employed or with layoff notice 70.5 80.7 0.0 100.0 81.2
Veteran Status
Veterans 0.9 1.0 1.2 0.9 1.4
Disabled veterans 0.2 0.2 0.2 0.1 0.9
Other eligible persons 0.0 0.0 0.0 0.0 0.0
Active duty military spouses 0.0 0.0 0.0 0.0 0.0
Unemployment Compensation Status
Claimants referred by RESEA 0.9 0.5 1.1 0.6 0.9
Claimants referred by WPRS 1.1 0.9 0.7 1.1 0.8
Claimants not referred 2.1 2.3 1.7 2.4 1.5
Claimants exempt 0.1 0.0 0.1 0.0 0.0
Exhaustees 0.1 0.1 0.0 0.1 0.0
Neither claimants nor exhaustees 95.8 96.1 96.4 95.9 96.8

Youth
PY 2019 Illinois State Data Book 279
Gender Employment Status Has a
Female Male Employed Not Employed Disability
Highest Educational Level
8th grade or less 2.2 2.2 1.7 2.4 1.2
Some secondary school 38.9 42.1 34.0 42.5 36.5
Secondary school equivalency 4.0 3.9 4.0 4.0 1.8
Secondary school graduates 48.9 47.9 52.7 47.1 55.1
Some postsecondary 3.3 1.9 4.0 2.1 3.2
Postsecondary certificate or degree 2.8 2.0 3.6 2.0 2.2
School Status at Participation
In-school 14.3 13.6 7.6 16.1 26.2
Secondary school or below 13.8 13.5 6.8 15.9 25.7
Alternative school 0.0 0.1 0.1 0.0 0.0
Postsecondary school 0.5 0.1 0.7 0.2 0.5
Not attending 85.7 86.4 92.4 83.9 73.8
Secondary school dropout 29.0 32.2 30.0 30.7 14.6
Secondary school graduates or equivalent
56.7 54.1 62.4 53.3 59.2
Within age of compulsory attendance 0.0 0.0 0.0 0.0 0.0
Public Assistance Information
Any public assistance 44.0 26.1 39.9 33.9 20.9
TANF 2.7 0.6 1.1 1.9 0.5
SSI or SSDI 2.0 2.0 1.2 2.2 8.0
SNAP 42.6 24.1 38.4 32.1 14.9
Other public assistance 42.6 24.2 38.7 32.1 14.9
Other Characteristics
Pregnant or parenting youth 32.5 6.3 25.5 18.0 5.5
Single parents 13.9 2.2 14.5 6.2 3.1
Youth who need additional assistance 29.0 24.2 30.3 25.6 20.2
Foster care youth 0.2 0.8 0.7 0.4 0.8
Individuals with a disability 14.5 22.0 13.8 19.5 100.0
Exhausting TANF within 2 years 3.2 0.0 3.6 1.6 5.9
Homeless individuals or runaway youth 6.2 6.8 5.6 6.8 1.5
Ex-offenders 3.5 9.5 7.3 6.1 2.0
Low income 58.5 44.8 58.3 49.7 43.5
English language learners 2.1 1.6 2.2 1.7 1.8
Basic skills deficient 73.6 75.5 70.1 76.1 77.5
Facing substantial cultural barrier 0.8 0.8 0.5 0.9 1.2
Displaced homemakers 0.0 0.0 0.0 0.0 0.0

Youth
PY 2019 Illinois State Data Book 280
Table V-6 Characteristics of In-School Youth Who Exited from April 2019 to March 2020 in IL,
by Highest Educational Level for In-School Youth
(Derived from PY 2019 Q4 PIRL)
In-School Youth
All In-School Youth
Secondary School or Less
Alternative School
Postsecondary School
Number of Exiters
All exiters 501 489 * 11
Statewide programs 82 82 * 0
Local programs 419 407 * 11
Age Categories
14 to 15 2.7 2.8 * 0.0
16 to 17 66.7 68.0 * 0.0
18 19.0 19.0 * 20.0
19 to 21 10.8 9.4 * 80.0
22 to 24 0.8 0.9 * 0.0
Gender
Females 52.8 52.3 * 81.8
Males 47.2 47.7 * 18.2
Race and Ethnicity
Hispanics/Latinos 14.8 14.5 * 27.3
American Indians/Alaska Natives 3.0 2.8 * 11.1
Asians 6.8 6.9 * 0.0
Blacks or African Americans 51.5 51.9 * 22.2
Native Hawaiians/Pacific Islanders 0.4 0.4 * 0.0
Whites 43.4 43.1 * 66.7
More than one race 4.7 4.8 * 0.0
Employment Status
Employed 13.4 12.3 * 54.5
Not employed or with layoff notice 86.6 87.7 * 45.5
Veteran Status
Veterans 1.4 1.4 * 0.0
Disabled veterans 0.6 0.6 * 0.0
Other eligible persons 0.0 0.0 * 0.0
Active duty military spouses 0.0 0.0 * 0.0
Unemployment Compensation Status
Claimants referred by RESEA 0.6 0.6 * 0.0
Claimants referred by WPRS 0.6 0.4 * 9.1
Claimants not referred 3.8 3.5 * 9.1
Claimants exempt 0.0 0.0 * 0.0
Exhaustees 0.0 0.0 * 0.0

Youth
PY 2019 Illinois State Data Book 281
In-School Youth
All In-School Youth
Secondary School or Less
Alternative School
Postsecondary School
Neither claimants nor exhaustees 95.0 95.5 * 81.8
Highest Educational Level
8th grade or less 1.2 1.2 * 0.0
Some secondary school 91.8 93.9 * 0.0
Secondary school equivalency 0.8 0.6 * 9.1
Secondary school graduates 2.4 1.4 * 45.5
Some postsecondary 1.6 0.8 * 36.4
Postsecondary certificate or degree 2.2 2.0 * 9.1
School Status at Participation
In-school 100.0 100.0 * 100.0
Secondary school or below 97.6 100.0 * 0.0
Alternative school 0.2 0.0 * 0.0
Postsecondary school 2.2 0.0 * 100.0
Not attending 0.0 0.0 * 0.0
Secondary school dropout 0.0 0.0 * 0.0
Secondary school graduates or equivalent
0.0 0.0 * 0.0
Within age of compulsory attendance 0.0 0.0 * 0.0
Public Assistance Information
Any public assistance 27.9 27.8 * 36.4
TANF 1.0 1.0 * 0.0
SSI or SSDI 2.0 2.0 * 0.0
SNAP 26.3 26.2 * 36.4
Other public assistance 26.3 26.2 * 36.4
Other Characteristics
Pregnant or parenting youth 5.0 4.3 * 36.4
Single parents 3.4 2.9 * 27.3
Youth who need additional assistance 38.9 39.3 * 27.3
Foster care youth 0.2 0.2 * 0.0
Individuals with a disability 33.9 34.2 * 27.3
Exhausting TANF within 2 years 0.0 0.0 * 0.0
Homeless individuals or runaway youth 3.2 3.1 * 9.1
Ex-offenders 0.6 0.6 * 0.0
Low income 50.9 50.5 * 72.7
English language learners 4.8 4.9 * 0.0
Basic skills deficient 78.8 79.8 * 45.5
Facing substantial cultural barrier 3.6 3.7 * 0.0
Displaced homemakers 0.0 0.0 * 0.0

Youth
PY 2019 Illinois State Data Book 282
Table V-7 Characteristics of Out-of-School Youth Who Exited from April 2019 to March 2020 in IL,
by Highest Educational Level for Out-of-School Youth
(Derived from PY 2019 Q4 PIRL)
Out-of-School Youth
All Out-of-School Youth
Secondary School Dropout
Secondary School graduates or Equivalent
Within Compulsory
Age
Number of Exiters
All exiters 3,085 1,094 1,991 *
Statewide programs 214 63 151 *
Local programs 2,871 1,031 1,840 *
Age Categories
14 to 15 0.0 0.0 0.0 *
16 to 17 11.8 29.7 2.0 *
18 19.4 24.2 16.8 *
19 to 21 39.5 31.1 44.0 *
22 to 24 29.3 14.9 37.1 *
Gender
Females 51.4 49.0 52.8 *
Males 48.6 51.0 47.2 *
Race and Ethnicity
Hispanics/Latinos 22.7 21.9 23.1 *
American Indians/Alaska Natives 1.2 1.6 0.9 *
Asians 1.5 0.9 1.8 *
Blacks or African Americans 54.3 35.5 64.6 *
Native Hawaiians/Pacific Islanders 0.6 0.5 0.6 *
Whites 44.9 65.2 33.7 *
More than one race 2.3 3.7 1.6 *
Employment Status
Employed 26.4 24.2 27.6 *
Not employed or with layoff notice 73.6 75.8 72.4 *
Veteran Status
Veterans 0.9 0.5 1.1 *
Disabled veterans 0.1 0.2 0.1 *
Other eligible persons 0.0 0.0 0.0 *
Active duty military spouses 0.0 0.0 0.0 *
Unemployment Compensation Status
Claimants referred by RESEA 0.7 0.6 0.8 *
Claimants referred by WPRS 1.1 0.9 1.2 *
Claimants not referred 1.9 2.2 1.8 *
Claimants exempt 0.0 0.0 0.1 *

Youth
PY 2019 Illinois State Data Book 283
Out-of-School Youth
All Out-of-School Youth
Secondary School Dropout
Secondary School graduates or Equivalent
Within Compulsory
Age
Exhaustees 0.1 0.0 0.2 *
Neither claimants nor exhaustees 96.1 96.3 96.1 *
Highest Educational Level
8th grade or less 2.4 6.7 0.0 *
Some secondary school 32.0 90.3 0.0 *
Secondary school equivalency 4.5 0.2 6.8 *
Secondary school graduates 55.9 1.3 86.0 *
Some postsecondary 2.8 0.5 4.0 *
Postsecondary certificate or degree 2.4 1.1 3.2 *
School Status at Participation
In-school 0.0 0.0 0.0 *
Secondary school or below 0.0 0.0 0.0 *
Alternative school 0.0 0.0 0.0 *
Postsecondary school 0.0 0.0 0.0 *
Not attending 100.0 100.0 100.0 *
Secondary school dropout 35.5 100.0 0.0 *
Secondary school graduates or equivalent
64.5 0.0 100.0 *
Within age of compulsory attendance 0.0 0.0 0.0 *
Public Assistance Information
Any public assistance 36.6 33.8 38.1 *
TANF 1.8 1.9 1.8 *
SSI or SSDI 1.9 1.6 2.1 *
SNAP 34.9 32.5 36.2 *
Other public assistance 34.9 32.8 36.1 *
Other Characteristics
Pregnant or parenting youth 22.3 21.0 23.0 *
Single parents 9.1 8.7 9.3 *
Youth who need additional assistance 24.8 20.7 27.0 *
Foster care youth 0.5 0.4 0.6 *
Individuals with a disability 15.6 8.7 19.3 *
Exhausting TANF within 2 years 2.3 0.0 3.5 *
Homeless individuals or runaway youth 7.1 4.0 8.7 *
Ex-offenders 7.3 8.4 6.7 *
Low income 52.0 43.4 56.7 *
English language learners 1.4 0.4 1.9 *
Basic skills deficient 73.9 78.7 71.3 *
Facing substantial cultural barrier 0.4 0.2 0.5 *
Displaced homemakers 0.0 0.0 0.0 *
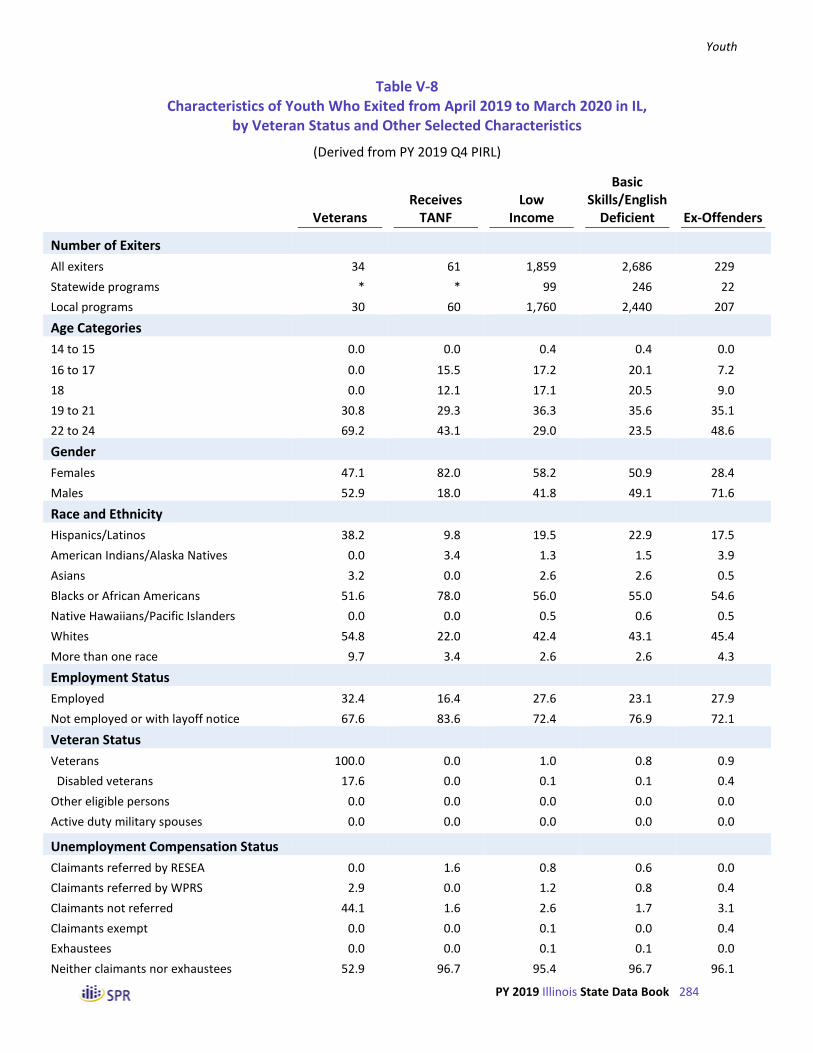
Youth
PY 2019 Illinois State Data Book 284
Table V-8 Characteristics of Youth Who Exited from April 2019 to March 2020 in IL,
by Veteran Status and Other Selected Characteristics
(Derived from PY 2019 Q4 PIRL)
Veterans Receives
TANF Low
Income
Basic Skills/English
Deficient Ex-Offenders
Number of Exiters
All exiters 34 61 1,859 2,686 229
Statewide programs * * 99 246 22
Local programs 30 60 1,760 2,440 207
Age Categories
14 to 15 0.0 0.0 0.4 0.4 0.0
16 to 17 0.0 15.5 17.2 20.1 7.2
18 0.0 12.1 17.1 20.5 9.0
19 to 21 30.8 29.3 36.3 35.6 35.1
22 to 24 69.2 43.1 29.0 23.5 48.6
Gender
Females 47.1 82.0 58.2 50.9 28.4
Males 52.9 18.0 41.8 49.1 71.6
Race and Ethnicity
Hispanics/Latinos 38.2 9.8 19.5 22.9 17.5
American Indians/Alaska Natives 0.0 3.4 1.3 1.5 3.9
Asians 3.2 0.0 2.6 2.6 0.5
Blacks or African Americans 51.6 78.0 56.0 55.0 54.6
Native Hawaiians/Pacific Islanders 0.0 0.0 0.5 0.6 0.5
Whites 54.8 22.0 42.4 43.1 45.4
More than one race 9.7 3.4 2.6 2.6 4.3
Employment Status
Employed 32.4 16.4 27.6 23.1 27.9
Not employed or with layoff notice 67.6 83.6 72.4 76.9 72.1
Veteran Status
Veterans 100.0 0.0 1.0 0.8 0.9
Disabled veterans 17.6 0.0 0.1 0.1 0.4
Other eligible persons 0.0 0.0 0.0 0.0 0.0
Active duty military spouses 0.0 0.0 0.0 0.0 0.0
Unemployment Compensation Status
Claimants referred by RESEA 0.0 1.6 0.8 0.6 0.0
Claimants referred by WPRS 2.9 0.0 1.2 0.8 0.4
Claimants not referred 44.1 1.6 2.6 1.7 3.1
Claimants exempt 0.0 0.0 0.1 0.0 0.4
Exhaustees 0.0 0.0 0.1 0.1 0.0
Neither claimants nor exhaustees 52.9 96.7 95.4 96.7 96.1

Youth
PY 2019 Illinois State Data Book 285
Veterans Receives
TANF Low
Income
Basic Skills/English
Deficient Ex-Offenders
Highest Educational Level
8th grade or less 0.0 0.0 1.6 2.6 3.1
Some secondary school 0.0 41.0 35.8 42.4 37.6
Secondary school equivalency 2.9 4.9 4.5 3.4 9.2
Secondary school graduates 67.6 44.3 51.9 47.9 46.3
Some postsecondary 11.8 0.0 3.5 1.7 1.3
Postsecondary certificate or degree 17.6 9.8 2.8 2.0 2.6
School Attendance
In-school 20.6 8.2 13.7 14.7 1.3
Secondary school or below 20.6 8.2 13.3 14.6 1.3
Alternative school 0.0 0.0 0.0 0.0 0.0
Postsecondary school 0.0 0.0 0.4 0.2 0.0
Not attending 79.4 91.8 86.3 85.3 98.7
Secondary school dropout 14.7 34.4 25.6 32.1 40.2
Secondary school graduates or equivalent
64.7 57.4 60.7 53.2 58.5
Within age of compulsory attendance 0.0 0.0 0.0 0.0 0.0
Public Assistance Information
Any public assistance 32.4 100.0 68.2 34.1 38.4
TANF 0.0 100.0 3.3 1.4 1.3
SSI or SSDI 5.9 0.0 3.7 2.0 0.9
SNAP 29.4 86.9 65.0 32.5 38.0
Other public assistance 29.4 85.2 65.1 32.5 37.6
Other Characteristics
Pregnant or parenting youth 29.4 67.2 24.7 18.1 24.9
Single parents 17.6 24.6 10.9 7.7 14.0
Youth who need additional assistance 32.4 37.7 30.6 22.9 18.3
Foster care youth 0.0 0.0 0.9 0.4 0.4
Individuals with a disability 26.5 4.9 15.2 18.8 5.7
Exhausting TANF within 2 years 0.0 3.3 1.8 1.1 0.0
Homeless individuals or runaway youth 5.9 14.8 12.5 6.2 7.0
Ex-offenders 5.9 4.9 5.8 5.9 100.0
Low income 52.9 100.0 100.0 50.5 47.2
English language learners 0.0 0.0 2.5 2.5 0.4
Basic skills deficient 61.8 62.3 72.4 99.6 69.0
Facing substantial cultural barrier 0.0 0.0 0.4 1.0 0.0
Displaced homemakers 0.0 0.0 0.0 0.0 0.0
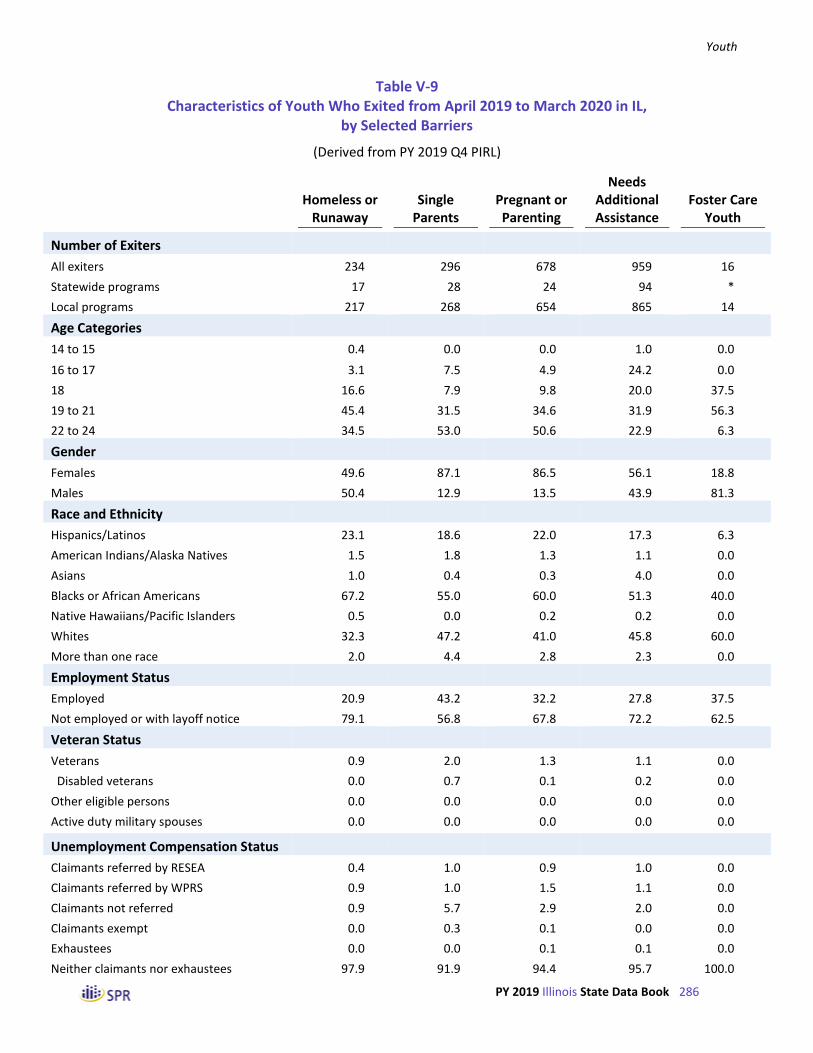
Youth
PY 2019 Illinois State Data Book 286
Table V-9 Characteristics of Youth Who Exited from April 2019 to March 2020 in IL,
by Selected Barriers
(Derived from PY 2019 Q4 PIRL)
Homeless or Runaway
Single Parents
Pregnant or Parenting
Needs Additional Assistance
Foster Care Youth
Number of Exiters
All exiters 234 296 678 959 16
Statewide programs 17 28 24 94 *
Local programs 217 268 654 865 14
Age Categories
14 to 15 0.4 0.0 0.0 1.0 0.0
16 to 17 3.1 7.5 4.9 24.2 0.0
18 16.6 7.9 9.8 20.0 37.5
19 to 21 45.4 31.5 34.6 31.9 56.3
22 to 24 34.5 53.0 50.6 22.9 6.3
Gender
Females 49.6 87.1 86.5 56.1 18.8
Males 50.4 12.9 13.5 43.9 81.3
Race and Ethnicity
Hispanics/Latinos 23.1 18.6 22.0 17.3 6.3
American Indians/Alaska Natives 1.5 1.8 1.3 1.1 0.0
Asians 1.0 0.4 0.3 4.0 0.0
Blacks or African Americans 67.2 55.0 60.0 51.3 40.0
Native Hawaiians/Pacific Islanders 0.5 0.0 0.2 0.2 0.0
Whites 32.3 47.2 41.0 45.8 60.0
More than one race 2.0 4.4 2.8 2.3 0.0
Employment Status
Employed 20.9 43.2 32.2 27.8 37.5
Not employed or with layoff notice 79.1 56.8 67.8 72.2 62.5
Veteran Status
Veterans 0.9 2.0 1.3 1.1 0.0
Disabled veterans 0.0 0.7 0.1 0.2 0.0
Other eligible persons 0.0 0.0 0.0 0.0 0.0
Active duty military spouses 0.0 0.0 0.0 0.0 0.0
Unemployment Compensation Status
Claimants referred by RESEA 0.4 1.0 0.9 1.0 0.0
Claimants referred by WPRS 0.9 1.0 1.5 1.1 0.0
Claimants not referred 0.9 5.7 2.9 2.0 0.0
Claimants exempt 0.0 0.3 0.1 0.0 0.0
Exhaustees 0.0 0.0 0.1 0.1 0.0
Neither claimants nor exhaustees 97.9 91.9 94.4 95.7 100.0
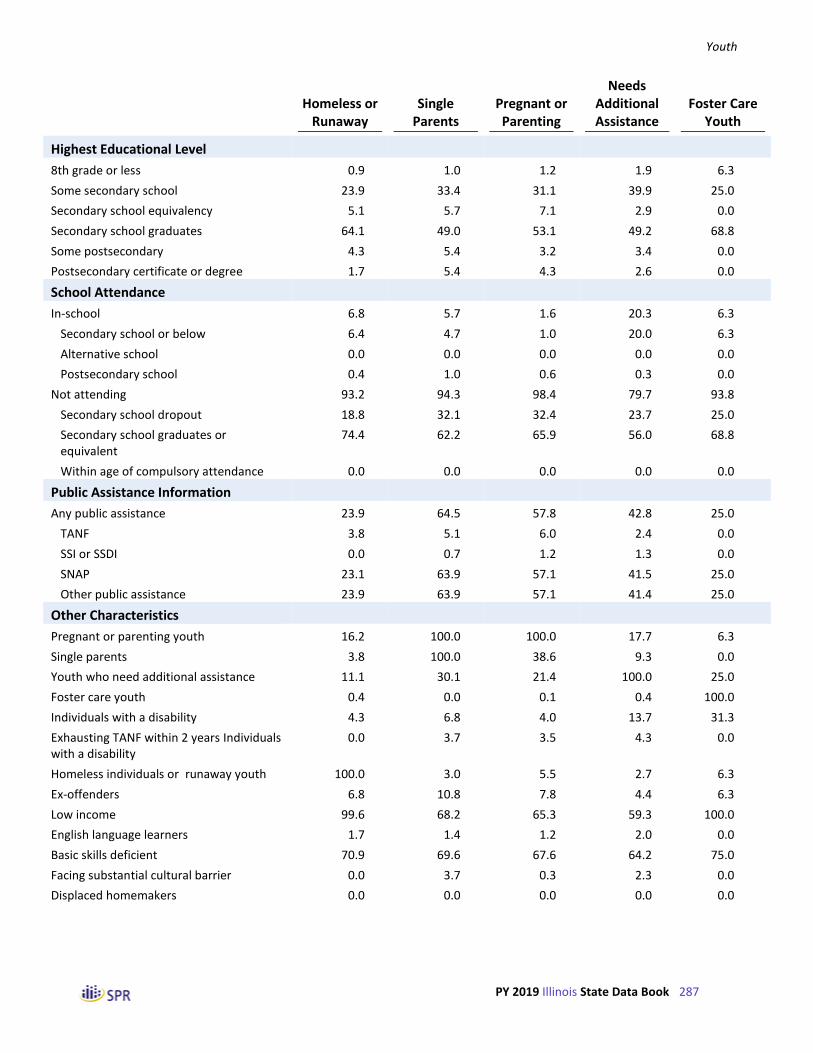
Youth
PY 2019 Illinois State Data Book 287
Homeless or Runaway
Single Parents
Pregnant or Parenting
Needs Additional Assistance
Foster Care Youth
Highest Educational Level
8th grade or less 0.9 1.0 1.2 1.9 6.3
Some secondary school 23.9 33.4 31.1 39.9 25.0
Secondary school equivalency 5.1 5.7 7.1 2.9 0.0
Secondary school graduates 64.1 49.0 53.1 49.2 68.8
Some postsecondary 4.3 5.4 3.2 3.4 0.0
Postsecondary certificate or degree 1.7 5.4 4.3 2.6 0.0
School Attendance
In-school 6.8 5.7 1.6 20.3 6.3
Secondary school or below 6.4 4.7 1.0 20.0 6.3
Alternative school 0.0 0.0 0.0 0.0 0.0
Postsecondary school 0.4 1.0 0.6 0.3 0.0
Not attending 93.2 94.3 98.4 79.7 93.8
Secondary school dropout 18.8 32.1 32.4 23.7 25.0
Secondary school graduates or equivalent
74.4 62.2 65.9 56.0 68.8
Within age of compulsory attendance 0.0 0.0 0.0 0.0 0.0
Public Assistance Information
Any public assistance 23.9 64.5 57.8 42.8 25.0
TANF 3.8 5.1 6.0 2.4 0.0
SSI or SSDI 0.0 0.7 1.2 1.3 0.0
SNAP 23.1 63.9 57.1 41.5 25.0
Other public assistance 23.9 63.9 57.1 41.4 25.0
Other Characteristics
Pregnant or parenting youth 16.2 100.0 100.0 17.7 6.3
Single parents 3.8 100.0 38.6 9.3 0.0
Youth who need additional assistance 11.1 30.1 21.4 100.0 25.0
Foster care youth 0.4 0.0 0.1 0.4 100.0
Individuals with a disability 4.3 6.8 4.0 13.7 31.3
Exhausting TANF within 2 years Individuals with a disability
0.0 3.7 3.5 4.3 0.0
Homeless individuals or runaway youth 100.0 3.0 5.5 2.7 6.3
Ex-offenders 6.8 10.8 7.8 4.4 6.3
Low income 99.6 68.2 65.3 59.3 100.0
English language learners 1.7 1.4 1.2 2.0 0.0
Basic skills deficient 70.9 69.6 67.6 64.2 75.0
Facing substantial cultural barrier 0.0 3.7 0.3 2.3 0.0
Displaced homemakers 0.0 0.0 0.0 0.0 0.0

Youth
PY 2019 Illinois State Data Book 288
Table V-10 Characteristics of Youth Who Exited from April 2019 to March 2020 in IL,
by Major Service Categories
((Derived from PY 2019 Q4 PIRL)
Educational Services
Work Experience
Guidance and Counseling Training
Supportive Services
Number of Exiters
All exiters 3,586 899 3,515 3,552 2,153
Statewide programs 296 65 296 296 245
Local programs 3,290 834 3,219 3,256 1,908
Age Categories
14 to 15 0.4 1.4 0.3 0.4 0.4
16 to 17 19.4 34.6 19.4 19.5 16.3
18 19.4 23.0 19.3 19.5 16.7
19 to 21 35.5 28.2 35.4 35.4 37.5
22 to 24 25.4 12.9 25.6 25.2 29.1
Gender
Females 51.6 53.6 51.3 51.7 51.8
Males 48.4 46.4 48.7 48.3 48.2
Race and Ethnicity
Hispanics/Latinos 21.6 24.5 21.7 21.5 20.8
American Indians/Alaska Natives 1.4 1.6 1.5 1.4 1.5
Asians 2.3 4.5 2.3 2.3 1.5
Blacks or African Americans 53.9 52.3 54.2 53.8 50.9
Native Hawaiians/Pacific Islanders 0.6 0.1 0.6 0.6 0.7
Whites 44.7 44.7 44.3 44.6 48.5
More than one race 2.7 3.1 2.7 2.6 2.9
Employment Status
Employed 24.6 24.2 24.6 24.6 30.7
Not employed or with layoff notice 75.4 75.8 75.4 75.4 69.3
Veteran Status
Veterans 0.9 1.1 1.0 1.0 1.3
Disabled veterans 0.2 0.4 0.2 0.2 0.2
Other eligible persons 0.0 0.0 0.0 0.0 0.0
Active duty military spouses 0.0 0.0 0.0 0.0 0.0
Unemployment Compensation Status
Claimants referred by RESEA 0.7 0.6 0.7 0.7 0.9
Claimants referred by WPRS 1.0 0.9 0.9 1.0 1.0
Claimants not referred 2.2 2.4 2.2 2.0 2.5
Claimants exempt 0.0 0.1 0.0 0.0 0.0
Exhaustees 0.1 0.0 0.1 0.1 0.1
Neither claimants nor exhaustees 96.0 96.0 96.0 96.3 95.4

Youth
PY 2019 Illinois State Data Book 289
Educational Services
Work Experience
Guidance and Counseling Training
Supportive Services
Highest Educational Level
8th or less 2.2 4.0 2.1 2.2 2.7
Some secondary school 40.4 65.6 40.3 40.6 37.7
Secondary school equivalency 4.0 1.3 4.0 3.9 4.2
Secondary school graduates 48.5 25.7 48.8 48.4 50.0
Some postsecondary 2.6 1.7 2.4 2.5 2.6
Postsecondary certificate or degree 2.4 1.7 2.4 2.4 2.7
School Status at Participation
In-school 14.0 28.5 14.0 14.1 7.6
Secondary school or below 13.6 28.1 13.7 13.8 7.3
Alternative school 0.0 0.0 0.0 0.0 0.0
Postsecondary school 0.3 0.3 0.3 0.3 0.3
Not attending 86.0 71.5 86.0 85.9 92.4
Secondary school dropout 30.5 44.3 30.2 30.6 35.0
Secondary school graduates or equivalent 55.5 27.3 55.8 55.3 57.4
Within age of compulsory attendance 0.0 0.0 0.0 0.0 0.0
Public Assistance Information
Any public assistance 35.4 32.7 35.2 35.5 38.2
TANF 1.7 1.0 1.7 1.7 1.7
SSI or SSDI 2.0 0.7 2.0 2.0 1.7
SNAP 33.7 31.9 33.5 33.8 36.5
Other public assistance 33.7 32.0 33.5 33.9 36.6
Other Characteristics
Pregnant or parenting youth 19.9 16.6 20.0 19.9 23.1
Single parents 8.3 7.2 8.3 8.2 11.9
Youth who need additional assistance 26.7 33.1 26.4 26.9 27.1
Foster care youth 0.4 0.3 0.5 0.5 0.6
Individuals with a disability 18.1 14.9 18.1 18.2 12.9
Exhausting TANF within 2 years 2.0 3.2 2.0 1.5 1.1
Homeless individuals or runaway youth 6.5 5.2 6.6 6.6 5.8
Ex-offenders 6.4 4.2 6.3 6.3 6.9
Low income 51.8 50.6 51.4 51.9 51.9
English language learners 1.8 3.7 1.9 1.8 1.8
Basic skills deficient 74.6 80.5 74.9 74.9 74.1
Facing substantial cultural barrier 0.8 0.2 0.8 0.8 1.1
Displaced homemakers 0.0 0.0 0.0 0.0 0.0

Youth
PY 2019 Illinois State Data Book 290
Table V-11 Number of Youth Who Exited from April 2019 to March 2020 in IL,
by Major Service Categories
(Derived from PY 2019 Q4 PIRL)
Educational Services
Work Experience
Guidance and Counseling Training
Supportive Services
Number of Exiters
All exiters 3,586 899 3,515 3,552 2,153
Statewide programs 296 65 296 296 245
Local programs 3,290 834 3,219 3,256 1,908
Age Categories
14 to 15 13 12 11 13 *
16 to 17 676 301 663 675 340
18 676 200 660 674 349
19 to 21 1,240 246 1,212 1,224 781
22 to 24 885 112 876 870 607
Gender
Females 1,846 481 1,800 1,831 1,111
Males 1,729 416 1,706 1,710 1,035
Race and Ethnicity
Hispanics/Latinos 774 220 764 763 447
American Indians/Alaska Natives 45 13 45 45 29
Asians 72 36 72 72 29
Blacks or African Americans 1,701 416 1,677 1,682 987
Native Hawaiians/Pacific Islanders 18 * 18 18 13
Whites 1,410 355 1,370 1,394 940
More than one race 84 25 84 82 56
Employment Status
Employed 882 218 864 875 661
Not employed or with layoff notice 2,704 681 2,651 2,677 1,492
Veteran Status
Veterans 34 10 34 34 27
Disabled veterans * * * * *
Other eligible persons 0 0 0 0 0
Active duty military spouses 0 0 0 0 0
Unemployment Compensation Status
Claimants referred by RESEA 25 * 25 25 19
Claimants referred by WPRS 36 * 33 34 22
Claimants not referred 79 22 77 70 54
Claimants exempt * * * * *
Exhaustees * 0 * * *
Neither claimants nor exhaustees 3,442 863 3,376 3,419 2,055

Youth
PY 2019 Illinois State Data Book 291
Educational Services
Work Experience
Guidance and Counseling Training
Supportive Services
Highest Educational Level
8th or less 79 36 74 79 58
Some secondary school 1,448 590 1,415 1,442 812
Secondary school equivalency 142 12 140 139 91
Secondary school graduates 1,738 231 1,717 1,718 1,077
Some postsecondary 93 15 84 89 57
Postsecondary certificate or degree 86 15 85 85 58
School Status at Participation
In-school 501 256 493 500 164
Secondary school or below 489 253 482 489 157
Alternative school * 0 * 0 0
Postsecondary school 11 * 10 11 *
Not attending 3,085 643 3,022 3,052 1,989
Secondary school dropout 1,094 398 1,062 1,088 753
Secondary school graduates or equivalent 1,991 245 1,960 1,964 1,236
Within age of compulsory attendance 0 0 0 0 0
Public Assistance Information
Any public assistance 1,268 294 1,236 1,262 822
TANF 61 9 61 61 36
SSI or SSDI 70 * 69 70 36
SNAP 1,208 287 1,177 1,202 786
Other public assistance 1,210 288 1,179 1,205 787
Other Characteristics
Pregnant or parenting youth 712 149 702 707 497
Single parents 296 65 291 292 256
Youth who need additional assistance 959 298 927 957 583
Foster care youth 16 * 16 16 12
Individuals with a disability 650 134 635 648 278
Exhausting TANF within 2 years * * * * *
Homeless individuals or runaway youth 234 47 232 234 124
Ex-offenders 229 38 222 225 148
Low income 1,859 455 1,807 1,845 1,117
English language learners 66 33 66 65 39
Basic skills deficient 2,675 724 2,632 2,659 1,595
Facing substantial cultural barrier 29 * 29 29 24
Displaced homemakers 0 0 0 0 0
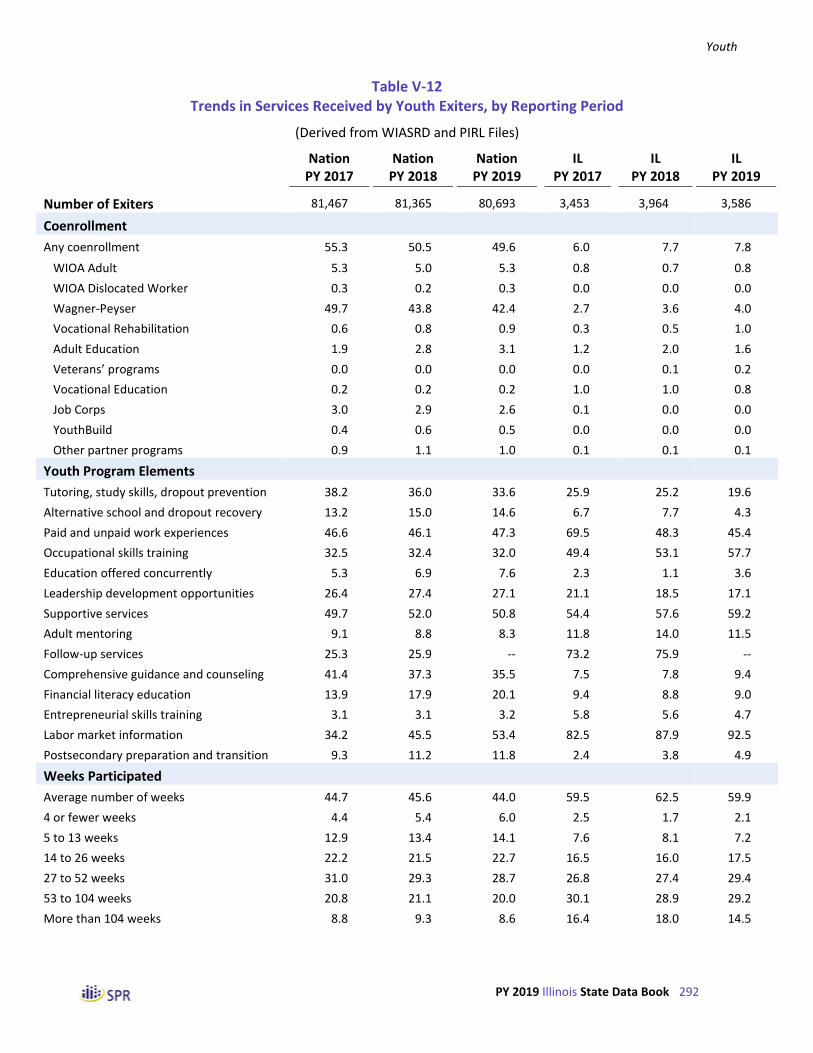
Youth
PY 2019 Illinois State Data Book 292
Table V-12 Trends in Services Received by Youth Exiters, by Reporting Period
(Derived from WIASRD and PIRL Files)
Nation PY 2017
Nation PY 2018
Nation PY 2019
IL PY 2017
IL PY 2018
IL PY 2019
Number of Exiters 81,467 81,365 80,693 3,453 3,964 3,586
Coenrollment
Any coenrollment 55.3 50.5 49.6 6.0 7.7 7.8
WIOA Adult 5.3 5.0 5.3 0.8 0.7 0.8
WIOA Dislocated Worker 0.3 0.2 0.3 0.0 0.0 0.0
Wagner-Peyser 49.7 43.8 42.4 2.7 3.6 4.0
Vocational Rehabilitation 0.6 0.8 0.9 0.3 0.5 1.0
Adult Education 1.9 2.8 3.1 1.2 2.0 1.6
Veterans’ programs 0.0 0.0 0.0 0.0 0.1 0.2
Vocational Education 0.2 0.2 0.2 1.0 1.0 0.8
Job Corps 3.0 2.9 2.6 0.1 0.0 0.0
YouthBuild 0.4 0.6 0.5 0.0 0.0 0.0
Other partner programs 0.9 1.1 1.0 0.1 0.1 0.1
Youth Program Elements
Tutoring, study skills, dropout prevention 38.2 36.0 33.6 25.9 25.2 19.6
Alternative school and dropout recovery 13.2 15.0 14.6 6.7 7.7 4.3
Paid and unpaid work experiences 46.6 46.1 47.3 69.5 48.3 45.4
Occupational skills training 32.5 32.4 32.0 49.4 53.1 57.7
Education offered concurrently 5.3 6.9 7.6 2.3 1.1 3.6
Leadership development opportunities 26.4 27.4 27.1 21.1 18.5 17.1
Supportive services 49.7 52.0 50.8 54.4 57.6 59.2
Adult mentoring 9.1 8.8 8.3 11.8 14.0 11.5
Follow-up services 25.3 25.9 -- 73.2 75.9 --
Comprehensive guidance and counseling 41.4 37.3 35.5 7.5 7.8 9.4
Financial literacy education 13.9 17.9 20.1 9.4 8.8 9.0
Entrepreneurial skills training 3.1 3.1 3.2 5.8 5.6 4.7
Labor market information 34.2 45.5 53.4 82.5 87.9 92.5
Postsecondary preparation and transition 9.3 11.2 11.8 2.4 3.8 4.9
Weeks Participated
Average number of weeks 44.7 45.6 44.0 59.5 62.5 59.9
4 or fewer weeks 4.4 5.4 6.0 2.5 1.7 2.1
5 to 13 weeks 12.9 13.4 14.1 7.6 8.1 7.2
14 to 26 weeks 22.2 21.5 22.7 16.5 16.0 17.5
27 to 52 weeks 31.0 29.3 28.7 26.8 27.4 29.4
53 to 104 weeks 20.8 21.1 20.0 30.1 28.9 29.2
More than 104 weeks 8.8 9.3 8.6 16.4 18.0 14.5

Youth
PY 2019 Illinois State Data Book 293
Nation PY 2017
Nation PY 2018
Nation PY 2019
IL PY 2017
IL PY 2018
IL PY 2019
Reason for Exit
Institutionalized, including criminal offenders
1.2 1.0 0.8 1.8 1.4 1.2
Health/medical 0.8 0.7 0.6 0.5 0.4 0.9
Deceased 0.2 0.1 0.1 0.2 0.2 0.1
Reserve called to active duty 0.0 0.0 0.0 0.1 0.1 0.1
Foster care 0.2 0.1 0.1 0.0 0.0 0.0
Other Youth Activities
Participated in postsecondary education 10.2 11.2 12.0 0.5 0.3 0.3
Received training 35.2 35.3 34.5 53.7 56.3 60.4
Types of Work Experience (among those with work experience)
Summer employment 45.6 46.8 47.3 24.6 28.9 26.7
On-the-job training 30.3 30.0 29.2 75.4 71.1 73.3
Other employment, including internships 0.4 0.7 0.8 0.0 0.0 0.0
Pre-apprenticeship programs 3.2 3.1 2.4 0.0 0.0 0.0
Job shadowing 3.0 5.7 6.0 2.6 3.8 2.9
Other work experience 18.9 15.1 15.5 0.0 0.0 0.0
Characteristics of Training (among trainees)
Number of trainees 28,662 28,756 27,870 1,854 2,232 2,166
Completed training 79.9 79.0 78.3 76.4 74.7 73.4
ITA established 21.0 20.8 22.2 4.4 3.4 3.6
Pell grant recipients 3.9 3.5 3.7 2.3 1.5 2.5
Program(s) operated by the private sector -- -- 20.2 -- -- 47.9
Weeks of training
Average number of weeks 27.5 28.3 28.8 37.3 36.5 39.6
4 or fewer weeks 20.7 20.7 18.9 10.0 8.9 8.7
5 to 13 weeks 25.7 26.0 26.7 25.0 25.7 24.1
14 to 26 weeks 19.5 19.3 20.2 18.4 21.2 21.9
27 to 52 weeks 18.4 18.2 18.5 19.0 22.2 22.9
More than 52 weeks 15.6 15.8 15.7 27.6 22.0 22.5

Youth
PY 2019 Illinois State Data Book 294
Nation PY 2017
Nation PY 2018
Nation PY 2019
IL PY 2017
IL PY 2018
IL PY 2019
Occupation of training
Computer and mathematical 4.2 4.3 4.1 2.2 3.4 3.3
Education, training, and library 4.9 4.6 4.1 22.6 20.1 14.2
Healthcare practitioners and technical 10.2 10.1 9.1 19.6 16.2 17.7
Healthcare support 27.3 29.5 28.1 22.5 24.0 23.7
Food preparation and serving related 6.9 6.5 5.1 1.2 1.7 0.7
Sales and related 1.6 1.3 1.5 0.3 0.5 0.3
Office and administrative support 12.4 9.3 10.0 4.7 4.6 3.4
Construction and extraction 5.3 5.6 6.7 0.5 2.4 2.1
Installation, maintenance, and repair 4.2 4.7 4.6 3.6 3.2 5.3
Production 7.5 7.3 8.0 5.4 6.6 9.2
Transportation and material moving 6.6 7.8 9.6 11.9 13.2 14.3
Other occupations 11.8 11.8 12.4 7.5 5.4 8.2
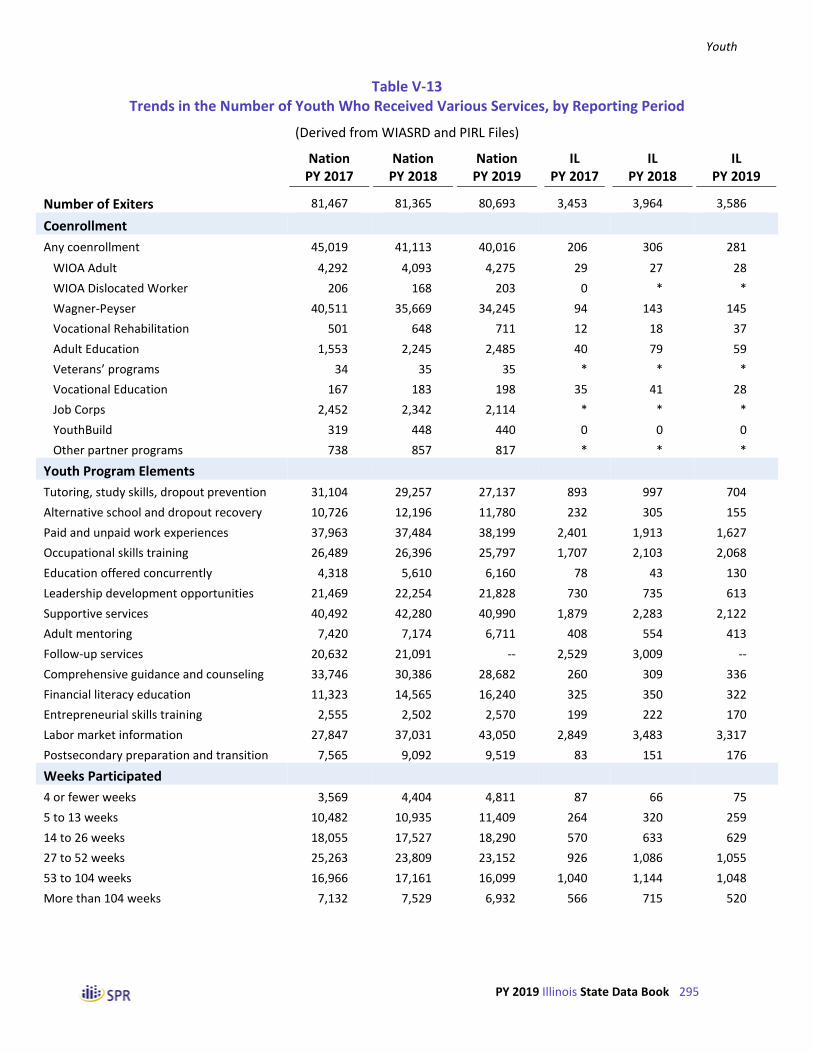
Youth
PY 2019 Illinois State Data Book 295
Table V-13 Trends in the Number of Youth Who Received Various Services, by Reporting Period
(Derived from WIASRD and PIRL Files)
Nation PY 2017
Nation PY 2018
Nation PY 2019
IL PY 2017
IL PY 2018
IL PY 2019
Number of Exiters 81,467 81,365 80,693 3,453 3,964 3,586
Coenrollment
Any coenrollment 45,019 41,113 40,016 206 306 281
WIOA Adult 4,292 4,093 4,275 29 27 28
WIOA Dislocated Worker 206 168 203 0 * *
Wagner-Peyser 40,511 35,669 34,245 94 143 145
Vocational Rehabilitation 501 648 711 12 18 37
Adult Education 1,553 2,245 2,485 40 79 59
Veterans’ programs 34 35 35 * * *
Vocational Education 167 183 198 35 41 28
Job Corps 2,452 2,342 2,114 * * *
YouthBuild 319 448 440 0 0 0
Other partner programs 738 857 817 * * *
Youth Program Elements
Tutoring, study skills, dropout prevention 31,104 29,257 27,137 893 997 704
Alternative school and dropout recovery 10,726 12,196 11,780 232 305 155
Paid and unpaid work experiences 37,963 37,484 38,199 2,401 1,913 1,627
Occupational skills training 26,489 26,396 25,797 1,707 2,103 2,068
Education offered concurrently 4,318 5,610 6,160 78 43 130
Leadership development opportunities 21,469 22,254 21,828 730 735 613
Supportive services 40,492 42,280 40,990 1,879 2,283 2,122
Adult mentoring 7,420 7,174 6,711 408 554 413
Follow-up services 20,632 21,091 -- 2,529 3,009 --
Comprehensive guidance and counseling 33,746 30,386 28,682 260 309 336
Financial literacy education 11,323 14,565 16,240 325 350 322
Entrepreneurial skills training 2,555 2,502 2,570 199 222 170
Labor market information 27,847 37,031 43,050 2,849 3,483 3,317
Postsecondary preparation and transition 7,565 9,092 9,519 83 151 176
Weeks Participated
4 or fewer weeks 3,569 4,404 4,811 87 66 75
5 to 13 weeks 10,482 10,935 11,409 264 320 259
14 to 26 weeks 18,055 17,527 18,290 570 633 629
27 to 52 weeks 25,263 23,809 23,152 926 1,086 1,055
53 to 104 weeks 16,966 17,161 16,099 1,040 1,144 1,048
More than 104 weeks 7,132 7,529 6,932 566 715 520
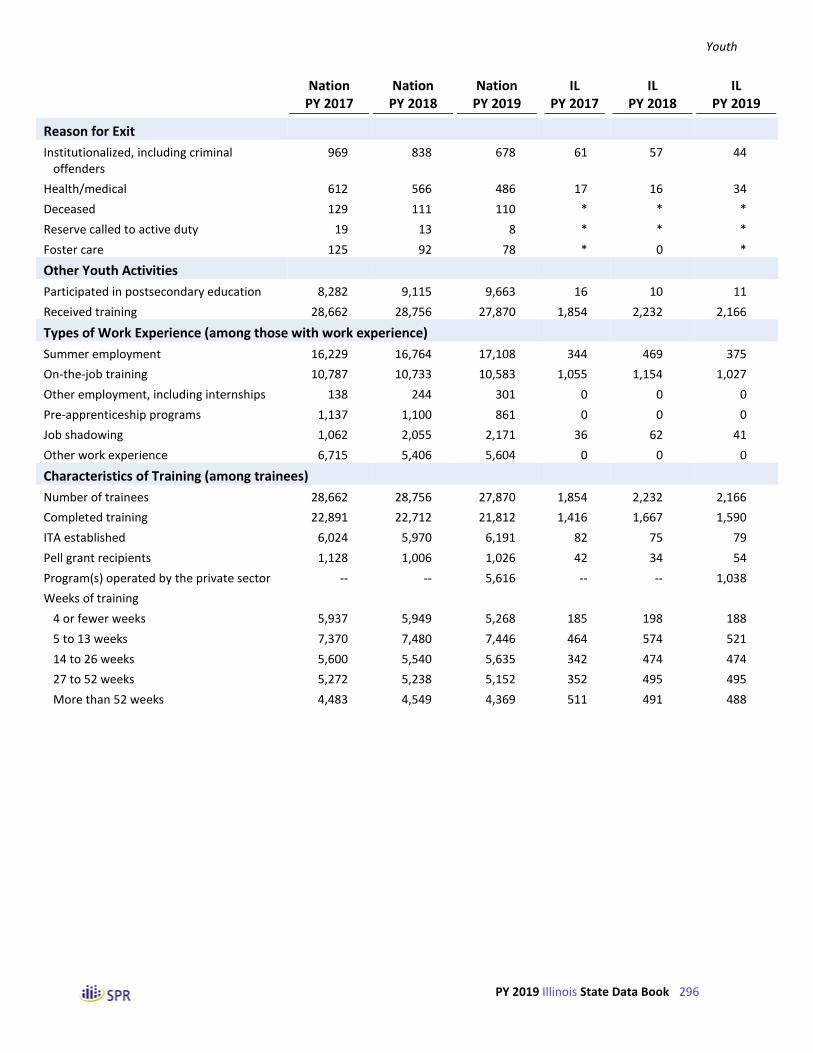
Youth
PY 2019 Illinois State Data Book 296
Nation PY 2017
Nation PY 2018
Nation PY 2019
IL PY 2017
IL PY 2018
IL PY 2019
Reason for Exit
Institutionalized, including criminal offenders
969 838 678 61 57 44
Health/medical 612 566 486 17 16 34
Deceased 129 111 110 * * *
Reserve called to active duty 19 13 8 * * *
Foster care 125 92 78 * 0 *
Other Youth Activities
Participated in postsecondary education 8,282 9,115 9,663 16 10 11
Received training 28,662 28,756 27,870 1,854 2,232 2,166
Types of Work Experience (among those with work experience)
Summer employment 16,229 16,764 17,108 344 469 375
On-the-job training 10,787 10,733 10,583 1,055 1,154 1,027
Other employment, including internships 138 244 301 0 0 0
Pre-apprenticeship programs 1,137 1,100 861 0 0 0
Job shadowing 1,062 2,055 2,171 36 62 41
Other work experience 6,715 5,406 5,604 0 0 0
Characteristics of Training (among trainees)
Number of trainees 28,662 28,756 27,870 1,854 2,232 2,166
Completed training 22,891 22,712 21,812 1,416 1,667 1,590
ITA established 6,024 5,970 6,191 82 75 79
Pell grant recipients 1,128 1,006 1,026 42 34 54
Program(s) operated by the private sector -- -- 5,616 -- -- 1,038
Weeks of training
4 or fewer weeks 5,937 5,949 5,268 185 198 188
5 to 13 weeks 7,370 7,480 7,446 464 574 521
14 to 26 weeks 5,600 5,540 5,635 342 474 474
27 to 52 weeks 5,272 5,238 5,152 352 495 495
More than 52 weeks 4,483 4,549 4,369 511 491 488

Youth
PY 2019 Illinois State Data Book 297
Nation PY 2017
Nation PY 2018
Nation PY 2019
IL PY 2017
IL PY 2018
IL PY 2019
Occupation of training
Computer and mathematical 791 817 801 28 52 51
Education, training, and library 921 873 801 291 307 218
Healthcare practitioners and technical 1,910 1,931 1,777 253 248 273
Healthcare support 5,119 5,638 5,455 290 367 365
Food preparation and serving related 1,300 1,245 996 16 26 11
Sales and related 301 249 301 * * *
Office and administrative support 2,331 1,783 1,946 60 71 52
Construction and extraction 989 1,067 1,308 * 37 32
Installation, maintenance, and repair 792 899 899 46 49 81
Production 1,403 1,388 1,556 69 101 142
Transportation and material moving 1,245 1,481 1,857 153 202 220
Other occupations 2,221 2,243 2,406 96 83 126

Youth
PY 2019 Illinois State Data Book 298
Table V-14 Services Received by Youth Who Exited from April 2019 to March 2020 in IL,
by Age at Program Entry
(Derived from PY 2019 Q4 PIRL)
14 to 15 16 to 17 18 19 to 21 22 to 24
Number of Exiters 13 676 676 1,240 885
Coenrollment
Any coenrollment 0.0 3.1 4.4 5.4 7.6
WIOA Adult 0.0 0.1 0.0 0.6 2.1
WIOA Dislocated Worker 0.0 0.0 0.0 0.0 0.0
Wagner-Peyser 0.0 0.3 0.4 1.1 3.4
Vocational Rehabilitation 0.0 0.3 1.3 1.3 1.1
Adult Education 0.0 2.5 2.4 1.5 0.7
Veterans’ programs 0.0 0.0 0.0 0.2 0.0
Vocational Education 0.0 0.0 0.4 1.0 1.4
Job Corps 0.0 0.0 0.1 0.0 0.0
YouthBuild 0.0 0.0 0.0 0.0 0.0
Other partner programs 0.0 0.0 0.0 0.1 0.1
Youth Program Elements
Tutoring, study skills, dropout prevention 69.2 35.8 22.2 15.9 9.9
Alternative school and dropout recovery 0.0 10.4 7.1 2.3 0.7
Paid and unpaid work experiences 46.2 51.9 46.9 44.4 40.6
Occupational skills training 30.8 49.9 48.8 61.0 65.1
Education offered concurrently 23.1 5.6 4.7 3.0 1.7
Leadership development opportunities 38.5 25.3 20.3 16.4 9.2
Supportive services 76.9 62.4 59.0 57.0 58.6
Adult mentoring 61.5 20.3 13.5 9.3 6.3
Comprehensive guidance and counseling 7.7 8.4 7.0 11.0 9.8
Financial literacy education 46.2 11.7 8.6 7.7 8.6
Entrepreneurial skills training 23.1 3.0 6.1 4.7 4.6
Labor market information 61.5 89.9 92.3 93.1 94.0
Postsecondary preparation and transition 30.8 9.9 6.5 2.8 2.1
Weeks Participated
Average number of weeks 137.6 71.1 61.5 56.5 50.4
4 or fewer weeks 0.0 1.0 2.2 2.5 2.5
5 to 13 weeks 0.0 4.3 8.1 9.3 6.7
14 to 26 weeks 7.7 9.2 18.3 21.0 20.3
27 to 52 weeks 15.4 29.7 28.0 29.5 32.7
53 to 104 weeks 0.0 38.8 26.6 24.0 28.4
More than 104 weeks 76.9 17.0 16.7 13.8 9.5

Youth
PY 2019 Illinois State Data Book 299
14 to 15 16 to 17 18 19 to 21 22 to 24
Reason for Exit
Institutionalized, including criminal offenders
0.0 1.2 1.3 1.5 1.0
Health/medical 0.0 1.2 1.3 1.0 0.5
Deceased 0.0 0.1 0.1 0.0 0.1
Reserve called to active duty 0.0 0.1 0.1 0.2 0.0
Foster care 0.0 0.1 0.0 0.0 0.0
Other Youth Activities
Participated in postsecondary education 0.0 0.0 0.3 0.6 0.0
Received training 61.5 51.9 52.2 63.5 67.9
Types of Work Experience (among those with work experience)
Summer employment 0.0 30.4 26.5 27.8 20.6
On-the-job training 100.0 69.6 73.5 72.2 79.4
Other employment, including internships 0.0 0.0 0.0 0.0 0.0
Pre-apprenticeship programs 0.0 0.0 0.0 0.0 0.0
Job shadowing 0.0 0.9 2.8 2.4 6.7
Other work experience 0.0 0.0 0.0 0.0 0.0
Characteristics of Training (among trainees)
Number of trainees * 351 353 787 601
Completed training * 74.4 69.1 73.3 75.2
ITA established * 1.1 1.7 4.6 5.3
Pell grant recipients * 0.0 1.4 3.3 3.2
Program(s) operated by the private sector * 38.2 35.4 49.9 59.4
Weeks of training
Average number of weeks * 40.9 48.8 38.2 31.2
4 or fewer weeks * 8.5 8.2 11.1 6.5
5 to 13 weeks * 19.4 21.0 24.9 29.6
14 to 26 weeks * 20.5 21.8 22.7 22.8
27 to 52 weeks * 28.5 19.8 19.7 25.1
More than 52 weeks * 23.1 29.2 21.6 16.0

Youth
PY 2019 Illinois State Data Book 300
14 to 15 16 to 17 18 19 to 21 22 to 24
Occupation of training
Computer and mathematical * 6.5 2.3 2.9 2.3
Education, training, and library * 43.2 22.1 10.0 4.7
Healthcare practitioners and technical * 5.0 13.6 20.6 20.6
Healthcare support * 15.6 18.8 25.0 27.6
Food preparation and serving related * 0.0 0.5 1.4 0.4
Sales and related * 0.0 0.5 0.7 0.0
Office and administrative support * 6.0 3.8 2.5 3.3
Construction and extraction * 3.0 4.2 1.6 1.0
Installation, maintenance, and repair * 1.5 6.1 6.8 4.5
Production * 15.1 10.3 8.1 8.2
Transportation and material moving * 0.5 6.1 14.8 23.1
Other occupations * 5.5 12.7 8.6 6.4

Youth
PY 2019 Illinois State Data Book 301
Table V-15 Services Received by Youth Who Exited from April 2019 to March 2020 in IL,
by Ethnicity and Race
(Derived from PY 2019 Q4 PIRL)
Ethnicity Race
Hispanic Not Hispanic White Only Black Only Other Race
Number of Exiters 774 2,812 1,345 1,634 178
Coenrollment
Any coenrollment 6.8 8.1 10.7 7.0 9.0
WIOA Adult 0.4 0.9 0.7 0.9 1.1
WIOA Dislocated Worker 0.0 0.0 0.1 0.0 0.0
Wagner-Peyser 6.2 3.4 5.3 3.9 5.1
Vocational Rehabilitation 0.3 1.2 2.0 0.4 1.1
Adult Education 0.3 2.0 2.8 1.0 1.7
Veterans’ programs 0.4 0.1 0.1 0.1 1.1
Vocational Education 0.0 1.0 0.2 1.5 0.6
Job Corps 0.0 0.0 0.0 0.0 0.6
YouthBuild 0.0 0.0 0.0 0.0 0.0
Other partner programs 0.0 0.1 0.0 0.1 0.0
Youth Program Elements
Tutoring, study skills, dropout prevention 24.7 18.2 17.1 19.9 33.7
Alternative school and dropout recovery 5.8 3.9 1.9 5.7 2.8
Paid and unpaid work experiences 48.3 44.6 42.3 47.9 46.6
Occupational skills training 55.7 58.2 65.1 54.6 53.4
Education offered concurrently 2.1 4.1 5.2 2.8 1.7
Leadership development opportunities 19.5 16.4 14.9 16.7 30.3
Supportive services 59.0 59.2 58.9 58.7 64.0
Adult mentoring 5.3 13.2 8.8 13.8 20.2
Comprehensive guidance and counseling 16.9 7.3 7.0 8.0 5.6
Financial literacy education 9.7 8.8 9.5 8.4 7.3
Entrepreneurial skills training 4.1 4.9 4.3 5.3 4.5
Labor market information 93.4 92.2 89.1 94.8 89.9
Postsecondary preparation and transition 5.3 4.8 5.0 5.0 5.1
Weeks Participated
Average number of weeks 60.8 59.7 68.3 53.4 66.0
4 or fewer weeks 1.2 2.3 1.0 2.9 2.2
5 to 13 weeks 9.4 6.6 6.3 7.2 3.4
14 to 26 weeks 17.8 17.5 15.1 20.2 12.9
27 to 52 weeks 26.2 30.3 26.1 32.7 26.4
53 to 104 weeks 28.8 29.3 32.2 26.4 40.4
More than 104 weeks 16.5 13.9 19.3 10.6 14.6

Youth
PY 2019 Illinois State Data Book 302
Ethnicity Race
Hispanic Not Hispanic White Only Black Only Other Race
Reason for Exit
Institutionalized, including criminal offenders
1.2 1.2 0.8 1.3 1.7
Health/medical 0.9 1.0 1.6 0.4 0.0
Deceased 0.1 0.1 0.1 0.1 0.0
Reserve called to active duty 0.1 0.1 0.1 0.1 0.0
Foster care 0.0 0.0 0.1 0.0 0.0
Other Youth Activities
Participated in postsecondary education 0.4 0.3 0.4 0.1 0.6
Received training 57.5 61.2 69.3 56.5 56.2
Types of Work Experience (among those with work experience)
Summer employment 23.9 27.5 29.0 26.6 25.7
On-the-job training 76.1 72.5 71.0 73.4 74.3
Other employment, including internships 0.0 0.0 0.0 0.0 0.0
Pre-apprenticeship programs 0.0 0.0 0.0 0.0 0.0
Job shadowing 2.7 3.0 4.0 2.4 1.4
Other work experience 0.0 0.0 0.0 0.0 0.0
Characteristics of Training (among trainees)
Number of trainees 445 1,721 932 923 100
Completed training 73.9 73.3 70.8 75.2 78.0
ITA established 1.6 4.2 1.6 5.7 3.0
Pell grant recipients 0.7 3.0 2.7 2.5 2.0
Program(s) operated by the private sector 46.5 48.3 29.2 66.8 43.0
Weeks of training
Average number of weeks 40.6 39.3 49.6 29.5 41.9
4 or fewer weeks 6.5 9.2 5.8 12.2 6.0
5 to 13 weeks 24.3 24.0 21.8 27.2 20.0
14 to 26 weeks 22.5 21.7 19.2 24.4 26.0
27 to 52 weeks 23.8 22.6 23.5 21.2 20.0
More than 52 weeks 22.9 22.4 29.7 15.0 28.0

Youth
PY 2019 Illinois State Data Book 303
Ethnicity Race
Hispanic Not Hispanic White Only Black Only Other Race
Occupation of training
Computer and mathematical 2.0 3.6 3.4 3.0 5.0
Education, training, and library 14.5 14.1 19.4 9.1 27.5
Healthcare practitioners and technical 14.9 18.4 17.4 18.2 11.3
Healthcare support 22.1 24.1 16.6 29.1 15.0
Food preparation and serving related 0.7 0.7 0.8 0.9 0.0
Sales and related 1.0 0.2 0.8 0.0 0.0
Office and administrative support 4.3 3.2 3.8 3.1 2.5
Construction and extraction 1.0 2.3 1.4 2.4 3.8
Installation, maintenance, and repair 11.6 3.7 10.9 2.1 3.8
Production 6.6 9.9 9.1 9.4 12.5
Transportation and material moving 14.2 14.3 8.1 18.3 7.5
Other occupations 10.9 7.5 10.5 6.4 11.3

Youth
PY 2019 Illinois State Data Book 304
Table V-16 Services Received by Youth Who Exited from April 2019 to March 2020 in IL,
by Gender, Employment Status, and Disability Status
(Derived from PY 2019 Q4 PIRL)
Gender Employment Status Has a
Female Male Employed Not Employed Disability
Number of Exiters 1,846 1,729 882 2,704 650
Coenrollment
Any coenrollment 7.7 8.0 8.7 7.5 10.9
WIOA Adult 0.7 0.9 1.2 0.6 0.6
WIOA Dislocated Worker 0.1 0.0 0.0 0.0 0.0
Wagner-Peyser 4.2 3.9 4.2 4.0 4.0
Vocational Rehabilitation 0.9 1.2 1.1 1.0 5.7
Adult Education 1.1 2.2 1.2 1.8 0.3
Veterans’ programs 0.1 0.3 0.3 0.1 0.6
Vocational Education 1.2 0.3 1.6 0.5 1.1
Job Corps 0.0 0.1 0.0 0.0 0.0
YouthBuild 0.0 0.0 0.0 0.0 0.0
Other partner programs 0.0 0.1 0.0 0.1 0.2
Youth Program Elements
Tutoring, study skills, dropout prevention 19.8 19.5 17.9 20.2 12.3
Alternative school and dropout recovery 4.5 4.2 2.4 5.0 1.5
Paid and unpaid work experiences 42.5 48.5 31.6 49.9 48.6
Occupational skills training 58.3 57.0 74.1 52.3 38.2
Education offered concurrently 4.1 3.2 5.3 3.1 5.4
Leadership development opportunities 16.3 17.9 11.8 18.8 27.1
Supportive services 61.5 56.6 57.6 59.7 50.2
Adult mentoring 14.0 8.9 9.4 12.2 11.4
Comprehensive guidance and counseling 9.9 8.9 10.5 9.0 8.8
Financial literacy education 8.6 9.5 9.2 8.9 11.5
Entrepreneurial skills training 3.8 5.8 3.5 5.1 7.5
Labor market information 92.8 92.1 91.6 92.8 91.8
Postsecondary preparation and transition 5.3 4.5 5.1 4.8 5.2
Weeks Participated
Average number of weeks 62.7 56.8 60.1 59.9 67.2
4 or fewer weeks 2.2 2.0 1.6 2.3 0.5
5 to 13 weeks 6.5 8.0 8.4 6.8 9.8
14 to 26 weeks 16.0 19.0 16.6 17.9 15.8
27 to 52 weeks 28.9 30.0 29.0 29.5 26.6
53 to 104 weeks 30.7 27.8 29.3 29.2 26.3
More than 104 weeks 15.7 13.2 15.2 14.3 20.9

Youth
PY 2019 Illinois State Data Book 305
Gender Employment Status Has a
Female Male Employed Not Employed Disability
Reason for Exit
Institutionalized, including criminal offenders
0.3 2.2 0.8 1.4 1.4
Health/medical 1.1 0.8 1.2 0.9 2.0
Deceased 0.1 0.1 0.1 0.1 0.0
Reserve called to active duty 0.1 0.2 0.3 0.0 0.0
Foster care 0.1 0.0 0.0 0.0 0.2
Other Youth Activities
Participated in postsecondary education 0.5 0.1 0.7 0.2 0.5
Received training 61.1 59.6 77.4 54.8 39.8
Types of Work Experience (among those with work experience)
Summer employment 25.8 27.5 22.0 27.7 32.1
On-the-job training 74.2 72.5 78.0 72.3 67.9
Other employment, including internships 0.0 0.0 0.0 0.0 0.0
Pre-apprenticeship programs 0.0 0.0 0.0 0.0 0.0
Job shadowing 2.5 3.4 7.3 2.0 1.0
Other work experience 0.0 0.0 0.0 0.0 0.0
Characteristics of Training (among trainees)
Number of trainees 1,128 1,031 683 1,483 259
Completed training 72.5 74.4 72.8 73.7 70.3
ITA established 4.6 2.5 4.0 3.5 1.2
Pell grant recipients 3.6 1.3 5.1 1.3 0.4
Program(s) operated by the private sector 45.4 50.6 33.8 54.4 35.5
Weeks of training
Average number of weeks 42.9 35.7 44.0 37.5 58.0
4 or fewer weeks 6.7 10.9 4.2 10.7 6.2
5 to 13 weeks 25.1 23.0 28.0 22.3 16.2
14 to 26 weeks 19.1 25.0 18.0 23.7 13.5
27 to 52 weeks 24.9 20.7 21.8 23.3 29.7
More than 52 weeks 24.2 20.5 28.0 20.0 34.4

Youth
PY 2019 Illinois State Data Book 306
Gender Employment Status Has a
Female Male Employed Not Employed Disability
Occupation of training
Computer and mathematical 0.9 6.2 2.2 3.9 6.1
Education, training, and library 12.8 15.9 8.1 17.1 22.7
Healthcare practitioners and technical 29.0 4.8 26.1 13.6 7.2
Healthcare support 41.4 3.1 31.0 20.1 10.5
Food preparation and serving related 0.6 0.8 0.2 1.0 1.7
Sales and related 0.2 0.4 0.2 0.4 0.6
Office and administrative support 3.2 3.5 2.4 3.9 7.2
Construction and extraction 0.2 4.2 1.6 2.3 2.2
Installation, maintenance, and repair 1.1 10.1 5.7 5.0 7.7
Production 2.2 17.3 7.7 10.0 17.7
Transportation and material moving 2.6 28.0 7.1 17.8 5.5
Other occupations 7.4 9.0 9.7 7.5 15.5

Youth
PY 2019 Illinois State Data Book 307
Table V-17 Services Received by In-School Youth Who Exited from April 2019 to March 2020 in IL,
by Highest Educational Level for In-School Youth
(Derived from PY 2019 Q4 PIRL)
In-School Youth
All In-School Youth
Secondary School or Less
Alternative School
Postsecondary School
Number of Exiters 501 489 * 11
Coenrollment
Any coenrollment 8.6 8.2 * 18.2
WIOA Adult 0.2 0.0 * 0.0
WIOA Dislocated Worker 0.0 0.0 * 0.0
Wagner-Peyser 6.0 5.7 * 9.1
Vocational Rehabilitation 2.6 2.5 * 9.1
Adult Education 0.0 0.0 * 0.0
Veterans’ programs 0.4 0.4 * 0.0
Vocational Education 0.0 0.0 * 0.0
Job Corps 0.0 0.0 * 0.0
YouthBuild 0.0 0.0 * 0.0
Other partner programs 0.0 0.0 * 0.0
Youth Program Elements
Tutoring, study skills, dropout prevention 37.9 38.4 * 18.2
Alternative school and dropout recovery 5.4 5.5 * 0.0
Paid and unpaid work experiences 64.1 64.6 * 45.5
Occupational skills training 31.3 30.7 * 63.6
Education offered concurrently 11.4 11.7 * 0.0
Leadership development opportunities 24.8 25.2 * 9.1
Supportive services 56.9 56.4 * 81.8
Adult mentoring 22.6 23.1 * 0.0
Comprehensive guidance and counseling 4.8 4.9 * 0.0
Financial literacy education 8.4 8.2 * 18.2
Entrepreneurial skills training 3.8 3.7 * 9.1
Labor market information 95.6 95.7 * 100.0
Postsecondary preparation and transition 12.6 12.7 * 9.1
Weeks Participated
Average number of weeks 73.1 73.3 * 70.5
4 or fewer weeks 0.4 0.2 * 9.1
5 to 13 weeks 1.8 1.6 * 0.0
14 to 26 weeks 7.0 6.7 * 18.2
27 to 52 weeks 34.5 34.6 * 36.4
53 to 104 weeks 39.1 39.9 * 9.1
More than 104 weeks 17.2 17.0 * 27.3

Youth
PY 2019 Illinois State Data Book 308
In-School Youth
All In-School Youth
Secondary School or Less
Alternative School
Postsecondary School
Reason for Exit
Institutionalized, including criminal offenders
0.6 0.6 * 0.0
Health/medical 0.8 0.6 * 9.1
Deceased 0.0 0.0 * 0.0
Reserve called to active duty 0.2 0.2 * 0.0
Foster care 0.2 0.2 * 0.0
Other Youth Activities
Participated in postsecondary education 2.2 0.0 * 100.0
Received training 32.7 32.1 * 63.6
Types of Work Experience (among those with work experience)
Summer employment 30.7 30.4 * 50.0
On-the-job training 69.3 69.6 * 50.0
Other employment, including internships 0.0 0.0 * 0.0
Pre-apprenticeship programs 0.0 0.0 * 0.0
Job shadowing 0.0 0.0 * 0.0
Other work experience 0.0 0.0 * 0.0
Characteristics of Training (among trainees)
Number of trainees 164 157 0 *
Completed training 93.9 94.9 0.0 *
ITA established 0.0 0.0 0.0 *
Pell grant recipients 3.7 0.0 0.0 *
Program(s) operated by the private sector 32.3 33.1 0.0 *
Weeks of training
Average number of weeks 42.3 41.2 0.0 *
4 or fewer weeks 9.1 9.6 0.0 *
5 to 13 weeks 7.3 6.4 0.0 *
14 to 26 weeks 28.7 28.7 0.0 *
27 to 52 weeks 31.7 32.5 0.0 *
More than 52 weeks 23.2 22.9 0.0 *

Youth
PY 2019 Illinois State Data Book 309
In-School Youth
All In-School Youth
Secondary School or Less
Alternative School
Postsecondary School
Occupation of training
Computer and mathematical 10.5 11.0 0.0 *
Education, training, and library 35.0 36.8 0.0 *
Healthcare practitioners and technical 12.6 9.6 0.0 *
Healthcare support 16.1 16.2 0.0 *
Food preparation and serving related 0.0 0.0 0.0 *
Sales and related 0.0 0.0 0.0 *
Office and administrative support 0.7 0.7 0.0 *
Construction and extraction 0.7 0.7 0.0 *
Installation, maintenance, and repair 0.7 0.0 0.0 *
Production 18.2 19.1 0.0 *
Transportation and material moving 0.0 0.0 0.0 *
Other occupations 8.4 8.1 0.0 *

Youth
PY 2019 Illinois State Data Book 310
Table V-18 Services Received by Out-of-School Youth Who Exited from April 2019 to March 2020 in IL,
by Highest Educational Level for Out-of-School Youth
(Derived from PY 2019 Q4 PIRL)
Out-of-School Youth
All Out-of-School Youth
Secondary School Dropout
Secondary School graduates or Equivalent
Within Compulsory Age
Number of Exiters 3,085 1,094 1,991 *
Coenrollment
Any coenrollment 7.7 9.1 6.9 *
WIOA Adult 0.9 0.5 1.1 *
WIOA Dislocated Worker 0.0 0.0 0.1 *
Wagner-Peyser 3.7 3.7 3.8 *
Vocational Rehabilitation 0.8 0.1 1.2 *
Adult Education 1.9 5.1 0.2 *
Veterans’ programs 0.1 0.0 0.2 *
Vocational Education 0.9 0.1 1.4 *
Job Corps 0.0 0.1 0.0 *
YouthBuild 0.0 0.0 0.0 *
Other partner programs 0.1 0.0 0.1 *
Youth Program Elements
Tutoring, study skills, dropout prevention 16.7 31.4 8.6 *
Alternative school and dropout recovery 4.1 11.7 0.0 *
Paid and unpaid work experiences 42.3 37.3 45.1 *
Occupational skills training 61.9 68.1 58.6 *
Education offered concurrently 2.4 3.5 1.8 *
Leadership development opportunities 15.9 18.1 14.6 *
Supportive services 59.5 63.8 57.2 *
Adult mentoring 9.7 16.1 6.2 *
Comprehensive guidance and counseling 10.1 10.1 10.1 *
Financial literacy education 9.1 12.1 7.4 *
Entrepreneurial skills training 4.9 3.3 5.8 *
Labor market information 92.0 84.6 96.1 *
Postsecondary preparation and transition 3.7 6.5 2.1 *
Weeks Participated
Average number of weeks 57.8 66.2 53.2 *
4 or fewer weeks 2.4 1.6 2.8 *
5 to 13 weeks 8.1 6.7 8.9 *
14 to 26 weeks 19.3 15.6 21.2 *
27 to 52 weeks 28.6 27.2 29.3 *
53 to 104 weeks 27.6 31.4 25.6 *
More than 104 weeks 14.1 17.5 12.2 *

Youth
PY 2019 Illinois State Data Book 311
Out-of-School Youth
All Out-of-School Youth
Secondary School Dropout
Secondary School graduates or Equivalent
Within Compulsory Age
Reason for Exit
Institutionalized, including criminal offenders
1.3 2.7 0.6 *
Health/medical 1.0 1.4 0.8 *
Deceased 0.1 0.2 0.1 *
Reserve called to active duty 0.1 0.2 0.1 *
Foster care 0.0 0.0 0.0 *
Other Youth Activities
Participated in postsecondary education 0.0 0.0 0.0 *
Received training 64.9 73.8 60.0 *
Types of Work Experience (among those with work experience)
Summer employment 25.6 22.4 27.2 *
On-the-job training 74.4 77.6 72.8 *
Other employment, including internships 0.0 0.0 0.0 *
Pre-apprenticeship programs 0.0 0.0 0.0 *
Job shadowing 3.8 2.0 4.6 *
Other work experience 0.0 0.0 0.0 *
Characteristics of Training (among trainees)
Number of trainees 2,002 807 1,195 *
Completed training 71.7 69.6 73.1 *
ITA established 3.9 1.5 5.6 *
Pell grant recipients 2.4 0.1 3.9 *
Program(s) operated by the private sector 49.2 39.4 55.8 *
Weeks of training
Average number of weeks 39.4 43.3 36.7 *
4 or fewer weeks 8.6 9.9 7.8 *
5 to 13 weeks 25.4 21.7 27.9 *
14 to 26 weeks 21.3 20.7 21.8 *
27 to 52 weeks 22.1 20.9 22.9 *
More than 52 weeks 22.5 26.8 19.6 *

Youth
PY 2019 Illinois State Data Book 312
Out-of-School Youth
All Out-of-School Youth
Secondary School Dropout
Secondary School graduates or Equivalent
Within Compulsory Age
Occupation of training
Computer and mathematical 2.6 1.0 3.0 *
Education, training, and library 12.0 51.9 1.5 *
Healthcare practitioners and technical 18.3 4.5 21.9 *
Healthcare support 24.5 7.6 29.0 *
Food preparation and serving related 0.8 1.0 0.7 *
Sales and related 0.4 0.3 0.4 *
Office and administrative support 3.7 5.8 3.1 *
Construction and extraction 2.2 7.2 0.9 *
Installation, maintenance, and repair 5.7 3.1 6.4 *
Production 8.3 7.2 8.6 *
Transportation and material moving 15.8 5.8 18.4 *
Other occupations 8.2 7.9 8.2 *

Youth
PY 2019 Illinois State Data Book 313
Table V-19 Services Received by Youth Who Exited from April 2019 to March 2020 in IL,
by Veteran Status and Other Selected Characteristics
(Derived from PY 2019 Q4 PIRL)
Veterans Receives
TANF Low
Income
Basic Skills/English
Deficient Ex-Offenders
Number of Exiters 34 61 1,859 2,686 229
Coenrollment
Any coenrollment 67.6 6.6 7.9 7.0 5.7
WIOA Adult 0.0 0.0 0.9 0.6 0.0
WIOA Dislocated Worker 0.0 0.0 0.1 0.0 0.0
Wagner-Peyser 64.7 4.9 4.4 3.3 4.4
Vocational Rehabilitation 0.0 0.0 1.1 1.2 0.0
Adult Education 2.9 1.6 0.6 2.0 0.9
Veterans’ programs 17.6 0.0 0.2 0.1 0.4
Vocational Education 0.0 0.0 1.0 0.2 0.0
Job Corps 0.0 0.0 0.1 0.0 0.4
YouthBuild 0.0 0.0 0.0 0.0 0.0
Other partner programs 0.0 0.0 0.1 0.0 0.0
Youth Program Elements
Tutoring, study skills, dropout prevention 17.6 13.1 19.3 21.7 13.1
Alternative school and dropout recovery 0.0 6.6 2.7 4.4 0.9
Paid and unpaid work experiences 44.1 55.7 48.3 45.2 43.2
Occupational skills training 76.5 54.1 57.2 57.0 62.9
Education offered concurrently 5.9 1.6 3.3 3.7 2.2
Leadership development opportunities 14.7 18.0 15.3 19.4 16.6
Supportive services 67.6 72.1 60.7 58.4 58.1
Adult mentoring 5.9 9.8 12.2 11.6 8.3
Comprehensive guidance and counseling 11.8 8.2 9.9 8.8 10.9
Financial literacy education 14.7 27.9 9.8 8.6 14.8
Entrepreneurial skills training 5.9 11.5 5.6 5.4 3.9
Labor market information 94.1 96.7 92.8 92.4 88.2
Postsecondary preparation and transition 8.8 3.3 4.2 5.3 4.4
Weeks Participated
Average number of weeks 72.7 69.3 67.2 57.8 56.1
4 or fewer weeks 0.0 0.0 1.9 2.1 3.1
5 to 13 weeks 2.9 0.0 6.1 7.4 7.4
14 to 26 weeks 2.9 16.4 16.9 19.4 18.8
27 to 52 weeks 26.5 27.9 26.9 29.4 31.4
53 to 104 weeks 50.0 41.0 29.6 28.3 25.3
More than 104 weeks 17.6 14.8 18.6 13.3 14.0

Youth
PY 2019 Illinois State Data Book 314
Veterans Receives
TANF Low
Income
Basic Skills/English
Deficient Ex-Offenders
Reason for Exit
Institutionalized, including criminal offenders
0.0 0.0 0.9 1.5 7.9
Health/medical 0.0 1.6 1.2 0.9 1.3
Deceased 0.0 0.0 0.1 0.1 0.0
Reserve called to active duty 0.0 0.0 0.1 0.1 0.0
Foster care 0.0 0.0 0.0 0.0 0.0
Other Youth Activities
Participated in postsecondary education 0.0 0.0 0.4 0.2 0.0
Received training 79.4 57.4 59.8 60.1 67.2
Types of Work Experience (among those with work experience)
Summer employment 21.4 22.6 27.8 28.5 21.2
On-the-job training 78.6 77.4 72.2 71.5 78.8
Other employment, including internships 0.0 0.0 0.0 0.0 0.0
Pre-apprenticeship programs 0.0 0.0 0.0 0.0 0.0
Job shadowing 0.0 0.0 3.2 2.6 7.1
Other work experience 0.0 0.0 0.0 0.0 0.0
Characteristics of Training (among trainees)
Number of trainees 27 35 1,112 1,615 154
Completed training 66.7 71.4 71.8 71.8 68.2
ITA established 3.7 8.6 4.7 3.8 1.9
Pell grant recipients 3.7 8.6 4.5 1.7 4.5
Program(s) operated by the private sector 33.3 57.1 48.3 48.7 56.5
Weeks of training
Average number of weeks 44.0 32.8 45.2 37.3 41.1
4 or fewer weeks 3.7 8.6 8.4 9.3 11.7
5 to 13 weeks 18.5 25.7 24.8 23.7 27.9
14 to 26 weeks 18.5 14.3 19.5 24.2 19.5
27 to 52 weeks 29.6 28.6 20.9 21.9 16.2
More than 52 weeks 29.6 22.9 26.4 20.9 24.7
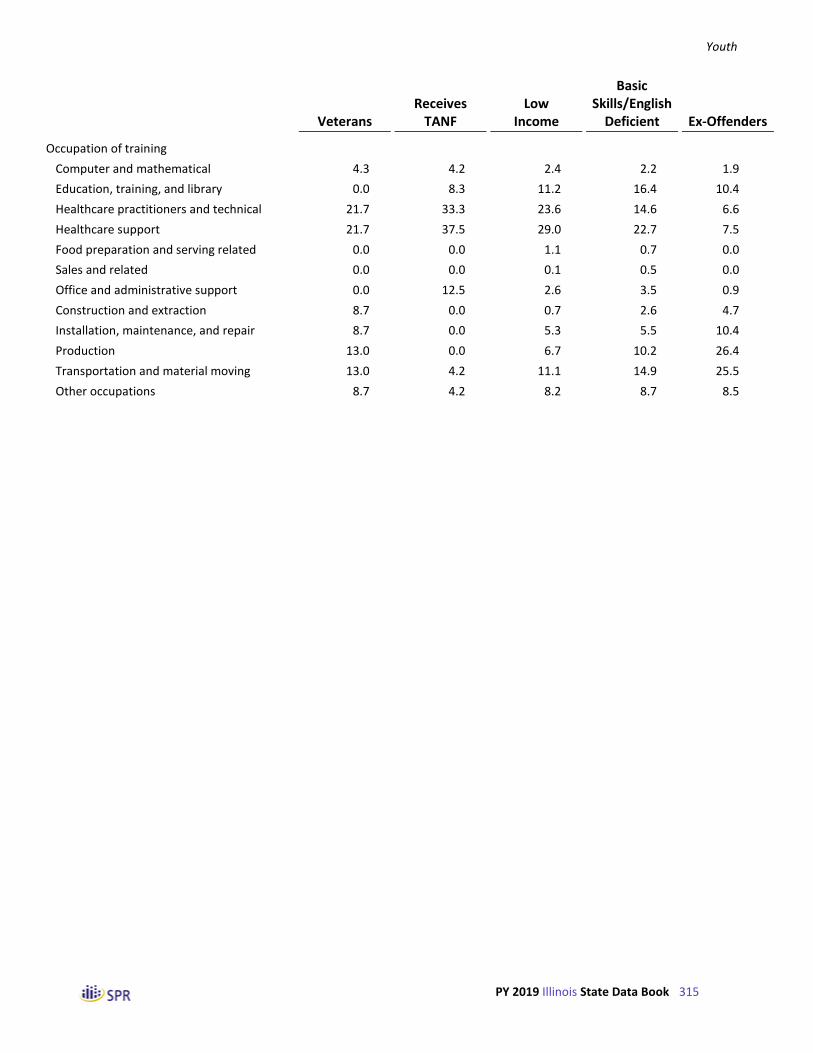
Youth
PY 2019 Illinois State Data Book 315
Veterans Receives
TANF Low
Income
Basic Skills/English
Deficient Ex-Offenders
Occupation of training
Computer and mathematical 4.3 4.2 2.4 2.2 1.9
Education, training, and library 0.0 8.3 11.2 16.4 10.4
Healthcare practitioners and technical 21.7 33.3 23.6 14.6 6.6
Healthcare support 21.7 37.5 29.0 22.7 7.5
Food preparation and serving related 0.0 0.0 1.1 0.7 0.0
Sales and related 0.0 0.0 0.1 0.5 0.0
Office and administrative support 0.0 12.5 2.6 3.5 0.9
Construction and extraction 8.7 0.0 0.7 2.6 4.7
Installation, maintenance, and repair 8.7 0.0 5.3 5.5 10.4
Production 13.0 0.0 6.7 10.2 26.4
Transportation and material moving 13.0 4.2 11.1 14.9 25.5
Other occupations 8.7 4.2 8.2 8.7 8.5

Youth
PY 2019 Illinois State Data Book 316
Table V-20 Services Received by Youth Who Exited from April 2019 to March 2020 in IL,
by Selected Barriers
(Derived from PY 2019 Q4 PIRL)
Homeless or Runaway Single Parents
Pregnant or Parenting
Needs Additional Assistance
Foster Care Youth
Number of Exiters 234 296 678 959 16
Coenrollment
Any coenrollment 3.4 14.5 8.3 7.0 6.3
WIOA Adult 0.4 1.7 0.7 0.9 0.0
WIOA Dislocated Worker 0.0 0.3 0.1 0.0 0.0
Wagner-Peyser 2.6 7.8 4.9 4.2 6.3
Vocational Rehabilitation 0.0 0.3 0.0 0.1 0.0
Adult Education 0.4 1.7 1.2 0.9 0.0
Veterans’ programs 0.4 0.3 0.0 0.2 0.0
Vocational Education 0.0 3.4 1.5 1.1 0.0
Job Corps 0.0 0.0 0.0 0.1 0.0
YouthBuild 0.0 0.0 0.0 0.0 0.0
Other partner programs 0.0 0.0 0.0 0.0 0.0
Youth Program Elements
Tutoring, study skills, dropout prevention 15.0 16.2 16.2 26.3 18.8
Alternative school and dropout recovery 2.1 0.3 2.4 2.3 6.3
Paid and unpaid work experiences 52.1 28.4 34.8 47.8 56.3
Occupational skills training 51.3 85.5 68.3 58.6 68.8
Education offered concurrently 2.1 4.1 3.4 2.7 0.0
Leadership development opportunities 11.1 14.5 8.8 22.0 25.0
Supportive services 67.1 65.5 64.5 62.6 43.8
Adult mentoring 6.4 9.8 10.5 17.5 43.8
Comprehensive guidance and counseling 10.7 7.1 9.7 11.4 12.5
Financial literacy education 15.0 9.1 9.3 8.6 18.8
Entrepreneurial skills training 3.8 3.4 2.9 4.4 18.8
Labor market information 96.6 91.9 93.8 90.3 93.8
Postsecondary preparation and transition 4.3 1.7 4.0 6.6 0.0
Weeks Participated
Average number of weeks 46.4 63.4 59.9 75.2 54.8
4 or fewer weeks 3.4 0.7 2.1 0.9 0.0
5 to 13 weeks 10.3 4.7 6.3 4.5 18.8
14 to 26 weeks 25.6 19.3 16.2 13.0 6.3
27 to 52 weeks 28.6 27.4 30.1 26.8 50.0
53 to 104 weeks 23.1 31.1 30.5 32.5 6.3
More than 104 weeks 9.0 16.9 14.7 22.2 18.8

Youth
PY 2019 Illinois State Data Book 317
Homeless or Runaway Single Parents
Pregnant or Parenting
Needs Additional Assistance
Foster Care Youth
Reason for Exit
Institutionalized, including criminal offenders
0.9 0.7 1.3 1.4 0.0
Health/medical 1.3 1.4 1.0 1.0 0.0
Deceased 0.0 0.3 0.1 0.0 0.0
Reserve called to active duty 0.4 0.0 0.0 0.1 0.0
Foster care 0.0 0.0 0.0 0.0 0.0
Other Youth Activities
Participated in postsecondary education 0.4 1.0 0.6 0.3 0.0
Received training 53.0 88.2 70.6 61.7 68.8
Types of Work Experience (among those with work experience)
Summer employment 21.8 24.3 21.4 27.3 22.2
On-the-job training 78.2 75.7 78.6 72.7 77.8
Other employment, including internships 0.0 0.0 0.0 0.0 0.0
Pre-apprenticeship programs 0.0 0.0 0.0 0.0 0.0
Job shadowing 1.0 6.8 4.5 2.5 11.1
Other work experience 0.0 0.0 0.0 0.0 0.0
Characteristics of Training (among trainees)
Number of trainees 124 261 479 592 11
Completed training 61.3 70.1 71.6 73.1 54.5
ITA established 7.3 4.2 5.6 2.4 9.1
Pell grant recipients 4.0 10.7 6.3 3.2 0.0
Program(s) operated by the private sector 58.9 40.6 48.0 38.9 27.3
Weeks of training
Average number of weeks 33.0 44.2 40.3 56.6 61.0
4 or fewer weeks 13.7 3.4 5.6 5.1 9.1
5 to 13 weeks 18.5 26.4 26.7 17.4 9.1
14 to 26 weeks 32.3 15.7 17.1 17.2 9.1
27 to 52 weeks 16.9 29.5 27.8 27.0 36.4
More than 52 weeks 18.5 24.9 22.8 33.3 36.4

Youth
PY 2019 Illinois State Data Book 318
Homeless or Runaway Single Parents
Pregnant or Parenting
Needs Additional Assistance
Foster Care Youth
Occupation of training
Computer and mathematical 2.9 0.0 0.3 6.0 0.0
Education, training, and library 3.9 16.0 7.6 10.8 0.0
Healthcare practitioners and technical 15.5 27.3 30.5 21.4 22.2
Healthcare support 17.5 44.3 43.7 30.2 0.0
Food preparation and serving related 0.0 0.0 0.3 0.9 0.0
Sales and related 0.0 0.5 0.3 0.6 0.0
Office and administrative support 1.9 1.5 2.0 3.9 0.0
Construction and extraction 1.0 0.5 0.8 1.7 0.0
Installation, maintenance, and repair 6.8 2.6 2.5 2.2 0.0
Production 12.6 2.6 2.5 5.6 11.1
Transportation and material moving 21.4 2.6 7.0 10.6 11.1
Other occupations 19.4 4.1 3.9 8.4 55.6

Youth
PY 2019 Illinois State Data Book 319
Table V-21 Services Received by Youth Who Exited from April 2019 to March 2020,
by State
(Derived from PY 2019 Q4 PIRL)
All Exiters Educational
Services Work
Experience Guidance and
Counseling Training Supportive
Services
Nation 80,693 48.5 99.1 84.8 35.1 50.8
Alabama 1,590 17.7 100.0 6.5 74.7 0.0
Alaska 206 21.8 100.0 100.0 89.8 43.2
Arizona 2,183 54.3 98.7 95.0 38.3 64.5
Arkansas 532 38.5 99.8 85.9 34.4 27.3
California 13,674 51.0 99.9 90.4 24.9 42.3
Colorado 1,558 54.6 99.7 87.2 20.0 62.8
Connecticut 817 33.9 98.2 92.8 77.8 22.5
Delaware 148 75.7 100.0 95.3 74.3 58.8
District of Columbia 301 14.3 100.0 22.6 82.1 15.3
Florida 3,270 70.5 96.0 50.3 80.3 88.9
Georgia 2,718 53.3 96.4 70.3 22.3 59.5
Guam - - - - - -
Hawaii 127 61.4 95.3 100.0 39.4 60.6
Idaho 429 76.2 99.5 98.8 38.0 62.7
Illinois 3,586 25.1 98.0 99.1 60.0 59.2
Indiana 2,276 72.3 99.6 96.8 15.6 46.7
Iowa 340 4.7 96.5 87.9 78.5 82.6
Kansas 347 51.9 99.7 82.4 29.1 22.5
Kentucky 1,413 3.0 98.6 48.7 13.4 16.3
Louisiana 1,212 21.9 99.3 67.2 36.6 24.1
Maine 247 19.0 96.4 89.1 44.1 70.9
Maryland 813 72.0 99.9 94.3 63.2 31.1
Massachusetts 922 72.3 100.0 95.1 58.6 41.2
Michigan 1,809 50.7 96.1 67.3 23.1 46.9
Minnesota 915 97.8 96.7 96.8 32.9 36.3
Mississippi 1,360 49.0 100.0 94.2 15.1 4.6
Missouri 1,134 66.8 99.1 67.8 57.0 43.8
Montana 104 64.4 100.0 99.0 51.0 51.0
Nebraska 204 41.7 98.0 90.2 49.0 38.7
Nevada 835 36.5 100.0 87.4 20.4 80.6
New Hampshire 184 95.1 100.0 100.0 54.9 55.4
New Jersey 1,927 48.8 99.9 88.3 29.4 69.7
New Mexico 757 75.6 100.0 68.3 63.3 31.0
New York 4,598 79.8 99.8 92.1 34.7 57.3
North Carolina 2,641 40.5 98.7 99.7 33.8 44.1
North Dakota 153 27.5 100.0 58.2 41.2 40.5

Youth
PY 2019 Illinois State Data Book 320
All Exiters Educational
Services Work
Experience Guidance and
Counseling Training Supportive
Services
Northern Mariana Islands
24 0.0 100.0 29.2 0.0 66.7
Ohio 3,755 59.5 99.5 83.4 30.6 72.4
Oklahoma 915 46.4 99.5 95.4 48.1 26.4
Oregon 843 62.9 98.6 99.9 24.6 57.2
Palau 140 0.0 100.0 0.0 1.4 0.0
Pennsylvania 3,368 54.2 99.9 96.0 32.4 49.7
Puerto Rico - - - - - -
Rhode Island 333 63.4 100.0 72.1 27.0 3.0
South Carolina 1,787 56.4 99.7 93.1 38.9 54.4
South Dakota 431 29.5 99.8 83.5 14.2 29.2
Tennessee 2,436 28.1 99.6 93.8 41.1 57.1
Texas 5,848 8.3 100.0 87.4 18.3 57.8
Utah 551 91.7 89.8 59.7 21.1 97.3
Vermont 173 53.8 100.0 75.7 31.8 36.4
Virgin Islands 51 2.0 100.0 72.5 23.5 9.8
Virginia 1,113 30.6 99.1 97.2 43.4 59.2
Washington 1,983 55.8 100.0 88.3 21.5 67.2
West Virginia 523 77.6 98.3 75.9 29.6 48.9
Wisconsin 923 40.3 97.5 96.6 46.6 45.6
Wyoming 166 82.5 99.4 100.0 9.6 84.9

Youth
PY 2019 Illinois State Data Book 321
Table V-22 Trends in the Outcomes of Youth, by Performance Period
(Derived from WIASRD and PIRL Files)
Nation Performance IL Performance
PY 2017 PY 2018 PY 2019 PY 2017 PY 2018 PY 2019
WIOA Primary Indicators of Performance
Employment or education 2nd quarter after exit1
72.7 73.6 73.1 75.5 78.1 77.2
Employment or education 4th quarter after exit2
-- 72.7 73.4 -- 75.8 77.3
Median earnings 2nd quarter after exit1
$3,040 $3,331 $3,518 $3,065 $3,619 $3,765
Credential attainment2 -- 62.8 63.4 -- 67.8 70.5
Measurable skill gains (among participants)3
36.8 46.8 47.0 39.6 44.4 40.2
School Status at Exit4
In-school 14.7 13.0 14.4 11.2 10.1 9.9
Secondary school or below 6.5 5.3 6.8 1.7 0.8 2.3
Alternative school 1.2 1.2 1.5 0.6 0.1 0.5
Postsecondary school 7.0 6.5 6.2 8.9 9.2 7.1
Not attending 85.3 87.0 85.6 88.8 89.9 90.1
Secondary school dropout 22.5 22.4 19.6 15.9 15.9 13.3
Secondary school graduates or equivalent
61.5 63.6 65.0 72.9 72.9 76.2
Within age of compulsory attendance
1.3 1.0 1.0 0.0 1.1 0.6
Quarterly Employment Rate
First quarter after exit5 67.2 69.6 68.5 74.5 77.1 76.6
Second quarter after exit1 67.1 68.9 68.8 73.5 74.7 74.7
Third quarter after exit6 -- 68.7 69.3 -- 73.9 74.0
Fourth quarter after exit2 -- 69.8 70.6 -- 74.2 75.8
Quarterly Median Earnings (among those employed)
First quarter after exit5 $2,905 $3,122 $3,294 $3,071 $3,424 $3,639
Second quarter after exit1 $3,040 $3,331 $3,518 $3,065 $3,619 $3,765
Third quarter after exit6 -- $3,379 $3,597 -- $3,600 $3,704
Fourth quarter after exit2 -- $3,528 $3,740 -- $3,672 $3,969
Type of Second Quarter Placement1
Unsubsidized employment 6.4 6.0 5.9 0.0 0.0 0.0
Registered apprenticeship 8.3 7.3 6.0 4.0 6.3 4.4
Military 1.1 1.1 1.7 0.1 0.1 0.3
Occupational skills training 0.0 0.0 0.0 0.0 0.0 0.0
Postsecondary education 0.0 0.0 0.0 0.0 0.0 0.0

Youth
PY 2019 Illinois State Data Book 322
Nation Performance IL Performance
PY 2017 PY 2018 PY 2019 PY 2017 PY 2018 PY 2019
Secondary education 0.0 0.0 0.0 0.0 0.0 0.0
Type of Fourth Quarter Placement2
Unsubsidized employment -- 5.2 5.4 -- 0.0 0.0
Registered apprenticeship -- 5.3 5.0 -- 3.4 3.2
Military -- 0.6 1.0 -- 0.1 0.2
Occupational skills training -- 0.0 0.0 -- 0.0 0.0
Postsecondary education -- 0.0 0.0 -- 0.0 0.0
Secondary education -- 0.0 0.0 -- 0.0 0.0
Nontraditional Employment1
Females 1.9 1.2 1.3 2.9 3.4 3.4
Males 2.5 1.7 1.5 5.5 5.0 4.9
Characteristics of Second Quarter Employment (among those employed)1
Average quarterly earnings $3,650 $4,036 $4,204 $3,677 $4,220 $4,455
$1 to $2,499 42.2 39.1 37.3 42.5 35.8 34.9
$2,500 to $4,999 32.1 30.7 29.8 31.7 31.4 28.7
$5,000 to $7,499 16.5 18.5 19.2 16.5 19.2 20.7
$7,500 to $9,999 5.6 7.1 8.2 5.4 7.5 8.1
$10,000 or more 3.6 4.6 5.5 4.0 6.1 7.6
Occupation of employment
Computer and mathematical 0.6 0.6 0.6 0.3 0.1 0.6
Education, training, and library 1.5 1.5 1.6 1.4 0.7 1.7
Healthcare practitioners and technical
2.2 2.7 2.7 1.7 2.3 2.8
Healthcare support 9.3 9.5 10.7 11.7 14.6 11.9
Food preparation and serving 15.5 15.0 14.9 22.0 16.6 17.0
Personal care and service 4.5 4.4 5.0 3.7 4.2 3.9
Sales and related 18.1 16.1 14.8 17.3 15.0 12.3
Office and administrative support 17.3 16.0 15.8 14.0 11.7 14.8
Construction and extraction 2.8 3.2 3.2 0.3 1.4 2.2
Installation, maintenance, and repair
2.5 3.0 2.7 2.3 2.5 2.2
Production 7.9 8.8 8.9 5.6 6.9 8.5
Transportation and material moving 7.0 7.8 8.1 11.1 12.8 10.1
Other occupations 10.8 11.4 11.0 8.4 11.1 12.1

Youth
PY 2019 Illinois State Data Book 323
Nation Performance IL Performance
PY 2017 PY 2018 PY 2019 PY 2017 PY 2018 PY 2019
Types of Credentials Attained (among those with a credential attainment)2
Secondary school diploma/equivalency
-- 51.2 50.6 -- 53.3 50.4
AA, AS, BA, BS or other college -- 1.8 1.8 -- 2.3 3.2
Postgraduate degree -- 5.7 7.3 -- 9.8 13.4
Occupational credential -- 50.1 50.3 -- 42.3 44.0
Other credential -- 0.0 0.0 -- 0.0 0.0
Types of Skill Gains (among those with a measurable skill gain)3
Educational functional gains 5.6 7.7 19.4 1.3 2.5 8.1
Secondary school gains 7.7 10.3 26.2 2.8 5.2 11.5
Postsecondary school gains 15.8 17.8 41.5 9.2 13.1 27.5
Training milestone gains 4.2 7.1 17.9 2.6 5.8 11.9
Occupational skills progression 10.4 17.1 43.3 17.0 25.5 60.3
1 Measured for a four-quarter exit cohort ending with those who exited four quarters prior to the end of the performance quarter.
2 Measured for a four-quarter exit cohort ending with those who exited six quarters prior to the end of the performance quarter.
3 Measured for those who participated during this program year.
4 Measured for a four-quarter exit cohort ending with those who exited one quarter prior to the end of the performance quarter.
5 Measured for a four-quarter exit cohort ending with those who exited three quarters prior to the end of the performance quarter
6 Measured for a four-quarter exit cohort ending with those who exited five quarters prior to the end of the performance quarter.

Youth
PY 2019 Illinois State Data Book 324
Table V-23 Trends in the Number of Youth Who Achieved Various Outcomes, by Performance Period
(Derived from WIASRD and PIRL Files)
Nation Performance IL Performance
PY 2017 PY 2018 PY 2019 PY 2017 PY 2018 PY 2019
WIOA Primary Indicators of Performance
Employment or education 2nd quarter after exit1
58,728 57,882 58,345 2,634 2,768 3,084
Employment or education 4th quarter after exit2
-- 58,204 57,720 -- 2,458 2,965
Credential attainment2 -- 30,730 29,926 -- 1,430 1,658
Measurable skill gains (among participants)3
13,778 38,866 36,002 742 1,700 1,477
School Status at Exit4
In-school 11,854 10,507 11,553 382 400 352
Secondary school or below 5,270 4,301 5,444 58 33 81
Alternative school 975 996 1,172 20 5 17
Postsecondary school 5,609 5,210 4,937 304 362 254
Not attending 68,840 70,086 68,573 3,038 3,542 3,217
Secondary school dropout 18,193 18,041 15,744 544 625 475
Secondary school graduates or equivalent
49,591 51,260 52,067 2,494 2,875 2,719
Within age of compulsory attendance
1,056 785 762 0 42 23
Quarterly Employment Rate
First quarter after exit5 53,645 54,401 54,939 2,431 2,904 2,888
Second quarter after exit1 54,264 54,158 54,956 2,566 2,646 2,982
Third quarter after exit6 -- 54,705 55,270 -- 2,484 2,872
Fourth quarter after exit2 -- 55,875 55,500 -- 2,405 2,910
Type of Second Quarter Placement1
Unsubsidized employment 5,306 4,863 4,820 0 1 2
Registered apprenticeship 6,883 5,850 4,890 143 228 181
Military 938 868 1,355 2 5 11
Occupational skills training 0 0 0 0 0 0
Postsecondary education 0 0 0 0 0 0
Secondary education 0 0 0 0 0 0

Youth
PY 2019 Illinois State Data Book 325
Nation Performance IL Performance
PY 2017 PY 2018 PY 2019 PY 2017 PY 2018 PY 2019
Type of Fourth Quarter Placement2
Unsubsidized employment -- 4,228 4,305 -- 1 0
Registered apprenticeship -- 4,314 4,010 -- 114 124
Military -- 520 789 -- 3 7
Occupational skills training -- 0 0 -- 0 0
Postsecondary education -- 0 0 -- 0 0
Secondary education -- 0 0 -- 0 0
Nontraditional Employment1
Females 465 303 316 40 50 56
Males 477 333 300 62 60 64
Characteristics of Second Quarter Employment (among those employed)1
Quarterly earnings
$1 to $2,499 23,163 21,406 20,656 1,103 963 1,049
$2,500 to $4,999 17,604 16,809 16,501 822 843 861
$5,000 to $7,499 9,052 10,136 10,658 428 516 623
$7,500 to $9,999 3,070 3,867 4,568 141 202 242
$10,000 or more 1,949 2,541 3,021 103 163 228
Occupation of employment
Computer and mathematical 103 117 113 2 1 6
Education, training, and library 264 306 301 9 6 17
Healthcare practitioners and technical
392 547 523 11 20 27
Healthcare support 1,636 1,903 2,070 75 125 116
Food preparation and serving 2,734 3,010 2,892 141 142 166
Personal care and service 798 881 966 24 36 38
Sales and related 3,202 3,223 2,867 111 128 120
Office and administrative support 3,047 3,217 3,075 90 100 144
Construction and extraction 493 651 630 2 12 21
Installation, maintenance, and repair
447 594 530 15 21 21
Production 1,392 1,767 1,732 36 59 83
Transportation and material moving 1,244 1,567 1,563 71 109 99
Other occupations 1,911 2,291 2,141 54 95 118

Youth
PY 2019 Illinois State Data Book 326
Nation Performance IL Performance
PY 2017 PY 2018 PY 2019 PY 2017 PY 2018 PY 2019
Types of Credentials Attained (among those with a credential attainment)2
Secondary school diploma/equivalency
-- 15,721 15,152 -- 762 836
AA, AS, BA, BS or other college -- 547 535 -- 33 53
Postgraduate degree -- 1,744 2,184 -- 140 223
Occupational credential -- 15,386 15,052 -- 605 729
Other credential -- 0 0 -- 0 0
Types of Skill Gains (among those with a measurable skill gain)3
Educational functional gains 778 3,010 6,997 10 43 119
Secondary school gains 1,059 3,990 9,440 21 88 170
Postsecondary school gains 2,175 6,925 14,949 68 223 406
Training milestone gains 579 2,772 6,461 19 98 176
Occupational skills progression 1,428 6,632 15,592 126 434 890
1 Measured for a four-quarter exit cohort ending with those who exited four quarters prior to the end of the performance quarter.
2 Measured for a four-quarter exit cohort ending with those who exited six quarters prior to the end of the performance quarter.
3 Measured for those who participated during this program year.
4 Measured for a four-quarter exit cohort ending with those who exited one quarter prior to the end of the performance quarter.
5 Measured for a four-quarter exit cohort ending with those who exited three quarters prior to the end of the performance quarter
6 Measured for a four-quarter exit cohort ending with those who exited five quarters prior to the end of the performance quarter.
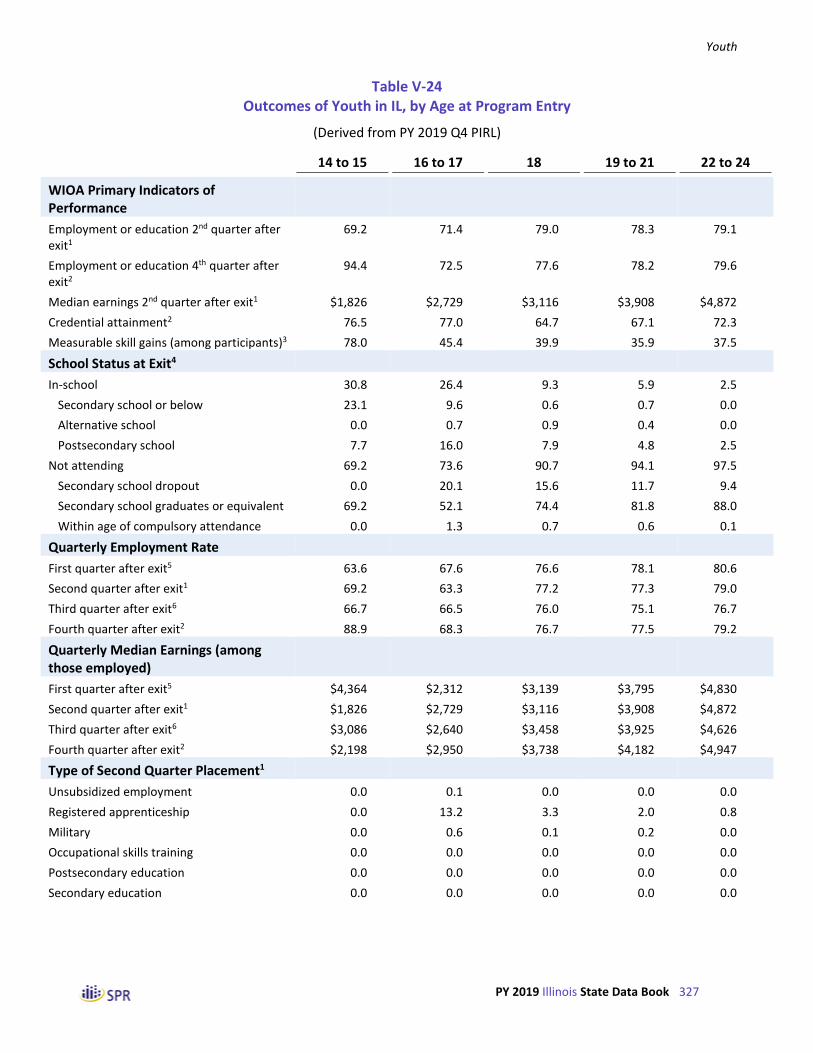
Youth
PY 2019 Illinois State Data Book 327
Table V-24 Outcomes of Youth in IL, by Age at Program Entry
(Derived from PY 2019 Q4 PIRL)
14 to 15 16 to 17 18 19 to 21 22 to 24
WIOA Primary Indicators of Performance
Employment or education 2nd quarter after exit1
69.2 71.4 79.0 78.3 79.1
Employment or education 4th quarter after exit2
94.4 72.5 77.6 78.2 79.6
Median earnings 2nd quarter after exit1 $1,826 $2,729 $3,116 $3,908 $4,872
Credential attainment2 76.5 77.0 64.7 67.1 72.3
Measurable skill gains (among participants)3 78.0 45.4 39.9 35.9 37.5
School Status at Exit4
In-school 30.8 26.4 9.3 5.9 2.5
Secondary school or below 23.1 9.6 0.6 0.7 0.0
Alternative school 0.0 0.7 0.9 0.4 0.0
Postsecondary school 7.7 16.0 7.9 4.8 2.5
Not attending 69.2 73.6 90.7 94.1 97.5
Secondary school dropout 0.0 20.1 15.6 11.7 9.4
Secondary school graduates or equivalent 69.2 52.1 74.4 81.8 88.0
Within age of compulsory attendance 0.0 1.3 0.7 0.6 0.1
Quarterly Employment Rate
First quarter after exit5 63.6 67.6 76.6 78.1 80.6
Second quarter after exit1 69.2 63.3 77.2 77.3 79.0
Third quarter after exit6 66.7 66.5 76.0 75.1 76.7
Fourth quarter after exit2 88.9 68.3 76.7 77.5 79.2
Quarterly Median Earnings (among those employed)
First quarter after exit5 $4,364 $2,312 $3,139 $3,795 $4,830
Second quarter after exit1 $1,826 $2,729 $3,116 $3,908 $4,872
Third quarter after exit6 $3,086 $2,640 $3,458 $3,925 $4,626
Fourth quarter after exit2 $2,198 $2,950 $3,738 $4,182 $4,947
Type of Second Quarter Placement1
Unsubsidized employment 0.0 0.1 0.0 0.0 0.0
Registered apprenticeship 0.0 13.2 3.3 2.0 0.8
Military 0.0 0.6 0.1 0.2 0.0
Occupational skills training 0.0 0.0 0.0 0.0 0.0
Postsecondary education 0.0 0.0 0.0 0.0 0.0
Secondary education 0.0 0.0 0.0 0.0 0.0
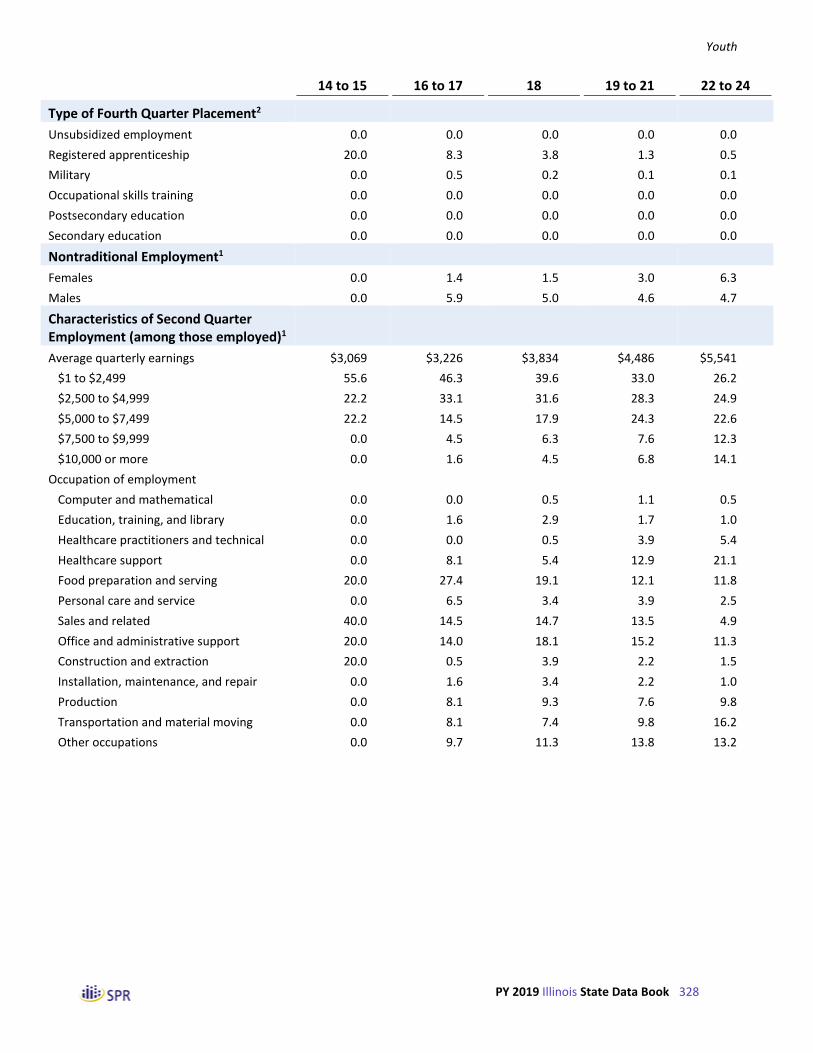
Youth
PY 2019 Illinois State Data Book 328
14 to 15 16 to 17 18 19 to 21 22 to 24
Type of Fourth Quarter Placement2
Unsubsidized employment 0.0 0.0 0.0 0.0 0.0
Registered apprenticeship 20.0 8.3 3.8 1.3 0.5
Military 0.0 0.5 0.2 0.1 0.1
Occupational skills training 0.0 0.0 0.0 0.0 0.0
Postsecondary education 0.0 0.0 0.0 0.0 0.0
Secondary education 0.0 0.0 0.0 0.0 0.0
Nontraditional Employment1
Females 0.0 1.4 1.5 3.0 6.3
Males 0.0 5.9 5.0 4.6 4.7
Characteristics of Second Quarter Employment (among those employed)1
Average quarterly earnings $3,069 $3,226 $3,834 $4,486 $5,541
$1 to $2,499 55.6 46.3 39.6 33.0 26.2
$2,500 to $4,999 22.2 33.1 31.6 28.3 24.9
$5,000 to $7,499 22.2 14.5 17.9 24.3 22.6
$7,500 to $9,999 0.0 4.5 6.3 7.6 12.3
$10,000 or more 0.0 1.6 4.5 6.8 14.1
Occupation of employment
Computer and mathematical 0.0 0.0 0.5 1.1 0.5
Education, training, and library 0.0 1.6 2.9 1.7 1.0
Healthcare practitioners and technical 0.0 0.0 0.5 3.9 5.4
Healthcare support 0.0 8.1 5.4 12.9 21.1
Food preparation and serving 20.0 27.4 19.1 12.1 11.8
Personal care and service 0.0 6.5 3.4 3.9 2.5
Sales and related 40.0 14.5 14.7 13.5 4.9
Office and administrative support 20.0 14.0 18.1 15.2 11.3
Construction and extraction 20.0 0.5 3.9 2.2 1.5
Installation, maintenance, and repair 0.0 1.6 3.4 2.2 1.0
Production 0.0 8.1 9.3 7.6 9.8
Transportation and material moving 0.0 8.1 7.4 9.8 16.2
Other occupations 0.0 9.7 11.3 13.8 13.2

Youth
PY 2019 Illinois State Data Book 329
14 to 15 16 to 17 18 19 to 21 22 to 24
Types of Credentials Attained (among those with a credential attainment)2
Secondary school diploma/equivalency 100.0 89.5 66.9 34.3 17.0
AA, AS, BA, BS or other college 0.0 1.1 5.8 4.6 1.9
Postgraduate degree 7.7 0.4 5.4 17.0 28.4
Occupational credential 0.0 16.0 33.9 56.1 66.7
Other credential 0.0 0.0 0.0 0.0 0.0
Types of Skill Gains (among those with a measurable skill gain)3
Educational functional gains 0.0 6.9 10.0 10.0 6.1
Secondary school gains 2.2 13.0 17.6 12.0 4.5
Postsecondary school gains 34.8 50.1 28.6 16.4 11.0
Training milestone gains 0.0 2.0 6.9 17.4 23.9
Occupational skills progression 67.4 46.9 59.3 66.7 69.3
1 Based on those who exited from July 2018 to June 2019.
2 Based on those who exited from January 2018 to December 2018.
3 Based on those who participated between July 2019 and June 2020.
4 Based on those who exited from October 2018 to September 2019.
5 Based on those who exited from April 2018 to March 2019.

Youth
PY 2019 Illinois State Data Book 330
Table V-25 Outcomes of Youth in IL, by Ethnicity and Race6
(Derived from PY 2019 Q4 PIRL)
Ethnicity Race
Hispanic Not Hispanic White Only Black Only Other
WIOA Primary Indicators of Performance
Employment or education 2nd quarter after exit1
78.2 77.0 77.5 78.6 67.7
Employment or education 4th quarter after exit2
77.5 77.2 78.5 78.1 62.7
Median earnings 2nd quarter after exit1 $4,353 $3,607 $3,702 $3,718 $3,156
Credential attainment2 67.4 71.4 71.1 72.6 75.0
Measurable skill gains (among participants)3 36.1 41.4 43.6 37.4 41.0
School Status at Exit4
In-school 11.1 9.5 9.5 7.5 26.7
Secondary school or below 0.9 2.6 2.3 1.6 11.4
Alternative school 0.3 0.5 0.0 0.9 0.6
Postsecondary school 10.0 6.3 7.2 5.1 14.8
Not attending 88.9 90.5 90.5 92.5 73.3
Secondary school dropout 12.6 13.5 17.0 10.0 11.9
Secondary school graduates or equivalent 75.5 76.4 73.1 81.8 60.8
Within age of compulsory attendance 0.8 0.6 0.4 0.7 0.6
Quarterly Employment Rate
First quarter after exit5 76.3 76.7 74.7 78.4 68.0
Second quarter after exit1 76.0 74.3 75.0 77.0 55.5
Third quarter after exit6 75.9 73.5 76.5 73.7 60.2
Fourth quarter after exit2 76.5 75.6 76.7 76.6 62.7
Quarterly Median Earnings (among those employed)
First quarter after exit5 $4,443 $3,464 $3,639 $3,580 $2,931
Second quarter after exit1 $4,353 $3,608 $3,702 $3,718 $3,156
Third quarter after exit6 $4,297 $3,512 $3,754 $3,563 $3,231
Fourth quarter after exit2 $5,124 $3,637 $4,123 $3,629 $3,267
Type of Second Quarter Placement1
Unsubsidized employment 0.2 0.0 0.1 0.0 0.0
Registered apprenticeship 4.8 4.3 5.0 3.2 12.8
Military 0.5 0.2 0.3 0.3 0.0
Occupational skills training 0.0 0.0 0.0 0.0 0.0
Postsecondary education 0.0 0.0 0.0 0.0 0.0
Secondary education 0.0 0.0 0.0 0.0 0.0

Youth
PY 2019 Illinois State Data Book 331
Ethnicity Race
Hispanic Not Hispanic White Only Black Only Other
Type of Fourth Quarter Placement2
Unsubsidized employment 0.0 0.0 0.0 0.0 0.0
Registered apprenticeship 2.7 3.3 3.0 3.5 2.1
Military 0.5 0.1 0.1 0.2 0.0
Occupational skills training 0.0 0.0 0.0 0.0 0.0
Postsecondary education 0.0 0.0 0.0 0.0 0.0
Secondary education 0.0 0.0 0.0 0.0 0.0
Nontraditional Employment1
Females 2.3 3.7 1.8 4.9 3.1
Males 4.9 4.9 5.6 4.7 1.7
Characteristics of Second Quarter Employment (among those employed)1
Average quarterly earnings $5,055 $4,286 $4,450 $4,357 $4,122
$1 to $2,499 27.8 36.9 34.8 36.6 41.7
$2,500 to $4,999 28.5 28.7 28.8 27.8 31.5
$5,000 to $7,499 24.7 19.6 21.1 20.2 15.0
$7,500 to $9,999 9.1 7.8 8.4 7.7 3.1
$10,000 or more 9.9 7.0 6.9 7.6 8.7
Occupation of employment
Computer and mathematical 0.9 0.5 0.6 0.4 0.0
Education, training, and library 1.4 1.8 2.0 1.3 5.6
Healthcare practitioners and technical 1.9 3.0 3.1 2.6 2.8
Healthcare support 6.1 13.5 11.3 13.0 13.9
Food preparation and serving 17.9 16.8 20.7 15.8 11.1
Personal care and service 3.3 4.1 4.8 3.2 2.8
Sales and related 12.3 12.3 10.8 11.9 19.4
Office and administrative support 19.3 13.5 11.6 16.2 19.4
Construction and extraction 4.2 1.6 2.3 1.3 2.8
Installation, maintenance, and repair 0.5 2.6 4.8 0.9 0.0
Production 9.0 8.4 9.1 8.0 5.6
Transportation and material moving 11.3 9.8 9.3 10.8 5.6
Other occupations 11.8 12.2 9.6 14.7 11.1
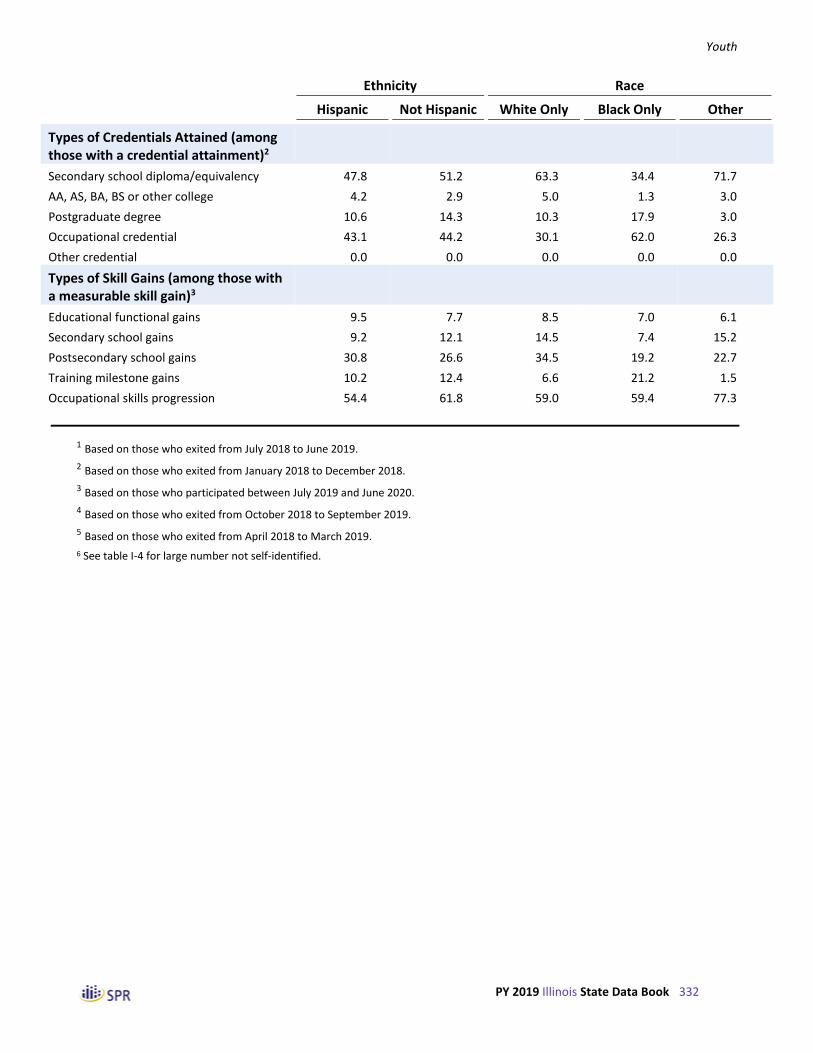
Youth
PY 2019 Illinois State Data Book 332
Ethnicity Race
Hispanic Not Hispanic White Only Black Only Other
Types of Credentials Attained (among those with a credential attainment)2
Secondary school diploma/equivalency 47.8 51.2 63.3 34.4 71.7
AA, AS, BA, BS or other college 4.2 2.9 5.0 1.3 3.0
Postgraduate degree 10.6 14.3 10.3 17.9 3.0
Occupational credential 43.1 44.2 30.1 62.0 26.3
Other credential 0.0 0.0 0.0 0.0 0.0
Types of Skill Gains (among those with a measurable skill gain)3
Educational functional gains 9.5 7.7 8.5 7.0 6.1
Secondary school gains 9.2 12.1 14.5 7.4 15.2
Postsecondary school gains 30.8 26.6 34.5 19.2 22.7
Training milestone gains 10.2 12.4 6.6 21.2 1.5
Occupational skills progression 54.4 61.8 59.0 59.4 77.3
1 Based on those who exited from July 2018 to June 2019.
2 Based on those who exited from January 2018 to December 2018.
3 Based on those who participated between July 2019 and June 2020.
4 Based on those who exited from October 2018 to September 2019.
5 Based on those who exited from April 2018 to March 2019.
6 See table I-4 for large number not self-identified.

Youth
PY 2019 Illinois State Data Book 333
Table V-26 Outcomes of Youth in IL, by Gender, Employment Status, and Disability Status
(Derived from PY 2019 Q4 PIRL)
Gender Employment Status Has a
Female Male Employed Not Employed Disability
WIOA Primary Indicators of Performance
Employment or education 2nd quarter after exit1
79.7 74.3 90.3 73.4 75.3
Employment or education 4th quarter after exit2
78.7 75.5 87.9 74.2 76.0
Median earnings 2nd quarter after exit1 $3,706 $3,801 $4,885 $3,288 $2,897
Credential attainment2 71.5 69.3 72.3 69.7 67.9
Measurable skill gains (among participants)3 39.2 41.5 44.9 38.0 44.0
School Status at Exit4
In-school 10.9 8.7 6.2 11.0 15.1
Secondary school or below 2.3 2.2 0.6 2.8 3.8
Alternative school 0.7 0.3 0.0 0.6 0.2
Postsecondary school 8.0 6.2 5.7 7.6 11.1
Not attending 89.1 91.3 93.8 89.0 84.9
Secondary school dropout 12.3 14.5 9.3 14.6 8.5
Secondary school graduates or equivalent 76.2 76.1 83.9 73.7 76.5
Within age of compulsory attendance 0.6 0.7 0.6 0.7 0.0
Quarterly Employment Rate
First quarter after exit5 78.7 74.1 89.7 72.4 73.3
Second quarter after exit1 77.1 71.7 89.4 70.3 71.2
Third quarter after exit6 76.4 71.1 87.7 70.1 72.9
Fourth quarter after exit2 77.3 74.1 87.4 72.5 72.4
Quarterly Median Earnings (among those employed)
First quarter after exit5 $3,581 $3,728 $4,710 $3,243 $3,141
Second quarter after exit1 $3,706 $3,801 $4,885 $3,288 $2,897
Third quarter after exit6 $3,583 $3,930 $4,979 $3,281 $3,047
Fourth quarter after exit2 $3,732 $4,284 $5,197 $3,600 $3,387
Type of Second Quarter Placement1
Unsubsidized employment 0.1 0.0 0.0 0.1 0.2
Registered apprenticeship 5.3 3.5 3.5 4.7 6.2
Military 0.3 0.2 0.1 0.3 0.6
Occupational skills training 0.0 0.0 0.0 0.0 0.0
Postsecondary education 0.0 0.0 0.0 0.0 0.0
Secondary education 0.0 0.0 0.0 0.0 0.0
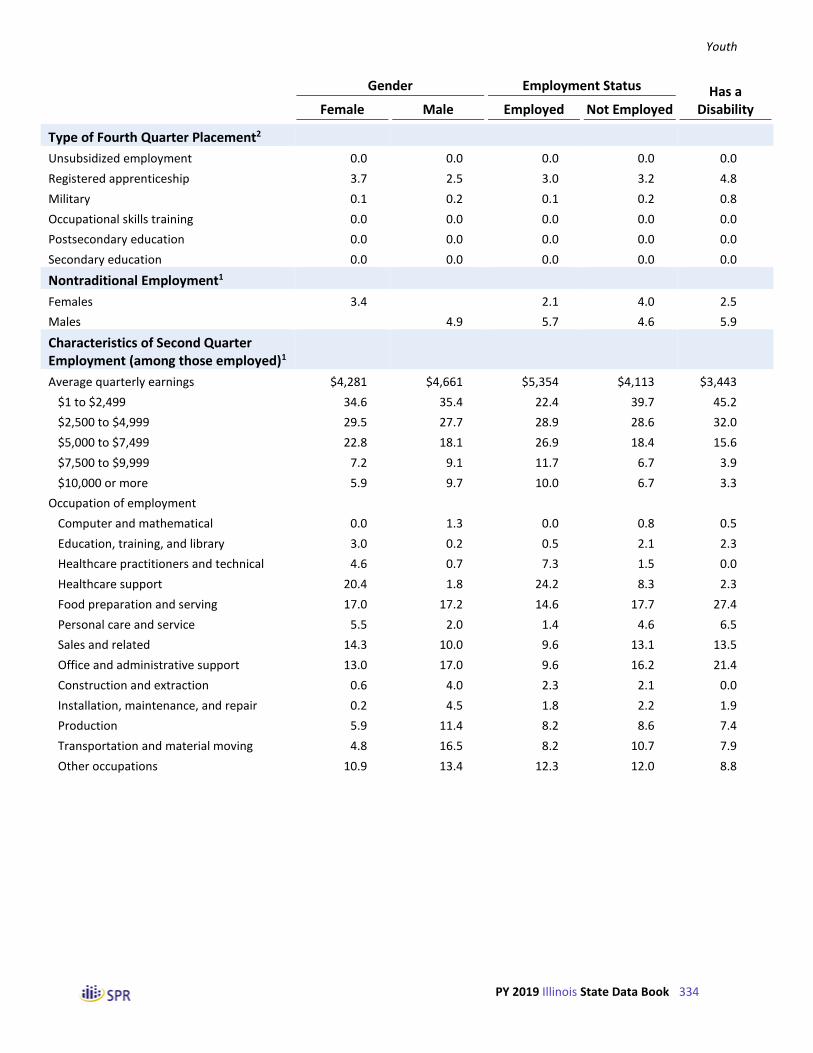
Youth
PY 2019 Illinois State Data Book 334
Gender Employment Status Has a
Female Male Employed Not Employed Disability
Type of Fourth Quarter Placement2
Unsubsidized employment 0.0 0.0 0.0 0.0 0.0
Registered apprenticeship 3.7 2.5 3.0 3.2 4.8
Military 0.1 0.2 0.1 0.2 0.8
Occupational skills training 0.0 0.0 0.0 0.0 0.0
Postsecondary education 0.0 0.0 0.0 0.0 0.0
Secondary education 0.0 0.0 0.0 0.0 0.0
Nontraditional Employment1
Females 3.4 2.1 4.0 2.5
Males 4.9 5.7 4.6 5.9
Characteristics of Second Quarter Employment (among those employed)1
Average quarterly earnings $4,281 $4,661 $5,354 $4,113 $3,443
$1 to $2,499 34.6 35.4 22.4 39.7 45.2
$2,500 to $4,999 29.5 27.7 28.9 28.6 32.0
$5,000 to $7,499 22.8 18.1 26.9 18.4 15.6
$7,500 to $9,999 7.2 9.1 11.7 6.7 3.9
$10,000 or more 5.9 9.7 10.0 6.7 3.3
Occupation of employment
Computer and mathematical 0.0 1.3 0.0 0.8 0.5
Education, training, and library 3.0 0.2 0.5 2.1 2.3
Healthcare practitioners and technical 4.6 0.7 7.3 1.5 0.0
Healthcare support 20.4 1.8 24.2 8.3 2.3
Food preparation and serving 17.0 17.2 14.6 17.7 27.4
Personal care and service 5.5 2.0 1.4 4.6 6.5
Sales and related 14.3 10.0 9.6 13.1 13.5
Office and administrative support 13.0 17.0 9.6 16.2 21.4
Construction and extraction 0.6 4.0 2.3 2.1 0.0
Installation, maintenance, and repair 0.2 4.5 1.8 2.2 1.9
Production 5.9 11.4 8.2 8.6 7.4
Transportation and material moving 4.8 16.5 8.2 10.7 7.9
Other occupations 10.9 13.4 12.3 12.0 8.8

Youth
PY 2019 Illinois State Data Book 335
Gender Employment Status Has a
Female Male Employed Not Employed Disability
Types of Credentials Attained (among those with a credential attainment)2
Secondary school diploma/equivalency 46.0 56.5 37.8 55.8 73.4
AA, AS, BA, BS or other college 3.9 2.3 6.2 1.9 3.2
Postgraduate degree 13.4 13.6 20.5 10.4 4.1
Occupational credential 49.5 36.4 50.7 41.1 26.1
Other credential 0.0 0.0 0.0 0.0 0.0
Types of Skill Gains (among those with a measurable skill gain)3
Educational functional gains 8.5 7.6 6.9 8.7 4.5
Secondary school gains 10.7 12.4 11.8 11.4 8.4
Postsecondary school gains 28.6 26.1 26.7 27.9 40.8
Training milestone gains 13.1 10.5 11.4 12.2 9.0
Occupational skills progression 58.5 62.4 66.6 56.6 49.5
1 Based on those who exited from July 2018 to June 2019.
2 Based on those who exited from January 2018 to December 2018.
3 Based on those who participated between July 2019 and June 2020.
4 Based on those who exited from October 2018 to September 2019.
5 Based on those who exited from April 2018 to March 2019.

Youth
PY 2019 Illinois State Data Book 336
Table V-27 Outcomes of In-School Youth in IL, by Highest Educational Level for In-School Youth
(Derived from PY 2019 Q4 PIRL)
In-School Youth
All In-School Youth
Secondary School or Less
Alternative School
Postsecondary School
WIOA Primary Indicators of Performance
Employment or education 2nd quarter after exit1
71.8 71.4 0.0 100.0
Employment or education 4th quarter after exit2
78.5 78.2 50.0 93.3
Median earnings 2nd quarter after exit1 $2,533 $2,515 $0 $4,092
Credential attainment2 80.7 82.0 0.0 40.0
Measurable skill gains (among participants)3 49.5 50.0 0.0 36.4
School Status at Exit4
In-school 37.2 37.4 0.0 27.3
Secondary school or below 13.8 14.1 0.0 0.0
Alternative school 0.4 0.4 0.0 0.0
Postsecondary school 23.0 22.9 0.0 27.3
Not attending 62.8 62.6 0.0 72.7
Secondary school dropout 5.4 5.5 0.0 0.0
Secondary school graduates or equivalent 57.4 57.1 0.0 72.7
Within age of compulsory attendance 0.0 0.0 0.0 0.0
Quarterly Employment Rate
First quarter after exit5 66.5 65.8 100.0 85.7
Second quarter after exit1 60.5 60.1 0.0 88.9
Third quarter after exit6 67.1 66.5 50.0 100.0
Fourth quarter after exit2 73.0 72.5 50.0 93.3
Quarterly Median Earnings (among those employed)
First quarter after exit5 $2,307 $2,220 $281 $8,205
Second quarter after exit1 $2,533 $2,515 $0 $4,092
Third quarter after exit6 $2,510 $2,498 $1,741 $4,191
Fourth quarter after exit2 $2,993 $2,878 $3,032 $4,667
Type of Second Quarter Placement1
Unsubsidized employment 0.2 0.2 0.0 0.0
Registered apprenticeship 18.8 18.9 0.0 11.1
Military 0.7 0.8 0.0 0.0
Occupational skills training 0.0 0.0 0.0 0.0
Postsecondary education 0.0 0.0 0.0 0.0
Secondary education 0.0 0.0 0.0 0.0
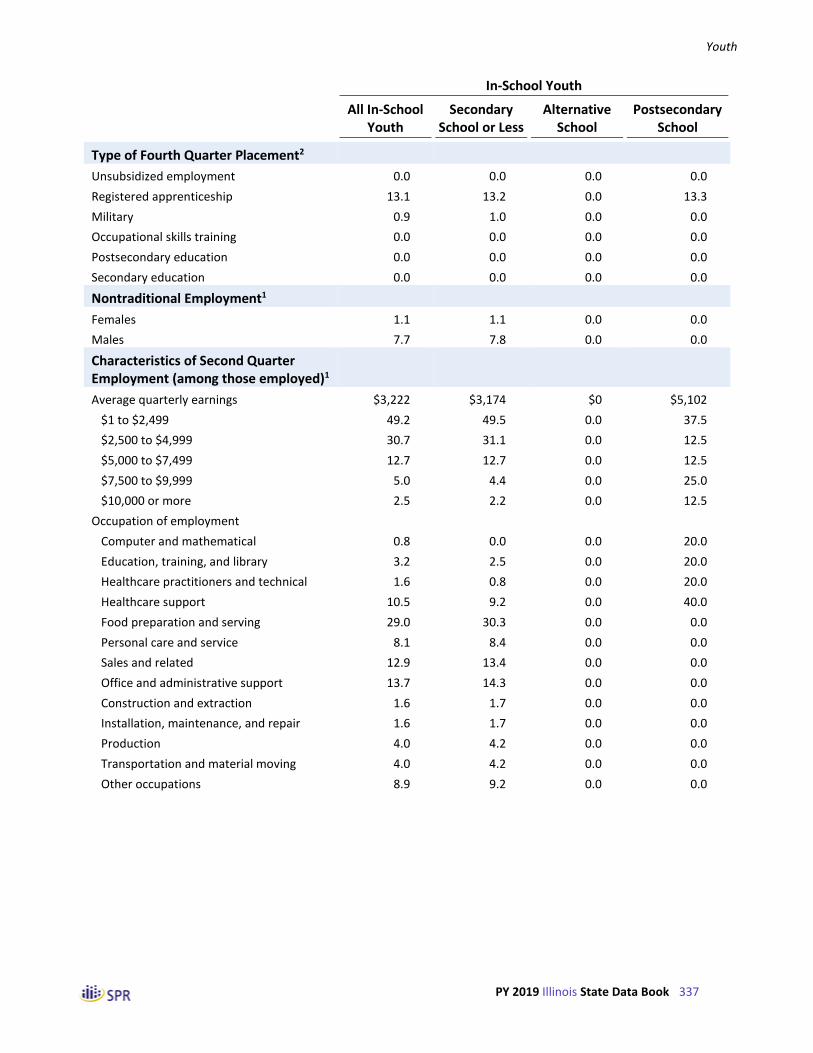
Youth
PY 2019 Illinois State Data Book 337
In-School Youth
All In-School Youth
Secondary School or Less
Alternative School
Postsecondary School
Type of Fourth Quarter Placement2
Unsubsidized employment 0.0 0.0 0.0 0.0
Registered apprenticeship 13.1 13.2 0.0 13.3
Military 0.9 1.0 0.0 0.0
Occupational skills training 0.0 0.0 0.0 0.0
Postsecondary education 0.0 0.0 0.0 0.0
Secondary education 0.0 0.0 0.0 0.0
Nontraditional Employment1
Females 1.1 1.1 0.0 0.0
Males 7.7 7.8 0.0 0.0
Characteristics of Second Quarter Employment (among those employed)1
Average quarterly earnings $3,222 $3,174 $0 $5,102
$1 to $2,499 49.2 49.5 0.0 37.5
$2,500 to $4,999 30.7 31.1 0.0 12.5
$5,000 to $7,499 12.7 12.7 0.0 12.5
$7,500 to $9,999 5.0 4.4 0.0 25.0
$10,000 or more 2.5 2.2 0.0 12.5
Occupation of employment
Computer and mathematical 0.8 0.0 0.0 20.0
Education, training, and library 3.2 2.5 0.0 20.0
Healthcare practitioners and technical 1.6 0.8 0.0 20.0
Healthcare support 10.5 9.2 0.0 40.0
Food preparation and serving 29.0 30.3 0.0 0.0
Personal care and service 8.1 8.4 0.0 0.0
Sales and related 12.9 13.4 0.0 0.0
Office and administrative support 13.7 14.3 0.0 0.0
Construction and extraction 1.6 1.7 0.0 0.0
Installation, maintenance, and repair 1.6 1.7 0.0 0.0
Production 4.0 4.2 0.0 0.0
Transportation and material moving 4.0 4.2 0.0 0.0
Other occupations 8.9 9.2 0.0 0.0

Youth
PY 2019 Illinois State Data Book 338
In-School Youth
All In-School Youth
Secondary School or Less
Alternative School
Postsecondary School
Types of Credentials Attained (among those with a credential attainment)2
Secondary school diploma/equivalency 92.0 93.3 0.0 0.0
AA, AS, BA, BS or other college 1.7 0.7 0.0 66.7
Postgraduate degree 1.0 0.2 0.0 50.0
Occupational credential 14.8 14.8 0.0 16.7
Other credential 0.0 0.0 0.0 0.0
Types of Skill Gains (among those with a measurable skill gain)3
Educational functional gains 3.1 3.2 0.0 0.0
Secondary school gains 10.8 11.1 0.0 0.0
Postsecondary school gains 56.7 56.2 0.0 75.0
Training milestone gains 2.2 2.3 0.0 0.0
Occupational skills progression 42.6 42.9 0.0 33.3
1 Based on those who exited from July 2018 to June 2019.
2 Based on those who exited from January 2018 to December 2018.
3 Based on those who participated between July 2019 and June 2020.
4 Based on those who exited from October 2018 to September 2019.
5 Based on those who exited from April 2018 to March 2019.

Youth
PY 2019 Illinois State Data Book 339
Table V-28 Outcomes of Out-of-School Youth in IL, by Highest Educational Level for Out-of-School Youth
(Derived from PY 2019 Q4 PIRL)
Out-of-School Youth
All Out-of-School Youth
Secondary School
Dropout
Secondary School graduates or Equivalent
Within Compulsory
Age
WIOA Primary Indicators of Performance
Employment or education 2nd quarter after exit1
78.1 72.0 82.3 0.0
Employment or education 4th quarter after exit2
77.1 70.8 81.4 0.0
Median earnings 2nd quarter after exit1 $3,911 $3,081 $4,453 $0
Credential attainment2 67.7 62.3 72.3 0.0
Measurable skill gains (among participants)3 37.2 35.4 38.4 0.0
School Status at Exit4
In-school 5.4 6.8 4.7 0.0
Secondary school or below 0.4 1.1 0.0 0.0
Alternative school 0.5 1.4 0.0 0.0
Postsecondary school 4.5 4.3 4.7 0.0
Not attending 94.6 93.2 95.3 0.0
Secondary school dropout 14.6 40.9 0.1 0.0
Secondary school graduates or equivalent 79.2 50.7 95.0 0.0
Within age of compulsory attendance 0.7 1.6 0.3 0.0
Quarterly Employment Rate
First quarter after exit5 77.9 71.2 82.2 0.0
Second quarter after exit1 76.9 70.5 81.4 0.0
Third quarter after exit6 75.1 69.7 78.9 0.0
Fourth quarter after exit2 76.3 69.9 80.6 0.0
Quarterly Median Earnings (among those employed)
First quarter after exit5 $3,807 $2,909 $4,362 $0
Second quarter after exit1 $3,911 $3,081 $4,453 $0
Third quarter after exit6 $3,938 $3,245 $4,443 $0
Fourth quarter after exit2 $4,189 $3,384 $4,713 $0
Type of Second Quarter Placement1
Unsubsidized employment 0.0 0.1 0.0 0.0
Registered apprenticeship 2.2 2.6 1.9 0.0
Military 0.2 0.4 0.0 0.0
Occupational skills training 0.0 0.0 0.0 0.0
Postsecondary education 0.0 0.0 0.0 0.0
Secondary education 0.0 0.0 0.0 0.0

Youth
PY 2019 Illinois State Data Book 340
Out-of-School Youth
All Out-of-School Youth
Secondary School
Dropout
Secondary School graduates or Equivalent
Within Compulsory
Age
Type of Fourth Quarter Placement2
Unsubsidized employment 0.0 0.0 0.0 0.0
Registered apprenticeship 1.6 1.9 1.4 0.0
Military 0.1 0.0 0.1 0.0
Occupational skills training 0.0 0.0 0.0 0.0
Postsecondary education 0.0 0.0 0.0 0.0
Secondary education 0.0 0.0 0.0 0.0
Nontraditional Employment1
Females 3.7 2.5 4.3 0.0
Males 4.6 3.2 5.6 0.0
Characteristics of Second Quarter Employment (among those employed)1
Average quarterly earnings $4,603 $3,830 $5,079 $0
$1 to $2,499 33.2 41.6 28.0 0.0
$2,500 to $4,999 28.4 30.4 27.2 0.0
$5,000 to $7,499 21.7 16.9 24.7 0.0
$7,500 to $9,999 8.4 6.1 9.9 0.0
$10,000 or more 8.2 5.0 10.2 0.0
Occupation of employment
Computer and mathematical 0.6 0.0 1.0 0.0
Education, training, and library 1.5 1.8 1.4 0.0
Healthcare practitioners and technical 2.9 1.5 3.9 0.0
Healthcare support 12.1 5.0 16.8 0.0
Food preparation and serving 15.3 21.7 11.0 0.0
Personal care and service 3.3 2.6 3.7 0.0
Sales and related 12.2 13.5 11.4 0.0
Office and administrative support 14.9 13.2 16.0 0.0
Construction and extraction 2.2 2.1 2.3 0.0
Installation, maintenance, and repair 2.2 4.1 1.0 0.0
Production 9.2 10.3 8.4 0.0
Transportation and material moving 11.0 9.7 11.9 0.0
Other occupations 12.6 14.7 11.2 0.0

Youth
PY 2019 Illinois State Data Book 341
Out-of-School Youth
All Out-of-School Youth
Secondary School
Dropout
Secondary School graduates or Equivalent
Within Compulsory
Age
Types of Credentials Attained (among those with a credential attainment)2
Secondary school diploma/equivalency 36.7 86.6 0.1 0.0
AA, AS, BA, BS or other college 3.7 0.4 6.1 0.0
Postgraduate degree 17.6 3.6 27.8 0.0
Occupational credential 53.6 17.4 80.1 0.0
Other credential 0.0 0.0 0.0 0.0
Types of Skill Gains (among those with a measurable skill gain)3
Educational functional gains 10.2 14.4 7.6 0.0
Secondary school gains 11.8 31.4 0.0 0.0
Postsecondary school gains 14.8 10.8 17.3 0.0
Training milestone gains 16.1 8.5 20.7 0.0
Occupational skills progression 67.9 74.0 64.2 0.0
1 Based on those who exited from July 2018 to June 2019.
2 Based on those who exited from January 2018 to December 2018.
3 Based on those who participated between July 2019 and June 2020.
4 Based on those who exited from October 2018 to September 2019.
5 Based on those who exited from April 2018 to March 2019.
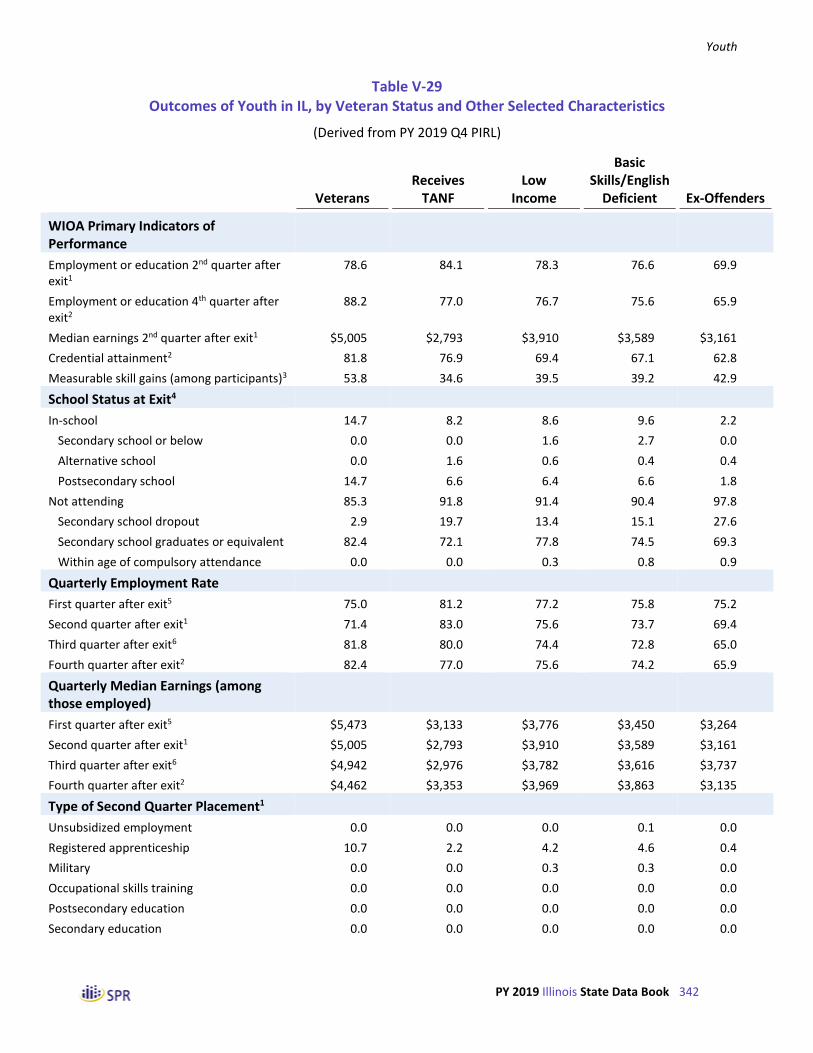
Youth
PY 2019 Illinois State Data Book 342
Table V-29 Outcomes of Youth in IL, by Veteran Status and Other Selected Characteristics
(Derived from PY 2019 Q4 PIRL)
Veterans Receives
TANF Low
Income
Basic Skills/English
Deficient Ex-Offenders
WIOA Primary Indicators of Performance
Employment or education 2nd quarter after exit1
78.6 84.1 78.3 76.6 69.9
Employment or education 4th quarter after exit2
88.2 77.0 76.7 75.6 65.9
Median earnings 2nd quarter after exit1 $5,005 $2,793 $3,910 $3,589 $3,161
Credential attainment2 81.8 76.9 69.4 67.1 62.8
Measurable skill gains (among participants)3 53.8 34.6 39.5 39.2 42.9
School Status at Exit4
In-school 14.7 8.2 8.6 9.6 2.2
Secondary school or below 0.0 0.0 1.6 2.7 0.0
Alternative school 0.0 1.6 0.6 0.4 0.4
Postsecondary school 14.7 6.6 6.4 6.6 1.8
Not attending 85.3 91.8 91.4 90.4 97.8
Secondary school dropout 2.9 19.7 13.4 15.1 27.6
Secondary school graduates or equivalent 82.4 72.1 77.8 74.5 69.3
Within age of compulsory attendance 0.0 0.0 0.3 0.8 0.9
Quarterly Employment Rate
First quarter after exit5 75.0 81.2 77.2 75.8 75.2
Second quarter after exit1 71.4 83.0 75.6 73.7 69.4
Third quarter after exit6 81.8 80.0 74.4 72.8 65.0
Fourth quarter after exit2 82.4 77.0 75.6 74.2 65.9
Quarterly Median Earnings (among those employed)
First quarter after exit5 $5,473 $3,133 $3,776 $3,450 $3,264
Second quarter after exit1 $5,005 $2,793 $3,910 $3,589 $3,161
Third quarter after exit6 $4,942 $2,976 $3,782 $3,616 $3,737
Fourth quarter after exit2 $4,462 $3,353 $3,969 $3,863 $3,135
Type of Second Quarter Placement1
Unsubsidized employment 0.0 0.0 0.0 0.1 0.0
Registered apprenticeship 10.7 2.2 4.2 4.6 0.4
Military 0.0 0.0 0.3 0.3 0.0
Occupational skills training 0.0 0.0 0.0 0.0 0.0
Postsecondary education 0.0 0.0 0.0 0.0 0.0
Secondary education 0.0 0.0 0.0 0.0 0.0

Youth
PY 2019 Illinois State Data Book 343
Veterans Receives
TANF Low
Income
Basic Skills/English
Deficient Ex-Offenders
Type of Fourth Quarter Placement2
Unsubsidized employment 0.0 0.0 0.0 0.0 0.0
Registered apprenticeship 11.8 0.0 2.6 2.9 0.4
Military 0.0 0.0 0.0 0.2 0.0
Occupational skills training 0.0 0.0 0.0 0.0 0.0
Postsecondary education 0.0 0.0 0.0 0.0 0.0
Secondary education 0.0 0.0 0.0 0.0 0.0
Nontraditional Employment1
Females 0.0 5.1 4.0 3.4 2.4
Males 0.0 0.0 5.8 4.7 1.7
Characteristics of Second Quarter Employment (among those employed)1
Average quarterly earnings $5,005 $3,935 $4,498 $4,254 $4,037
$1 to $2,499 35.0 41.1 33.1 36.8 43.5
$2,500 to $4,999 15.0 31.5 28.8 28.9 25.5
$5,000 to $7,499 25.0 12.3 21.9 20.8 12.4
$7,500 to $9,999 15.0 9.6 9.0 6.8 11.8
$10,000 or more 10.0 5.5 7.1 6.7 6.8
Occupation of employment
Computer and mathematical 0.0 0.0 0.4 0.4 0.0
Education, training, and library 0.0 0.0 1.7 1.6 0.0
Healthcare practitioners and technical 0.0 0.0 3.3 1.8 3.3
Healthcare support 33.3 20.0 16.9 9.7 13.3
Food preparation and serving 0.0 0.0 14.5 18.4 13.3
Personal care and service 0.0 6.7 3.9 4.2 0.0
Sales and related 0.0 6.7 11.5 13.4 6.7
Office and administrative support 0.0 33.3 13.2 15.9 6.7
Construction and extraction 0.0 0.0 1.7 2.1 0.0
Installation, maintenance, and repair 0.0 0.0 2.6 2.4 3.3
Production 33.3 0.0 8.9 8.0 23.3
Transportation and material moving 0.0 13.3 10.2 9.8 13.3
Other occupations 33.3 20.0 11.3 12.3 16.7
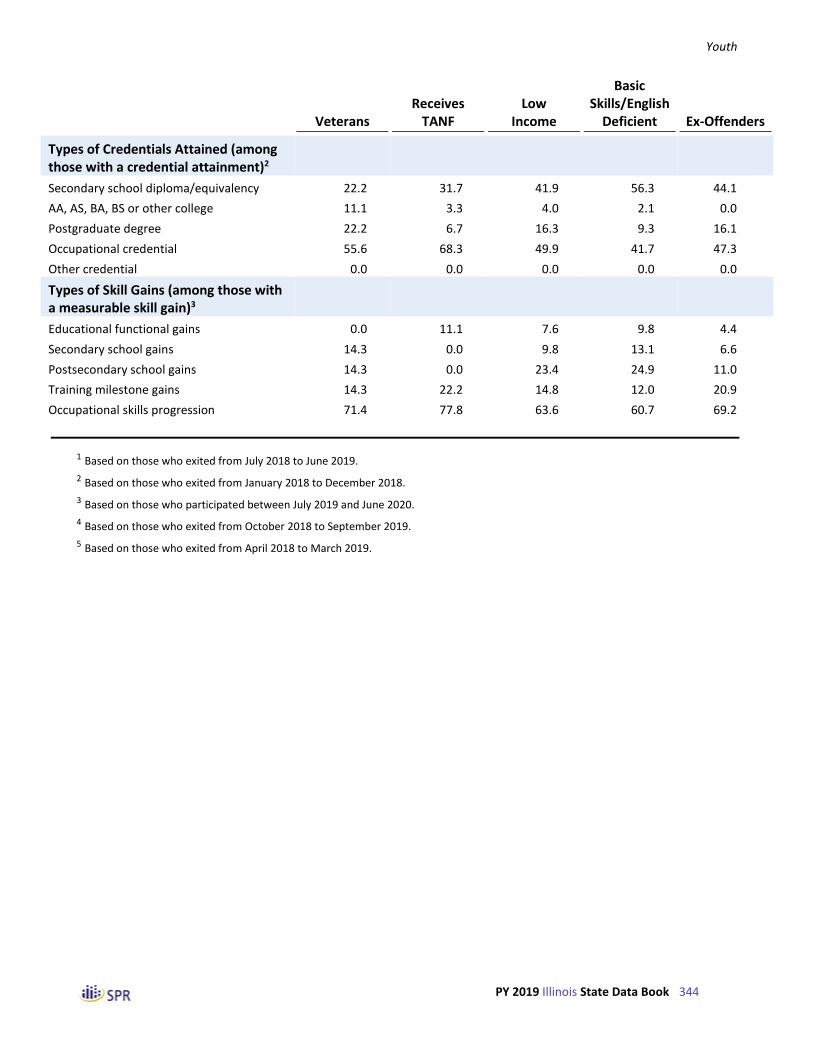
Youth
PY 2019 Illinois State Data Book 344
Veterans Receives
TANF Low
Income
Basic Skills/English
Deficient Ex-Offenders
Types of Credentials Attained (among those with a credential attainment)2
Secondary school diploma/equivalency 22.2 31.7 41.9 56.3 44.1
AA, AS, BA, BS or other college 11.1 3.3 4.0 2.1 0.0
Postgraduate degree 22.2 6.7 16.3 9.3 16.1
Occupational credential 55.6 68.3 49.9 41.7 47.3
Other credential 0.0 0.0 0.0 0.0 0.0
Types of Skill Gains (among those with a measurable skill gain)3
Educational functional gains 0.0 11.1 7.6 9.8 4.4
Secondary school gains 14.3 0.0 9.8 13.1 6.6
Postsecondary school gains 14.3 0.0 23.4 24.9 11.0
Training milestone gains 14.3 22.2 14.8 12.0 20.9
Occupational skills progression 71.4 77.8 63.6 60.7 69.2
1 Based on those who exited from July 2018 to June 2019.
2 Based on those who exited from January 2018 to December 2018.
3 Based on those who participated between July 2019 and June 2020.
4 Based on those who exited from October 2018 to September 2019.
5 Based on those who exited from April 2018 to March 2019.

Youth
PY 2019 Illinois State Data Book 345
Table V-30 Outcomes of Youth in IL, by Selected Barriers
(Derived from PY 2019 Q4 PIRL)
Homeless or Runaway Single Parents
Pregnant or Parenting
Needs Additional Assistance
Foster Care Youth
WIOA Primary Indicators of Performance
Employment or education 2nd quarter after exit1
78.8 85.0 80.0 77.3 70.6
Employment or education 4th quarter after exit2
76.6 83.6 80.5 78.8 73.7
Median earnings 2nd quarter after exit1 $3,905 $4,567 $4,572 $4,046 $1,632
Credential attainment2 67.9 75.5 72.2 72.5 75.0
Measurable skill gains (among participants)3 32.3 35.9 35.2 45.3 40.0
School Status at Exit4
In-school 9.0 4.1 2.7 12.5 6.3
Secondary school or below 0.4 2.4 0.1 4.0 0.0
Alternative school 1.3 0.0 0.4 0.2 0.0
Postsecondary school 7.3 1.7 2.1 8.3 6.3
Not attending 91.0 95.9 97.3 87.5 93.8
Secondary school dropout 10.7 15.3 16.4 11.7 6.3
Secondary school graduates or equivalent 80.3 79.7 80.4 75.5 87.5
Within age of compulsory attendance 0.0 1.0 0.6 0.3 0.0
Quarterly Employment Rate
First quarter after exit5 77.1 81.8 80.4 76.9 61.1
Second quarter after exit1 78.2 84.0 79.7 72.1 64.7
Third quarter after exit6 70.3 84.3 79.7 75.5 70.6
Fourth quarter after exit2 75.6 83.1 80.3 76.9 73.7
Quarterly Median Earnings (among those employed)
First quarter after exit5 $3,101 $4,512 $4,407 $4,125 $3,902
Second quarter after exit1 $3,905 $4,568 $4,572 $4,046 $1,632
Third quarter after exit6 $3,810 $4,282 $4,191 $4,158 $2,036
Fourth quarter after exit2 $4,009 $4,162 $4,090 $4,312 $3,138
Type of Second Quarter Placement1
Unsubsidized employment 0.0 0.0 0.0 0.0 0.0
Registered apprenticeship 1.0 2.3 0.9 8.1 5.9
Military 0.5 0.0 0.1 0.1 0.0
Occupational skills training 0.0 0.0 0.0 0.0 0.0
Postsecondary education 0.0 0.0 0.0 0.0 0.0
Secondary education 0.0 0.0 0.0 0.0 0.0

Youth
PY 2019 Illinois State Data Book 346
Homeless or Runaway Single Parents
Pregnant or Parenting
Needs Additional Assistance
Foster Care Youth
Type of Fourth Quarter Placement2
Unsubsidized employment 0.0 0.0 0.0 0.0 0.0
Registered apprenticeship 3.0 1.3 0.5 5.3 0.0
Military 0.5 0.0 0.0 0.0 0.0
Occupational skills training 0.0 0.0 0.0 0.0 0.0
Postsecondary education 0.0 0.0 0.0 0.0 0.0
Secondary education 0.0 0.0 0.0 0.0 0.0
Nontraditional Employment1
Females 5.8 2.4 4.1 2.7 0.0
Males 3.1 0.0 5.8 4.8 0.0
Characteristics of Second Quarter Employment (among those employed)1
Average quarterly earnings $4,140 $5,302 $5,012 $4,974 $2,667
$1 to $2,499 38.3 24.5 28.0 31.8 54.5
$2,500 to $4,999 26.0 28.8 26.9 28.4 27.3
$5,000 to $7,499 18.8 23.2 25.0 18.3 18.2
$7,500 to $9,999 12.3 12.7 10.5 10.4 0.0
$10,000 or more 4.5 10.8 9.7 11.1 0.0
Occupation of employment
Computer and mathematical 2.9 1.5 0.6 0.7 0.0
Education, training, and library 2.9 6.1 2.9 2.1 0.0
Healthcare practitioners and technical 0.0 10.6 6.4 4.2 0.0
Healthcare support 8.6 39.4 27.7 17.3 0.0
Food preparation and serving 14.3 10.6 8.7 14.8 33.3
Personal care and service 2.9 0.0 0.6 3.9 33.3
Sales and related 17.1 3.0 10.4 10.6 16.7
Office and administrative support 22.9 7.6 11.0 12.7 0.0
Construction and extraction 2.9 0.0 1.2 3.5 0.0
Installation, maintenance, and repair 11.4 1.5 1.2 3.5 0.0
Production 8.6 3.0 9.2 6.4 0.0
Transportation and material moving 0.0 7.6 6.9 10.2 16.7
Other occupations 5.7 9.1 13.3 9.9 0.0

Youth
PY 2019 Illinois State Data Book 347
Homeless or Runaway Single Parents
Pregnant or Parenting
Needs Additional Assistance
Foster Care Youth
Types of Credentials Attained (among those with a credential attainment)2
Secondary school diploma/equivalency 38.6 25.7 23.6 48.9 55.6
AA, AS, BA, BS or other college 1.8 4.4 3.3 6.4 0.0
Postgraduate degree 19.3 26.2 22.5 14.2 0.0
Occupational credential 50.9 63.6 64.8 43.8 44.4
Other credential 0.0 0.0 0.0 0.0 0.0
Types of Skill Gains (among those with a measurable skill gain)3
Educational functional gains 6.7 5.2 6.1 3.3 0.0
Secondary school gains 15.0 7.8 7.4 6.5 16.7
Postsecondary school gains 21.7 20.0 16.9 38.3 50.0
Training milestone gains 15.0 13.0 18.6 11.5 16.7
Occupational skills progression 60.0 70.4 69.7 58.5 66.7
1 Based on those who exited from July 2018 to June 2019.
2 Based on those who exited from January 2018 to December 2018.
3 Based on those who participated between July 2019 and June 2020.
4 Based on those who exited from October 2018 to September 2019.
5 Based on those who exited from April 2018 to March 2019.

Youth
PY 2019 Illinois State Data Book 348
Table V-31 Outcomes of Youth in IL, by Major Service Category
(Derived from PY 2019 Q4 PIRL)
Educational Services
Work Experience
Guidance and Counseling Training
Supportive Services
WIOA Primary Indicators of Performance
Employment or education 2nd quarter after exit1
77.2 75.1 77.2 77.4 78.8
Employment or education 4th quarter after exit2
77.3 72.6 77.6 77.3 78.7
Median earnings 2nd quarter after exit1 $3,765 $3,231 $3,709 $3,744 $4,117
Credential attainment2 70.5 70.4 70.8 70.5 70.1
Measurable skill gains (among participants)3 46.9 51.2 47.1 47.1 51.0
School Status at Exit4
In-school 9.9 15.2 10.0 9.9 7.0
Secondary school or below 2.3 3.7 2.3 2.3 1.5
Alternative school 0.5 1.3 0.5 0.5 0.1
Postsecondary school 7.1 10.2 7.2 7.2 5.4
Not attending 90.1 84.8 90.0 90.1 93.0
Secondary school dropout 13.3 15.0 12.9 13.3 13.2
Secondary school graduates or equivalent 76.2 67.9 76.5 76.2 79.1
Within age of compulsory attendance 0.6 1.9 0.7 0.6 0.7
Quarterly Employment Rate
First quarter after exit5 76.6 73.7 76.5 76.6 78.4
Second quarter after exit1 74.7 69.1 74.7 74.8 77.5
Third quarter after exit6 74.0 69.7 74.1 74.1 77.1
Fourth quarter after exit2 75.8 70.7 76.3 75.9 78.0
Quarterly Median Earnings (among those employed)
First quarter after exit5 $3,639 $3,129 $3,604 $3,635 $4,074
Second quarter after exit1 $3,765 $3,231 $3,709 $3,744 $4,117
Third quarter after exit6 $3,704 $3,439 $3,706 $3,696 $4,099
Fourth quarter after exit2 $3,969 $3,713 $3,930 $3,969 $4,580
Type of Second Quarter Placement1
Unsubsidized employment 0.0 0.2 0.1 0.0 0.0
Registered apprenticeship 4.4 9.2 4.5 4.5 3.0
Military 0.3 0.5 0.3 0.3 0.0
Occupational skills training 0.0 0.0 0.0 0.0 0.0
Postsecondary education 0.0 0.0 0.0 0.0 0.0
Secondary education 0.0 0.0 0.0 0.0 0.0
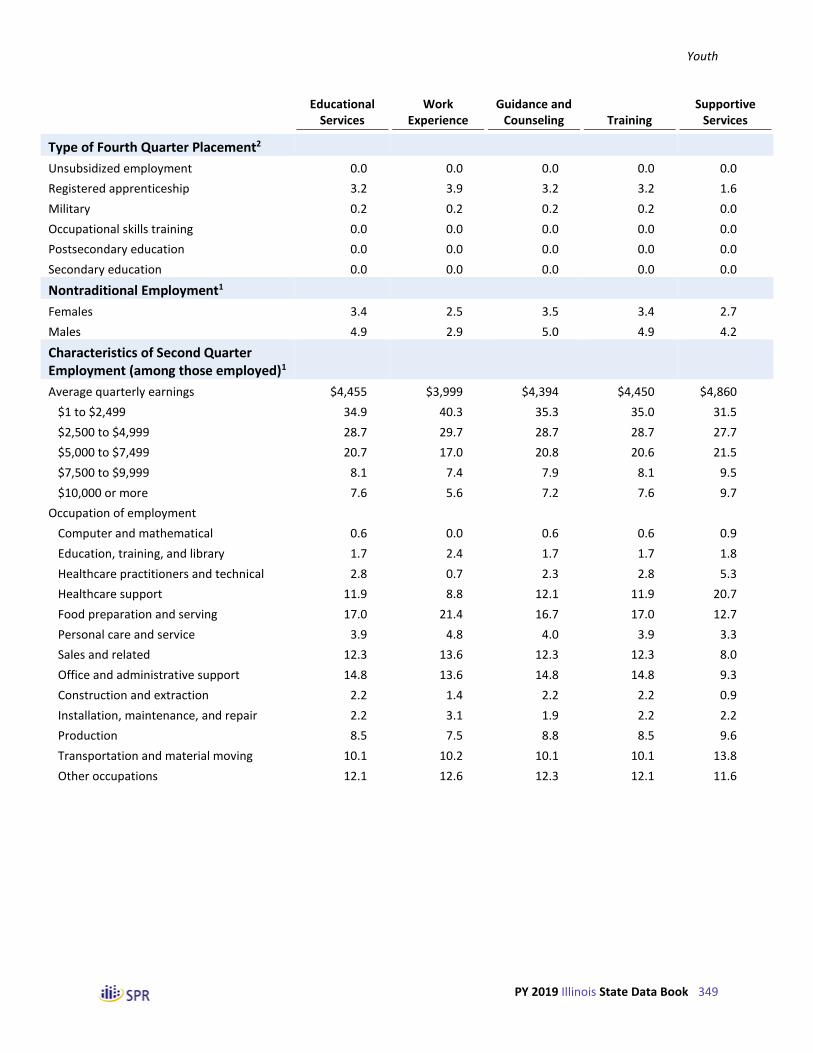
Youth
PY 2019 Illinois State Data Book 349
Educational Services
Work Experience
Guidance and Counseling Training
Supportive Services
Type of Fourth Quarter Placement2
Unsubsidized employment 0.0 0.0 0.0 0.0 0.0
Registered apprenticeship 3.2 3.9 3.2 3.2 1.6
Military 0.2 0.2 0.2 0.2 0.0
Occupational skills training 0.0 0.0 0.0 0.0 0.0
Postsecondary education 0.0 0.0 0.0 0.0 0.0
Secondary education 0.0 0.0 0.0 0.0 0.0
Nontraditional Employment1
Females 3.4 2.5 3.5 3.4 2.7
Males 4.9 2.9 5.0 4.9 4.2
Characteristics of Second Quarter Employment (among those employed)1
Average quarterly earnings $4,455 $3,999 $4,394 $4,450 $4,860
$1 to $2,499 34.9 40.3 35.3 35.0 31.5
$2,500 to $4,999 28.7 29.7 28.7 28.7 27.7
$5,000 to $7,499 20.7 17.0 20.8 20.6 21.5
$7,500 to $9,999 8.1 7.4 7.9 8.1 9.5
$10,000 or more 7.6 5.6 7.2 7.6 9.7
Occupation of employment
Computer and mathematical 0.6 0.0 0.6 0.6 0.9
Education, training, and library 1.7 2.4 1.7 1.7 1.8
Healthcare practitioners and technical 2.8 0.7 2.3 2.8 5.3
Healthcare support 11.9 8.8 12.1 11.9 20.7
Food preparation and serving 17.0 21.4 16.7 17.0 12.7
Personal care and service 3.9 4.8 4.0 3.9 3.3
Sales and related 12.3 13.6 12.3 12.3 8.0
Office and administrative support 14.8 13.6 14.8 14.8 9.3
Construction and extraction 2.2 1.4 2.2 2.2 0.9
Installation, maintenance, and repair 2.2 3.1 1.9 2.2 2.2
Production 8.5 7.5 8.8 8.5 9.6
Transportation and material moving 10.1 10.2 10.1 10.1 13.8
Other occupations 12.1 12.6 12.3 12.1 11.6

Youth
PY 2019 Illinois State Data Book 350
Educational Services
Work Experience
Guidance and Counseling Training
Supportive Services
Types of Credentials Attained (among those with a credential attainment)2
Secondary school diploma/equivalency 50.4 73.0 50.0 50.4 40.6
AA, AS, BA, BS or other college 3.2 2.1 2.3 3.2 3.9
Postgraduate degree 13.4 0.8 13.4 13.5 16.2
Occupational credential 44.0 31.5 44.8 44.0 51.7
Other credential 0.0 0.0 0.0 0.0 0.0
Types of Skill Gains (among those with a measurable skill gain)3
Educational functional gains 9.7 15.9 9.8 9.7 8.0
Secondary school gains 30.5 48.3 30.7 30.5 26.3
Postsecondary school gains 10.0 16.6 9.9 10.0 7.6
Training milestone gains 14.0 2.6 14.1 14.0 14.7
Occupational skills progression 72.6 74.8 72.5 72.6 78.4
1 Based on those who exited from July 2018 to June 2019.
2 Based on those who exited from January 2018 to December 2018.
3 Based on those who participated between July 2019 and June 2020.
4 Based on those who exited from October 2018 to September 2019.
5 Based on those who exited from April 2018 to March 2019.

Youth
PY 2019 Illinois State Data Book 351
Table V-32 WIOA Primary Indicators of Performance for Youth, by State
(Derived from PY 2019 Q4 PIRL)
2nd Quarter Employment or Education1
4th Quarter Employment or Education2
Median Earnings1
Credential Attainment2
Measurable Skills Gains3
Nation 73.1 73.4 $3,518 63.4 47.0
Alabama 63.1 61.2 $3,281 33.6 51.9
Alaska 55.4 52.8 $3,915 58.6 18.0
Arizona 73.4 70.4 $4,751 60.9 60.4
Arkansas 79.0 79.1 $3,232 70.1 61.7
California 71.6 71.4 $3,705 60.2 56.3
Colorado 67.5 70.3 $4,031 59.9 47.3
Connecticut 75.7 78.7 $3,498 80.0 62.2
Delaware 70.7 77.4 $2,666 79.5 70.6
District of Columbia 61.6 65.5 $3,241 64.2 34.8
Florida 81.4 80.5 $3,900 79.2 43.5
Georgia 79.4 77.2 $3,100 67.0 32.0
Guam 50.0 19.0 $5,460 42.9 0.0
Hawaii 65.8 70.4 $4,147 44.4 17.8
Idaho 81.1 82.8 $4,420 53.0 23.6
Illinois 77.2 77.3 $3,765 70.5 40.2
Indiana 80.9 80.0 $3,340 66.4 66.3
Iowa 76.3 75.1 $3,394 54.3 45.8
Kansas 76.3 75.1 $3,368 64.0 50.6
Kentucky 61.8 61.8 $3,628 31.4 26.3
Louisiana 72.0 76.6 $3,120 57.2 46.7
Maine 70.9 71.8 $3,789 59.8 35.2
Maryland 73.6 72.4 $3,815 64.6 49.7
Massachusetts 71.9 70.6 $3,495 64.6 24.8
Michigan 82.3 81.6 $3,705 75.6 38.7
Minnesota 79.3 79.5 $4,451 66.1 50.8
Mississippi 77.4 80.4 $2,891 86.5 62.3
Missouri 74.3 75.5 $3,629 51.8 46.6
Montana 57.5 42.2 $2,697 20.9 18.1
Nebraska 82.5 78.9 $4,109 43.2 48.0
Nevada 66.5 71.9 $3,596 57.5 40.0
New Hampshire 85.5 83.4 $4,633 81.7 78.0
New Jersey 64.7 65.1 $2,639 55.1 64.1
New Mexico 62.2 68.8 $3,413 43.0 30.1
New York 65.6 69.9 $3,129 70.0 40.9

Youth
PY 2019 Illinois State Data Book 352
2nd Quarter Employment or Education1
4th Quarter Employment or Education2
Median Earnings1
Credential Attainment2
Measurable Skills Gains3
North Carolina 74.3 73.2 $3,122 53.7 43.2
North Dakota 81.4 76.7 $5,274 49.2 63.4
Northern Mariana Islands 75.0 69.8 $3,835 100.0 0.0
Ohio 75.6 74.6 $3,216 53.9 54.7
Oklahoma 72.8 73.0 $3,498 54.4 61.9
Oregon 61.7 60.8 $4,147 55.4 36.4
Palau 100.0 65.2 $1,820 16.7 100.0
Pennsylvania 70.4 70.0 $3,283 68.9 53.5
Puerto Rico - - - - -
Rhode Island 77.7 75.3 $2,916 68.0 38.5
South Carolina 77.3 77.9 $3,614 67.4 50.8
South Dakota 72.8 74.7 $3,619 49.0 48.3
Tennessee 79.8 80.0 $4,064 72.6 62.4
Texas 71.7 71.7 $3,315 44.3 48.2
Utah 75.5 73.7 $3,593 57.0 43.1
Vermont 67.3 64.7 $3,077 50.6 44.9
Virgin Islands 59.7 60.9 $3,354 33.3 66.7
Virginia 80.6 79.6 $3,515 71.7 56.8
Washington 63.3 65.3 $3,598 65.5 17.0
West Virginia 62.9 62.1 $3,250 59.8 30.9
Wisconsin 79.3 77.5 $3,582 57.0 38.2
Wyoming 70.1 66.7 $2,920 56.6 64.4
1 Based on those who exited from July 2018 to June 2019.
2 Based on those who exited from January 2018 to December 2018.
3 Based on those who participated between July 2019 and June 2020.
.

Wagner-Peyser
PY 2019 Illinois State Data Book 353
Part VI: Wagner-Peyser Exiters

Wagner-Peyser
PY 2019 Illinois State Data Book 354
Table VI-1 Trends in the Characteristics of Wagner-Peyser Exiters, by Reporting Period
(Derived from PIRL)
Nation PY 2017
Nation PY 2018
Nation PY 2019
IL PY 2017
IL PY 2018
IL PY 2019
Number of exiters 4,021,585 3,570,450 3,317,555 32,895 33,517 26,814
Age Categories
Under 22 7.6 7.4 7.0 3.2 3.4 2.9
22 to 29 20.5 19.5 18.5 15.0 15.0 13.0
30 to 44 32.9 33.0 33.3 28.6 29.8 31.4
45 to 54 20.4 20.1 20.0 25.4 24.2 23.7
55 and older 18.7 20.0 21.1 27.7 27.7 29.0
Gender
Females 47.8 48.0 47.0 40.2 42.7 40.7
Males 52.2 52.0 53.0 59.8 57.3 59.3
Race and Ethnicity
Hispanics/Latinos 19.0 18.6 19.0 13.2 15.3 14.9
American Indians/Alaska Natives 2.9 2.9 3.0 0.9 1.0 1.0
Asians 3.1 3.0 3.4 2.5 2.2 1.7
Blacks or African Americans 35.8 35.8 33.7 38.5 41.1 36.9
Native Hawaiians/Pacific Islanders 0.7 0.7 0.8 0.2 0.3 0.3
Whites 60.3 60.3 62.1 58.9 56.4 61.4
More than one race 2.4 2.4 2.5 1.0 1.0 1.2
Employment Status
Employed 14.5 14.8 14.1 3.2 3.5 4.4
Not employed or with layoff notice 85.5 85.2 85.9 96.8 96.5 95.6
Veteran Status
Veterans 6.6 6.7 6.2 19.3 16.9 19.3
Disabled veterans 1.6 1.7 1.7 4.1 4.3 4.9
Homeless veterans 0.6 0.6 0.6 1.1 1.2 1.6
With other significant barrier 2.8 2.5 2.5 0.8 1.2 2.9
Other eligible persons 0.1 0.2 0.2 0.2 0.1 0.1
Active duty military spouses -- -- 0.1 -- -- 0.0
Attended TAP Workshop in 3 prior years (among veterans and TSMs)
-- -- 9.2 -- -- 5.3
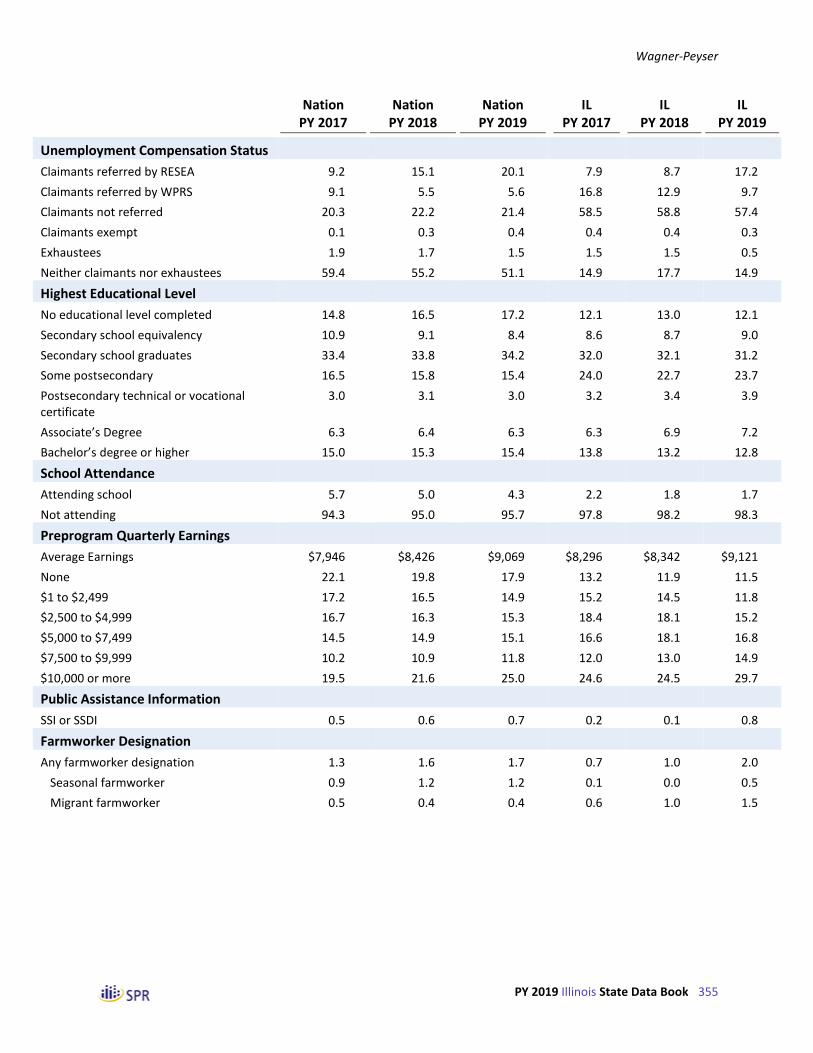
Wagner-Peyser
PY 2019 Illinois State Data Book 355
Nation PY 2017
Nation PY 2018
Nation PY 2019
IL PY 2017
IL PY 2018
IL PY 2019
Unemployment Compensation Status
Claimants referred by RESEA 9.2 15.1 20.1 7.9 8.7 17.2
Claimants referred by WPRS 9.1 5.5 5.6 16.8 12.9 9.7
Claimants not referred 20.3 22.2 21.4 58.5 58.8 57.4
Claimants exempt 0.1 0.3 0.4 0.4 0.4 0.3
Exhaustees 1.9 1.7 1.5 1.5 1.5 0.5
Neither claimants nor exhaustees 59.4 55.2 51.1 14.9 17.7 14.9
Highest Educational Level
No educational level completed 14.8 16.5 17.2 12.1 13.0 12.1
Secondary school equivalency 10.9 9.1 8.4 8.6 8.7 9.0
Secondary school graduates 33.4 33.8 34.2 32.0 32.1 31.2
Some postsecondary 16.5 15.8 15.4 24.0 22.7 23.7
Postsecondary technical or vocational certificate
3.0 3.1 3.0 3.2 3.4 3.9
Associate’s Degree 6.3 6.4 6.3 6.3 6.9 7.2
Bachelor’s degree or higher 15.0 15.3 15.4 13.8 13.2 12.8
School Attendance
Attending school 5.7 5.0 4.3 2.2 1.8 1.7
Not attending 94.3 95.0 95.7 97.8 98.2 98.3
Preprogram Quarterly Earnings
Average Earnings $7,946 $8,426 $9,069 $8,296 $8,342 $9,121
None 22.1 19.8 17.9 13.2 11.9 11.5
$1 to $2,499 17.2 16.5 14.9 15.2 14.5 11.8
$2,500 to $4,999 16.7 16.3 15.3 18.4 18.1 15.2
$5,000 to $7,499 14.5 14.9 15.1 16.6 18.1 16.8
$7,500 to $9,999 10.2 10.9 11.8 12.0 13.0 14.9
$10,000 or more 19.5 21.6 25.0 24.6 24.5 29.7
Public Assistance Information
SSI or SSDI 0.5 0.6 0.7 0.2 0.1 0.8
Farmworker Designation
Any farmworker designation 1.3 1.6 1.7 0.7 1.0 2.0
Seasonal farmworker 0.9 1.2 1.2 0.1 0.0 0.5
Migrant farmworker 0.5 0.4 0.4 0.6 1.0 1.5

Wagner-Peyser
PY 2019 Illinois State Data Book 356
Nation PY 2017
Nation PY 2018
Nation PY 2019
IL PY 2017
IL PY 2018
IL PY 2019
Other Characteristics
Individuals with a disability 5.4 5.4 5.4 5.5 6.2 6.8
Long-term unemployed 4.7 4.5 4.9 4.6 3.6 1.2
Exhausting TANF within 2 years -- -- 0.7 -- -- 0.8
Homeless individuals or runaway youth 1.7 2.0 2.4 1.2 1.6 2.5
Ex-offenders -- -- 5.9 -- -- 3.4
Low income 15.0 17.8 19.2 2.1 4.6 15.5
English language learners 2.4 3.3 3.4 1.8 2.9 2.7
Basic skills deficient 1.8 2.1 2.8 0.3 0.9 1.5
Facing substantial cultural barrier 1.1 1.2 1.3 0.1 0.3 0.1
Single parents 13.5 11.9 11.3 19.9 19.9 13.5
Displaced homemakers 0.4 0.6 0.6 0.3 0.2 0.2

Wagner-Peyser
PY 2019 Illinois State Data Book 357
Table VI-2 Trends in the Number of Wagner-Peyser Participants, by Reporting Period
(Derived from PIRL)
Nation PY 2017
Nation PY 2018
Nation PY 2019
IL PY 2017
IL PY 2018
IL PY 2019
Number of exiters 4,021,585 3,570,450 3,317,555 32,895 33,517 26,814
Age Categories
Under 22 305,563 263,581 232,038 1,053 1,136 765
22 to 29 822,822 694,421 614,957 4,943 5,022 3,468
30 to 44 1,323,806 1,179,375 1,106,097 9,410 9,941 8,382
45 to 54 818,544 719,089 663,156 8,359 8,069 6,344
55 and older 750,131 713,154 700,675 9,085 9,244 7,757
Gender
Females 1,894,577 1,681,120 1,542,799 13,112 14,197 10,800
Males 2,070,927 1,821,595 1,742,248 19,545 19,036 15,715
Race and Ethnicity
Hispanics/Latinos 727,455 635,353 605,010 4,334 5,081 3,950
American Indians/Alaska Natives 96,324 86,959 83,575 263 287 225
Asians 104,557 89,889 93,595 732 645 396
Blacks or African Americans 1,200,847 1,070,430 938,965 11,082 11,813 8,563
Native Hawaiians/Pacific Islanders 23,788 21,424 23,496 70 93 74
Whites 2,024,619 1,802,497 1,727,676 16,971 16,207 14,232
More than one race 79,879 72,533 70,608 298 293 275
Employment Status
Employed 583,877 529,670 466,806 1,059 1,187 1,182
Not employed or with layoff notice 3,437,708 3,040,780 2,850,749 31,836 32,330 25,632
Veteran Status
Veterans 264,001 238,667 207,038 6,335 5,652 5,169
Disabled veterans 66,005 60,068 54,905 1,351 1,430 1,308
Homeless veterans 22,267 21,892 19,490 348 391 439
With other significant barrier 113,232 90,460 82,588 249 409 785
Other eligible persons 5,647 5,483 5,222 55 50 20
Active duty military spouses -- -- 4,376 -- -- *
Attended TAP Workshop in 3 prior years (among veterans and TSMs)
-- -- 19,452 -- -- 277
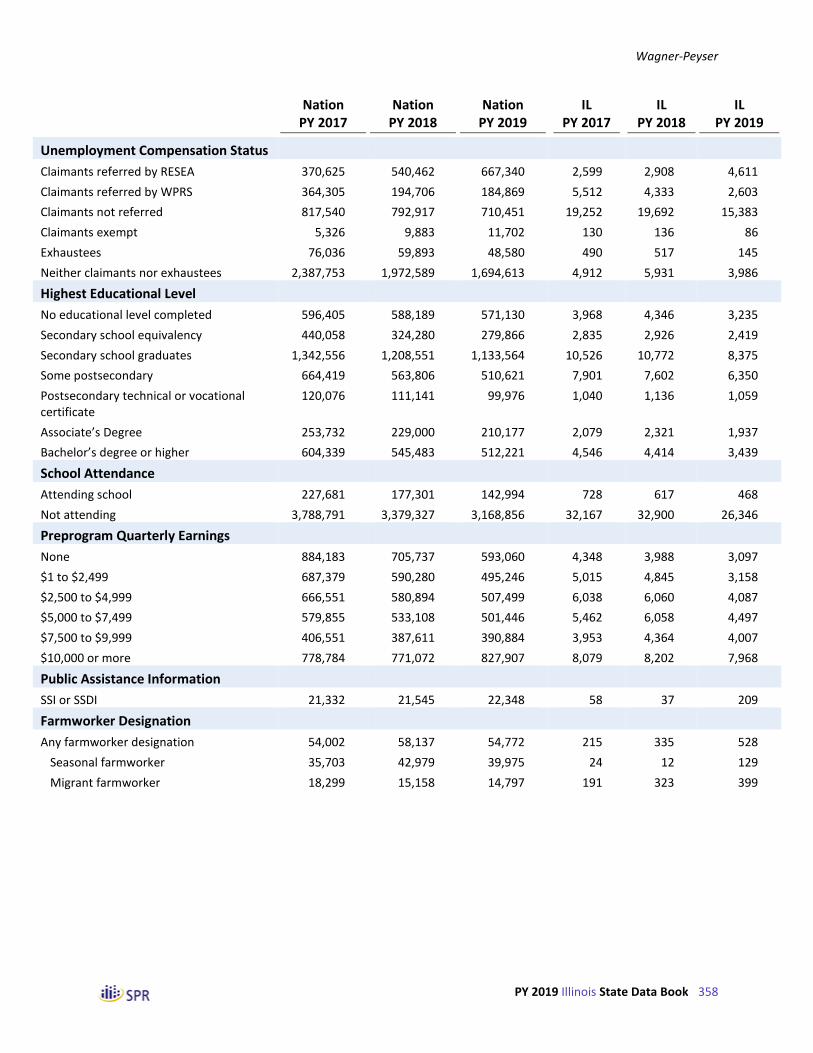
Wagner-Peyser
PY 2019 Illinois State Data Book 358
Nation PY 2017
Nation PY 2018
Nation PY 2019
IL PY 2017
IL PY 2018
IL PY 2019
Unemployment Compensation Status
Claimants referred by RESEA 370,625 540,462 667,340 2,599 2,908 4,611
Claimants referred by WPRS 364,305 194,706 184,869 5,512 4,333 2,603
Claimants not referred 817,540 792,917 710,451 19,252 19,692 15,383
Claimants exempt 5,326 9,883 11,702 130 136 86
Exhaustees 76,036 59,893 48,580 490 517 145
Neither claimants nor exhaustees 2,387,753 1,972,589 1,694,613 4,912 5,931 3,986
Highest Educational Level
No educational level completed 596,405 588,189 571,130 3,968 4,346 3,235
Secondary school equivalency 440,058 324,280 279,866 2,835 2,926 2,419
Secondary school graduates 1,342,556 1,208,551 1,133,564 10,526 10,772 8,375
Some postsecondary 664,419 563,806 510,621 7,901 7,602 6,350
Postsecondary technical or vocational certificate
120,076 111,141 99,976 1,040 1,136 1,059
Associate’s Degree 253,732 229,000 210,177 2,079 2,321 1,937
Bachelor’s degree or higher 604,339 545,483 512,221 4,546 4,414 3,439
School Attendance
Attending school 227,681 177,301 142,994 728 617 468
Not attending 3,788,791 3,379,327 3,168,856 32,167 32,900 26,346
Preprogram Quarterly Earnings
None 884,183 705,737 593,060 4,348 3,988 3,097
$1 to $2,499 687,379 590,280 495,246 5,015 4,845 3,158
$2,500 to $4,999 666,551 580,894 507,499 6,038 6,060 4,087
$5,000 to $7,499 579,855 533,108 501,446 5,462 6,058 4,497
$7,500 to $9,999 406,551 387,611 390,884 3,953 4,364 4,007
$10,000 or more 778,784 771,072 827,907 8,079 8,202 7,968
Public Assistance Information
SSI or SSDI 21,332 21,545 22,348 58 37 209
Farmworker Designation
Any farmworker designation 54,002 58,137 54,772 215 335 528
Seasonal farmworker 35,703 42,979 39,975 24 12 129
Migrant farmworker 18,299 15,158 14,797 191 323 399
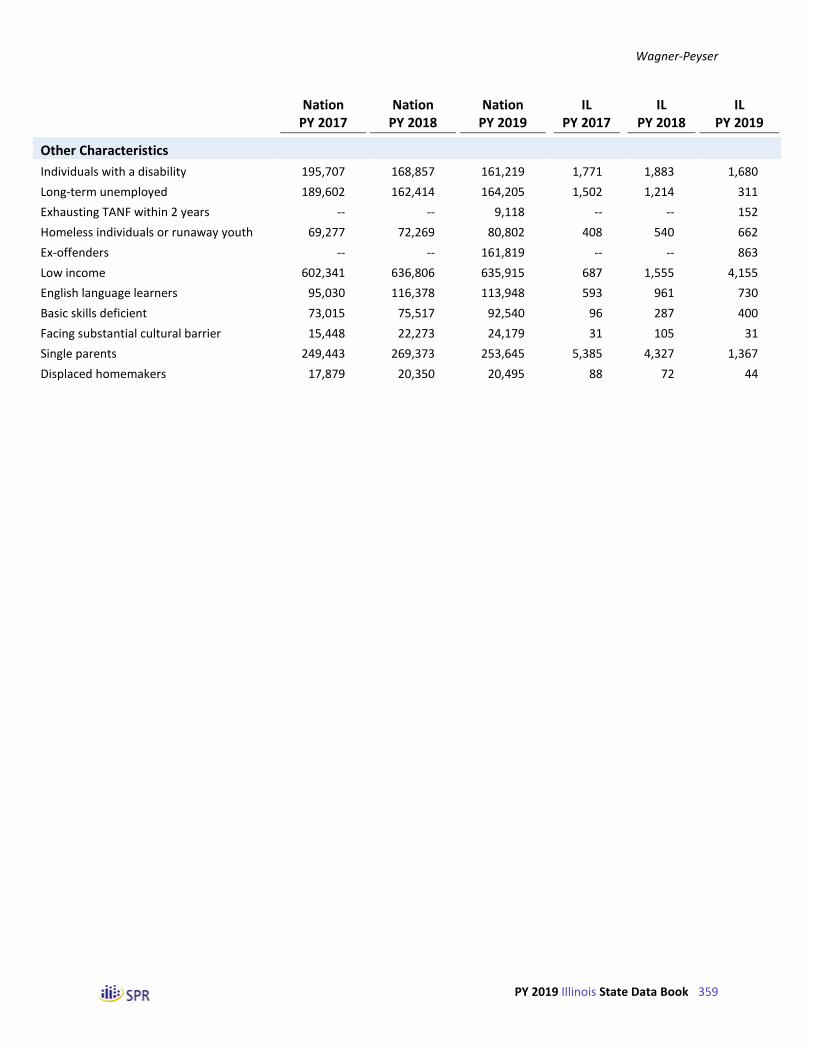
Wagner-Peyser
PY 2019 Illinois State Data Book 359
Nation PY 2017
Nation PY 2018
Nation PY 2019
IL PY 2017
IL PY 2018
IL PY 2019
Other Characteristics
Individuals with a disability 195,707 168,857 161,219 1,771 1,883 1,680
Long-term unemployed 189,602 162,414 164,205 1,502 1,214 311
Exhausting TANF within 2 years -- -- 9,118 -- -- 152
Homeless individuals or runaway youth 69,277 72,269 80,802 408 540 662
Ex-offenders -- -- 161,819 -- -- 863
Low income 602,341 636,806 635,915 687 1,555 4,155
English language learners 95,030 116,378 113,948 593 961 730
Basic skills deficient 73,015 75,517 92,540 96 287 400
Facing substantial cultural barrier 15,448 22,273 24,179 31 105 31
Single parents 249,443 269,373 253,645 5,385 4,327 1,367
Displaced homemakers 17,879 20,350 20,495 88 72 44

Wagner-Peyser
PY 2019 Illinois State Data Book 360
Table VI-3 Characteristics of Wagner-Peyser Participants Who Exited from April 2019 to March 2020 in
IL, by Age at Program Entry
(Derived from PY 2019 Q4 PIRL)
Under 22 22 to 29 30 to 44 45 to 54 55 and Older
Number of exiters 765 3,468 8,382 6,344 7,757
Age Categories
Under 22 100.0 0.0 0.0 0.0 0.0
22 to 29 0.0 100.0 0.0 0.0 0.0
30 to 44 0.0 0.0 100.0 0.0 0.0
45 to 54 0.0 0.0 0.0 100.0 0.0
55 and older 0.0 0.0 0.0 0.0 100.0
Gender
Females 38.0 43.0 41.5 40.2 39.5
Males 62.0 57.0 58.5 59.8 60.5
Race and Ethnicity
Hispanics/Latinos 30.7 19.1 15.6 14.8 10.4
American Indians/Alaska Natives 1.6 1.2 1.1 0.8 0.8
Asians 0.9 1.3 1.4 2.2 1.9
Blacks or African Americans 44.5 47.9 39.4 35.0 30.3
Native Hawaiians/Pacific Islanders 0.6 0.4 0.5 0.2 0.2
Whites 56.6 51.6 59.0 62.6 67.6
More than one race 4.2 2.2 1.2 0.8 0.8
Employment Status
Employed 22.7 5.0 3.4 3.9 3.5
Not employed or with layoff notice 77.3 95.0 96.6 96.1 96.5
Veteran Status
Veterans 5.2 15.6 16.4 20.2 24.6
Disabled veterans 1.4 4.2 6.3 4.7 4.1
Homeless veterans 0.7 1.2 1.3 1.9 2.1
With other significant barrier 1.0 2.7 2.6 2.7 3.8
Other eligible persons 0.1 0.1 0.0 0.0 0.1
Active duty military spouses 0.1 0.0 0.0 0.0 0.0
Attended TAP Workshop in 3 prior years (among veterans and TSMs)
31.0 30.0 5.7 1.3 0.1

Wagner-Peyser
PY 2019 Illinois State Data Book 361
Under 22 22 to 29 30 to 44 45 to 54 55 and Older
Unemployment Compensation Status
Claimants referred by RESEA 6.4 14.7 18.7 17.2 17.7
Claimants referred by WPRS 0.9 8.6 10.5 10.1 10.0
Claimants not referred 52.2 57.7 57.7 58.7 56.3
Claimants exempt 0.1 0.3 0.3 0.4 0.3
Exhaustees 0.1 0.3 0.4 0.6 0.7
Neither claimants nor exhaustees 40.3 18.3 12.3 13.1 15.0
Highest Educational Level
No educational level completed 28.6 9.8 10.7 12.8 12.3
Secondary school equivalency 4.3 8.5 10.9 8.8 7.9
Secondary school graduates 51.8 43.7 28.6 27.4 29.3
Some postsecondary 11.9 21.3 23.8 24.1 25.5
Postsecondary technical or vocational certificate
2.0 3.4 4.8 4.4 3.2
Associate’s Degree 1.3 5.4 8.3 7.6 7.1
Bachelor’s degree or higher 0.1 7.8 12.9 14.8 14.7
School Attendance
Attending school 8.2 2.6 1.3 1.5 1.1
Not attending 91.8 97.4 98.7 98.5 98.9
Preprogram Quarterly Earnings
Average Earnings $4,527 $6,664 $8,930 $10,243 $9,842
None 28.9 14.7 10.5 9.3 11.5
$1 to $2,499 23.8 15.9 10.9 10.1 10.9
$2,500 to $4,999 21.0 19.9 14.6 13.2 14.9
$5,000 to $7,499 13.1 19.0 17.9 16.4 15.2
$7,500 to $9,999 8.5 14.6 16.1 15.0 14.4
$10,000 or more 4.7 15.8 30.0 36.0 33.1
Public Assistance Information
SSI or SSDI 0.4 0.5 0.6 0.7 1.1
Farmworker Designation
Any farmworker designation 15.8 1.7 1.3 1.7 1.7
Seasonal farmworker 2.5 0.3 0.5 0.5 0.3
Migrant farmworker 13.3 1.4 0.7 1.2 1.4

Wagner-Peyser
PY 2019 Illinois State Data Book 362
Under 22 22 to 29 30 to 44 45 to 54 55 and Older
Other Characteristics
Individuals with a disability 4.6 5.6 8.0 6.4 6.5
Long-term unemployed 0.4 1.4 1.1 1.2 1.2
Exhausting TANF within 2 years 0.4 0.9 1.0 0.5 0.6
Homeless individuals or runaway youth 1.7 2.4 2.2 2.6 2.7
Ex-offenders 2.8 3.5 3.7 4.1 2.6
Low income 24.2 19.8 15.4 13.7 13.7
English language learners 9.2 1.7 2.0 3.2 2.9
Basic skills deficient 3.9 2.0 0.8 1.3 1.2
Facing substantial cultural barrier 0.1 0.0 0.1 0.1 0.2
Single parents 20.0 23.6 14.6 12.9 10.1
Displaced homemakers 0.0 0.2 0.2 0.2 0.1

Wagner-Peyser
PY 2019 Illinois State Data Book 363
Table VI-4 Characteristics of Wagner-Peyser Participants Who Exited from April 2019 to March 2020 in
IL, by Ethnicity and Race
(Derived from PY 2019 Q4 PIRL)
Ethnicity Race
Hispanic Not Hispanic White Only Black Only Other
Number of exiters 3,950 22,643 14,005 8,383 803
Age Categories
Under 22 6.0 2.3 2.4 3.1 4.6
22 to 29 16.7 12.3 10.6 16.5 15.3
30 to 44 33.0 31.0 29.6 33.0 30.4
45 to 54 23.8 23.8 24.4 22.7 23.6
55 and older 20.4 30.5 32.9 24.7 26.1
Gender
Females 38.1 41.2 38.5 46.0 42.6
Males 61.9 58.8 61.5 54.0 57.4
Race and Ethnicity
Hispanics/Latinos 100.0 0.0 12.8 1.8 15.1
American Indians/Alaska Natives 3.4 0.7 0.0 0.0 28.0
Asians 0.8 1.8 0.0 0.0 49.3
Blacks or African Americans 8.0 39.7 0.0 100.0 22.4
Native Hawaiians/Pacific Islanders 1.5 0.2 0.0 0.0 9.2
Whites 88.3 58.7 100.0 0.0 28.3
More than one race 1.6 1.1 0.0 0.0 34.2
Employment Status
Employed 13.0 2.9 4.1 3.4 5.1
Not employed or with layoff notice 87.0 97.1 95.9 96.6 94.9
Veteran Status
Veterans 11.3 20.7 21.9 16.9 19.4
Disabled veterans 2.8 5.2 5.4 4.4 6.0
Homeless veterans 0.7 1.8 1.1 2.7 2.0
With other significant barrier 1.5 3.2 2.9 3.6 2.9
Other eligible persons 0.0 0.1 0.1 0.0 0.4
Active duty military spouses 0.1 0.0 0.0 0.0 0.1
Attended TAP Workshop in 3 prior years (among veterans and TSMs)
10.6 4.8 4.8 5.1 13.8

Wagner-Peyser
PY 2019 Illinois State Data Book 364
Ethnicity Race
Hispanic Not Hispanic White Only Black Only Other
Unemployment Compensation Status
Claimants referred by RESEA 8.6 18.7 23.4 9.9 12.0
Claimants referred by WPRS 7.7 10.1 8.6 12.8 11.1
Claimants not referred 60.8 56.8 53.8 60.0 59.5
Claimants exempt 0.8 0.2 0.3 0.2 0.5
Exhaustees 0.6 0.5 0.4 0.8 0.9
Neither claimants nor exhaustees 21.5 13.7 13.5 16.4 16.1
Highest Educational Level
No educational level completed 31.4 8.6 9.0 11.7 12.1
Secondary school equivalency 10.0 8.9 8.8 9.5 7.2
Secondary school graduates 27.6 31.9 32.0 31.3 28.5
Some postsecondary 15.8 25.1 23.8 25.7 21.0
Postsecondary technical or vocational certificate
3.0 4.1 4.2 4.1 3.2
Associate’s Degree 4.7 7.7 8.1 6.6 5.7
Bachelor’s degree or higher 7.4 13.7 14.1 11.1 22.2
School Attendance
Attending school 1.5 1.7 1.3 2.1 4.4
Not attending 98.5 98.3 98.7 97.9 95.6
Preprogram Quarterly Earnings
Average Earnings $9,036 $9,136 $10,239 $7,017 $10,624
None 13.1 11.2 9.9 13.4 15.4
$1 to $2,499 11.5 11.8 9.2 16.5 9.5
$2,500 to $4,999 13.1 15.7 13.1 19.4 12.6
$5,000 to $7,499 16.5 16.8 15.9 18.9 15.2
$7,500 to $9,999 16.3 14.7 15.4 13.8 14.3
$10,000 or more 29.6 29.7 36.4 18.0 33.0
Public Assistance Information
SSI or SSDI 0.7 0.8 0.7 1.0 1.2
Farmworker Designation
Any farmworker designation 12.1 0.2 1.8 0.3 0.5
Seasonal farmworker 2.7 0.1 0.7 0.0 0.1
Migrant farmworker 9.3 0.1 1.1 0.3 0.4

Wagner-Peyser
PY 2019 Illinois State Data Book 365
Ethnicity Race
Hispanic Not Hispanic White Only Black Only Other
Other Characteristics
Individuals with a disability 3.8 7.4 7.7 6.1 8.5
Long-term unemployed 0.5 1.3 0.7 2.1 1.7
Exhausting TANF within 2 years 0.5 0.8 0.7 0.8 0.8
Homeless individuals or runaway youth 1.3 2.7 1.8 3.8 2.4
Ex-offenders 1.8 3.7 3.1 4.6 3.3
Low income 18.7 15.0 12.5 20.1 17.8
English language learners 15.8 0.4 2.3 0.5 4.5
Basic skills deficient 3.6 1.1 1.3 1.6 2.1
Facing substantial cultural barrier 0.5 0.1 0.1 0.1 0.0
Single parents 16.6 13.2 11.2 18.3 9.7
Displaced homemakers 0.1 0.2 0.2 0.2 0.0

Wagner-Peyser
PY 2019 Illinois State Data Book 366
Table VI-5 Characteristics of Wagner-Peyser Participants Who Exited from April 2019 to March 2020 in
IL, by Gender, Employment Status, and Disability Status
(Derived from PY 2019 Q4 PIRL)
Gender Employment Status Has a
Female Male Employed Not Employed Disability
Number of exiters 10,800 15,715 1,182 25,632 1,680
Age Categories
Under 22 2.7 3.0 15.0 2.3 2.0
22 to 29 13.8 12.5 15.1 12.9 10.8
30 to 44 31.9 30.8 24.6 31.7 37.5
45 to 54 23.5 24.0 21.5 23.8 22.4
55 and older 28.2 29.7 23.7 29.3 27.3
Gender
Females 100.0 0.0 40.6 40.7 20.2
Males 0.0 100.0 59.4 59.3 79.8
Race and Ethnicity
Hispanics/Latinos 14.0 15.6 43.8 13.5 8.5
American Indians/Alaska Natives 0.7 1.2 1.3 1.0 1.6
Asians 2.1 1.4 1.4 1.7 1.4
Blacks or African Americans 41.0 34.0 33.8 37.0 33.6
Native Hawaiians/Pacific Islanders 0.2 0.4 0.4 0.3 0.5
Whites 57.1 64.4 66.3 61.2 64.9
More than one race 1.1 1.3 3.3 1.1 1.9
Employment Status
Employed 4.4 4.4 100.0 0.0 7.0
Not employed or with layoff notice 95.6 95.6 0.0 100.0 93.0
Veteran Status
Veterans 5.5 28.7 18.4 19.3 82.9
Disabled veterans 1.7 7.0 7.1 4.8 77.8
Homeless veterans 0.3 2.5 1.9 1.6 7.9
With other significant barrier 1.0 4.3 4.1 2.9 21.5
Other eligible persons 0.2 0.0 0.1 0.1 0.1
Active duty military spouses 0.0 0.0 0.0 0.0 0.0
Attended TAP Workshop in 3 prior years (among veterans and TSMs)
9.3 4.8 4.6 5.4 8.3

Wagner-Peyser
PY 2019 Illinois State Data Book 367
Gender Employment Status Has a
Female Male Employed Not Employed Disability
Unemployment Compensation Status
Claimants referred by RESEA 23.1 13.1 2.0 17.9 4.5
Claimants referred by WPRS 9.2 10.1 4.0 10.0 11.8
Claimants not referred 54.0 59.6 28.1 58.7 56.2
Claimants exempt 0.1 0.5 0.3 0.3 0.9
Exhaustees 0.7 0.5 0.2 0.6 1.1
Neither claimants nor exhaustees 12.9 16.3 65.4 12.5 25.6
Highest Educational Level
No educational level completed 11.4 12.6 35.6 11.0 3.0
Secondary school equivalency 8.0 9.8 5.0 9.2 5.5
Secondary school graduates 29.0 32.9 24.2 31.6 27.0
Some postsecondary 24.4 23.2 14.2 24.1 28.9
Postsecondary technical or vocational certificate
3.8 4.1 3.6 4.0 4.8
Associate’s Degree 8.9 6.1 5.8 7.3 10.1
Bachelor’s degree or higher 14.6 11.5 11.6 12.9 20.8
School Attendance
Attending school 1.9 1.6 9.6 1.4 5.9
Not attending 98.1 98.4 90.4 98.6 94.1
Preprogram Quarterly Earnings
Average Earnings $7,772 $10,095 $5,849 $9,231 $9,119
None 9.0 13.3 34.9 10.5 27.9
$1 to $2,499 13.6 10.6 20.5 11.4 13.0
$2,500 to $4,999 18.5 13.0 16.2 15.2 13.6
$5,000 to $7,499 19.9 14.6 10.3 17.1 10.3
$7,500 to $9,999 16.4 14.0 7.0 15.3 10.5
$10,000 or more 22.7 34.5 11.2 30.6 24.7
Public Assistance Information
SSI or SSDI 0.7 0.9 1.1 0.8 3.7
Farmworker Designation
Any farmworker designation 1.8 2.1 40.2 0.2 0.2
Seasonal farmworker 0.6 0.4 10.2 0.0 0.0
Migrant farmworker 1.2 1.7 29.9 0.2 0.2

Wagner-Peyser
PY 2019 Illinois State Data Book 368
Gender Employment Status Has a
Female Male Employed Not Employed Disability
Other Characteristics
Individuals with a disability 3.5 9.0 10.2 6.7 100.0
Long-term unemployed 1.0 1.3 0.5 1.2 3.2
Exhausting TANF within 2 years 1.1 0.6 0.5 0.8 0.8
Homeless individuals or runaway youth 0.9 3.6 2.8 2.5 9.3
Ex-offenders 1.3 5.0 5.3 3.3 5.9
Low income 15.2 15.9 16.1 15.5 24.1
English language learners 2.8 2.7 25.0 1.7 0.5
Basic skills deficient 1.7 1.3 5.2 1.3 3.6
Facing substantial cultural barrier 0.0 0.2 1.4 0.1 0.1
Single parents 17.0 11.7 19.2 13.3 16.3
Displaced homemakers 0.3 0.1 0.3 0.2 0.2
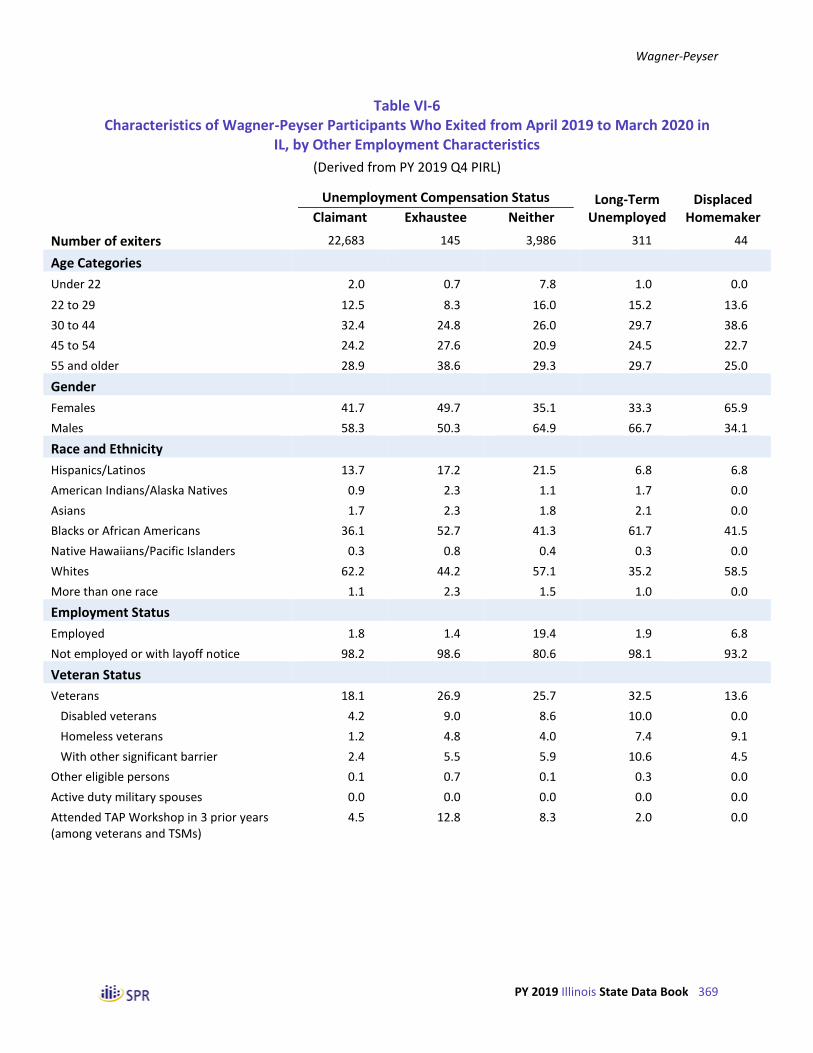
Wagner-Peyser
PY 2019 Illinois State Data Book 369
Table VI-6 Characteristics of Wagner-Peyser Participants Who Exited from April 2019 to March 2020 in
IL, by Other Employment Characteristics
(Derived from PY 2019 Q4 PIRL)
Unemployment Compensation Status Long-Term Displaced
Claimant Exhaustee Neither Unemployed Homemaker
Number of exiters 22,683 145 3,986 311 44
Age Categories
Under 22 2.0 0.7 7.8 1.0 0.0
22 to 29 12.5 8.3 16.0 15.2 13.6
30 to 44 32.4 24.8 26.0 29.7 38.6
45 to 54 24.2 27.6 20.9 24.5 22.7
55 and older 28.9 38.6 29.3 29.7 25.0
Gender
Females 41.7 49.7 35.1 33.3 65.9
Males 58.3 50.3 64.9 66.7 34.1
Race and Ethnicity
Hispanics/Latinos 13.7 17.2 21.5 6.8 6.8
American Indians/Alaska Natives 0.9 2.3 1.1 1.7 0.0
Asians 1.7 2.3 1.8 2.1 0.0
Blacks or African Americans 36.1 52.7 41.3 61.7 41.5
Native Hawaiians/Pacific Islanders 0.3 0.8 0.4 0.3 0.0
Whites 62.2 44.2 57.1 35.2 58.5
More than one race 1.1 2.3 1.5 1.0 0.0
Employment Status
Employed 1.8 1.4 19.4 1.9 6.8
Not employed or with layoff notice 98.2 98.6 80.6 98.1 93.2
Veteran Status
Veterans 18.1 26.9 25.7 32.5 13.6
Disabled veterans 4.2 9.0 8.6 10.0 0.0
Homeless veterans 1.2 4.8 4.0 7.4 9.1
With other significant barrier 2.4 5.5 5.9 10.6 4.5
Other eligible persons 0.1 0.7 0.1 0.3 0.0
Active duty military spouses 0.0 0.0 0.0 0.0 0.0
Attended TAP Workshop in 3 prior years (among veterans and TSMs)
4.5 12.8 8.3 2.0 0.0

Wagner-Peyser
PY 2019 Illinois State Data Book 370
Unemployment Compensation Status Long-Term Displaced
Claimant Exhaustee Neither Unemployed Homemaker
Unemployment Compensation Status
Claimants referred by RESEA 20.3 0.0 0.0 6.1 20.5
Claimants referred by WPRS 11.5 0.0 0.0 9.6 9.1
Claimants not referred 67.8 0.0 0.0 49.2 45.5
Claimants exempt 0.4 0.0 0.0 0.0 0.0
Exhaustees 0.0 100.0 0.0 1.3 0.0
Neither claimants nor exhaustees 0.0 0.0 100.0 33.8 25.0
Highest Educational Level
No educational level completed 10.7 11.7 19.7 9.3 6.8
Secondary school equivalency 9.3 5.5 7.6 11.3 13.6
Secondary school graduates 31.5 25.5 30.0 25.1 15.9
Some postsecondary 24.3 25.5 19.9 25.4 45.5
Postsecondary technical or vocational certificate
4.0 3.4 3.9 3.5 2.3
Associate’s Degree 7.4 10.3 6.1 11.3 9.1
Bachelor’s degree or higher 12.8 17.9 12.8 14.1 6.8
School Attendance
Attending school 1.1 4.8 5.3 6.4 0.0
Not attending 98.9 95.2 94.7 93.6 100.0
Preprogram Quarterly Earnings
Average Earnings $9,232 $7,853 $8,345 $6,364 $6,020
None 8.3 29.0 29.6 31.8 15.9
$1 to $2,499 10.9 20.7 16.3 19.0 25.0
$2,500 to $4,999 15.6 17.9 13.0 13.2 18.2
$5,000 to $7,499 17.7 11.0 11.8 14.5 13.6
$7,500 to $9,999 16.1 5.5 9.0 10.6 13.6
$10,000 or more 31.5 15.9 20.3 10.9 13.6
Public Assistance Information
SSI or SSDI 0.6 1.4 1.8 2.3 0.0
Farmworker Designation
Any farmworker designation 0.1 0.0 12.8 0.3 2.3
Seasonal farmworker 0.0 0.0 3.1 0.0 0.0
Migrant farmworker 0.1 0.0 9.7 0.3 2.3

Wagner-Peyser
PY 2019 Illinois State Data Book 371
Unemployment Compensation Status Long-Term Displaced
Claimant Exhaustee Neither Unemployed Homemaker
Other Characteristics
Individuals with a disability 6.0 12.9 11.1 18.0 7.5
Long-term unemployed 0.9 2.8 2.6 100.0 11.4
Exhausting TANF within 2 years 0.7 1.5 1.1 0.8 3.7
Homeless individuals or runaway youth 1.9 5.5 5.6 9.3 9.1
Ex-offenders 3.0 2.8 6.0 11.0 6.8
Low income 14.2 39.3 22.3 24.1 20.5
English language learners 1.8 2.8 8.3 1.0 0.0
Basic skills deficient 1.3 6.2 2.6 1.6 0.0
Facing substantial cultural barrier 0.1 0.0 0.4 0.0 0.0
Single parents 12.3 21.7 26.2 36.2 52.8
Displaced homemakers 0.1 0.0 0.3 1.6 100.0
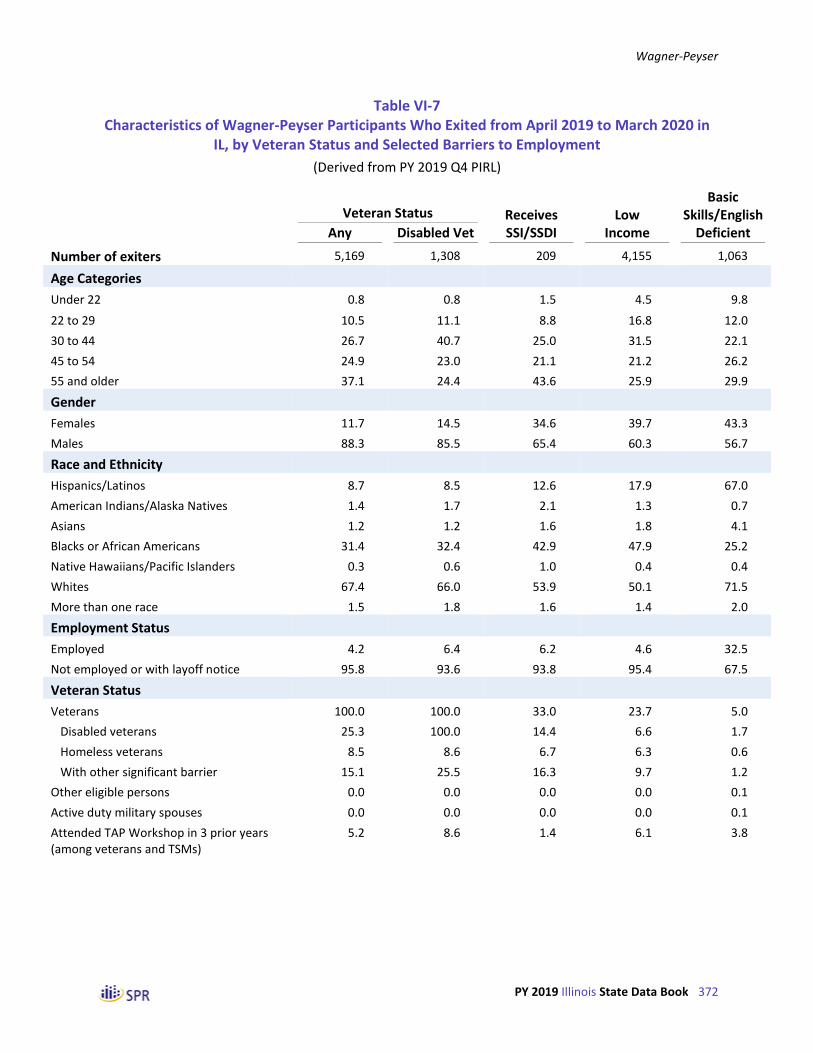
Wagner-Peyser
PY 2019 Illinois State Data Book 372
Table VI-7 Characteristics of Wagner-Peyser Participants Who Exited from April 2019 to March 2020 in
IL, by Veteran Status and Selected Barriers to Employment
(Derived from PY 2019 Q4 PIRL)
Veteran Status Receives Low Basic
Skills/English
Any Disabled Vet SSI/SSDI Income Deficient
Number of exiters 5,169 1,308 209 4,155 1,063
Age Categories
Under 22 0.8 0.8 1.5 4.5 9.8
22 to 29 10.5 11.1 8.8 16.8 12.0
30 to 44 26.7 40.7 25.0 31.5 22.1
45 to 54 24.9 23.0 21.1 21.2 26.2
55 and older 37.1 24.4 43.6 25.9 29.9
Gender
Females 11.7 14.5 34.6 39.7 43.3
Males 88.3 85.5 65.4 60.3 56.7
Race and Ethnicity
Hispanics/Latinos 8.7 8.5 12.6 17.9 67.0
American Indians/Alaska Natives 1.4 1.7 2.1 1.3 0.7
Asians 1.2 1.2 1.6 1.8 4.1
Blacks or African Americans 31.4 32.4 42.9 47.9 25.2
Native Hawaiians/Pacific Islanders 0.3 0.6 1.0 0.4 0.4
Whites 67.4 66.0 53.9 50.1 71.5
More than one race 1.5 1.8 1.6 1.4 2.0
Employment Status
Employed 4.2 6.4 6.2 4.6 32.5
Not employed or with layoff notice 95.8 93.6 93.8 95.4 67.5
Veteran Status
Veterans 100.0 100.0 33.0 23.7 5.0
Disabled veterans 25.3 100.0 14.4 6.6 1.7
Homeless veterans 8.5 8.6 6.7 6.3 0.6
With other significant barrier 15.1 25.5 16.3 9.7 1.2
Other eligible persons 0.0 0.0 0.0 0.0 0.1
Active duty military spouses 0.0 0.0 0.0 0.0 0.1
Attended TAP Workshop in 3 prior years (among veterans and TSMs)
5.2 8.6 1.4 6.1 3.8

Wagner-Peyser
PY 2019 Illinois State Data Book 373
Veteran Status Receives Low Basic
Skills/English
Any Disabled Vet SSI/SSDI Income Deficient
Unemployment Compensation Status
Claimants referred by RESEA 4.1 2.4 1.4 1.8 3.2
Claimants referred by WPRS 13.2 13.1 14.8 10.6 7.5
Claimants not referred 61.4 56.3 49.3 64.4 47.9
Claimants exempt 0.7 1.1 0.0 0.5 0.7
Exhaustees 0.8 1.0 1.0 1.4 1.2
Neither claimants nor exhaustees 19.8 26.1 33.5 21.4 39.5
Highest Educational Level
No educational level completed 2.9 1.1 8.6 13.3 52.3
Secondary school equivalency 5.7 4.2 9.1 10.4 6.2
Secondary school graduates 30.5 24.4 34.9 33.5 26.6
Some postsecondary 29.8 30.9 22.5 22.5 6.0
Postsecondary technical or vocational certificate
5.2 5.4 3.3 4.1 1.1
Associate’s Degree 9.4 10.7 8.6 6.6 2.7
Bachelor’s degree or higher 16.4 23.2 12.9 9.6 5.0
School Attendance
Attending school 2.9 5.7 3.3 2.3 3.2
Not attending 97.1 94.3 96.7 97.7 96.8
Preprogram Quarterly Earnings
Average Earnings $10,472 $9,915 $6,355 $6,787 $7,090
None 21.2 27.8 33.5 20.7 19.1
$1 to $2,499 10.4 11.0 18.2 19.9 18.8
$2,500 to $4,999 12.1 12.2 15.8 18.9 16.5
$5,000 to $7,499 11.8 9.7 11.0 14.2 15.8
$7,500 to $9,999 11.5 11.3 7.2 10.1 12.3
$10,000 or more 33.0 28.0 14.4 16.2 17.5
Public Assistance Information
SSI or SSDI 1.3 2.3 100.0 2.2 1.4
Farmworker Designation
Any farmworker designation 0.1 0.1 0.5 0.3 28.1
Seasonal farmworker 0.0 0.0 0.0 0.1 8.2
Migrant farmworker 0.1 0.1 0.5 0.2 19.9

Wagner-Peyser
PY 2019 Illinois State Data Book 374
Veteran Status Receives Low Basic
Skills/English
Any Disabled Vet SSI/SSDI Income Deficient
Other Characteristics
Individuals with a disability 27.6 99.9 30.7 9.9 6.3
Long-term unemployed 2.0 2.4 3.3 1.8 0.8
Exhausting TANF within 2 years 0.5 0.6 26.6 1.5 0.8
Homeless individuals or runaway youth 10.3 9.9 12.0 11.6 2.4
Ex-offenders 5.4 5.4 11.6 11.8 4.9
Low income 19.1 21.1 43.1 100.0 29.3
English language learners 0.1 0.2 2.4 2.5 68.7
Basic skills deficient 0.9 1.3 4.8 5.8 37.6
Facing substantial cultural barrier 0.2 0.1 0.0 0.1 1.3
Single parents 12.2 14.9 15.4 20.5 24.7
Displaced homemakers 0.1 0.0 0.0 0.2 0.0
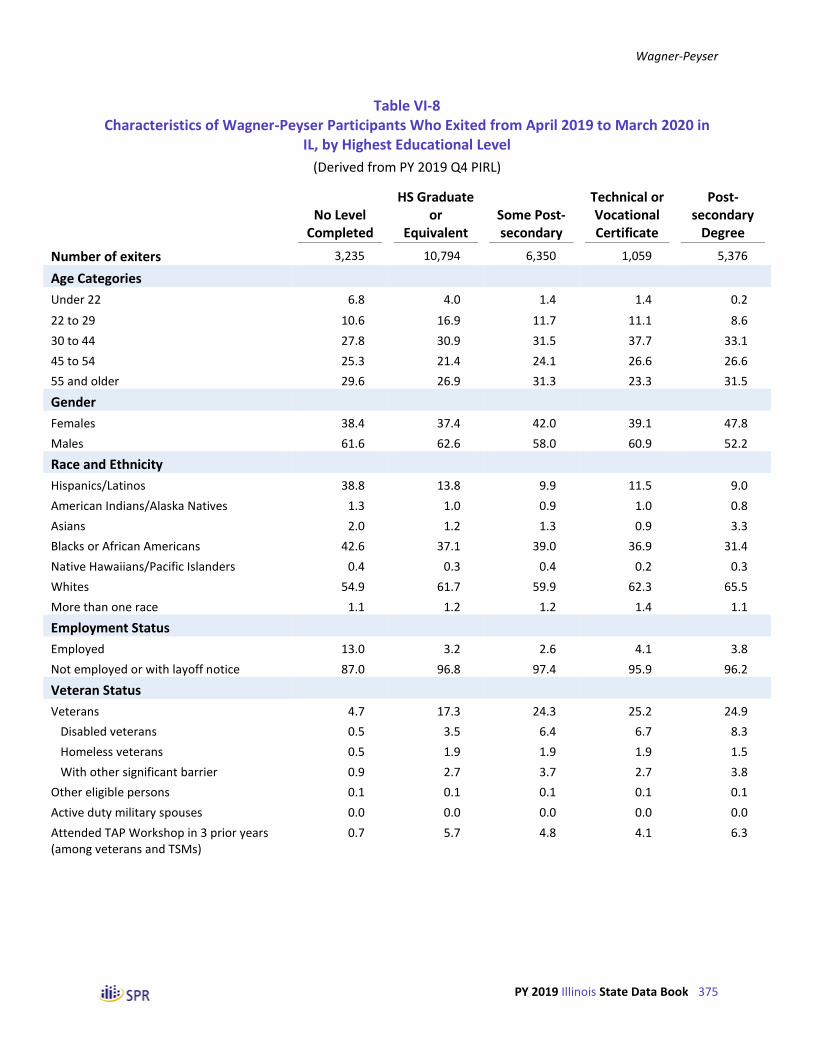
Wagner-Peyser
PY 2019 Illinois State Data Book 375
Table VI-8 Characteristics of Wagner-Peyser Participants Who Exited from April 2019 to March 2020 in
IL, by Highest Educational Level
(Derived from PY 2019 Q4 PIRL)
No Level Completed
HS Graduate or
Equivalent Some Post-secondary
Technical or Vocational Certificate
Post-secondary
Degree
Number of exiters 3,235 10,794 6,350 1,059 5,376
Age Categories
Under 22 6.8 4.0 1.4 1.4 0.2
22 to 29 10.6 16.9 11.7 11.1 8.6
30 to 44 27.8 30.9 31.5 37.7 33.1
45 to 54 25.3 21.4 24.1 26.6 26.6
55 and older 29.6 26.9 31.3 23.3 31.5
Gender
Females 38.4 37.4 42.0 39.1 47.8
Males 61.6 62.6 58.0 60.9 52.2
Race and Ethnicity
Hispanics/Latinos 38.8 13.8 9.9 11.5 9.0
American Indians/Alaska Natives 1.3 1.0 0.9 1.0 0.8
Asians 2.0 1.2 1.3 0.9 3.3
Blacks or African Americans 42.6 37.1 39.0 36.9 31.4
Native Hawaiians/Pacific Islanders 0.4 0.3 0.4 0.2 0.3
Whites 54.9 61.7 59.9 62.3 65.5
More than one race 1.1 1.2 1.2 1.4 1.1
Employment Status
Employed 13.0 3.2 2.6 4.1 3.8
Not employed or with layoff notice 87.0 96.8 97.4 95.9 96.2
Veteran Status
Veterans 4.7 17.3 24.3 25.2 24.9
Disabled veterans 0.5 3.5 6.4 6.7 8.3
Homeless veterans 0.5 1.9 1.9 1.9 1.5
With other significant barrier 0.9 2.7 3.7 2.7 3.8
Other eligible persons 0.1 0.1 0.1 0.1 0.1
Active duty military spouses 0.0 0.0 0.0 0.0 0.0
Attended TAP Workshop in 3 prior years (among veterans and TSMs)
0.7 5.7 4.8 4.1 6.3

Wagner-Peyser
PY 2019 Illinois State Data Book 376
No Level Completed
HS Graduate or
Equivalent Some Post-secondary
Technical or Vocational Certificate
Post-secondary
Degree
Unemployment Compensation Status
Claimants referred by RESEA 12.8 17.9 19.1 16.2 16.3
Claimants referred by WPRS 7.8 9.6 10.9 11.6 9.3
Claimants not referred 54.2 57.9 56.7 56.4 59.3
Claimants exempt 0.4 0.3 0.2 0.7 0.2
Exhaustees 0.5 0.4 0.6 0.5 0.8
Neither claimants nor exhaustees 24.3 13.9 12.5 14.6 14.1
Highest Educational Level
No educational level completed 100.0 0.0 0.0 0.0 0.0
Secondary school equivalency 0.0 22.4 0.0 0.0 0.0
Secondary school graduates 0.0 77.6 0.0 0.0 0.0
Some postsecondary 0.0 0.0 100.0 0.0 0.0
Postsecondary technical or vocational certificate
0.0 0.0 0.0 100.0 0.0
Associate’s Degree 0.0 0.0 0.0 0.0 36.0
Bachelor’s degree or higher 0.0 0.0 0.0 0.0 64.0
School Attendance
Attending school 2.6 0.3 1.7 2.2 4.0
Not attending 97.4 99.7 98.3 97.8 96.0
Preprogram Quarterly Earnings
Average Earnings $6,831 $8,165 $9,170 $9,305 $12,334
None 14.9 10.3 10.9 12.0 12.6
$1 to $2,499 16.7 12.5 11.7 10.1 7.9
$2,500 to $4,999 19.7 17.0 14.4 15.0 10.1
$5,000 to $7,499 18.1 18.6 16.8 16.1 12.4
$7,500 to $9,999 13.3 15.8 15.3 15.5 13.8
$10,000 or more 17.3 25.8 30.9 31.3 43.3
Public Assistance Information
SSI or SSDI 0.6 0.9 0.7 0.7 0.8
Farmworker Designation
Any farmworker designation 12.3 1.1 0.1 0.1 0.1
Seasonal farmworker 3.0 0.3 0.0 0.0 0.0
Migrant farmworker 9.2 0.8 0.1 0.1 0.1

Wagner-Peyser
PY 2019 Illinois State Data Book 377
No Level Completed
HS Graduate or
Equivalent Some Post-secondary
Technical or Vocational Certificate
Post-secondary
Degree
Other Characteristics
Individuals with a disability 1.7 5.5 8.4 8.1 10.6
Long-term unemployed 0.9 1.0 1.2 1.0 1.5
Exhausting TANF within 2 years 1.1 0.8 0.6 0.5 0.7
Homeless individuals or runaway youth 1.6 2.6 2.6 3.4 2.3
Ex-offenders 3.8 3.9 3.3 4.9 2.1
Low income 17.1 16.9 14.7 16.1 12.5
English language learners 14.9 1.7 0.5 0.4 0.6
Basic skills deficient 3.3 1.8 0.6 0.8 1.0
Facing substantial cultural barrier 0.5 0.1 0.0 0.0 0.1
Single parents 13.5 13.5 14.0 12.1 13.3
Displaced homemakers 0.1 0.1 0.3 0.1 0.1

Wagner-Peyser
PY 2019 Illinois State Data Book 378
Table VI-9 Characteristics of Wagner-Peyser Participants Who Exited from April 2019 to March 2020 in
IL, by Selected Other Characteristics
(Derived from PY 2019 Q4 PIRL)
School Status Migrant/ Seasonal Single
Attending Not Attending Farmworker Homeless Parents
Number of exiters 468 26,346 528 662 1,367
Age Categories
Under 22 14.1 2.7 23.0 2.0 0.8
22 to 29 20.4 12.9 11.2 12.5 13.8
30 to 44 24.4 31.5 19.9 27.7 37.0
45 to 54 21.7 23.8 21.1 25.4 26.1
55 and older 19.5 29.2 24.9 32.4 22.3
Gender
Females 44.2 40.7 36.6 15.2 48.0
Males 55.8 59.3 63.4 84.8 52.0
Race and Ethnicity
Hispanics/Latinos 12.8 14.9 90.7 7.6 15.0
American Indians/Alaska Natives 3.6 0.9 0.0 1.4 0.5
Asians 2.8 1.7 0.4 0.8 1.0
Blacks or African Americans 48.2 36.7 9.7 55.4 57.3
Native Hawaiians/Pacific Islanders 0.8 0.3 0.0 0.5 0.3
Whites 48.5 61.6 91.4 44.3 42.2
More than one race 3.8 1.1 1.4 2.0 0.9
Employment Status
Employed 24.1 4.1 90.0 5.0 6.7
Not employed or with layoff notice 75.9 95.9 10.0 95.0 93.3
Veteran Status
Veterans 31.8 19.1 0.8 80.4 22.2
Disabled veterans 15.8 4.7 0.2 19.5 7.1
Homeless veterans 3.6 1.6 0.4 66.3 2.3
With other significant barrier 5.3 2.9 0.4 33.4 4.2
Other eligible persons 0.2 0.1 0.0 0.0 0.1
Active duty military spouses 0.0 0.0 0.0 0.0 0.1
Attended TAP Workshop in 3 prior years (among veterans and TSMs)
8.6 5.2 0.0 5.3 1.6

Wagner-Peyser
PY 2019 Illinois State Data Book 379
School Status Migrant/ Seasonal Single
Attending Not Attending Farmworker Homeless Parents
Unemployment Compensation Status
Claimants referred by RESEA 3.0 17.4 0.2 2.1 11.7
Claimants referred by WPRS 5.1 9.8 0.8 13.1 17.7
Claimants not referred 45.3 57.6 2.5 49.5 52.9
Claimants exempt 0.2 0.3 0.0 0.2 0.6
Exhaustees 1.5 0.5 0.0 1.2 1.0
Neither claimants nor exhaustees 44.9 14.3 96.6 33.8 16.2
Highest Educational Level
No educational level completed 17.9 12.0 75.2 7.9 11.0
Secondary school equivalency 0.9 9.2 2.5 6.8 11.6
Secondary school graduates 6.2 31.7 19.7 36.3 28.4
Some postsecondary 23.7 23.7 1.5 25.1 26.2
Postsecondary technical or vocational certificate
4.9 3.9 0.2 5.4 3.5
Associate’s Degree 14.1 7.1 0.2 7.4 7.8
Bachelor’s degree or higher 32.3 12.5 0.8 11.2 11.6
School Attendance
Attending school 100.0 0.0 1.3 2.7 2.6
Not attending 0.0 100.0 98.7 97.3 97.4
Preprogram Quarterly Earnings
Average Earnings $8,203 $9,131 $4,275 $5,856 $6,889
None 42.7 11.0 40.2 37.0 13.0
$1 to $2,499 16.2 11.7 32.2 22.4 19.5
$2,500 to $4,999 10.7 15.3 11.0 11.6 18.9
$5,000 to $7,499 7.1 16.9 6.8 9.1 17.8
$7,500 to $9,999 7.7 15.1 3.6 8.5 12.6
$10,000 or more 15.6 30.0 6.3 11.5 18.1
Public Assistance Information
SSI or SSDI 1.5 0.8 0.2 3.8 1.0
Farmworker Designation
Any farmworker designation 1.5 2.0 100.0 0.5 2.0
Seasonal farmworker 0.2 0.5 24.4 0.3 0.2
Migrant farmworker 1.3 1.5 75.6 0.2 1.8

Wagner-Peyser
PY 2019 Illinois State Data Book 380
School Status Migrant/ Seasonal Single
Attending Not Attending Farmworker Homeless Parents
Other Characteristics
Individuals with a disability 21.8 6.6 0.8 24.0 10.2
Long-term unemployed 4.3 1.1 0.2 4.4 7.5
Exhausting TANF within 2 years 0.9 0.7 0.2 1.1 1.1
Homeless individuals or runaway youth 3.8 2.4 0.6 100.0 3.6
Ex-offenders 3.3 3.4 0.4 17.3 4.8
Low income 20.1 15.4 2.1 72.7 17.6
English language learners 1.3 2.7 56.1 1.1 4.4
Basic skills deficient 6.2 1.4 2.7 2.9 3.1
Facing substantial cultural barrier 0.0 0.1 3.2 0.2 0.3
Single parents 22.6 13.4 15.8 15.2 100.0
Displaced homemakers 0.0 0.2 0.2 0.6 1.4

Wagner-Peyser
PY 2019 Illinois State Data Book 381
Table VI-10 Characteristics of Wagner-Peyser Participants Who Exited from April 2019 to March 2020 in
IL, by Major Service Categories
(Derived from PY 2019 Q4 PIRL)
All Exiters
Received Career Services
Basic Individualized Only Career
Services Received Training
Number of exiters 26,814 26,814 7,891 26,535 279
Age Categories
Under 22 2.9 2.9 3.1 2.8 5.2
22 to 29 13.0 13.0 13.2 13.0 13.6
30 to 44 31.4 31.4 29.7 31.4 22.5
45 to 54 23.7 23.7 23.2 23.7 28.2
55 and older 29.0 29.0 30.8 29.0 30.5
Gender
Females 40.7 40.7 39.8 40.6 56.3
Males 59.3 59.3 60.2 59.4 43.7
Race and Ethnicity
Hispanics/Latinos 14.9 14.9 14.0 14.7 33.0
American Indians/Alaska Natives 1.0 1.0 1.2 1.0 0.4
Asians 1.7 1.7 1.5 1.6 6.9
Blacks or African Americans 36.9 36.9 35.9 36.9 36.1
Native Hawaiians/Pacific Islanders 0.3 0.3 0.3 0.3 0.7
Whites 61.4 61.4 62.7 61.4 59.6
More than one race 1.2 1.2 1.5 1.2 3.6
Employment Status
Employed 4.4 4.4 8.0 4.1 30.5
Not employed or with layoff notice 95.6 95.6 92.0 95.9 69.5
Veteran Status
Veterans 19.3 19.3 29.6 19.3 20.4
Disabled veterans 4.9 4.9 11.2 4.9 6.1
Homeless veterans 1.6 1.6 4.6 1.6 1.8
With other significant barrier 2.9 2.9 7.2 2.9 1.8
Other eligible persons 0.1 0.1 0.1 0.1 0.0
Active duty military spouses 0.0 0.0 0.1 0.0 1.4
Attended TAP Workshop in 3 prior years (among veterans and TSMs)
5.3 5.3 7.3 5.4 0.0

Wagner-Peyser
PY 2019 Illinois State Data Book 382
All Exiters
Received Career Services
Basic Individualized Only Career
Services Received Training
Unemployment Compensation Status
Claimants referred by RESEA 17.2 17.2 21.3 17.2 15.8
Claimants referred by WPRS 9.7 9.7 9.4 9.6 22.2
Claimants not referred 57.4 57.4 47.8 57.5 41.2
Claimants exempt 0.3 0.3 0.4 0.3 0.4
Exhaustees 0.5 0.5 0.7 0.5 6.5
Neither claimants nor exhaustees 14.9 14.9 20.4 14.9 14.0
Highest Educational Level
No educational level completed 12.1 12.1 10.9 12.2 1.8
Secondary school equivalency 9.0 9.0 8.0 9.0 9.7
Secondary school graduates 31.2 31.2 30.6 31.1 43.0
Some postsecondary 23.7 23.7 25.2 23.8 14.3
Postsecondary technical or vocational certificate
3.9 3.9 4.1 4.0 2.5
Associate’s Degree 7.2 7.2 8.0 7.2 10.0
Bachelor’s degree or higher 12.8 12.8 13.3 12.8 18.6
School Attendance
Attending school 1.7 1.7 2.7 1.7 5.7
Not attending 98.3 98.3 97.3 98.3 94.3
Preprogram Quarterly Earnings
Average Earnings $9,121 $9,121 $9,017 $9,120 $9,212
None 11.5 11.5 16.1 11.6 2.2
$1 to $2,499 11.8 11.8 11.9 11.7 17.9
$2,500 to $4,999 15.2 15.2 13.8 15.2 23.3
$5,000 to $7,499 16.8 16.8 14.8 16.8 18.3
$7,500 to $9,999 14.9 14.9 14.8 15.0 11.8
$10,000 or more 29.7 29.7 28.6 29.7 26.5
Public Assistance Information
SSI or SSDI 0.8 0.8 1.2 0.8 1.8
Farmworker Designation
Any farmworker designation 2.0 2.0 4.1 2.0 2.5
Seasonal farmworker 0.5 0.5 1.4 0.5 0.7
Migrant farmworker 1.5 1.5 2.7 1.5 1.8
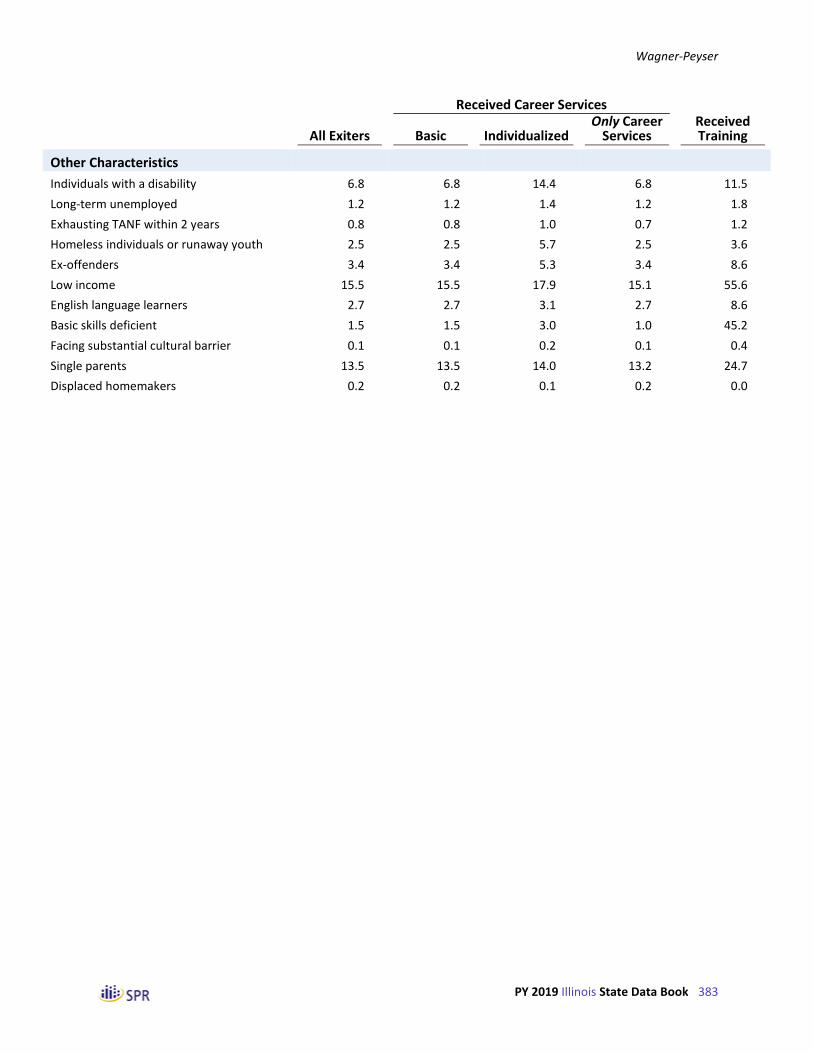
Wagner-Peyser
PY 2019 Illinois State Data Book 383
All Exiters
Received Career Services
Basic Individualized Only Career
Services Received Training
Other Characteristics
Individuals with a disability 6.8 6.8 14.4 6.8 11.5
Long-term unemployed 1.2 1.2 1.4 1.2 1.8
Exhausting TANF within 2 years 0.8 0.8 1.0 0.7 1.2
Homeless individuals or runaway youth 2.5 2.5 5.7 2.5 3.6
Ex-offenders 3.4 3.4 5.3 3.4 8.6
Low income 15.5 15.5 17.9 15.1 55.6
English language learners 2.7 2.7 3.1 2.7 8.6
Basic skills deficient 1.5 1.5 3.0 1.0 45.2
Facing substantial cultural barrier 0.1 0.1 0.2 0.1 0.4
Single parents 13.5 13.5 14.0 13.2 24.7
Displaced homemakers 0.2 0.2 0.1 0.2 0.0

Wagner-Peyser
PY 2019 Illinois State Data Book 384
Table VI-11 Number of Wagner-Peyser Participants Who Exited from April 2019 to March 2020 in IL,
by Major Service Categories
(Derived from PY 2019 Q4 PIRL)
All Exiters
Received Career Services
Basic
Individualized
Only Career Services
Received Training
Number of exiters 26,814 26,814 7,891 26,535 279
Age Categories
Under 22 765 765 241 754 11
22 to 29 3,468 3,468 1,032 3,439 29
30 to 44 8,382 8,382 2,316 8,334 48
45 to 54 6,344 6,344 1,808 6,284 60
55 and older 7,757 7,757 2,399 7,692 65
Gender
Females 10,800 10,800 3,111 10,643 157
Males 15,715 15,715 4,705 15,593 122
Race and Ethnicity
Hispanics/Latinos 3,950 3,950 1,092 3,858 92
American Indians/Alaska Natives 225 225 85 224 *
Asians 396 396 106 377 19
Blacks or African Americans 8,563 8,563 2,490 8,463 100
Native Hawaiians/Pacific Islanders 74 74 23 72 *
Whites 14,232 14,232 4,347 14,067 165
More than one race 275 275 105 265 10
Employment Status
Employed 1,182 1,182 632 1,097 85
Not employed or with layoff notice 25,632 25,632 7,259 25,438 194
Veteran Status
Veterans 5,169 5,169 2,332 5,112 57
Disabled veterans 1,308 1,308 883 1,291 17
Homeless veterans 439 439 363 434 *
With other significant barrier 785 785 569 780 *
Other eligible persons 20 20 9 20 0
Active duty military spouses * * * * *
Attended TAP Workshop in 3 prior years (among veterans and TSMs)
277 277 171 277 0
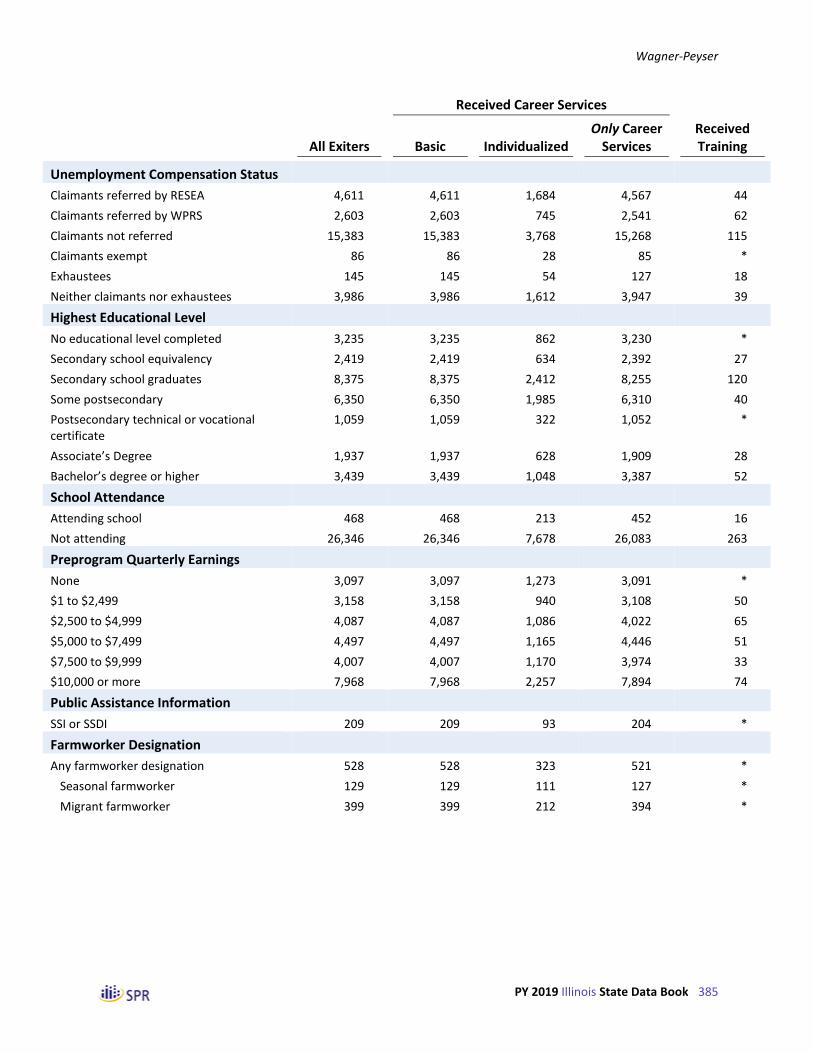
Wagner-Peyser
PY 2019 Illinois State Data Book 385
All Exiters
Received Career Services
Basic
Individualized
Only Career Services
Received Training
Unemployment Compensation Status
Claimants referred by RESEA 4,611 4,611 1,684 4,567 44
Claimants referred by WPRS 2,603 2,603 745 2,541 62
Claimants not referred 15,383 15,383 3,768 15,268 115
Claimants exempt 86 86 28 85 *
Exhaustees 145 145 54 127 18
Neither claimants nor exhaustees 3,986 3,986 1,612 3,947 39
Highest Educational Level
No educational level completed 3,235 3,235 862 3,230 *
Secondary school equivalency 2,419 2,419 634 2,392 27
Secondary school graduates 8,375 8,375 2,412 8,255 120
Some postsecondary 6,350 6,350 1,985 6,310 40
Postsecondary technical or vocational certificate
1,059 1,059 322 1,052 *
Associate’s Degree 1,937 1,937 628 1,909 28
Bachelor’s degree or higher 3,439 3,439 1,048 3,387 52
School Attendance
Attending school 468 468 213 452 16
Not attending 26,346 26,346 7,678 26,083 263
Preprogram Quarterly Earnings
None 3,097 3,097 1,273 3,091 *
$1 to $2,499 3,158 3,158 940 3,108 50
$2,500 to $4,999 4,087 4,087 1,086 4,022 65
$5,000 to $7,499 4,497 4,497 1,165 4,446 51
$7,500 to $9,999 4,007 4,007 1,170 3,974 33
$10,000 or more 7,968 7,968 2,257 7,894 74
Public Assistance Information
SSI or SSDI 209 209 93 204 *
Farmworker Designation
Any farmworker designation 528 528 323 521 *
Seasonal farmworker 129 129 111 127 *
Migrant farmworker 399 399 212 394 *

Wagner-Peyser
PY 2019 Illinois State Data Book 386
All Exiters
Received Career Services
Basic
Individualized
Only Career Services
Received Training
Other Characteristics
Individuals with a disability 1,680 1,680 1,026 1,648 32
Long-term unemployed 311 311 111 306 *
Exhausting TANF within 2 years 152 152 58 150 *
Homeless individuals or runaway youth 662 662 448 652 10
Ex-offenders 863 863 401 839 24
Low income 4,155 4,155 1,409 4,000 155
English language learners 730 730 245 706 24
Basic skills deficient 400 400 234 274 126
Facing substantial cultural barrier 31 31 18 30 *
Single parents 1,367 1,367 431 1,298 69
Displaced homemakers 44 44 * 44 0

Wagner-Peyser
PY 2019 Illinois State Data Book 387
Table VI-12 Trends Over Time in Services Received by Wagner-Peyser Exiters, by Reporting Period
(Derived from PY 2019 Q4 PIRL)
Nation PY 2017
Nation PY 2018
Nation PY 2019
IL PY 2017
IL PY 2018
IL PY 2019
Number of Exiters 4,021,585 3,570,450 3,317,555 32,895 33,517 26,814
Coenrollment
Any coenrollment 19.5 18.6 17.7 9.6 9.9 18.9
WIOA Adult 8.2 6.8 5.8 4.8 3.6 10.4
WIOA Dislocated Worker 5.6 5.7 6.1 1.6 1.3 2.6
WIOA Youth 1.0 1.0 1.0 0.3 0.4 0.5
Vocational Rehabilitation 0.1 0.1 0.1 0.0 0.0 0.0
Adult Education 0.2 0.1 0.1 0.0 0.0 0.0
WIOA National Farmworker Jobs 0.0 0.0 0.0 0.0 0.0 0.0
WIOA Indian and Native American 0.0 0.0 0.0 0.0 0.0 0.0
Veterans’ programs 1.9 1.9 1.7 2.7 4.4 6.3
YouthBuild 0.0 0.0 0.0 0.0 0.0 0.0
Senior Community Services 0.0 0.0 0.0 0.0 0.0 0.0
SNAP Employment and Training 0.8 1.0 1.2 0.0 0.0 0.0
Other partner programs 3.5 3.8 3.7 0.7 0.7 0.9
Homeless Veterans’ Reintegration Program (HVRP) (among veterans)
-- -- 0.1 -- -- 0.9
Basic Career Services
Self-service or informational service 85.4 84.9 80.9 56.5 58.2 51.7
Any staff-assisted basic career service 98.9 98.9 98.5 100.0 100.0 100.0
Workforce information services 43.7 45.6 44.9 28.7 30.0 25.0
Career guidance 31.9 37.8 37.7 44.6 43.6 43.4
Staff-assisted job search 60.2 62.4 64.6 59.9 52.4 38.9
Referred to employment 44.9 42.5 38.8 35.6 35.3 39.8
Referred to Federal training 7.2 6.4 6.2 5.0 1.7 2.7
Assistance with UI 6.2 8.8 11.3 14.3 29.3 22.6
Referred to veterans services 0.3 0.4 0.5 0.3 0.6 0.8
Other basic services 37.8 37.8 43.9 1.0 0.5 1.0

Wagner-Peyser
PY 2019 Illinois State Data Book 388
Nation PY 2017
Nation PY 2018
Nation PY 2019
IL PY 2017
IL PY 2018
IL PY 2019
Individualized Career Services
Any individualized career service 51.5 51.4 53.8 28.3 33.2 29.4
IEP created 22.1 24.3 25.9 2.7 3.8 7.6
Internships or work experience 0.9 0.8 0.9 0.2 0.3 0.3
Employment, excluding transitional jobs
0.4 0.4 0.4 0.2 0.3 0.3
Transitional jobs 0.1 0.1 0.1 0.0 0.0 0.0
Other work experience 0.4 0.4 0.4 0.1 0.1 0.0
Financial literacy services 0.5 0.5 0.6 0.0 0.0 0.0
English as a second language services 0.3 0.3 0.3 0.0 0.0 0.0
Other individualized services 28.7 26.5 27.3 25.3 29.1 21.5
Weeks Participated
Average number of weeks 7.6 6.3 5.7 3.3 3.0 3.4
4 or fewer weeks 69.8 71.9 73.3 82.6 82.0 81.4
5 to 13 weeks 16.0 15.7 15.8 11.2 12.6 12.9
14 to 26 weeks 6.9 6.5 6.1 3.6 3.4 3.2
27 to 52 weeks 3.7 3.3 2.8 1.5 1.0 1.1
53 to 104 weeks 2.4 1.9 1.4 0.8 0.7 0.9
More than 104 weeks 1.1 0.7 0.7 0.3 0.3 0.4
Reason for Exit
Institutionalized, including criminal offenders
0.0 0.1 0.0 0.0 0.0 0.0
Health/medical 0.1 0.1 0.1 0.0 0.0 0.0
Deceased 0.0 0.0 0.0 0.0 0.0 0.0
Reserve called to active duty 0.0 0.0 0.0 0.0 0.0 0.0
Training Services
Received any training 2.5 2.6 2.8 0.3 0.7 1.0

Wagner-Peyser
PY 2019 Illinois State Data Book 389
Table VI-13 Trends Over Time in the Number of Wagner-Peyser Exiters Who Received Various Services,
by Reporting Period
(Derived from PY 2019 Q4 PIRL)
Nation PY 2017
Nation PY 2018
Nation PY 2019
IL PY 2017
IL PY 2018
IL PY 2019
Number of Exiters 4,021,585 3,570,450 3,317,555 32,895 33,517 26,814
Coenrollment
Any coenrollment 783,566 663,993 587,815 3,148 3,330 5,056
WIOA Adult 330,617 243,698 191,893 1,588 1,204 2,795
WIOA Dislocated Worker 224,453 203,477 201,283 539 440 708
WIOA Youth 40,511 35,669 34,245 94 143 145
Vocational Rehabilitation 4,687 3,896 3,827 0 0 0
Adult Education 6,046 4,425 4,746 0 * *
WIOA National Farmworker Jobs 216 298 267 0 * *
WIOA Indian and Native American 10 12 18 0 0 0
Veterans’ programs 76,064 66,573 57,496 892 1,476 1,677
YouthBuild 110 119 139 0 0 0
Senior Community Services 32 25 29 0 0 0
SNAP Employment and Training 32,222 37,208 40,033 0 * 0
Other partner programs 141,126 137,056 122,618 218 242 251
Homeless Veterans’ Reintegration Program (HVRP) (among veterans)HVRP
-- -- 3,906 -- -- 229
Basic Career Services
Self-service or informational service 3,436,226 3,030,787 2,682,765 18,586 19,517 13,872
Any staff-assisted basic career service 3,978,205 3,532,328 3,268,870 32,893 33,517 26,814
Workforce information services 1,757,926 1,627,321 1,489,724 9,425 10,051 6,716
Career guidance 1,281,859 1,350,173 1,250,397 14,668 14,626 11,640
Staff-assisted job search 2,420,006 2,229,243 2,143,809 19,715 17,556 10,432
Referred to employment 1,806,166 1,518,164 1,286,705 11,717 11,847 10,660
Referred to Federal training 290,799 228,949 204,277 1,653 580 732
Assistance with UI 249,711 313,388 374,553 4,696 9,807 6,068
Referred to veterans services 12,086 14,482 15,810 110 197 224
Other basic services 1,521,555 1,349,673 1,457,171 315 178 261

Wagner-Peyser
PY 2019 Illinois State Data Book 390
Nation PY 2017
Nation PY 2018
Nation PY 2019
IL PY 2017
IL PY 2018
IL PY 2019
Individualized Career Services
Any individualized career service 2,071,729 1,835,089 1,786,074 9,304 11,133 7,891
IEP created 887,026 866,592 858,380 897 1,277 2,038
Internships or work experience 34,259 29,235 30,027 78 107 74
Employment, excluding transitional jobs 17,335 13,519 12,554 59 89 72
Transitional jobs 5,265 4,920 3,904 0 0 0
Other work experience 14,430 13,443 14,877 19 18 *
Financial literacy services 19,971 18,039 18,742 15 9 13
English as a second language services 11,152 9,477 9,150 0 0 *
Other individualized services 1,155,403 946,227 905,923 8,321 9,745 5,776
Weeks Participated
4 or fewer weeks 2,808,902 2,568,389 2,430,292 27,173 27,499 21,837
5 to 13 weeks 641,862 561,386 523,757 3,687 4,209 3,461
14 to 26 weeks 276,896 231,905 203,167 1,179 1,142 864
27 to 52 weeks 150,497 117,418 92,688 490 343 308
53 to 104 weeks 97,519 66,590 46,030 263 239 238
More than 104 weeks 45,909 24,762 21,621 103 85 106
Reason for Exit
Institutionalized, including criminal offenders
1,872 1,810 1,477 * 0 0
Health/medical 2,690 2,193 1,851 * * *
Deceased 358 347 288 * * *
Reserve called to active duty 31 31 22 0 0 0
Training Services
Received any training 98,600 94,062 92,079 103 240 279

Wagner-Peyser
PY 2019 Illinois State Data Book 391
Table VI-14 Services Received by Wagner-Peyser Participants Who Exited from April 2019 to March 2020
in IL, by Age at Program Entry
(Derived from PY 2019 Q4 PIRL)
Under 22 22 to 29 30 to 44 45 to 54 55 and Older
Number of Exiters 765 3,468 8,382 6,344 7,757
Coenrollment
Any coenrollment 7.3 16.6 19.4 19.3 19.0
WIOA Adult 2.0 7.8 11.5 12.1 9.9
WIOA Dislocated Worker 0.3 1.7 2.5 3.6 2.6
WIOA Youth 2.5 0.9 0.0 0.0 0.0
Vocational Rehabilitation 0.0 0.0 0.0 0.0 0.0
Adult Education 0.0 0.0 0.0 0.0 0.0
WIOA National Farmworker Jobs 0.0 0.0 0.0 0.0 0.0
WIOA Indian and Native American 0.0 0.0 0.0 0.0 0.0
Veterans’ programs 2.2 6.3 6.0 5.1 7.9
YouthBuild 0.0 0.0 0.0 0.0 0.0
Senior Community Services 0.0 0.0 0.0 0.0 0.0
SNAP Employment and Training 0.0 0.0 0.0 0.0 0.0
Other partner programs 0.9 1.1 1.0 1.0 0.8
Homeless Veterans’ Reintegration Program (HVRP) (among veterans)
0.0 0.5 0.6 0.8 1.4
Basic Career Services
Self-service or informational service 46.9 50.8 50.2 52.5 53.4
Any staff-assisted basic career service 100.0 100.0 100.0 100.0 100.0
Workforce information services 21.3 26.0 25.0 25.3 24.9
Career guidance 50.7 44.2 41.4 43.9 44.1
Staff-assisted job search 37.9 37.0 35.8 40.1 41.9
Referred to employment 31.1 37.5 40.7 40.8 39.7
Referred to Federal training 2.9 2.5 2.1 2.7 2.3
Assistance with UI 18.7 25.1 23.9 22.7 20.4
Referred to veterans services 0.4 0.9 0.8 0.9 0.9
Other basic services 0.1 0.8 1.3 0.9 0.8
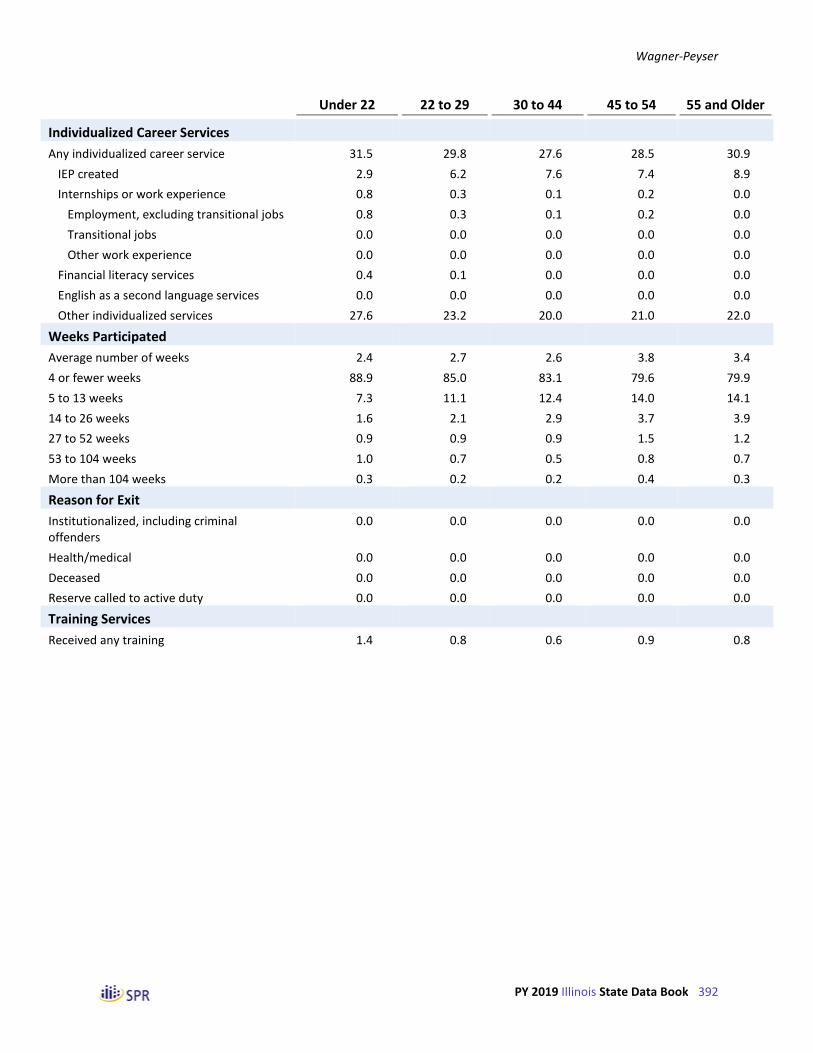
Wagner-Peyser
PY 2019 Illinois State Data Book 392
Under 22 22 to 29 30 to 44 45 to 54 55 and Older
Individualized Career Services
Any individualized career service 31.5 29.8 27.6 28.5 30.9
IEP created 2.9 6.2 7.6 7.4 8.9
Internships or work experience 0.8 0.3 0.1 0.2 0.0
Employment, excluding transitional jobs 0.8 0.3 0.1 0.2 0.0
Transitional jobs 0.0 0.0 0.0 0.0 0.0
Other work experience 0.0 0.0 0.0 0.0 0.0
Financial literacy services 0.4 0.1 0.0 0.0 0.0
English as a second language services 0.0 0.0 0.0 0.0 0.0
Other individualized services 27.6 23.2 20.0 21.0 22.0
Weeks Participated
Average number of weeks 2.4 2.7 2.6 3.8 3.4
4 or fewer weeks 88.9 85.0 83.1 79.6 79.9
5 to 13 weeks 7.3 11.1 12.4 14.0 14.1
14 to 26 weeks 1.6 2.1 2.9 3.7 3.9
27 to 52 weeks 0.9 0.9 0.9 1.5 1.2
53 to 104 weeks 1.0 0.7 0.5 0.8 0.7
More than 104 weeks 0.3 0.2 0.2 0.4 0.3
Reason for Exit
Institutionalized, including criminal offenders
0.0 0.0 0.0 0.0 0.0
Health/medical 0.0 0.0 0.0 0.0 0.0
Deceased 0.0 0.0 0.0 0.0 0.0
Reserve called to active duty 0.0 0.0 0.0 0.0 0.0
Training Services
Received any training 1.4 0.8 0.6 0.9 0.8

Wagner-Peyser
PY 2019 Illinois State Data Book 393
Table VI-15 Services Received by Wagner-Peyser Participants Who Exited from April 2019 to March 2020
in IL, by Ethnicity and Race
(Derived from PY 2019 Q4 PIRL)
Ethnicity Race
Hispanic Not Hispanic White Only Black Only Other
Number of Exiters 3,950 22,643 14,005 8,383 803
Coenrollment
Any coenrollment 14.5 19.6 17.1 22.5 20.3
WIOA Adult 6.5 11.1 8.7 13.7 9.7
WIOA Dislocated Worker 3.4 2.5 2.3 2.7 3.7
WIOA Youth 1.2 0.4 0.5 0.8 1.1
Vocational Rehabilitation 0.0 0.0 0.0 0.0 0.0
Adult Education 0.0 0.0 0.0 0.0 0.1
WIOA National Farmworker Jobs 0.0 0.0 0.0 0.0 0.0
WIOA Indian and Native American 0.0 0.0 0.0 0.0 0.0
Veterans’ programs 3.3 6.7 6.5 6.4 7.6
YouthBuild 0.0 0.0 0.0 0.0 0.0
Senior Community Services 0.0 0.0 0.0 0.0 0.0
SNAP Employment and Training 0.0 0.0 0.0 0.0 0.0
Other partner programs 1.5 0.8 0.8 1.0 1.9
Homeless Veterans’ Reintegration Program (HVRP) (among veterans)
0.3 1.0 0.6 1.5 1.1
Basic Career Services
Self-service or informational service 45.6 52.8 52.8 51.3 55.8
Any staff-assisted basic career service 100.0 100.0 100.0 100.0 100.0
Workforce information services 23.9 25.2 26.3 22.2 30.4
Career guidance 43.3 43.4 45.3 40.3 43.8
Staff-assisted job search 31.3 40.2 37.2 44.1 38.6
Referred to employment 21.1 43.0 46.7 34.7 33.7
Referred to Federal training 5.4 2.3 2.6 2.7 7.7
Assistance with UI 29.5 21.5 21.8 21.4 30.6
Referred to veterans services 0.8 0.8 0.7 1.1 0.7
Other basic services 0.6 1.0 0.8 1.2 0.9

Wagner-Peyser
PY 2019 Illinois State Data Book 394
Ethnicity Race
Hispanic Not Hispanic White Only Black Only Other
Individualized Career Services
Any individualized career service 27.6 29.7 30.4 28.9 31.0
IEP created 5.5 8.0 9.7 4.7 8.0
Internships or work experience 0.8 0.2 0.2 0.3 1.0
Employment, excluding transitional jobs 0.8 0.2 0.2 0.3 1.0
Transitional jobs 0.0 0.0 0.0 0.0 0.0
Other work experience 0.0 0.0 0.0 0.0 0.0
Financial literacy services 0.1 0.0 0.1 0.0 0.1
English as a second language services 0.0 0.0 0.0 0.0 0.0
Other individualized services 21.3 21.6 20.4 23.9 22.0
Weeks Participated
Average number of weeks 3.9 3.4 3.6 3.6 4.7
4 or fewer weeks 85.8 80.6 80.1 81.5 81.4
5 to 13 weeks 9.1 13.6 14.0 12.3 12.0
14 to 26 weeks 1.8 3.5 3.3 3.4 2.4
27 to 52 weeks 1.1 1.2 1.2 1.3 1.5
53 to 104 weeks 1.5 0.8 0.9 1.0 1.9
More than 104 weeks 0.7 0.3 0.4 0.5 0.9
Reason for Exit
Institutionalized, including criminal offenders
0.0 0.0 0.0 0.0 0.0
Health/medical 0.0 0.0 0.0 0.0 0.0
Deceased 0.0 0.0 0.0 0.0 0.0
Reserve called to active duty 0.0 0.0 0.0 0.0 0.0
Training Services
Received any training 2.3 0.8 1.1 1.1 3.4

Wagner-Peyser
PY 2019 Illinois State Data Book 395
Table VI-16 Services Received by Wagner-Peyser Participants Who Exited from April 2019 to March 2020
in IL, by Gender, Employment Status, and Disability Status
(Derived from PY 2019 Q4 PIRL)
Number of Exiters 10,800 15,715 1,182 25,632 1,680
Coenrollment
Any coenrollment 14.8 21.6 20.8 18.8 56.8
WIOA Adult 10.2 10.5 9.7 10.5 9.0
WIOA Dislocated Worker 3.0 2.4 1.2 2.7 2.1
WIOA Youth 0.7 0.4 3.1 0.4 1.5
Vocational Rehabilitation 0.0 0.0 0.0 0.0 0.0
Adult Education 0.0 0.0 0.0 0.0 0.0
WIOA National Farmworker Jobs 0.0 0.0 0.0 0.0 0.0
WIOA Indian and Native American 0.0 0.0 0.0 0.0 0.0
Veterans’ programs 1.9 9.3 8.4 6.2 49.2
YouthBuild 0.0 0.0 0.0 0.0 0.0
Senior Community Services 0.0 0.0 0.0 0.0 0.0
SNAP Employment and Training 0.0 0.0 0.0 0.0 0.0
Other partner programs 0.7 1.1 1.0 0.9 2.1
Homeless Veterans’ Reintegration Program (HVRP) (among veterans)
0.1 1.4 0.9 0.9 3.6
Basic Career Services
Self-service or informational service 52.8 51.0 30.4 52.7 49.0
Any staff-assisted basic career service 100.0 100.0 100.0 100.0 100.0
Workforce information services 26.4 24.1 13.3 25.6 22.5
Career guidance 37.6 47.5 73.9 42.0 80.4
Staff-assisted job search 42.5 36.3 31.6 39.2 33.0
Referred to employment 45.8 35.6 24.6 40.5 25.2
Referred to Federal training 3.3 2.3 8.1 2.5 3.8
Assistance with UI 20.4 24.2 3.6 23.5 12.6
Referred to veterans services 0.3 1.2 1.0 0.8 5.4
Other basic services 0.2 1.5 0.8 1.0 2.8
Gender Employment Status Has a
Female Male Employed Not Employed Disability

Wagner-Peyser
PY 2019 Illinois State Data Book 396
Female Male Employed Not Employed Disability
Individualized Career Services
Any individualized career service 28.8 29.9 53.5 28.3 61.1
IEP created 9.1 6.6 3.0 7.8 12.0
Internships or work experience 0.3 0.3 1.4 0.2 1.2
Employment, excluding transitional jobs
0.3 0.2 1.4 0.2 1.2
Transitional jobs 0.0 0.0 0.0 0.0 0.0
Other work experience 0.0 0.0 0.0 0.0 0.0
Financial literacy services 0.1 0.0 0.2 0.0 0.2
English as a second language services 0.0 0.0 0.0 0.0 0.0
Other individualized services 19.3 23.1 49.0 20.3 47.7
Weeks Participated
Average number of weeks 4.0 3.1 7.9 3.2 6.4
4 or fewer weeks 80.3 82.2 83.0 81.4 70.5
5 to 13 weeks 13.7 12.4 6.3 13.2 16.6
14 to 26 weeks 3.2 3.2 2.5 3.3 6.4
27 to 52 weeks 1.0 1.2 1.9 1.1 3.9
53 to 104 weeks 1.2 0.7 4.4 0.7 2.0
More than 104 weeks 0.6 0.3 1.9 0.3 0.6
Reason for Exit
Institutionalized, including criminal offenders
0.0 0.0 0.0 0.0 0.0
Health/medical 0.0 0.0 0.1 0.0 0.0
Deceased 0.0 0.0 0.0 0.0 0.0
Reserve called to active duty 0.0 0.0 0.0 0.0 0.0
Training Services
Received any training 1.5 0.8 7.2 0.8 1.9
Gender Employment Status Has a

Wagner-Peyser
PY 2019 Illinois State Data Book 397
Table VI-17 Services Received by Wagner-Peyser Participants Who Exited from April 2019 to March 2020
in IL, by Other Employment Characteristics
(Derived from PY 2019 Q4 PIRL)
Unemployment Compensation Status Long-Term Displaced
Claimant Exhaustee Neither Unemployed Homemaker
Number of Exiters 22,683 145 3,986 311 44
Coenrollment
Any coenrollment 18.6 29.7 19.7 35.4 29.5
WIOA Adult 11.3 6.2 5.6 16.1 25.0
WIOA Dislocated Worker 2.8 14.5 1.2
1.9 2.3
WIOA Youth 0.5 0.0 0.9 0.3 0.0
Vocational Rehabilitation 0.0 0.0 0.0 0.0 0.0
Adult Education 0.0 0.0 0.0 0.0 0.0
WIOA National Farmworker Jobs 0.0 0.0 0.0 0.0 0.0
WIOA Indian and Native American 0.0 0.0 0.0 0.0 0.0
Veterans’ programs 5.2 10.3 12.3 17.7 6.8
YouthBuild 0.0 0.0 0.0 0.0 0.0
Senior Community Services 0.0 0.0 0.0 0.0 0.0
SNAP Employment and Training 0.0 0.0 0.0 0.0 0.0
Other partner programs 0.9 4.8 1.3 2.3 0.0
Homeless Veterans’ Reintegration Program (HVRP) (among veterans)
0.6 2.8 2.3 5.8 4.5
Basic Career Services
Self-service or informational service 53.3 52.4 42.7 45.0 45.5
Any staff-assisted basic career service 100.0 100.0 100.0 100.0 100.0
Workforce information services 26.2 35.2 18.3 22.2 22.7
Career guidance 41.4 44.1 54.8 45.3 29.5
Staff-assisted job search 37.9 37.2 44.9 46.3 50.0
Referred to employment 42.1 35.2 26.4 37.9 52.3
Referred to Federal training 2.7 13.1 2.4 5.8 0.0
Assistance with UI 24.8 35.2 10.1 13.2 13.6
Referred to veterans services 0.7 2.1 1.4 2.6 2.3
Other basic services 0.6 0.7 2.9 7.7 2.3

Wagner-Peyser
PY 2019 Illinois State Data Book 398
Unemployment Compensation Status Long-Term Displaced
Claimant Exhaustee Neither Unemployed Homemaker
Individualized Career Services
Any individualized career service 27.4 37.2 40.4 35.7 18.2
IEP created 8.1 0.7 5.2 7.7 4.5
Internships or work experience 0.2 0.0 0.5 0.0 0.0
Employment, excluding transitional jobs 0.2 0.0 0.5 0.0 0.0
Transitional jobs 0.0 0.0 0.0 0.0 0.0
Other work experience 0.0 0.0 0.0 0.0 0.0
Financial literacy services 0.0 0.0 0.1 0.0 0.0
English as a second language services 0.0 0.0 0.0 0.0 0.0
Other individualized services 19.1 36.6 34.8 28.0 13.6
Weeks Participated
Average number of weeks 3.5 15.8 3.0 6.3 2.7
4 or fewer weeks 81.0 72.4 84.3 75.6 81.8
5 to 13 weeks 13.3 8.3 10.7 11.3 11.4
14 to 26 weeks 3.3 2.8 2.7 5.5 4.5
27 to 52 weeks 1.1 5.5 1.3 5.1 2.3
53 to 104 weeks 0.9 6.2 0.8 1.6 0.0
More than 104 weeks 0.4 4.8 0.3 1.0 0.0
Reason for Exit
Institutionalized, including criminal offenders
0.0 0.0 0.0 0.0 0.0
Health/medical 0.0 0.0 0.0 0.0 0.0
Deceased 0.0 0.0 0.0 0.0 0.0
Reserve called to active duty 0.0 0.0 0.0 0.0 0.0
Training Services
Received any training 1.0 12.4 1.0 1.6 0.0

Wagner-Peyser
PY 2019 Illinois State Data Book 399
Table VI-18 Services Received by Wagner-Peyser Participants Who Exited from April 2019 to March 2020
in IL, by Veteran Status and Selected Barriers to Employment
(Derived from PY 2019 Q4 PIRL)
Veteran Status Receives Low Basic
Skills/English
Any Disabled Vet SSI/SSDI Income Deficient
Number of Exiters 5,169 1,308 209 4,155 1,063
Coenrollment
Any coenrollment 40.3 65.2 30.1 25.7 22.2
WIOA Adult 8.6 8.7 8.6 9.9 7.9
WIOA Dislocated Worker 2.3 2.4 3.3 2.5 5.4
WIOA Youth 0.4 0.5 2.4 2.0 8.4
Vocational Rehabilitation 0.0 0.0 0.0 0.0 0.0
Adult Education 0.0 0.0 0.0 0.0 0.2
WIOA National Farmworker Jobs 0.0 0.0 0.0 0.0 0.0
WIOA Indian and Native American 0.0 0.0 0.0 0.0 0.0
Veterans’ programs 32.4 60.1 17.7 12.5 1.9
YouthBuild 0.0 0.0 0.0 0.0 0.0
Senior Community Services 0.0 0.0 0.0 0.0 0.0
SNAP Employment and Training 0.0 0.0 0.0 0.0 0.0
Other partner programs 1.6 2.4 1.9 1.5 2.6
Homeless Veterans’ Reintegration Program (HVRP) (among veterans)
4.4 3.7 3.3 3.6 0.0
Basic Career Services
Self-service or informational service 51.2 49.2 48.3 51.2 39.0
Any staff-assisted basic career service 100.0 100.0 100.0 100.0 100.0
Workforce information services 26.6 22.7 19.6 24.3 17.1
Career guidance 79.7 88.9 58.9 50.7 55.5
Staff-assisted job search 28.8 28.4 54.1 41.9 31.0
Referred to employment 24.9 19.3 22.0 24.0 15.8
Referred to Federal training 2.5 2.1 6.2 5.7 18.3
Assistance with UI 15.7 12.9 10.5 22.3 26.1
Referred to veterans services 4.3 6.6 1.0 1.7 0.4
Other basic services 2.5 3.1 1.0 3.1 0.7

Wagner-Peyser
PY 2019 Illinois State Data Book 400
Veteran Status Receives Low Basic
Skills/English
Any Disabled Vet SSI/SSDI Income Deficient
Individualized Career Services
Any individualized career service 45.1 67.5 44.5 33.9 42.6
IEP created 8.7 13.2 6.7 5.3 3.5
Internships or work experience 0.3 0.5 0.5 1.1 4.9
Employment, excluding transitional jobs 0.3 0.5 0.5 1.1 4.9
Transitional jobs 0.0 0.0 0.0 0.0 0.0
Other work experience 0.0 0.0 0.0 0.0 0.0
Financial literacy services 0.0 0.2 0.0 0.2 0.8
English as a second language services 0.0 0.0 0.0 0.0 0.1
Other individualized services 36.1 53.8 37.3 27.4 34.0
Weeks Participated
Average number of weeks 4.4 5.4 5.3 5.7 14.5
4 or fewer weeks 76.1 70.6 82.3 80.8 76.0
5 to 13 weeks 15.2 17.4 10.5 10.7 5.9
14 to 26 weeks 4.9 6.6 1.9 3.1 1.8
27 to 52 weeks 2.4 4.1 1.9 1.9 3.5
53 to 104 weeks 0.9 1.1 1.9 2.5 9.4
More than 104 weeks 0.4 0.3 1.4 1.0 3.4
Reason for Exit
Institutionalized, including criminal offenders
0.0 0.0 0.0 0.0 0.0
Health/medical 0.0 0.0 0.0 0.0 0.1
Deceased 0.0 0.0 0.0 0.0 0.1
Reserve called to active duty 0.0 0.0 0.0 0.0 0.0
Training Services
Received any training 1.1 1.3 2.4 3.7 12.7

Wagner-Peyser
PY 2019 Illinois State Data Book 401
Table VI-19 Services Received by Wagner-Peyser Participants Who Exited from April 2019 to March 2020
in IL, by Highest Educational Level
(Derived from PY 2019 Q4 PIRL)
No Level
Completed
HS Graduate or Equivalent
Some Post-secondary
Technical or Vocational Certificate
Post-secondary
Degree
Number of Exiters 3,235 10,794 6,350 1,059 5,376
Coenrollment
Any coenrollment 11.8 18.9 21.1 22.0 19.7
WIOA Adult 8.0 11.2 11.5 12.7 8.6
WIOA Dislocated Worker 1.0 2.1 3.1 2.8 4.1
WIOA Youth 0.5 0.8 0.2 0.2 0.4
Vocational Rehabilitation 0.0 0.0 0.0 0.0 0.0
Adult Education 0.0 0.0 0.0 0.0 0.0
WIOA National Farmworker Jobs 0.0 0.0 0.0 0.0 0.0
WIOA Indian and Native American 0.0 0.0 0.0 0.0 0.0
Veterans’ programs 2.3 5.5 7.6 7.4 8.3
YouthBuild 0.0 0.0 0.0 0.0 0.0
Senior Community Services 0.0 0.0 0.0 0.0 0.0
SNAP Employment and Training 0.0 0.0 0.0 0.0 0.0
Other partner programs 0.5 0.9 1.1 1.5 1.1
Homeless Veterans’ Reintegration Program (HVRP) (among veterans)
0.4 1.0 1.0 1.1 0.7
Basic Career Services
Self-service or informational service 45.4 52.0 52.8 50.1 54.0
Any staff-assisted basic career service 100.0 100.0 100.0 100.0 100.0
Workforce information services 20.3 23.8 26.3 25.9 28.8
Career guidance 39.5 41.1 46.2 46.7 46.6
Staff-assisted job search 33.1 38.6 41.1 38.0 40.6
Referred to employment 31.3 42.1 41.3 38.4 38.5
Referred to Federal training 1.8 2.8 2.2 2.4 3.9
Assistance with UI 25.8 23.5 20.1 24.1 21.7
Referred to veterans services 0.0 0.7 1.1 1.0 1.2
Other basic services 0.7 0.9 1.0 1.0 1.2

Wagner-Peyser
PY 2019 Illinois State Data Book 402
No Level
Completed
HS Graduate or Equivalent
Some Post-secondary
Technical or Vocational Certificate
Post-secondary
Degree
Individualized Career Services
Any individualized career service 26.6 28.2 31.3 30.4 31.2
IEP created 4.6 7.5 9.0 6.6 8.1
Internships or work experience 0.2 0.4 0.1 0.3 0.3
Employment, excluding transitional jobs 0.2 0.4 0.1 0.3 0.3
Transitional jobs 0.0 0.0 0.0 0.0 0.0
Other work experience 0.0 0.0 0.0 0.0 0.0
Financial literacy services 0.0 0.1 0.0 0.1 0.1
English as a second language services 0.0 0.0 0.0 0.0 0.0
Other individualized services 21.8 20.3 22.1 23.4 22.8
Weeks Participated
Average number of weeks 2.0 3.5 3.4 3.0 4.4
4 or fewer weeks 86.9 81.8 80.6 81.0 78.5
5 to 13 weeks 10.1 12.7 13.3 14.1 14.2
14 to 26 weeks 2.1 3.0 3.6 3.2 3.9
27 to 52 weeks 0.3 1.0 1.4 1.0 1.6
53 to 104 weeks 0.3 1.0 0.8 0.3 1.3
More than 104 weeks 0.2 0.4 0.3 0.4 0.6
Reason for Exit
Institutionalized, including criminal offenders
0.0 0.0 0.0 0.0 0.0
Health/medical 0.0 0.0 0.0 0.0 0.0
Deceased 0.0 0.0 0.0 0.0 0.0
Reserve called to active duty 0.0 0.0 0.0 0.0 0.0
Training Services
Received any training 0.2 1.4 0.6 0.7 1.5

Wagner-Peyser
PY 2019 Illinois State Data Book 403
Table VI-20 Services Received by Wagner-Peyser Participants Who Exited from April 2019 to March 2020
in IL, by Selected Other Characteristics
(Derived from PY 2019 Q4 PIRL)
School Status Migrant/ Seasonal Single
Attending Not Attending Farmworker Homeless Parents
Number of Exiters 468 26,346 528 662 1,367
Coenrollment
Any coenrollment 29.1 18.7 3.6 62.1 29.6
WIOA Adult 7.5 10.5 1.9 11.3 16.5
WIOA Dislocated Worker 0.9 2.7 0.6 1.8 4.6
WIOA Youth 6.4 0.4 0.6 0.9 1.7
Vocational Rehabilitation 0.0 0.0 0.0 0.0 0.0
Adult Education 0.0 0.0 0.0 0.0 0.0
WIOA National Farmworker Jobs 0.0 0.0 0.0 0.0 0.0
WIOA Indian and Native American 0.0 0.0 0.0 0.0 0.0
Veterans’ programs 15.8 6.1 0.4 56.3 8.1
YouthBuild 0.0 0.0 0.0 0.0 0.0
Senior Community Services 0.0 0.0 0.0 0.0 0.0
SNAP Employment and Training 0.0 0.0 0.0 0.0 0.0
Other partner programs 1.1 0.9 0.8 1.1 2.0
Homeless Veterans’ Reintegration Program (HVRP) (among veterans)
1.3 0.8 0.0 28.9 1.9
Basic Career Services
Self-service or informational service 56.8 51.6 1.7 53.5 51.9
Any staff-assisted basic career service 100.0 100.0 100.0 100.0 100.0
Workforce information services 22.6 25.1 0.8 24.5 22.8
Career guidance 57.7 43.2 91.9 80.5 43.3
Staff-assisted job search 53.6 38.6 1.9 35.3 40.6
Referred to employment 31.2 39.9 3.2 21.0 39.7
Referred to Federal training 7.5 2.6 1.7 4.2 6.4
Assistance with UI 9.2 22.9 0.2 12.8 22.5
Referred to veterans services 4.1 0.8 0.0 7.4 1.2
Other basic services 4.3 0.9 0.0 3.8 2.0

Wagner-Peyser
PY 2019 Illinois State Data Book 404
School Status Migrant/ Seasonal Single
Attending Not Attending Farmworker Homeless Parents
Individualized Career Services
Any individualized career service 45.5 29.1 61.2 67.7 31.5
IEP created 7.3 7.6 0.2 15.1 5.3
Internships or work experience 5.1 0.2 0.4 0.5 0.7
Employment, excluding transitional jobs 5.1 0.2 0.4 0.5 0.7
Transitional jobs 0.0 0.0 0.0 0.0 0.0
Other work experience 0.0 0.0 0.0 0.0 0.0
Financial literacy services 0.2 0.0 0.0 0.0 0.1
English as a second language services 0.0 0.0 0.0 0.0 0.0
Other individualized services 33.1 21.3 60.6 52.3 25.5
Weeks Participated
Average number of weeks 8.3 3.4 1.4 5.8 8.1
4 or fewer weeks 76.3 81.5 97.5 71.8 75.6
5 to 13 weeks 11.8 12.9 0.6 15.4 12.5
14 to 26 weeks 3.4 3.2 0.2 7.4 4.5
27 to 52 weeks 2.4 1.1 0.8 3.6 2.0
53 to 104 weeks 4.7 0.8 0.8 1.5 3.6
More than 104 weeks 1.5 0.4 0.2 0.3 1.9
Reason for Exit
Institutionalized, including criminal offenders
0.0 0.0 0.0 0.0 0.0
Health/medical 0.0 0.0 0.0 0.0 0.0
Deceased 0.0 0.0 0.0 0.0 0.1
Reserve called to active duty 0.0 0.0 0.0 0.0 0.0
Training Services
Received any training 3.4 1.0 1.3 1.5 5.0

Wagner-Peyser
PY 2019 Illinois State Data Book 405
Table VI-21 Services Received by Wagner-Peyser Participants Who Exited from April 2019 to March 2020,
by State
(Derived from PY 2019 Q4 PIRL)
Received Career Services
Number of Exiters
Basic
Individualized
Only Career Services
Received Training
Nation 3,317,555 98.9 53.8 96.5 2.8
Alabama 76,833 100.0 45.1 90.7 9.3
Alaska 12,278 100.0 43.2 96.8 3.2
Arizona 38,202 100.0 28.5 98.5 1.5
Arkansas 105,749 88.8 87.9 99.6 0.4
California 215,470 100.0 88.6 95.2 4.8
Colorado 55,339 99.3 21.0 95.4 4.0
Connecticut 33,986 100.0 49.0 96.6 3.4
Delaware 13,709 99.7 12.3 96.5 3.2
District of Columbia 9,501 100.0 81.3 94.8 5.2
Florida 170,256 100.0 94.0 95.2 4.8
Georgia 163,609 100.0 9.4 99.5 0.5
Guam 1,510 100.0 40.1 98.7 1.3
Hawaii 2,906 100.0 97.4 96.8 3.2
Idaho 15,334 100.0 66.4 98.1 1.9
Illinois 26,814 100.0 29.4 99.0 1.0
Indiana 40,663 100.0 40.9 95.8 4.2
Iowa 28,037 100.0 74.5 97.7 2.3
Kansas 21,204 99.8 46.2 97.5 2.2
Kentucky 13,403 100.0 99.4 89.6 10.3
Louisiana 46,613 100.0 56.7 96.0 4.0
Maine 4,511 100.0 39.9 97.5 2.5
Maryland 46,873 100.0 90.0 95.9 4.1
Massachusetts 113,907 100.0 61.6 97.3 2.7
Michigan 141,312 100.0 33.1 100.0 0.0
Minnesota 27,026 100.0 4.0 98.5 1.5
Mississippi 77,438 100.0 16.8 96.2 3.8
Missouri 51,927 100.0 69.2 95.3 4.7
Montana 15,637 100.0 55.4 98.2 1.8
Nebraska 11,080 100.0 90.7 97.2 2.8
Nevada 51,079 100.0 28.3 98.1 1.9
New Hampshire 14,128 100.0 55.9 98.9 1.1
New Jersey 60,445 100.0 67.6 94.4 5.6
New Mexico 20,768 100.0 82.3 90.6 9.4

Wagner-Peyser
PY 2019 Illinois State Data Book 406
Received Career Services
Number of Exiters
Basic
Individualized
Only Career Services
Received Training
New York 285,635 100.0 50.7 97.9 2.1
North Carolina 161,869 100.0 93.8 96.2 3.8
North Dakota 2,073 100.0 98.1 92.1 7.9
Northern Mariana Islands 3 100.0 66.7 100.0 0.0
Ohio 17,377 100.0 8.1 99.7 0.3
Oklahoma 18,865 100.0 78.3 97.9 2.1
Oregon 114,682 98.8 41.8 98.8 0.0
Palau 0 - - - -
Pennsylvania 81,786 99.7 79.3 95.0 4.7
Puerto Rico - - - - -
Rhode Island 4,577 100.0 99.2 92.6 7.4
South Carolina 51,097 100.0 76.8 95.3 4.7
South Dakota 8,707 100.0 89.5 97.7 2.3
Tennessee 29,994 100.0 78.2 90.9 9.1
Texas 430,347 99.5 43.9 98.0 1.5
Utah 145,905 100.0 15.6 99.4 0.6
Vermont 5,981 97.2 36.8 95.5 1.8
Virgin Islands 2,260 100.0 29.8 92.3 7.7
Virginia 47,780 100.0 87.0 96.6 3.4
Washington 90,848 99.2 32.4 96.8 2.6
West Virginia 54,382 61.7 3.0 60.5 1.3
Wisconsin 26,104 100.0 87.0 98.6 1.4
Wyoming 9,736 100.0 57.9 98.4 1.6

Wagner-Peyser
PY 2019 Illinois State Data Book 407
Table VI-22 Trends in the Outcomes of Wagner-Peyser Exiters, by Performance Period
(Derived from PIRL)
Nation Performance IL Performance
PY 2017 PY 2018 PY 2019 PY 2017 PY 2018 PY 2019
WIOA Primary Indicators of Performance
Employment 2nd quarter after exit1 68.0 68.4 68.2 68.0 70.0 68.2
Employment 4th quarter after exit2 -- 68.0 68.1 -- 70.3 71.4
Median earnings 2nd quarter after exit1
$5,443 $5,724 $6,000 $5,598 $6,031 $5,945
WIA Common Measures
Entered employment in quarter after exit3
63.0 63.4 63.0 62.7 64.6 63.9
Retention in 2nd and 3rd quarters4 -- 83.6 83.4 -- 84.9 84.0
Average earnings in 2nd and 3rd quarters4
-- $16,631 $17,116 -- $17,357 $17,571
Quarterly Employment Rate
First quarter after exit3 65.3 65.9 65.4 62.8 64.8 63.1
Second quarter after exit1 68.0 68.4 68.2 68.0 70.0 68.2
Third quarter after exit4 -- 68.5 68.6 -- 71.2 70.5
Fourth quarter after exit2 -- 68.0 68.1 -- 70.3 71.4
Quarterly Median Earnings (among those employed)
First quarter after exit3 $4,786 $5,031 $5,233 $4,786 $5,045 $5,198
Second quarter after exit1 $5,443 $5,724 $6,000 $5,599 $6,031 $5,946
Third quarter after exit4 -- $5,986 $6,268 -- $6,308 $6,381
Fourth quarter after exit2 -- $6,094 $6,362 -- $6,330 $6,637
Nontraditional Employment1
Females 1.0 1.0 1.0 3.4 2.8 4.0
Males 0.9 0.9 0.9 8.2 7.7 3.5
Characteristics of Second Quarter Employment (among those employed)1
Average quarterly earnings $7,051 $7,560 $7,801 $7,405 $7,851 $7,834
$1 to $2,499 22.8 21.8 21.1 22.1 21.0 21.6
$2,500 to $4,999 23.1 21.9 20.6 22.6 20.4 20.8
$5,000 to $7,499 20.6 20.3 19.9 19.7 19.5 19.1
$7,500 to $9,999 13.2 13.7 14.3 13.0 13.8 13.5
$10,000 or more 20.3 22.4 24.1 22.6 25.3 25.0
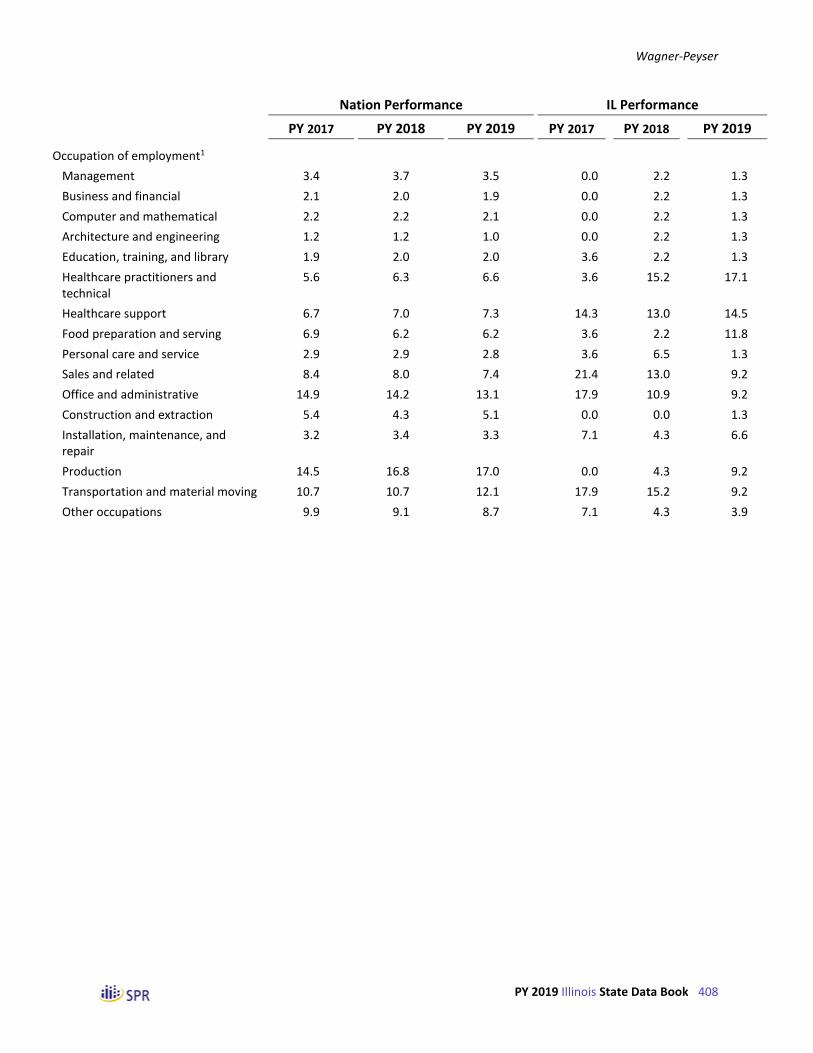
Wagner-Peyser
PY 2019 Illinois State Data Book 408
Nation Performance IL Performance
PY 2017 PY 2018 PY 2019 PY 2017 PY 2018 PY 2019
Occupation of employment1
Management 3.4 3.7 3.5 0.0 2.2 1.3
Business and financial 2.1 2.0 1.9 0.0 2.2 1.3
Computer and mathematical 2.2 2.2 2.1 0.0 2.2 1.3
Architecture and engineering 1.2 1.2 1.0 0.0 2.2 1.3
Education, training, and library 1.9 2.0 2.0 3.6 2.2 1.3
Healthcare practitioners and technical
5.6 6.3 6.6 3.6 15.2 17.1
Healthcare support 6.7 7.0 7.3 14.3 13.0 14.5
Food preparation and serving 6.9 6.2 6.2 3.6 2.2 11.8
Personal care and service 2.9 2.9 2.8 3.6 6.5 1.3
Sales and related 8.4 8.0 7.4 21.4 13.0 9.2
Office and administrative 14.9 14.2 13.1 17.9 10.9 9.2
Construction and extraction 5.4 4.3 5.1 0.0 0.0 1.3
Installation, maintenance, and repair
3.2 3.4 3.3 7.1 4.3 6.6
Production 14.5 16.8 17.0 0.0 4.3 9.2
Transportation and material moving 10.7 10.7 12.1 17.9 15.2 9.2
Other occupations 9.9 9.1 8.7 7.1 4.3 3.9

Wagner-Peyser
PY 2019 Illinois State Data Book 409
Nation Performance IL Performance
PY 2017 PY 2018 PY 2019 PY 2017 PY 2018 PY 2019
Industry of employment1
Construction 6.4 6.1 6.2 5.9 8.3 7.2
Manufacturing 10.9 11.2 11.0 11.5 11.3 12.0
Wholesale and retail trade 3.7 3.6 3.6 4.2 4.3 3.8
Transportation and warehousing 4.8 4.8 4.9 8.5 8.8 8.2
Information 1.0 1.1 1.1 0.9 0.7 0.7
Administrative, support, waste management and remediation services
20.4 20.4 19.6 22.8 22.4 22.8
Educational services 3.3 3.3 3.4 3.3 3.2 3.5
Health care and social assistance 11.9 12.3 12.5 10.5 9.8 10.9
Arts, entertainment, and recreation 1.3 1.3 1.3 1.4 1.3 1.2
Accommodation and food services 9.6 9.6 9.7 7.8 7.5 7.4
Other services, inc public administration
2.3 2.3 2.3 2.3 2.1 2.4
Other industry 24.5 24.1 24.3 21.1 20.1 20.0
1 Measured for a four-quarter exit cohort ending with those who exited four quarters prior to the end of the performance
quarter.
2 Measured for a four-quarter exit cohort ending with those who exited six quarters prior to the end of the performance
quarter.
3 Measured for a four-quarter exit cohort ending with those who exited threee quarters prior to the end of the performance
quarter.
4 Measured for a four-quarter exit cohort ending with those who exited five quarters prior to the end of the performance
quarter.
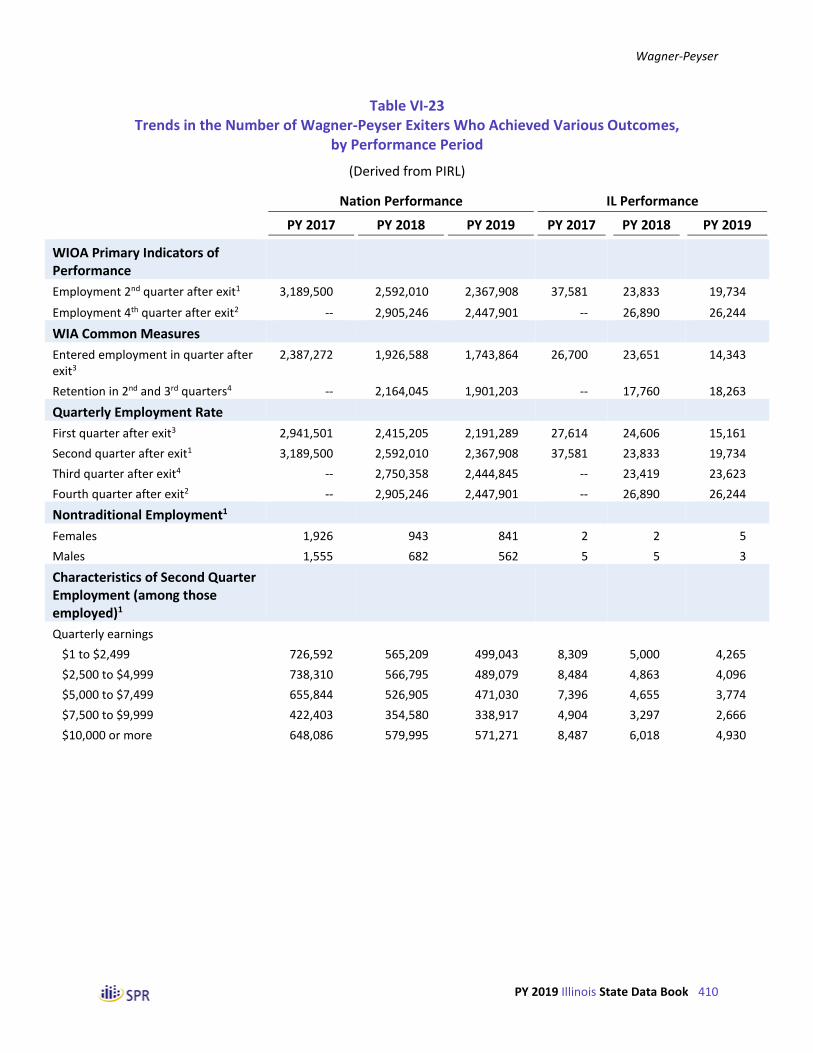
Wagner-Peyser
PY 2019 Illinois State Data Book 410
Table VI-23 Trends in the Number of Wagner-Peyser Exiters Who Achieved Various Outcomes,
by Performance Period
(Derived from PIRL)
Nation Performance IL Performance
PY 2017 PY 2018 PY 2019 PY 2017 PY 2018 PY 2019
WIOA Primary Indicators of Performance
Employment 2nd quarter after exit1 3,189,500 2,592,010 2,367,908 37,581 23,833 19,734
Employment 4th quarter after exit2 -- 2,905,246 2,447,901 -- 26,890 26,244
WIA Common Measures
Entered employment in quarter after exit3
2,387,272 1,926,588 1,743,864 26,700 23,651 14,343
Retention in 2nd and 3rd quarters4 -- 2,164,045 1,901,203 -- 17,760 18,263
Quarterly Employment Rate
First quarter after exit3 2,941,501 2,415,205 2,191,289 27,614 24,606 15,161
Second quarter after exit1 3,189,500 2,592,010 2,367,908 37,581 23,833 19,734
Third quarter after exit4 -- 2,750,358 2,444,845 -- 23,419 23,623
Fourth quarter after exit2 -- 2,905,246 2,447,901 -- 26,890 26,244
Nontraditional Employment1
Females 1,926 943 841 2 2 5
Males 1,555 682 562 5 5 3
Characteristics of Second Quarter Employment (among those employed)1
Quarterly earnings
$1 to $2,499 726,592 565,209 499,043 8,309 5,000 4,265
$2,500 to $4,999 738,310 566,795 489,079 8,484 4,863 4,096
$5,000 to $7,499 655,844 526,905 471,030 7,396 4,655 3,774
$7,500 to $9,999 422,403 354,580 338,917 4,904 3,297 2,666
$10,000 or more 648,086 579,995 571,271 8,487 6,018 4,930
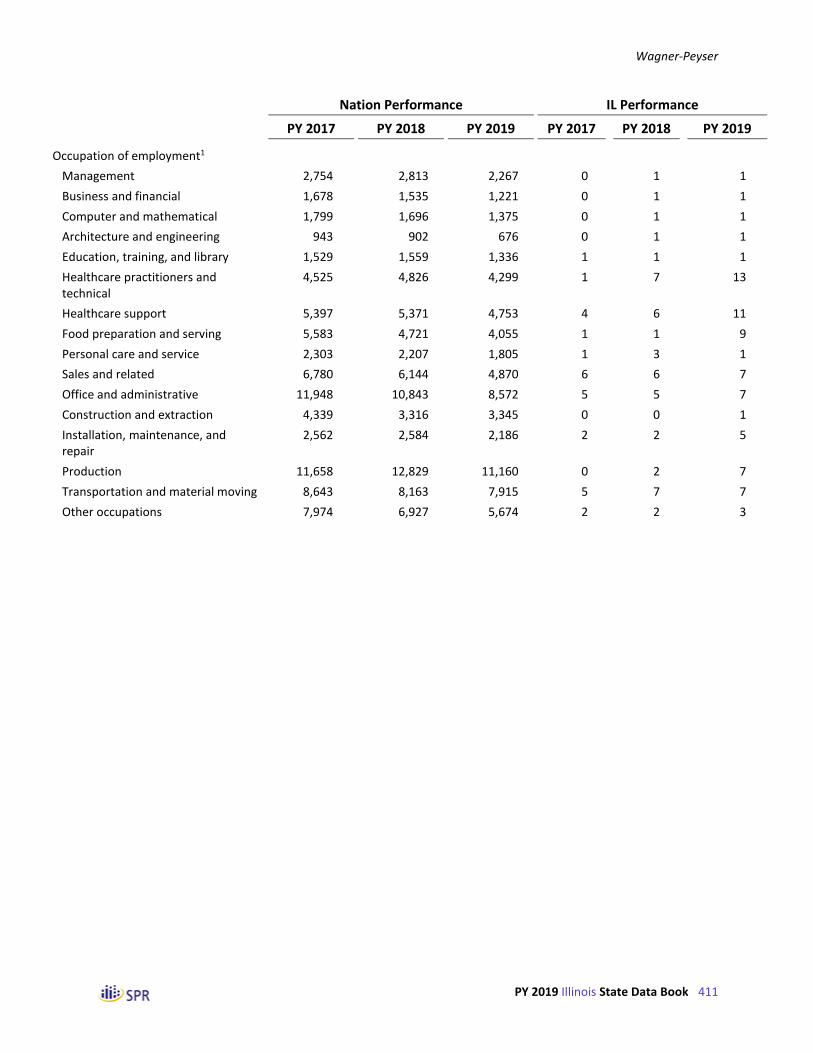
Wagner-Peyser
PY 2019 Illinois State Data Book 411
Nation Performance IL Performance
PY 2017 PY 2018 PY 2019 PY 2017 PY 2018 PY 2019
Occupation of employment1
Management 2,754 2,813 2,267 0 1 1
Business and financial 1,678 1,535 1,221 0 1 1
Computer and mathematical 1,799 1,696 1,375 0 1 1
Architecture and engineering 943 902 676 0 1 1
Education, training, and library 1,529 1,559 1,336 1 1 1
Healthcare practitioners and technical
4,525 4,826 4,299 1 7 13
Healthcare support 5,397 5,371 4,753 4 6 11
Food preparation and serving 5,583 4,721 4,055 1 1 9
Personal care and service 2,303 2,207 1,805 1 3 1
Sales and related 6,780 6,144 4,870 6 6 7
Office and administrative 11,948 10,843 8,572 5 5 7
Construction and extraction 4,339 3,316 3,345 0 0 1
Installation, maintenance, and repair
2,562 2,584 2,186 2 2 5
Production 11,658 12,829 11,160 0 2 7
Transportation and material moving 8,643 8,163 7,915 5 7 7
Other occupations 7,974 6,927 5,674 2 2 3

Wagner-Peyser
PY 2019 Illinois State Data Book 412
Nation Performance IL Performance
PY 2017 PY 2018 PY 2019 PY 2017 PY 2018 PY 2019
Industry of employment1
Construction 179,614 140,291 125,912 2,148 1,911 1,368
Manufacturing 307,151 257,571 221,769 4,190 2,616 2,286
Wholesale and retail trade 103,595 83,329 71,806 1,532 995 728
Transportation and warehousing 135,573 109,265 98,293 3,103 2,037 1,568
Information 28,795 24,233 22,981 316 167 126
Administrative, support, waste management and remediation services
574,206 468,491 395,581 8,310 5,183 4,362
Educational services 93,825 74,884 69,776 1,189 746 662
Health care and social assistance 335,037 281,618 253,210 3,812 2,271 2,094
Arts, entertainment, and recreation 36,097 30,177 27,130 500 298 232
Accommodation and food services 271,140 220,311 196,631 2,828 1,730 1,423
Other services, inc public administration
65,290 53,595 47,410 822 486 460
Other industry 690,359 552,584 492,187 7,668 4,647 3,816
1 Measured for a four-quarter exit cohort ending with those who exited four quarters prior to the end of the performance
quarter.
2 Measured for a four-quarter exit cohort ending with those who exited six quarters prior to the end of the performance
quarter.
3 Measured for a four-quarter exit cohort ending with those who exited threee quarters prior to the end of the performance
quarter.
4 Measured for a four-quarter exit cohort ending with those who exited five quarters prior to the end of the performance
quarter.

Wagner-Peyser
PY 2019 Illinois State Data Book 413
Table VI-24 Outcomes of Wagner-Peyser Exiters in IL, by Age at Program Entry
(Derived from PY 2019 Q4 PIRL)
Under 22 22 to 29 30 to 44 45 to 54 55 and Older
WIOA Primary Indicators of Performance
Employment 2nd quarter after exit1 70.6 74.3 72.3 70.9 58.1
Employment 4th quarter after exit2 76.4 77.7 75.7 74.1 60.1
Median earnings 2nd quarter after exit1 $3,660 $5,070 $6,271 $6,862 $5,740
WIA Common Measures
Entered employment in quarter after exit3 72.4 68.7 68.0 66.4 54.4
Retention in 2nd and 3rd quarters4 82.0 85.3 84.7 85.3 81.1
Average earnings in 2nd and 3rd quarters4 $10,332 $14,104 $18,425 $20,087 $17,336
Quarterly Employment Rate
First quarter after exit3 59.8 67.7 67.0 66.1 54.5
Second quarter after exit1 70.6 74.3 72.3 70.9 58.1
Third quarter after exit4 72.7 77.5 74.6 73.2 59.6
Fourth quarter after exit2 76.4 77.7 75.7 74.1 60.1
Quarterly Median Earnings (among those employed)
First quarter after exit3 $3,096 $4,444 $5,391 $6,099 $5,007
Second quarter after exit1 $3,660 $5,070 $6,271 $6,863 $5,740
Third quarter after exit4 $4,081 $5,505 $6,650 $7,345 $6,158
Fourth quarter after exit2 $4,186 $5,791 $7,091 $7,563 $6,217
Nontraditional Employment1
Females 0.0 0.0 5.0 4.2 9.1
Males 0.0 0.0 0.0 4.8 5.9
Characteristics of Second Quarter Employment (among those employed)1
Average quarterly earnings $4,600 $6,242 $8,131 $9,028 $7,771
$1 to $2,499 36.4 25.3 20.4 18.1 22.0
$2,500 to $4,999 26.0 23.9 19.7 18.0 22.1
$5,000 to $7,499 19.1 20.7 18.6 18.8 19.2
$7,500 to $9,999 10.3 12.3 14.4 14.8 12.3
$10,000 or more 8.2 17.7 26.9 30.3 24.4
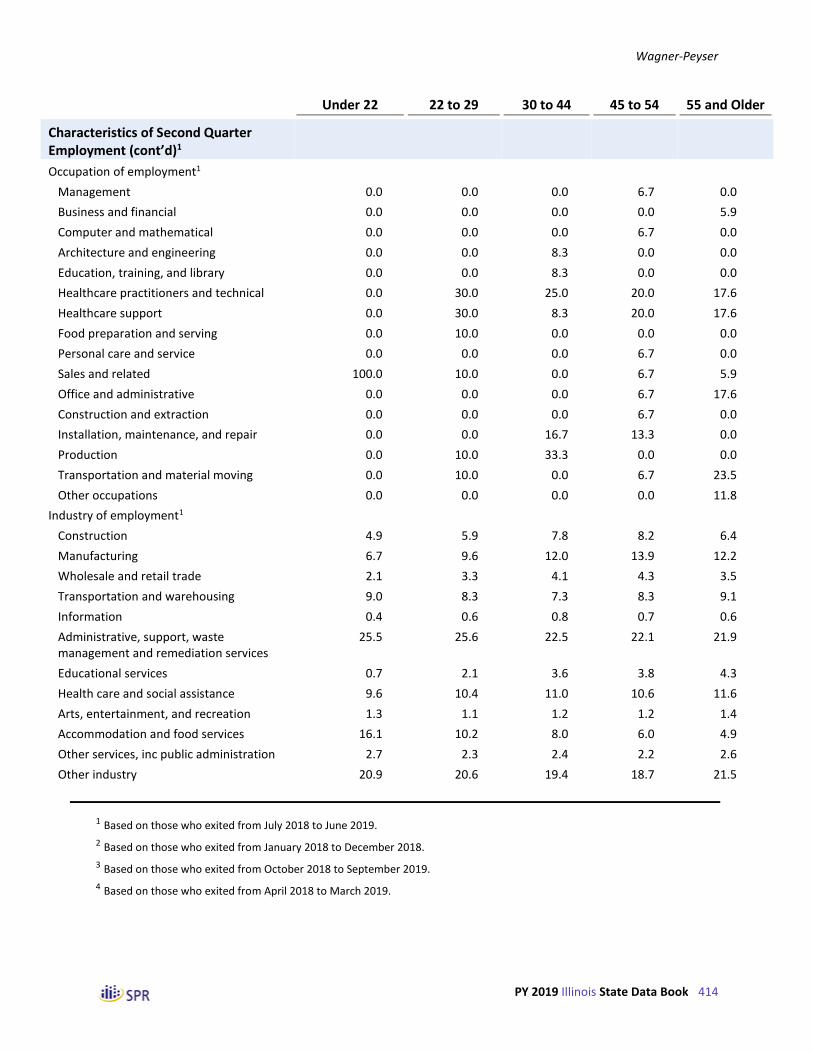
Wagner-Peyser
PY 2019 Illinois State Data Book 414
Under 22 22 to 29 30 to 44 45 to 54 55 and Older
Characteristics of Second Quarter Employment (cont’d)1
Occupation of employment1
Management 0.0 0.0 0.0 6.7 0.0
Business and financial 0.0 0.0 0.0 0.0 5.9
Computer and mathematical 0.0 0.0 0.0 6.7 0.0
Architecture and engineering 0.0 0.0 8.3 0.0 0.0
Education, training, and library 0.0 0.0 8.3 0.0 0.0
Healthcare practitioners and technical 0.0 30.0 25.0 20.0 17.6
Healthcare support 0.0 30.0 8.3 20.0 17.6
Food preparation and serving 0.0 10.0 0.0 0.0 0.0
Personal care and service 0.0 0.0 0.0 6.7 0.0
Sales and related 100.0 10.0 0.0 6.7 5.9
Office and administrative 0.0 0.0 0.0 6.7 17.6
Construction and extraction 0.0 0.0 0.0 6.7 0.0
Installation, maintenance, and repair 0.0 0.0 16.7 13.3 0.0
Production 0.0 10.0 33.3 0.0 0.0
Transportation and material moving 0.0 10.0 0.0 6.7 23.5
Other occupations 0.0 0.0 0.0 0.0 11.8
Industry of employment1
Construction 4.9 5.9 7.8 8.2 6.4
Manufacturing 6.7 9.6 12.0 13.9 12.2
Wholesale and retail trade 2.1 3.3 4.1 4.3 3.5
Transportation and warehousing 9.0 8.3 7.3 8.3 9.1
Information 0.4 0.6 0.8 0.7 0.6
Administrative, support, waste management and remediation services
25.5 25.6 22.5 22.1 21.9
Educational services 0.7 2.1 3.6 3.8 4.3
Health care and social assistance 9.6 10.4 11.0 10.6 11.6
Arts, entertainment, and recreation 1.3 1.1 1.2 1.2 1.4
Accommodation and food services 16.1 10.2 8.0 6.0 4.9
Other services, inc public administration 2.7 2.3 2.4 2.2 2.6
Other industry 20.9 20.6 19.4 18.7 21.5
1 Based on those who exited from July 2018 to June 2019.
2 Based on those who exited from January 2018 to December 2018.
3 Based on those who exited from October 2018 to September 2019.
4 Based on those who exited from April 2018 to March 2019.

Wagner-Peyser
PY 2019 Illinois State Data Book 415
Table VI-25 Outcomes of Wagner-Peyser Exiters in IL, by Ethnicity and Race
(Derived from PY 2019 Q4 PIRL)
Ethnicity Race
Hispanic Not Hispanic White Only Black Only Other
WIOA Primary Indicators of Performance
Employment 2nd quarter after exit1 68.5 68.2 67.6 69.6 68.2
Employment 4th quarter after exit2 73.3 71.1 71.0 72.1 72.7
Median earnings 2nd quarter after exit1 $6,780 $5,820 $6,695 $4,859 $6,676
WIA Common Measures
Entered employment in quarter after exit3 62.6 64.1 63.5 66.2 63.0
Retention in 2nd and 3rd quarters4 82.1 84.4 85.3 82.8 86.7
Average earnings in 2nd and 3rd quarters4 $19,187 $17,254 $19,573 $13,712 $22,487
Quarterly Employment Rate
First quarter after exit3 61.1 63.5 62.7 65.5 62.6
Second quarter after exit1 68.5 68.2 67.6 69.6 68.2
Third quarter after exit4 71.8 70.3 70.0 71.5 72.0
Fourth quarter after exit2 73.3 71.1 71.0 72.1 72.7
Quarterly Median Earnings (among those employed)
First quarter after exit3 $5,816 $5,087 $5,834 $4,296 $5,408
Second quarter after exit1 $6,781 $5,821 $6,696 $4,859 $6,676
Third quarter after exit4 $7,144 $6,234 $7,064 $5,205 $7,135
Fourth quarter after exit2 $7,484 $6,469 $7,413 $5,515 $7,576
Nontraditional Employment1
Females 5.1 3.5 1.5 8.0 0.0
Males 3.8 3.4 4.0 0.0 20.0
Characteristics of Second Quarter Employment (among those employed)1
Average quarterly earnings $8,371 $7,736 $8,815 $6,095 $9,692
$1 to $2,499 17.9 22.2 18.2 27.7 17.1
$2,500 to $4,999 18.4 21.2 19.4 23.6 18.2
$5,000 to $7,499 18.8 19.2 18.0 20.3 23.2
$7,500 to $9,999 15.8 13.1 13.8 12.6 15.5
$10,000 or more 29.1 24.3 30.6 15.9 26.0
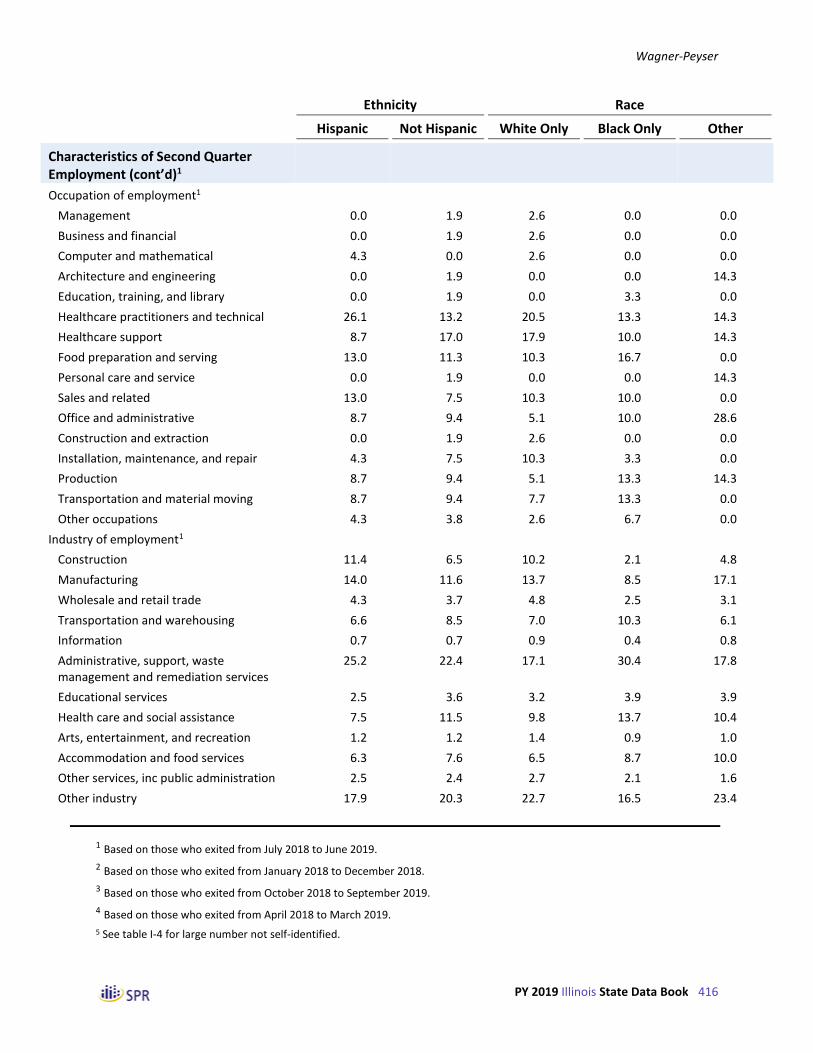
Wagner-Peyser
PY 2019 Illinois State Data Book 416
Ethnicity Race
Hispanic Not Hispanic White Only Black Only Other
Characteristics of Second Quarter Employment (cont’d)1
Occupation of employment1
Management 0.0 1.9 2.6 0.0 0.0
Business and financial 0.0 1.9 2.6 0.0 0.0
Computer and mathematical 4.3 0.0 2.6 0.0 0.0
Architecture and engineering 0.0 1.9 0.0 0.0 14.3
Education, training, and library 0.0 1.9 0.0 3.3 0.0
Healthcare practitioners and technical 26.1 13.2 20.5 13.3 14.3
Healthcare support 8.7 17.0 17.9 10.0 14.3
Food preparation and serving 13.0 11.3 10.3 16.7 0.0
Personal care and service 0.0 1.9 0.0 0.0 14.3
Sales and related 13.0 7.5 10.3 10.0 0.0
Office and administrative 8.7 9.4 5.1 10.0 28.6
Construction and extraction 0.0 1.9 2.6 0.0 0.0
Installation, maintenance, and repair 4.3 7.5 10.3 3.3 0.0
Production 8.7 9.4 5.1 13.3 14.3
Transportation and material moving 8.7 9.4 7.7 13.3 0.0
Other occupations 4.3 3.8 2.6 6.7 0.0
Industry of employment1
Construction 11.4 6.5 10.2 2.1 4.8
Manufacturing 14.0 11.6 13.7 8.5 17.1
Wholesale and retail trade 4.3 3.7 4.8 2.5 3.1
Transportation and warehousing 6.6 8.5 7.0 10.3 6.1
Information 0.7 0.7 0.9 0.4 0.8
Administrative, support, waste management and remediation services
25.2 22.4 17.1 30.4 17.8
Educational services 2.5 3.6 3.2 3.9 3.9
Health care and social assistance 7.5 11.5 9.8 13.7 10.4
Arts, entertainment, and recreation 1.2 1.2 1.4 0.9 1.0
Accommodation and food services 6.3 7.6 6.5 8.7 10.0
Other services, inc public administration 2.5 2.4 2.7 2.1 1.6
Other industry 17.9 20.3 22.7 16.5 23.4
1 Based on those who exited from July 2018 to June 2019.
2 Based on those who exited from January 2018 to December 2018.
3 Based on those who exited from October 2018 to September 2019.
4 Based on those who exited from April 2018 to March 2019.
5 See table I-4 for large number not self-identified.

Wagner-Peyser
PY 2019 Illinois State Data Book 417
Table VI-26 Outcomes of Wagner-Peyser Exiters in IL,
by Gender, Employment Status, and Disability Status
(Derived from PY 2019 Q4 PIRL)
WIOA Primary Indicators of Performance
Employment 2nd quarter after exit1 68.7 67.8 67.8 68.2 58.4
Employment 4th quarter after exit2 73.4 69.9 69.1 71.5 60.8
Median earnings 2nd quarter after exit1 $4,935 $6,875 $6,063 $5,944 $6,953
WIA Common Measures
Entered employment in quarter after exit3 63.6 64.1 63.9 57.8
Retention in 2nd and 3rd quarters4 85.2 83.1 82.1 84.1 80.1
Average earnings in 2nd and 3rd quarters4 $13,618 $20,596 $16,282 $17,622 $20,531
Quarterly Employment Rate
First quarter after exit3 63.0 63.2 65.7 63.0 56.5
Second quarter after exit1 68.7 67.8 67.8 68.2 58.4
Third quarter after exit4 71.6 69.6 65.2 70.7 60.4
Fourth quarter after exit2 73.4 69.9 69.1 71.5 60.8
Quarterly Median Earnings (among those employed)
First quarter after exit3 $4,241 $6,055 $5,340 $5,185 $6,224
Second quarter after exit1 $4,935 $6,876 $6,063 $5,945 $6,954
Third quarter after exit4 $5,333 $7,313 $6,234 $6,386 $7,126
Fourth quarter after exit2 $5,627 $7,642 $6,464 $6,645 $7,193
Nontraditional Employment1
Females 4.0 2.6 4.6 0.0
Males 3.5 16.7 1.4 12.5
Characteristics of Second Quarter Employment (among those employed)
Average quarterly earnings1 $6,071 $9,145 $7,738 $7,837 $9,154
$1 to $2,499 25.8 18.5 20.4 21.7 19.1
$2,500 to $4,999 24.9 17.7 19.5 20.8 18.7
$5,000 to $7,499 20.8 17.8 19.7 19.1 15.2
$7,500 to $9,999 13.6 13.4 14.0 13.5 13.3
$10,000 or more 14.9 32.5 26.4 24.9 33.8
Gender Employment Status Has a
Female Male Employed Not Employed Disability

Wagner-Peyser
PY 2019 Illinois State Data Book 418
Gender Employment Status Has a
Female Male Employed Not Employed Disability
Characteristics of Second Quarter Employment (cont’d)
Occupation of employment1
Management 0.0 3.1 0.0 1.8 0.0
Business and financial 0.0 3.1 0.0 1.8 0.0
Computer and mathematical 0.0 3.1 0.0 1.8 0.0
Architecture and engineering 0.0 3.1 0.0 1.8 0.0
Education, training, and library 0.0 3.1 0.0 1.8 0.0
Healthcare practitioners and technical 27.3 3.1 42.9 7.3 14.3
Healthcare support 25.0 0.0 9.5 16.4 14.3
Food preparation and serving 11.4 12.5 4.8 14.5 14.3
Personal care and service 2.3 0.0 0.0 1.8 0.0
Sales and related 13.6 3.1 14.3 7.3 0.0
Office and administrative 6.8 12.5 4.8 10.9 0.0
Construction and extraction 0.0 3.1 0.0 1.8 0.0
Installation, maintenance, and repair 0.0 15.6 4.8 7.3 0.0
Production 6.8 12.5 9.5 9.1 28.6
Transportation and material moving 4.5 15.6 4.8 10.9 14.3
Other occupations 2.3 6.3 4.8 3.6 14.3
Industry of employment1
Construction 1.2 11.5 4.8 7.2 10.1
Manufacturing 7.6 15.2 8.7 12.1 9.9
Wholesale and retail trade 2.6 4.7 3.0 3.8 3.4
Transportation and warehousing 5.9 9.9 6.2 8.3 9.9
Information 0.6 0.7 0.6 0.7 0.8
Administrative, support, waste management and remediation services
20.6 24.3 15.9 23.0 17.1
Educational services 5.2 2.2 4.8 3.4 3.4
Health care and social assistance 20.5 3.9 18.2 10.7 8.7
Arts, entertainment, and recreation 1.2 1.2 2.2 1.2 2.1
Accommodation and food services 9.6 5.8 8.1 7.4 5.3
Other services, inc public administration 2.4 2.4 2.8 2.4 3.6
Other industry 22.6 18.1 24.7 19.8 25.8
1 Based on those who exited from July 2018 to June 2019.
2 Based on those who exited from January 2018 to December 2018.
3 Based on those who exited from October 2018 to September 2019.
4 Based on those who exited from April 2018 to March 2019.

Wagner-Peyser
PY 2019 Illinois State Data Book 419
Table VI-27 Outcomes of Wagner-Peyser Exiters in IL, by Other Employment Characteristics
(Derived from PY 2019 Q4 PIRL)
Unemployment Compensation Status Long-term Displaced
Claimant Exhaustee Other Unemployed Homemaker
WIOA Primary Indicators of Performance
Employment 2nd quarter after exit1 69.0 68.8 63.9 52.0 66.7
Employment 4th quarter after exit2 72.2 77.1 66.8 50.0 72.1
Median earnings 2nd quarter after exit1 $5,968 $6,178 $5,862 $4,349 $4,957
WIA Common Measures
Entered employment in quarter after exit3 64.1 58.7 63.3 53.8 61.0
Retention in 2nd and 3rd quarters4 84.3 90.2 82.0 75.5 83.7
Average earnings in 2nd and 3rd quarters4 $17,464 $16,601 $18,189 $13,875 $14,884
Quarterly Employment Rate
First quarter after exit3 63.8 56.4 59.8 51.7 57.8
Second quarter after exit1 69.0 68.8 63.9 52.0 66.7
Third quarter after exit4 71.5 74.9 65.6 51.3 72.2
Fourth quarter after exit2 72.2 77.1 66.8 50.0 72.1
Quarterly Median Earnings (among those employed)
First quarter after exit3 $5,208 $5,537 $5,151 $3,941 $2,943
Second quarter after exit1 $5,968 $6,178 $5,863 $4,349 $4,957
Third quarter after exit4 $6,407 $6,000 $6,226 $4,949 $5,406
Fourth quarter after exit2 $6,652 $6,591 $6,568 $5,184 $4,825
Nontraditional Employment1
Females 3.0 10.0 6.7 0.0 0.0
Males 3.0 0.0 7.7 0.0 0.0
Characteristics of Second Quarter Employment (among those employed)1
Average quarterly earnings $7,789 $8,034 $8,062 $5,890 $5,712
$1 to $2,499 21.5 18.2 22.5 32.9 13.6
$2,500 to $4,999 20.8 17.3 20.6 22.1 36.4
$5,000 to $7,499 19.1 23.8 19.1 18.3 27.3
$7,500 to $9,999 13.7 11.7 12.8 10.5 15.9
$10,000 or more 24.9 29.0 25.1 16.2 6.8

Wagner-Peyser
PY 2019 Illinois State Data Book 420
Unemployment Compensation Status Long-term Displaced
Claimant Exhaustee Other Unemployed Homemaker
Characteristics of Second Quarter Employment (cont’d)1
Occupation of employment1
Management 1.9 0.0 0.0 0.0 0.0
Business and financial 1.9 0.0 0.0 0.0 0.0
Computer and mathematical 1.9 0.0 0.0 16.7 0.0
Architecture and engineering 1.9 0.0 0.0 0.0 0.0
Education, training, and library 1.9 0.0 0.0 0.0 0.0
Healthcare practitioners and technical 17.0 0.0 25.0 0.0 0.0
Healthcare support 11.3 28.6 18.8 33.3 0.0
Food preparation and serving 15.1 0.0 6.3 16.7 0.0
Personal care and service 1.9 0.0 0.0 16.7 0.0
Sales and related 9.4 14.3 6.3 16.7 0.0
Office and administrative 9.4 28.6 0.0 0.0 0.0
Construction and extraction 1.9 0.0 0.0 0.0 0.0
Installation, maintenance, and repair 7.5 0.0 6.3 0.0 0.0
Production 5.7 14.3 18.8 0.0 0.0
Transportation and material moving 9.4 14.3 6.3 0.0 0.0
Other occupations 1.9 0.0 12.5 0.0 0.0
Industry of employment1
Construction 6.8 4.3 9.2 4.9 7.1
Manufacturing 12.0 17.1 11.4 12.6 11.9
Wholesale and retail trade 3.9 2.4 3.6 4.4 9.5
Transportation and warehousing 8.3 11.9 7.6 8.4 4.8
Information 0.7 0.5 0.7 0.2 0.0
Administrative, support, waste management and remediation services
22.9 18.1 22.5 24.1 28.6
Educational services 3.5 4.8 3.2 3.0 4.8
Health care and social assistance 11.1 14.8 9.6 10.5 14.3
Arts, entertainment, and recreation 1.2 1.0 1.3 1.4 0.0
Accommodation and food services 7.4 6.2 7.9 9.6 9.5
Other services, inc public administration 2.4 2.9 2.6 3.0 0.0
Other industry 19.9 16.2 20.4 17.8 9.5
1 Based on those who exited from July 2018 to June 2019.
2 Based on those who exited from January 2018 to December 2018.
3 Based on those who exited from October 2018 to September 2019.
4 Based on those who exited from April 2018 to March 2019.

Wagner-Peyser
PY 2019 Illinois State Data Book 421
Table VI-28 Outcomes of Wagner-Peyser Exiters in IL,
by Veteran Status and Selected Barriers to Employment
(Derived from PY 2019 Q4 PIRL)
Veteran Status Receives Low Basic
Skills/English
Any Disabled Vet SSI/SSDI Income Deficient
WIOA Primary Indicators of Performance
Employment 2nd quarter after exit1 65.1 60.2 45.1 63.6 65.0
Employment 4th quarter after exit2 66.2 62.5 53.7 64.9 67.6
Median earnings 2nd quarter after exit1 $8,193 $8,563 $2,934 $4,974 $6,123
WIA Common Measures
Entered employment in quarter after exit3 63.0 60.1 45.8 63.1 62.6
Retention in 2nd and 3rd quarters4 84.0 80.3 77.3 83.4 80.3
Average earnings in 2nd and 3rd quarters4 $23,048 $22,986 $15,933 $15,103 $17,464
Quarterly Employment Rate
First quarter after exit3 62.3 59.0 44.2 62.4 59.3
Second quarter after exit1 65.1 60.2 45.1 63.6 65.0
Third quarter after exit4 66.3 62.7 48.6 67.1 67.0
Fourth quarter after exit2 66.2 62.5 53.7 64.9 67.6
Quarterly Median Earnings (among those employed)
First quarter after exit3 $6,967 $6,805 $2,043 $4,048 $5,144
Second quarter after exit1 $8,193 $8,564 $2,934 $4,974 $6,124
Third quarter after exit4 $8,420 $8,608 $7,270 $5,452 $6,569
Fourth quarter after exit2 $8,663 $8,874 $4,505 $5,774 $6,583
Nontraditional Employment1
Females 6.3 0.0 0.0 5.3 6.8
Males 10.5 25.0 0.0 4.8 0.0
Characteristics of Second Quarter Employment (among those employed)1
Average quarterly earnings $10,565 $10,298 $4,769 $6,492 $7,846
$1 to $2,499 15.7 14.9 45.9 27.1 20.1
$2,500 to $4,999 15.8 15.8 18.9 23.2 19.5
$5,000 to $7,499 14.8 14.1 13.5 19.1 21.9
$7,500 to $9,999 13.3 15.0 10.8 12.7 14.8
$10,000 or more 40.4 40.3 10.8 17.9 23.7

Wagner-Peyser
PY 2019 Illinois State Data Book 422
Veteran Status Receives Low Basic
Skills/English
Any Disabled Vet SSI/SSDI Income Deficient
Characteristics of Second Quarter Employment (cont’d)1
Occupation of employment1
Management 0.0 0.0 0.0 2.0 0.0
Business and financial 0.0 0.0 0.0 0.0 0.0
Computer and mathematical 0.0 0.0 0.0 0.0 0.0
Architecture and engineering 0.0 0.0 0.0 0.0 0.0
Education, training, and library 5.9 0.0 0.0 0.0 0.0
Healthcare practitioners and technical 29.4 20.0 0.0 22.4 9.1
Healthcare support 11.8 20.0 0.0 16.3 24.2
Food preparation and serving 0.0 0.0 0.0 8.2 15.2
Personal care and service 0.0 0.0 0.0 0.0 0.0
Sales and related 0.0 0.0 0.0 10.2 12.1
Office and administrative 17.6 0.0 0.0 8.2 15.2
Construction and extraction 0.0 0.0 0.0 0.0 0.0
Installation, maintenance, and repair 5.9 0.0 0.0 4.1 6.1
Production 17.6 40.0 0.0 10.2 12.1
Transportation and material moving 11.8 20.0 0.0 12.2 3.0
Other occupations 0.0 0.0 0.0 6.1 3.0
Industry of employment1
Construction 13.6 11.7 5.9 5.3 10.9
Manufacturing 14.1 11.3 8.8 8.3 16.2
Wholesale and retail trade 3.9 3.2 0.0 2.9 2.8
Transportation and warehousing 10.9 10.7 8.8 7.9 5.2
Information 0.8 1.0 0.0 0.7 0.2
Administrative, support, waste management and remediation services
18.2 16.1 26.5 25.9 24.9
Educational services 2.5 3.2 0.0 2.2 3.2
Health care and social assistance 5.4 7.1 8.8 12.0 7.2
Arts, entertainment, and recreation 1.5 2.0 8.8 1.7 1.5
Accommodation and food services 4.0 3.7 8.8 11.0 10.0
Other services, inc public administration 2.6 3.7 0.0 3.0 1.7
Other industry 22.4 26.2 23.5 19.1 16.2
1 Based on those who exited from July 2018 to June 2019.
2 Based on those who exited from January 2018 to December 2018.
3 Based on those who exited from October 2018 to September 2019.
4 Based on those who exited from April 2018 to March 2019.

Wagner-Peyser
PY 2019 Illinois State Data Book 423
Table VI-29 Outcomes of Wagner-Peyser Exiters in IL, by Highest Educational Level
(Derived from PY 2019 Q4 PIRL)
No Level Completed
HS Graduate or
Equivalent Some Post-secondary
Technical or Vocational Certificate
Post-secondary
Degree
WIOA Primary Indicators of Performance
Employment 2nd quarter after exit1 64.3 69.2 68.4 72.6 67.2
Employment 4th quarter after exit2 67.9 72.5 70.9 73.8 71.4
Median earnings 2nd quarter after exit1 $4,949 $5,417 $6,131 $5,901 $8,113
WIA Common Measures
Entered employment in quarter after exit3 59.7 65.4 63.9 68.0 62.4
Retention in 2nd and 3rd quarters4 80.1 83.8 84.0 85.6 86.7
Average earnings in 2nd and 3rd quarters4 $15,046 $15,080 $17,908 $19,735 $23,480
Quarterly Employment Rate
First quarter after exit3 57.9 64.7 63.7 67.0 61.4
Second quarter after exit1 64.3 69.2 68.4 72.6 67.2
Third quarter after exit4 66.9 71.5 70.2 72.3 70.7
Fourth quarter after exit2 67.9 72.5 70.9 73.8 71.4
Quarterly Median Earnings (among those employed)
First quarter after exit3 $4,298 $4,727 $5,321 $5,625 $6,648
Second quarter after exit1 $4,949 $5,417 $6,131 $5,902 $8,114
Third quarter after exit4 $5,339 $5,788 $6,509 $7,022 $8,633
Fourth quarter after exit2 $5,572 $5,980 $6,758 $7,147 $9,000
Nontraditional Employment1
Females 0.0 3.2 3.1 20.0 3.8
Males 0.0 2.1 12.5 0.0 4.2
Characteristics of Second Quarter Employment (among those employed)1
Average quarterly earnings $6,304 $6,849 $8,020 $8,183 $10,425
$1 to $2,499 27.5 23.3 20.7 23.4 15.5
$2,500 to $4,999 22.9 23.0 20.4 19.8 15.6
$5,000 to $7,499 20.6 20.8 18.7 17.7 15.7
$7,500 to $9,999 12.7 13.0 14.3 11.7 14.5
$10,000 or more 16.2 20.0 25.8 27.4 38.8
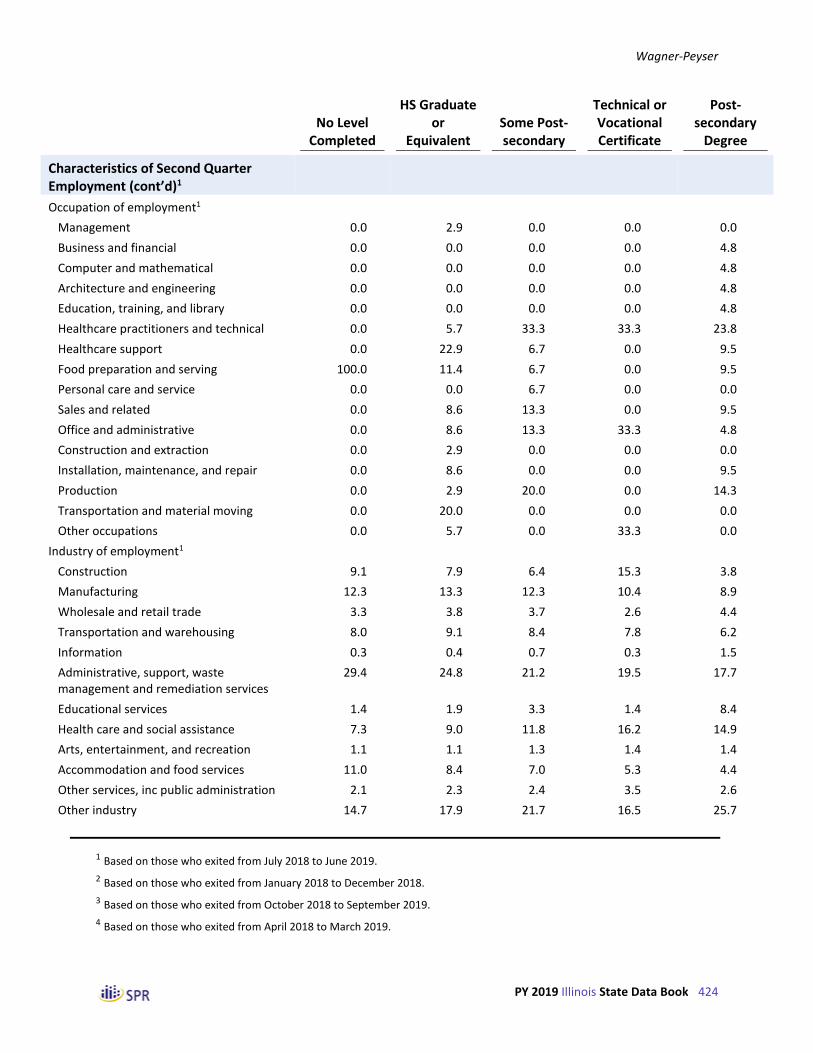
Wagner-Peyser
PY 2019 Illinois State Data Book 424
No Level Completed
HS Graduate or
Equivalent Some Post-secondary
Technical or Vocational Certificate
Post-secondary
Degree
Characteristics of Second Quarter Employment (cont’d)1
Occupation of employment1
Management 0.0 2.9 0.0 0.0 0.0
Business and financial 0.0 0.0 0.0 0.0 4.8
Computer and mathematical 0.0 0.0 0.0 0.0 4.8
Architecture and engineering 0.0 0.0 0.0 0.0 4.8
Education, training, and library 0.0 0.0 0.0 0.0 4.8
Healthcare practitioners and technical 0.0 5.7 33.3 33.3 23.8
Healthcare support 0.0 22.9 6.7 0.0 9.5
Food preparation and serving 100.0 11.4 6.7 0.0 9.5
Personal care and service 0.0 0.0 6.7 0.0 0.0
Sales and related 0.0 8.6 13.3 0.0 9.5
Office and administrative 0.0 8.6 13.3 33.3 4.8
Construction and extraction 0.0 2.9 0.0 0.0 0.0
Installation, maintenance, and repair 0.0 8.6 0.0 0.0 9.5
Production 0.0 2.9 20.0 0.0 14.3
Transportation and material moving 0.0 20.0 0.0 0.0 0.0
Other occupations 0.0 5.7 0.0 33.3 0.0
Industry of employment1
Construction 9.1 7.9 6.4 15.3 3.8
Manufacturing 12.3 13.3 12.3 10.4 8.9
Wholesale and retail trade 3.3 3.8 3.7 2.6 4.4
Transportation and warehousing 8.0 9.1 8.4 7.8 6.2
Information 0.3 0.4 0.7 0.3 1.5
Administrative, support, waste management and remediation services
29.4 24.8 21.2 19.5 17.7
Educational services 1.4 1.9 3.3 1.4 8.4
Health care and social assistance 7.3 9.0 11.8 16.2 14.9
Arts, entertainment, and recreation 1.1 1.1 1.3 1.4 1.4
Accommodation and food services 11.0 8.4 7.0 5.3 4.4
Other services, inc public administration 2.1 2.3 2.4 3.5 2.6
Other industry 14.7 17.9 21.7 16.5 25.7
1 Based on those who exited from July 2018 to June 2019.
2 Based on those who exited from January 2018 to December 2018.
3 Based on those who exited from October 2018 to September 2019.
4 Based on those who exited from April 2018 to March 2019.

Wagner-Peyser
PY 2019 Illinois State Data Book 425
Table VI-30 Outcomes of Wagner-Peyser Exiters in IL, by Selected Other Characteristics
(Derived from PY 2019 Q4 PIRL)
School Status Migrant/ Seasonal Single
Attending Not Attending Farmworker Homeless Parents
WIOA Primary Indicators of Performance
Employment 2nd quarter after exit1 56.2 68.4 50.2 55.0 67.9
Employment 4th quarter after exit2 63.1 71.5 54.8 52.3 71.0
Median earnings 2nd quarter after exit1 $5,340 $5,962 $4,021 $5,408 $5,437
WIA Common Measures
Entered employment in quarter after exit3 64.7 63.9 70.1 59.8 67.9
Retention in 2nd and 3rd quarters4 80.8 84.1 60.7 73.5 82.4
Average earnings in 2nd and 3rd quarters4 $18,143 $17,561 $14,399 $15,691 $15,522
Quarterly Employment Rate
First quarter after exit3 53.5 63.3 57.1 58.1 68.1
Second quarter after exit1 56.2 68.4 50.2 55.0 67.9
Third quarter after exit4 60.7 70.7 46.3 55.2 70.6
Fourth quarter after exit2 63.1 71.5 54.8 52.3 71.0
Quarterly Median Earnings (among those employed)
First quarter after exit3 $4,634 $5,214 $4,104 $3,873 $5,024
Second quarter after exit1 $5,340 $5,962 $4,021 $5,409 $5,437
Third quarter after exit4 $6,541 $6,381 $4,058 $5,107 $5,761
Fourth quarter after exit2 $6,578 $6,641 $4,301 $5,458 $6,083
Nontraditional Employment1
Females 0.0 4.4 0.0 0.0 6.0
Males 16.7 2.5 0.0 0.0 10.5
Characteristics of Second Quarter Employment (among those employed)1
Average quarterly earnings $7,238 $7,843 $6,720 $6,554 $7,092
$1 to $2,499 23.7 21.6 36.4 28.6 23.0
$2,500 to $4,999 23.1 20.7 20.9 19.2 23.3
$5,000 to $7,499 19.5 19.1 10.9 19.6 18.9
$7,500 to $9,999 11.4 13.5 14.5 15.2 13.0
$10,000 or more 22.4 25.0 17.3 17.4 21.8

Wagner-Peyser
PY 2019 Illinois State Data Book 426
School Status Migrant/ Seasonal Single
Attending Not Attending Farmworker Homeless Parents
Characteristics of Second Quarter Employment (cont’d)1
Occupation of employment1
Management 0.0 1.6 0.0 0.0 4.0
Business and financial 0.0 1.6 0.0 0.0 0.0
Computer and mathematical 0.0 1.6 0.0 0.0 4.0
Architecture and engineering 0.0 1.6 0.0 0.0 0.0
Education, training, and library 0.0 1.6 0.0 100.0 0.0
Healthcare practitioners and technical 50.0 10.9 0.0 0.0 28.0
Healthcare support 8.3 15.6 0.0 0.0 20.0
Food preparation and serving 25.0 9.4 0.0 0.0 8.0
Personal care and service 0.0 1.6 0.0 0.0 4.0
Sales and related 0.0 10.9 0.0 0.0 8.0
Office and administrative 8.3 9.4 0.0 0.0 4.0
Construction and extraction 0.0 1.6 0.0 0.0 0.0
Installation, maintenance, and repair 0.0 7.8 0.0 0.0 8.0
Production 8.3 9.4 0.0 0.0 4.0
Transportation and material moving 0.0 10.9 0.0 0.0 8.0
Other occupations 0.0 4.7 0.0 0.0 0.0
Industry of employment1
Construction 3.0 7.2 7.3 4.8 5.7
Manufacturing 5.1 12.1 10.1 9.9 9.3
Wholesale and retail trade 4.4 3.8 4.6 1.8 3.1
Transportation and warehousing 7.1 8.2 1.8 8.8 8.6
Information 0.7 0.7 0.0 0.4 0.3
Administrative, support, waste management and remediation services
17.2 22.9 23.9 30.1 22.5
Educational services 5.7 3.4 4.6 1.8 3.5
Health care and social assistance 18.2 10.8 1.8 7.4 13.5
Arts, entertainment, and recreation 1.3 1.2 0.0 2.6 1.0
Accommodation and food services 8.4 7.4 9.2 9.2 9.8
Other services, inc public administration 2.4 2.4 1.8 2.9 2.4
Other industry 26.6 19.8 34.9 20.2 20.3
1 Based on those who exited from July 2018 to June 2019.
2 Based on those who exited from January 2018 to December 2018.
3 Based on those who exited from October 2018 to September 2019.
4 Based on those who exited from April 2018 to March 2019.

Wagner-Peyser
PY 2019 Illinois State Data Book 427
Table VI-31 Outcomes of Wagner-Peyser Exiters in IL, by Major Service Category
(Derived from PY 2019 Q4 PIRL)
All Exiters
Received Career Services
Basic Individualized Only Career
Services Received Training
WIOA Primary Indicators of Performance
Employment 2nd quarter after exit1 68.2 68.2 66.9 68.0 81.6
Employment 4th quarter after exit2 71.4 71.4 69.4 71.3 78.9
Median earnings 2nd quarter after exit1 $5,945 $5,945 $5,923 $5,930 $7,882
WIA Common Measures
Entered employment in quarter after exit3 63.9 63.9 62.8 63.8 84.2
Retention in 2nd and 3rd quarters4 84.0 84.0 83.6 83.9 94.0
Average earnings in 2nd and 3rd quarters4 $17,571 $17,571 $17,714 $17,546 $19,944
Quarterly Employment Rate
First quarter after exit3 63.1 63.1 62.1 62.9 84.1
Second quarter after exit1 68.2 68.2 66.9 68.0 81.6
Third quarter after exit4 70.5 70.5 69.2 70.4 84.1
Fourth quarter after exit2 71.4 71.4 69.4 71.3 78.9
Quarterly Median Earnings (among those employed)
First quarter after exit3 $5,198 $5,198 $5,201 $5,170 $7,770
Second quarter after exit1 $5,946 $5,946 $5,923 $5,931 $7,882
Third quarter after exit4 $6,381 $6,381 $6,453 $6,369 $7,904
Fourth quarter after exit2 $6,637 $6,637 $6,817 $6,629 $9,030
Nontraditional Employment1
Females 4.0 4.0 4.0 4.5 3.9
Males 3.5 3.5 3.5 0.0 4.3
Characteristics of Second Quarter Employment (among those employed)1
Average quarterly earnings $7,834 $7,834 $7,769 $7,817 $9,301
$1 to $2,499 21.6 21.6 22.5 21.6 18.9
$2,500 to $4,999 20.8 20.8 19.9 20.9 11.1
$5,000 to $7,499 19.1 19.1 18.8 19.1 17.5
$7,500 to $9,999 13.5 13.5 13.9 13.5 14.7
$10,000 or more 25.0 25.0 24.9 24.8 37.8

Wagner-Peyser
PY 2019 Illinois State Data Book 428
All Exiters
Received Career Services
Basic Individualized Only Career
Services Received Training
Characteristics of Second Quarter Employment (cont’d)1
Occupation of employment1
Management 1.3 1.3 1.3 0.0 1.7
Business and financial 1.3 1.3 1.3 0.0 1.7
Computer and mathematical 1.3 1.3 1.3 0.0 1.7
Architecture and engineering 1.3 1.3 1.3 0.0 1.7
Education, training, and library 1.3 1.3 1.3 0.0 1.7
Healthcare practitioners and technical 17.1 17.1 17.1 0.0 21.7
Healthcare support 14.5 14.5 14.5 6.3 16.7
Food preparation and serving 11.8 11.8 11.8 43.8 3.3
Personal care and service 1.3 1.3 1.3 0.0 1.7
Sales and related 9.2 9.2 9.2 25.0 5.0
Office and administrative 9.2 9.2 9.2 12.5 8.3
Construction and extraction 1.3 1.3 1.3 0.0 1.7
Installation, maintenance, and repair 6.6 6.6 6.6 0.0 8.3
Production 9.2 9.2 9.2 0.0 11.7
Transportation and material moving 9.2 9.2 9.2 6.3 10.0
Other occupations 3.9 3.9 3.9 6.3 3.3
Industry of employment1
Construction 7.2 7.2 6.1 7.2 4.8
Manufacturing 12.0 12.0 10.9 12.0 7.7
Wholesale and retail trade 3.8 3.8 3.8 3.8 3.8
Transportation and warehousing 8.2 8.2 9.1 8.2 7.2
Information 0.7 0.7 0.9 0.7 1.0
Administrative, support, waste management and remediation services
22.8 22.8 22.0 23.0 9.6
Educational services 3.5 3.5 3.3 3.5 2.9
Health care and social assistance 10.9 10.9 11.9 10.8 27.3
Arts, entertainment, and recreation 1.2 1.2 1.4 1.2 1.9
Accommodation and food services 7.4 7.4 7.5 7.4 8.6
Other services, inc public administration 2.4 2.4 2.3 2.4 1.4
Other industry 20.0 20.0 20.9 19.9 23.9
1 Based on those who exited from July 2018 to June 2019.
2 Based on those who exited from January 2018 to December 2018.
3 Based on those who exited from October 2018 to September 2019.
4 Based on those who exited from April 2018 to March 2019.

Wagner-Peyser
PY 2019 Illinois State Data Book 429
Table VI-32 WIOA Primary Indicators of Performance for Wagner-Peyser Exiters, by State
(Derived from PY 2019 Q4 PIRL)
2nd Quarter Employment1
4th Quarter Employment2
Median Earnings1
Nation 68.2 68.1 $6,000
Alabama 68.9 67.1 $3,991
Alaska 61.0 58.1 $6,132
Arizona 67.4 62.3 $5,632
Arkansas 71.6 71.0 $5,388
California 63.4 63.4 $7,177
Colorado 64.3 64.0 $5,878
Connecticut 65.8 65.9 $6,487
Delaware 69.3 70.6 $5,461
District of Columbia 57.4 61.7 $6,050
Florida 68.2 66.4 $5,470
Georgia 69.0 69.0 $5,484
Guam 62.0 45.5 $37,720
Hawaii 58.7 61.6 $7,217
Idaho 69.7 70.3 $5,913
Illinois 68.2 71.4 $5,945
Indiana 76.3 75.4 $6,950
Iowa 73.0 73.0 $6,262
Kansas 70.8 69.3 $5,749
Kentucky 37.3 46.0 $5,408
Louisiana 57.9 61.5 $4,834
Maine 69.9 65.6 $5,948
Maryland 67.4 69.3 $6,710
Massachusetts 66.3 68.4 $7,891
Michigan 71.8 71.9 $6,900
Minnesota 69.0 70.9 $8,366
Mississippi 70.9 68.9 $4,238
Missouri 69.8 69.8 $5,367
Montana 64.5 63.8 $5,700
Nebraska 74.3 73.0 $6,725
Nevada 72.8 71.4 $5,408
New Hampshire 69.3 65.7 $8,072
New Jersey 59.6 60.3 $5,904
New Mexico 63.3 61.3 $5,123
New York 68.6 68.8 $6,971
North Carolina 72.7 72.5 $5,126

Wagner-Peyser
PY 2019 Illinois State Data Book 430
2nd Quarter Employment1
4th Quarter Employment2
Median Earnings1
North Dakota 68.2 67.2 $6,747
Northern Mariana Islands 0.0 0.0 -
Ohio 72.1 72.4 $7,473
Oklahoma 63.7 65.5 $5,620
Oregon 68.2 69.5 $6,629
Palau 0.0 0.0 -
Pennsylvania 69.4 70.3 $5,993
Puerto Rico - - -
Rhode Island 68.6 71.2 $7,200
South Carolina 69.1 68.9 $5,462
South Dakota 70.4 68.0 $4,962
Tennessee 72.5 73.0 $5,814
Texas 69.2 69.6 $5,972
Utah 70.5 70.6 $6,647
Vermont 66.6 58.3 $5,634
Virgin Islands 45.4 52.0 $5,571
Virginia 74.8 74.9 $5,852
Washington 68.3 67.3 $7,608
West Virginia 59.0 60.1 $4,989
Wisconsin 75.3 73.4 $6,864
Wyoming 63.3 61.3 $5,490
1 Based on those who exited from July 2018 to June 2019.
2 Based on those who exited from January 2018 to December 2018.

Wagner-Peyser
PY 2019 Illinois State Data Book 431
Table VI-33 WIA Common Measures for Wagner-Peyser Exiters, by State
(Derived from PY 2019 Q4 PIRL)
Entered Employment1
Employment Retention2
Average Earnings2
Nation 63.0 83.4 $17,116
Alabama 65.5 81.0 $12,333
Alaska 57.4 75.3 $16,931
Arizona 64.1 79.1 $15,149
Arkansas 69.8 84.5 $14,316
California 53.0 83.4 $21,883
Colorado 68.6 72.6 $15,541
Connecticut 60.1 81.3 $17,780
Delaware 67.1 81.8 $14,743
District of Columbia 49.6 80.8 $18,606
Florida 66.1 82.3 $14,453
Georgia 65.5 84.3 $14,946
Guam 66.0 92.5 $69,327
Hawaii 50.6 81.2 $18,114
Idaho 69.8 84.8 $15,266
Illinois 63.9 84.0 $17,571
Indiana 71.2 87.1 $17,134
Iowa 66.7 84.8 $15,889
Kansas 72.6 84.4 $14,190
Kentucky 19.8 81.0 $14,599
Louisiana 50.5 81.5 $16,022
Maine 67.4 83.5 $14,581
Maryland 56.0 86.1 $19,889
Massachusetts 60.4 86.1 $24,696
Michigan 60.1 86.7 $17,731
Minnesota 63.4 88.5 $22,245
Mississippi 70.2 80.9 $10,654
Missouri 63.6 83.0 $28,014
Montana 62.3 80.6 $15,107
Nebraska 70.4 86.6 $16,229
Nevada 69.4 82.3 $14,970
New Hampshire 68.5 86.3 $19,661
New Jersey 52.7 81.2 $20,269
New Mexico 56.7 79.2 $13,843
New York 62.6 84.2 $19,616
North Carolina 67.6 84.4 $13,686

Wagner-Peyser
PY 2019 Illinois State Data Book 432
Entered Employment1
Employment Retention2
Average Earnings2
North Dakota 67.9 81.7 $18,202
Northern Mariana Islands - - -
Ohio 72.1 85.9 $19,306
Oklahoma 56.6 82.3 $16,056
Oregon 60.0 83.9 $17,949
Palau - - -
Pennsylvania 62.1 85.5 $16,562
Puerto Rico - - -
Rhode Island 59.5 88.2 $18,665
South Carolina 68.4 82.3 $13,650
South Dakota 67.9 79.7 $13,140
Tennessee 66.7 86.3 $15,116
Texas 64.7 83.5 $17,282
Utah 66.8 85.1 $17,816
Vermont 65.8 82.3 $14,397
Virgin Islands 44.5 71.0 $16,430
Virginia 70.1 86.0 $15,541
Washington 61.8 82.5 $21,091
West Virginia 53.0 80.8 $15,031
Wisconsin 67.0 88.5 $17,152
Wyoming 55.6 76.5 $15,149
1 Based on those who exited from October 2018 to September 2019.
2 Based on those who exited from April 2018 to March 2019.

Appendix A
433 PY 2019 State Data Book
Appendix A
This appendix describes definitional issues and the computation of rows or column entries that may not be straightforward. It should be used in conjunction with Appendix B, which describes the PIRL elements from which table row entries are drawn.
Part I: Summary Comparisons Across Programs
Table I-1 This table shows, by state, the number of reportable individuals; WIOA participants, by program of participation; and Wagner-Peyser participants. Participants include those who participated at any time during the four quarters of the program year, regardless of whether they had exited.
Table I-2 This table shows the trend in the number of WIA/WIOA exiters, by program of participation. Sums of counts may not equal the totals, because exiters may be in more than one program (for example, both a local and statewide program). Columns denoting each program year tabulate results for the most recent four quarters of exiters known at the end of the program year. Because there is one-quarter lag before a person’s exit date is known, the exit cohorts for these columns represent those who exited from April 1 of each program year to March 31 of the following year. All columns include four quarters of exiters.
Table I-3 This table shows counts of those who exited during the date range shown, by state and program of participation. The All WIOA column includes those who participated in one or more of the Adult, Dislocated Worker (including DWG), or Youth programs; the sum of counts across WIOA programs exceeds the All WIOA total, because some exiters were coenrolled in more than one WIOA program. Wagner-Peyser exiters could also have been enrolled in WIOA.
Table I-4 This table shows, for the date range shown, the number of exiters with selected characteristics by program of participation, and shows the number with missing data on selected elements. Both statewide and local programs are included; DWG programs are included in the Dislocated Worker and the All WIOA columns. Within any row, the sum of counts across WIOA programs may exceed the All WIOA total, because some exiters were coenrolled in more than one WIOA program. Wagner-Peyser exiters could also have been enrolled in WIOA. See notes to Tables II-1 & II-3 to II-12 for a discussion of the measurement of selected characteristics.
Tables I-5 to I-9
These tables show trends over time in the number of participants by state. The tables, in turn, show trends in the number of participants for the Adult program (Table I-5), the Dislocated Worker state and local (formula-funded) program (Table I-6), Dislocated Worker Grant (DWG) projects (Table I-7), the Youth program (Table I-8), and Wagner-Peyser (Table I-9). Columns denoting each program year tabulate results for the most recent four quarters of exiters known at the end of the program year. The participant cohorts for these columns represent those who participanted from July 1 of each program year to June 30 of the following year. All columns include four quarters of participants.
Tables I-10 to I-14
These tables show trends over time in the number of exiters by state. The tables, in turn, show trends in the number of exiters for the Adult program (Table I-10), the Dislocated Worker state and local (formula-funded) program (Table I-11), Dislocated Worker Grant (DWG) projects (Table I-12), the Youth program (Table I-13), and Wagner-Peyser (Table I-14). Column headings are defined as for Table I-2.
Table I-15 Not tabulated at the state level.

Appendix A
434 PY 2019 State Data Book
Part II: Adult Program
These tables present information for those in the WIOA Adult Program (identified from PIRL 903) and show the characteristics and services of exiters, and the outcomes of exiters or participants, as applicable.
Tables II-1 & II-2
These tables show trends over time in the percentage (Table II-1) or raw counts (Table II-2) of exiters with various characteristics. Columns denoting each program year tabulate results for the most recent four quarters of exiters known at the end of the program year. Because there is one-quarter lag before a person’s exit date is known, the exit cohorts for these columns represent those who exited from April 1 of each program year to March 31 of the following year.
In data drawn from the WIASRD, some characteristics are only reported for those who received intensive or training services, and not those who received only staff-assisted core services (according to the WIASRD, the latter group made up approximately 60 percent of all adult exiters who received staff-assisted services). These characteristics include whether a participant was a public assistance recipient, homeless, an ex-offender, or a single parent. For this reason as well, the trends in percentages (Table II-1) for exiters with these characteristics can be misleading; counts (Table II-2) for years prior to the introduction of the PIRL are not shown for these elements. Other characteristics reported in the PIRL (long-term unemployed, exhausting TANF within two years, basic skills deficient, facing cultural barriers, and displaced homemaker) were not required reporting elements for Adult program participants in the WIASRD, and Adult program priority status and other public assistance receipt were defined differently; for these elements, therefore, prior years’ data is not shown. Finally, note that Table II-2 presents counts of those with non-missing data; there is some missing data on most items, so counts are to some degree under-estimates (see Table I-4 for selected information on the extent of missing data, and notes to Table II-1 & Tables II-3 to II-12, below, for additional information on the definition of exiter characteristics).
Table II-1 & Tables II-3 to II-12
These tables show the percentage of exiters identified by the column heading with various characteristics. All numbers are percentages except the number of exiters (shown in the first three rows) and average preprogram earnings.
Age is calculated as the difference between the year of program entry and the year of birth. If the month/day in the year of program entry is before the month/day of the year of birth, then one year is subtracted from the difference.
The category of “Employment Status” that is labelled “Not employed or with layoff notice” includes those employed but with a layoff notice, not in the labor force, or unemployed (PIRL 400 codes 0, 2, or 3).
Highest educational level is coded based on PIRL 408. Most row entries are straightforward representations of the PIRL element, but note that code 0=No educational level; codes 2,3=Secondary school equivalency; and codes 7,8=Bachelor’s Degree or higher.
Preprogram quarterly earnings represents the average (mean) earnings in the second quarter (PIRL 1700) and third quarter (PIRL 1701) prior to the quarter of program entry (based on PIRL 900). Those with zero earnings in one quarter but not the other are included in the average, and their average is calculated including the zero value; however, an exiter with zero earnings in both quarters is excluded from the average. In the tables showing trends over time, averages are shown in nominal dollars (that is, without an adjustment for inflation).

Appendix A
435 PY 2019 State Data Book
The percentage who are English language learners is calculated after excluding exiters in Puerto Rico.
In calculating percentages, exiters with missing data on either the row or column heading are generally excluded. An exception is for ethnicity and race. The ethnicity and various race categories are separate data elements in the PIRL, coded 1 for yes, 0 for no, and 9 for did not self-identify. A large number of records are coded as blank or code 9 on one or more of these variables but not all of them (see Table I-4 in the Data Book). For this reason, if a person was coded as being of a certain race, but had missing data on ethnicity or one or more of the remaining race categories (that is, neither a 1 nor a 0), the missing value was recoded to 0. The race categories are not mutually exclusive with each other or with Hispanic ethnicity; a person could be identified as belonging to more than one race, and may also be identified by each of their race groups and as of Hispanic ethnicity.
Categories of public assistance recipients are also not mutually exclusive, because an exiter could receive benefits from more than one program. Note that SNAP participation was not a separate required item in the WIASRD, but SNAP participants were to be coded as Other public assistance recipients. Therefore, many carry-over participants who were SNAP participants could be shown as “Other” public assistance recipients rather than SNAP participants. For this reason, the percentage who are coded as SNAP participants in the PIRL is likely understated, and the percentage who are Other public assistance recipients is likely overstated. Finally, note that the row for SSI or SSDI includes Ticket Holders (see PIRL 602).
For the definition of the row Any Adult Program priority group (under Other Characteristics), see the note to Table II-7.
Table II-4 In the “Ethnicity” and “Race” columns, exiters coded as “Not Hispanic” are those coded as 0 on PIRL 210 or those missing or coded as 9 on this element but who are of at least one race category. Exiters coded as “White Only” or “Black Only” are coded as 1 on PIRL 215 and 213, respectively, and are not also of any other race; however, they may be of Hispanic ethnicity. Those included in the “Other Race” column could be of any race other than white or black, or could be white or black in combination with any other race.
Table II-5 In the “Employment Status” columns, the “Not Employed” column includes those employed but with a notice of layoff, not in the labor force, and unemployed.
Table II-6 In the “Unemployment Compensation Status” columns, the “Claimant” column includes exiters referred or not by RESEA or WPRS, and claimants exempt from work search.
Table II-7 The column headings are the Adult program’s priority groups. As identified in TEGL 19-16, these are veterans, low income individuals, those receiving public assistance, and those who are basic skills deficient. As defined in WIOA Sec. 3, public assistance means “…Federal, State, or local government cash payments for which eligibility is determined by a needs or income test” (emphasis added). The column heading Receives TANF, therefore, denotes those who received assistance through TANF (PIRL 600), and excludes those who received only SSI/SSDI (PIRL 602), SNAP benefits (PIRL 603), or other public assistance (PIRL 604), because these categories can include non-cash assistance or assistance that is not means tested. Those identified as “Basic Skills/English Deficient” are either basic skills deficient (PIRL 804) or English-language learners (PIRL 803), or both; as explained in the TEGL, English-language learners count as basic skills deficient under the basic skills deficient priority category. The columns are not mutually exclusive.
Table II-8 The columns are defined based on PIRL 408. Values on this element are mapped to the columns as follows: 0= No Level Completed; 1, 2, 3=HS Graduate or Equivalent; 4=Some Postsecondary; 5=Technical or Vocational Certificate; and 6, 7, or 8=Postsecondary Degree.

Appendix A
436 PY 2019 State Data Book
Table II-9 The “School Status” columns are defined based on PIRL 409. Values on this element are mapped to the columns as follows: 1,2,3=Attending; 4,5,6=Not Attending.
Table II-10 & II-11
These tables show the percentages (Table II-10) and counts (Table II-11) of characteristics of exiters by major service categories. The columns are defined based on PIRL elements using the guidance provided in TEGL 10-16 Change 1 Attachment 7 Table A. The columns are not mutually exclusive, because an exiter could have received any combination of basic career services, individualized career services, or training. The “Only Career Services” column includes those who received either basic career services or individualized career services (or both), but who did not also receive training. Those in the “Received Training” column (PIRL 1300=1) could also have received career services. Note that, consistent with TEGL 19-16, those who only receive self-services or informational services are not considered participants and, therefore, are not included in the tables in this part. A small number of exiters have an exit date but have no identifiable service. These individuals are included in the count of “All Exiters,” but are not included in any of the subsequent columns.
Table II-12 The first column includes those who received training of any type (this column duplicates the final column from Table II-10) and is based on PIRL 1300. The next columns show trainees by the type of training received, based on PIRL 1303, 1310, and 1315, as follows: codes 4, 7, 8=ABE/ESL or Prerequisite Training; codes 1, 5, 9=Work-based Training; codes 2, 6, 10=Other Occupational Training; codes 3, 11=Other Training. A participant could have received training of more than one type. A small number of participants are designated as having received training but are missing a type of training; these individuals are included in the first column and the last column.
Tables II-13 to II-21
These tables show the services received by exiters identified by the column headings. Most numbers shown are the percentages within the column heading. Exceptions include the number of exiters and trainees, and the average weeks of participation and of training. In calculating percentages, exiters with missing data on either the row or column heading are excluded.
Basic and individualized career services, and training services, are defined based on PIRL elements using the guidance provided in TEGL 10-16 Change 1 Attachment 7 Table A (also see Appendix B of this Data Book). Under “Individualized Career Services,” those shown as receiving an internship or work experience include those with a date in PIRL 1203, those receiving employment opportunities excluding transitional jobs (codes 1 or 2 on PIRL 1205), those receiving transitional jobs (coded 6 on PIRL element 1205, or 1 on PIRL 1211), and those receiving other work experience (coded 3, 4, 5, 7 on PIRL 1205).
Tabulations for the “Characteristics of Training (among trainees)” are calculated just for those who received training. Under “Type of Training,” note that a trainee could have received training of more than one type. “Occupation of Training” is coded based on the first two digits of the O*NET classification.
Tables II-13 & II-14
These tables show trends over time in the percentage (the first table) or raw counts (the second table) of exiters who received various services. Column headings are defined as for Tables II-1 & II-2. Note that some services identified through the PIRL did not have analogues or were not defined similarly in the WIASRD and, for this reason, tabulations of those receiving many basic or individualized career services are not shown for periods prior to the introduction of the PIRL.
Table II-16 Columns are defined as for Table II-4.
Table II-17 Columns are defined as for Table II-5.
Table II-18 Columns are defined as for Table II-6.

Appendix A
437 PY 2019 State Data Book
Table II-19 Columns are defined as for Table II-7.
Table II-20 Columns are as defined for Table II-8.
Table II-21 Columns are defined as for Table II-9.
Table II-22 Not tabulated at the state level.
Table II-23 This table shows services provided, by state. The column for “Number of Exiters” shows the count of exiters in the state. The remaining columns show the percentage within the state that received the service identified by the column (thus, unlike most other tables, this table presents row percentages, not column percentages). These values can be compared with the national values in the first row. Column headings are defined as for Tables II-10 & II-11.
The counts of exiters by state and the state’s distribution of exiters across the service categories may be affected by policies and practices regarding coenrollment, especially co-enrollment between the WIOA Adult and Wagner-Peyser programs. For example, states that coenroll many Wagner-Peyser participants in WIOA will show high counts of exiters relative to the state’s WIOA funding level and low percentages who received training.
Table II-24 Columns are defined as for Table II-12. As in Table II-23, this table presents row percentages. Percentages across a row may exceed 100 percent, because trainees may receive training of more than one type.
Tables II-25 to II-34
Most outcomes in these tables are calculated for exiters. The exception is WIOA Measurable Skills Gains, which is measured for participants.
The tables show each outcome for the most recent four quarters of exiters for whom the outcome data is available (with the exception of Tables II-25 and II-26, which show trends). Because the outcomes for exiters capture an exiter’s status at different periods after the exit date and due to the time lags in the measurement of employment and earnings (see Guide to the Reader), different rows are measured for different cohorts of exiters; that is, the most recent four-quarter cohort is different for each outcome measure. The footnotes clarify what the most recent four-quarter cohort is for each measure.
All outcomes are calculated within the group defined by the column. Most numbers shown are the percentages within the column. Exceptions are the median and average earnings. In calculating percentages, averages and medians, individuals with missing data on either the row or column heading are excluded.
The WIOA Core Performance Indicators and WIA outcome measuress were calculated using the official definitions of these outcomes, as described in TEGL 10-16 Change 1, especially Appendix 10 (for WIOA), and TEGL 17-05 (for WIA). For example, in calculating WIOA performance, exiters are excluded if they exited by virtue of being incarcerated or hospitalized, had received medical treatment expected to last longer than 90 days that precluded them from continuing services or entering employment, were deceased, or were reservists called to active duty for at least 90 days. See the TEGLs for additional information about the calculation of the WIOA and WIA measures.
“Types of Credentials Attained” is calculated among those with a credential attainment (as defined by TEGL 10-16 Change 1) and uses PIRL 1800, 1802, and 1804, with coding as follows: code 1=Secondary school diploma/equivalency; codes 2, 3=AA, AS, BA, BS or other degree; code 4=Postgraduate degree; codes 5, 6, 7=Occupational credential; code 8=Other credential.
“Types of Skill Gains” is calculated among those with a skill gain (as defined by TEGL 10-16 Change 1) and uses PIRL 1806, 1807, 1808, 1809, and 1810, to define the skill gain type (an entry in 1809 or 1810 defines other training or skill milestone). A participant could attain a skill gain of more than one type.
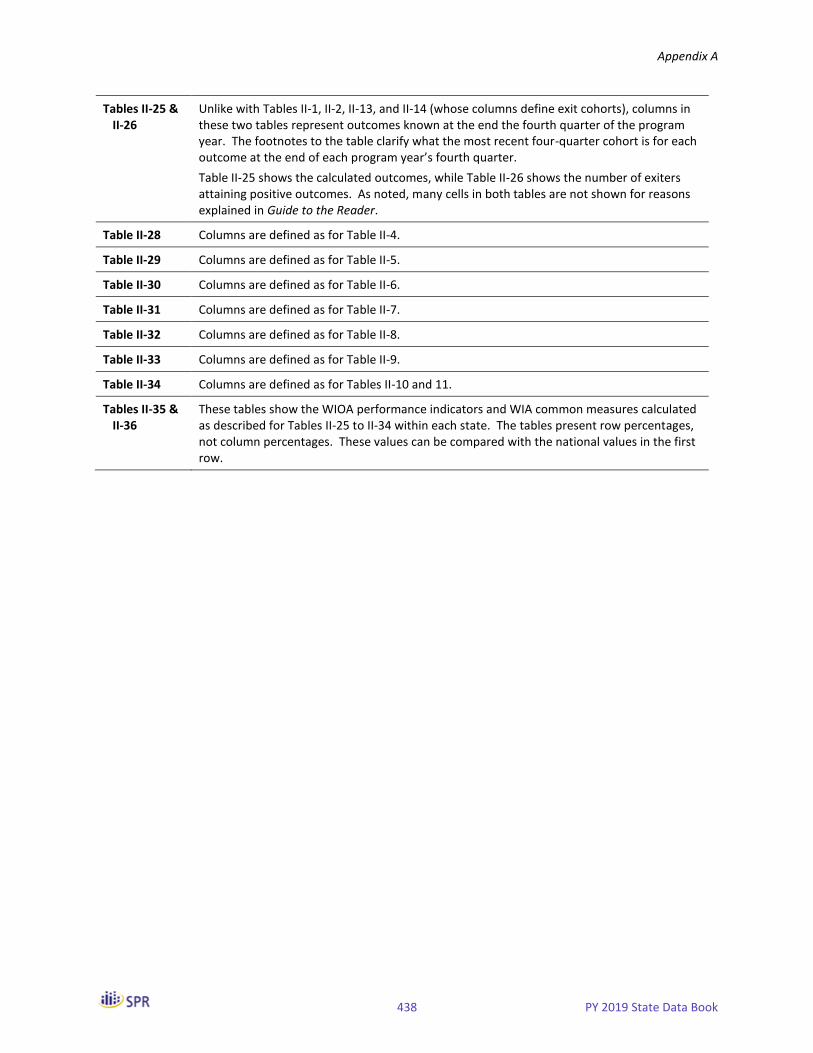
Appendix A
438 PY 2019 State Data Book
Tables II-25 & II-26
Unlike with Tables II-1, II-2, II-13, and II-14 (whose columns define exit cohorts), columns in these two tables represent outcomes known at the end the fourth quarter of the program year. The footnotes to the table clarify what the most recent four-quarter cohort is for each outcome at the end of each program year’s fourth quarter.
Table II-25 shows the calculated outcomes, while Table II-26 shows the number of exiters attaining positive outcomes. As noted, many cells in both tables are not shown for reasons explained in Guide to the Reader.
Table II-28 Columns are defined as for Table II-4.
Table II-29 Columns are defined as for Table II-5.
Table II-30 Columns are defined as for Table II-6.
Table II-31 Columns are defined as for Table II-7.
Table II-32 Columns are defined as for Table II-8.
Table II-33 Columns are defined as for Table II-9.
Table II-34 Columns are defined as for Tables II-10 and 11.
Tables II-35 & II-36
These tables show the WIOA performance indicators and WIA common measures calculated as described for Tables II-25 to II-34 within each state. The tables present row percentages, not column percentages. These values can be compared with the national values in the first row.

Appendix A
439 PY 2019 State Data Book
Part III: Dislocated Worker Program
These tables present information for those in the WIOA Dislocated Worker program, including exiters from local and statewide programs. Dislocated Workers served by local and statewide programs are defined as PIRL 904 (coded as 1, 2, or 3). DWGs as defined by PIRL 932 (coded as 1) who are coenrolled are included. Individuals served only by rapid response are excluded, except those classified as receiving rapid response additional assistance (PIRL 909). Results show, in turn, the characteristics and services of exiters, and the outcomes of exiters or participants, as applicable.
Tables III-1 & III-2
These tables show trends over time in the percentage (Table III-1) or raw counts (Table III-2) of exiters with various characteristics. Columns denoting each program year tabulate results for the most recent four quarters of exiters known at the end of the program year. Because there is one-quarter lag before a person’s exit date is known, the exit cohorts for these columns represent those who exited from April 1 of each program year to March 31 of the following year.
In data drawn from the WIASRD, whether a participant was a single parent was only reported for those who received intensive or training services, and not those who received only staff-assisted core services (according to the WIASRD, the latter group made up approximately 53 percent of all Dislocated Worker exiters who received staff-assisted services). For this reason as well, the trends in percentages (Table II-1) for exiters who are single parents can be misleading; counts (Table II-2) for years prior to the introduction of the PIRL are not shown for this element. Other characteristics reported in the PIRL (public assistance recipient, long-term unemployed, exhausting TANF within two years, homeless, ex-offenders, basic skills deficient, and facing cultural barriers) were not required reporting elements for Dislocated Worker program participants in the WIASRD and are not shown for prior years. Finally, note that Table III-2 presents counts of those with non-missing data; there is some missing data on most items, so counts are to some degree under-estimates.
Table III-1 & III-3 to III-13
See the notes to Tables II-1 & Tables II-3 to II-12, except that the Adult program priority groups do not apply to the Dislocated Worker program.
Table III-5 Columns are defined as for Table II-4.
Table III-6 Columns are defined as for Table II-5.
Table III-7 Columns are defined as for Table II-6.
Table III-8 The Adult program priority groups do not apply to the Dislocated Worker program. Nonetheless, this table is structured similarly to Table II-7. Those identified as “Basic Skills/English Deficient” are either basic skills deficient (PIRL 804) or English-language learners (PIRL 803), or both; as explained in the TEGL 19-16, English-language learners are considered to be basic skills deficient. The columns are not mutually exclusive.
Table III-9 Columns are defined as for Table II-8.
Table III-10 Columns are defined as for Table II-9.
Table III-11 & III-12
See notes to Tables II-10 & II-11.
Table III-13 Columns are defined as for Table II-12.
Tables III-14 to III-23
See notes to Tables II-13 to II-21.

Appendix A
440 PY 2019 State Data Book
Tables III-14 & III-15
See notes to Tables II-13 & II-14.
Table III-18 Columns are defined as for Table II-4.
Table III-19 Columns are defined as for Table II-5.
Table III-20 Columns are defined as for Table II-6.
Table III-21 Columns are as defined for Table III-8.
Table III-22 Columns are defined as for Table II-8.
Table III-23 Columns are defined as for Table II-9.
Table III-24 Not tabulated at the state level.
Table III-25 See notes to Table II-23.
Table III-26 See notes to Table II-24.
Tables III-27 to III-36
See notes to Tables II-25 to II-34.
Tables III-27 & III-28
See notes to Table II-25 & II-26.
Table III-31 Columns are defined as for Table II-4.
Table III-32 Columns are defined as for Table II-5.
Table III-33 Columns are defined as for Table II-6.
Table III-34 Columns are defined as for Table III-8.
Table III-35 Columns are defined as for Table II-8.
Table III-36 Columns are defined as for Table II-9.
Table III-37 Columns are defined as for Tables II-10 and 11.
Tables III-38 & III-39
See notes for Table II-35 & II-36.

Appendix A
441 PY 2019 State Data Book
Part IV: National Dislocated Worker Grant Program
These tables present information for those in the Dislocated Worker Grant program, defined as PIRL 932 (code 1). Results show, in turn, the characteristics and services of exiters, and the outcomes of exiters or participants, as applicable.
Tables IV-1 & IV-2
These tables show a comparison of nation to state by DWG type in the percentage (Table IV-1) or raw counts (Table IV-2) of exiters with various characteristics. The columns are defined based on PIRL 2004 where Disaster Recovery is codes 1,2,3 and Economic Recovery is code 0 or blank. Columns tabulate results for the most recent four quarters of exiters known at the end of the program year. Because there is one-quarter lag before a person’s exit date is known, the exit cohort for these columns represent those who exited from April 1 of the program year to March 31 of the following year.
Table IV-2 presents counts of those with non-missing data; there is some missing data on most items, so counts are to some degree under-estimates.
Tables IV-1 & IV-3 to IV-5
See notes to Table II-1 & Tables II-3 to II-12.
Table IV-3 & IV-4
See notes to Tables II-10 & II-11.
Table IV-5 See notes to Table II-12.
Tables IV-6 & IV-7
These tables show a comparison of nation to state by DWG type in the percentage (Table IV-6) or raw counts (Table IV-7) of exiters who received various services. Column headings are defined as for Tables IV-1 and IV-2.
Tables IV-8 to IV-14
Not tabulated at the state level.
Table IV-15 See notes to Table II-23.
Table IV-16 See notes to Table II-24.
Tables IV-17 & IV-18
See notes to Tables II-25 & II-26.
Table IV-19 to IV 25
Not tabulated at the state level.
Table IV-26 Columns are defined as for Tables II-10 and II-11.
Tables IV-27 & IV-28
See notes for Tables II-35 & II-36.
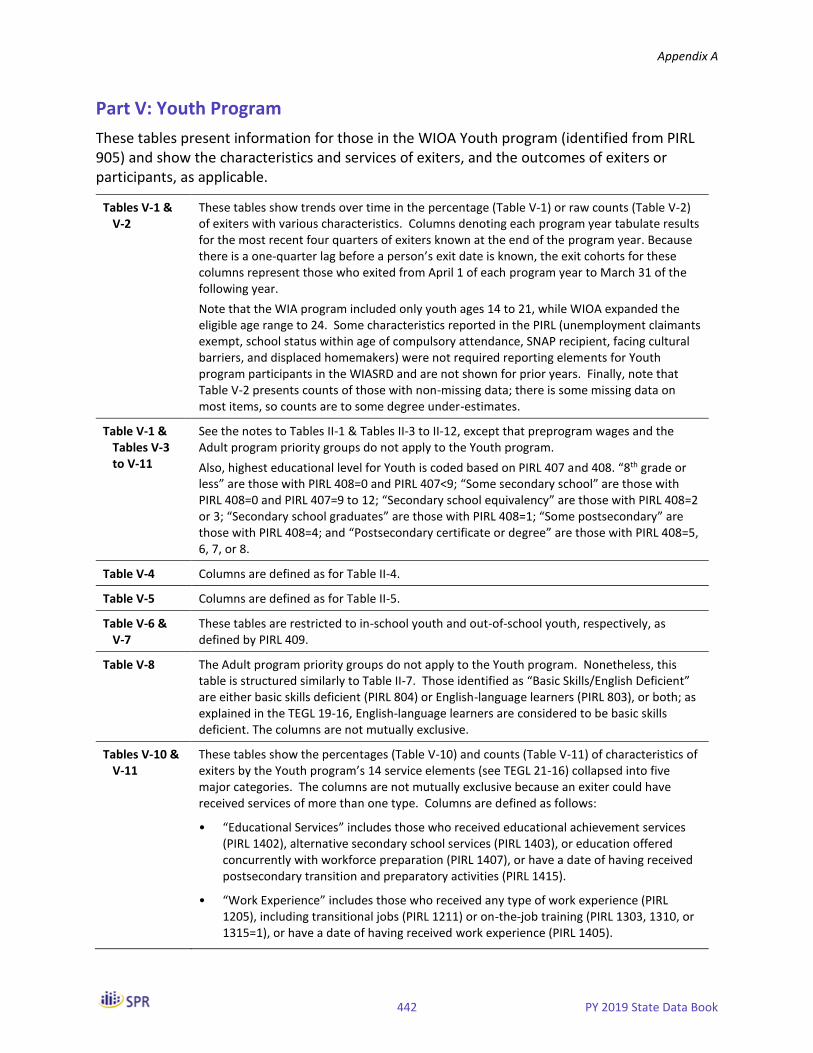
Appendix A
442 PY 2019 State Data Book
Part V: Youth Program
These tables present information for those in the WIOA Youth program (identified from PIRL 905) and show the characteristics and services of exiters, and the outcomes of exiters or participants, as applicable.
Tables V-1 & V-2
These tables show trends over time in the percentage (Table V-1) or raw counts (Table V-2) of exiters with various characteristics. Columns denoting each program year tabulate results for the most recent four quarters of exiters known at the end of the program year. Because there is a one-quarter lag before a person’s exit date is known, the exit cohorts for these columns represent those who exited from April 1 of each program year to March 31 of the following year.
Note that the WIA program included only youth ages 14 to 21, while WIOA expanded the eligible age range to 24. Some characteristics reported in the PIRL (unemployment claimants exempt, school status within age of compulsory attendance, SNAP recipient, facing cultural barriers, and displaced homemakers) were not required reporting elements for Youth program participants in the WIASRD and are not shown for prior years. Finally, note that Table V-2 presents counts of those with non-missing data; there is some missing data on most items, so counts are to some degree under-estimates.
Table V-1 & Tables V-3 to V-11
See the notes to Tables II-1 & Tables II-3 to II-12, except that preprogram wages and the Adult program priority groups do not apply to the Youth program.
Also, highest educational level for Youth is coded based on PIRL 407 and 408. “8th grade or less” are those with PIRL 408=0 and PIRL 407<9; “Some secondary school” are those with PIRL 408=0 and PIRL 407=9 to 12; “Secondary school equivalency” are those with PIRL 408=2 or 3; “Secondary school graduates” are those with PIRL 408=1; “Some postsecondary” are those with PIRL 408=4; and “Postsecondary certificate or degree” are those with PIRL 408=5, 6, 7, or 8.
Table V-4 Columns are defined as for Table II-4.
Table V-5 Columns are defined as for Table II-5.
Table V-6 & V-7
These tables are restricted to in-school youth and out-of-school youth, respectively, as defined by PIRL 409.
Table V-8 The Adult program priority groups do not apply to the Youth program. Nonetheless, this table is structured similarly to Table II-7. Those identified as “Basic Skills/English Deficient” are either basic skills deficient (PIRL 804) or English-language learners (PIRL 803), or both; as explained in the TEGL 19-16, English-language learners are considered to be basic skills deficient. The columns are not mutually exclusive.
Tables V-10 & V-11
These tables show the percentages (Table V-10) and counts (Table V-11) of characteristics of exiters by the Youth program’s 14 service elements (see TEGL 21-16) collapsed into five major categories. The columns are not mutually exclusive because an exiter could have received services of more than one type. Columns are defined as follows:
• “Educational Services” includes those who received educational achievement services (PIRL 1402), alternative secondary school services (PIRL 1403), or education offered concurrently with workforce preparation (PIRL 1407), or have a date of having received postsecondary transition and preparatory activities (PIRL 1415).
• “Work Experience” includes those who received any type of work experience (PIRL 1205), including transitional jobs (PIRL 1211) or on-the-job training (PIRL 1303, 1310, or 1315=1), or have a date of having received work experience (PIRL 1405).
Appendix A
443 PY 2019 State Data Book
• “Guidance and Counseling” includes those who received comprehensive guidance and counseling (PIRL 1411), leadership development (PIRL1408), adult mentoring (PIRL 1410), financial literacy (PIRL 1206), labor market and employment information (PIRL 1414), or youth follow-up services (PIRL 1412).
• “Training” includes those who received skill upgrading, entrepreneurial training, ABE/ESL contextualized training, customized training, other occupational skills training, prerequisite training, registered apprenticeships, youth occupational skills training, or other non-occupational skills training (PIRL 1303, 1310, or 1315=2, 3, 4, 5, 6, 8, 9, 10, 11,12 ), or with a date for having received youth entrepreneurial skills training (PIRL 1413).
• “Supportive Services” are denoted by PIRL 1409.
A small number of youth exiters have an exit data but none of these services.
Tables V-12 to V-20
These tables show the services received by exiters identified by the column headings. Most numbers shown are the percentages within the column heading. Exceptions include the number of exiters and trainees, and the average weeks of participation and of training. In calculating percentages, exiters with missing data on either the row or column heading are excluded.
Services under Youth Program Elements represent the 14 services as defined by WIOA law and described in TEGL 21-16. These services are defined through the PIRL as follows:
Tutoring, study skills, dropout prevention: PIRL 1402
Alternative school and dropout recovery: PIRL 1403
Paid and unpaid work experiences: PIRL 1205, 1211, or 1405; or 1303, 1310, or 1315 (code 1)
Occupational skills training: PIRL 1303, 1310, or 1315 (codes 2, 4, 5, 6, 8, 9, or 10)
Education offered concurrently: PIRL 1407
Leadership development opportunities: PIRL 1408
Supportive services: PIRL 1409
Adult mentoring: PIRL 1410
Follow-up services: PIRL 1412
Comprehensive guidance and counseling: PIRL 1411
Financial literacy education: PIRL 1206
Entrepreneurial skills training: PIRL 1413, or PIRL 1303, 1310, or 1315 (code 3)
Labor market information: PIRL 1414
Postsecondary preparation and transition: PIRL 1415
Note that follow-up services is only included as a row in the trends tables (Tables V-12 and V-13), and only for prior program years, because the incidence of follow-up services cannot be known until one year after a youth has exited.
Tabulations for the “Types of Work Experience (among those with work experience)” are calculated just for those who received paid or unpaid work experiences, as defined above; types are drawn from PIRL elements 1205, 1211, and 1303, 1310, or 1315 (code 1).
Tabulations for the “Characteristics of Training (among trainees)” are calculated just for those who received training (denoted under “Other Youth Activities” as “Received training,” defined by PIRL 1300). Under “Type of Training,” note that a trainee could have received training of more than one type. “Occupation of Training” is coded based on the first two digits of the O*NET classification.
Appendix A
444 PY 2019 State Data Book
Tables V-12 & V-13
These tables show trends over time in the percentage (the first table) or raw counts (the second table) of exiters who received various services. Column headings are defined as for Tables II-1 & II-2. All columns include four quarters of exiters. Note that some services identified through the PIRL did not have analogues in the WIASRD and, for this reason, tabulations of those receiving some services are not shown for periods prior to the introduction of the PIRL.
Table V-15 Columns are defined as for Table II-4.
Table V-16 Columns are defined as for Table II-5.
Table V-17 & V-18
Columns are defined as for Table V-6 & V-7.
Table V-19 Columns are as defined for Table V-8.
Table V-21 This table shows services provided, by state. The column for Number of Exiters shows the count of exiters in the state. The remaining columns show the percentage within the state that received the service identified by the column (thus, unlike most other tables, this table presents row percentages, not column percentages). These values can be compared with the national values in the first row. Columns are defined as for Table V-10 & V-11.
Tables V-22 to V-31
See notes to Tables II-25 to II-34.
Tables V-22 & V-23
See notes to Tables II-25 & II-26. Many cells in both tables are not shown for reasons explained in Guide to the Reader.
Table V-25 Columns are defined as for Table II-4.
Table V-26 Columns are defined as for Table II-5.
Tables V-27 & V-28
Columns are defined as for Table V-6 & V-7.
Table V-29 Columns are defined as for Table V-8.
Table V-31 Columns are defined as for Table V-10 & V-11.

Appendix A
445 PY 2019 State Data Book
Part VI: Wagner-Peyser Program
These tables present information for those in the Wagner-Peyser Program (identified from PIRL 918) and show the characteristics and services of exiters, and the outcomes of exiters or participants, as applicable.
Tables VI-1 & VI-2
These tables show trends over time in the percentage (Table VI-1) or raw counts (Table VI-2) of exiters with various characteristics. Columns denoting each program year tabulate results for the most recent four quarters of exiters known at the end of the program year. Because there is one-quarter lag before a person’s exit date is known, the exit cohorts for these columns represent those who exited from April 1 of each program year to March 31 of the following year.
Finally, note that Table VI-2 presents counts of those with non-missing data; there is some missing data on most items, so counts are to some degree under-estimates (see Table II-4 for selected information on the extent of missing data, and notes to Table VI-1 & Tables VI-3 to VI-12, below, for additional information on the definition of exiter characteristics).
Table VI-1 & Tables VI-3 to VI-12
These tables show the percentage of exiters identified by the column heading with various characteristics. All numbers are percentages except the number of exiters (shown in the first row) and average preprogram earnings.
Age is calculated as the difference between the year of program entry and the year of birth. If the month/day in the year of program entry is before the month/day of the year of birth, then one year is subtracted from the difference.
The category of “Employment Status” that is labelled “Not employed or with layoff notice” includes those employed but with a layoff notice, not in the labor force, or unemployed (PIRL 400 codes 0, 2, or 3).
“Highest educational level” is coded based on PIRL 408. Most row entries are straightforward representations of the PIRL element, but note that code 0=No educational level; codes 2,3=Secondary school equivalency; and codes 7,8=Bachelor’s Degree or higher.
Preprogram quarterly earnings represents the average (mean) earnings in the second quarter (PIRL 1700) and third quarter (PIRL 1701) prior to the quarter of program entry (based on PIRL 900). Those with zero earnings in one quarter but not the other are included in the average, and their average is calculated including the zero value; however, an exiter with zero earnings in both quarters is excluded from the average. In the tables showing trends over time, averages are shown in nominal dollars (that is, without an adjustment for inflation).
The percentage who are English language learners is calculated after excluding exiters in Puerto Rico.
In calculating percentages, exiters with missing data on either the row or column heading are generally excluded. An exception is for ethnicity and race. The ethnicity and various race categories are separate data elements in the PIRL, coded 1 for yes, 0 for no, and 9 for did not self-identify. A large number of records are coded as blank or code 9 on one or more of these variables but not all of them (see Table I-4 in the Data Book). For this reason, if a person was coded as being of a certain race, but had missing data on ethnicity or one or more of the remaining race categories (that is, neither a 1 nor a 0), the missing value was recoded to 0. The race categories are not mutually exclusive with each other or with Hispanic ethnicity; a person could be identified as belonging to more than one race, and may also be identified by each of their race groups and as of Hispanic ethnicity.
Note that the row for SSI or SSDI includes Ticket Holders (see PIRL 602).
Appendix A
446 PY 2019 State Data Book
Table VI-4 In the “Ethnicity” and “Race” columns, exiters coded as “Not Hispanic” are those coded as 0 on PIRL 210 or those missing or coded as 9 on this element but who are of at least one race category. Exiters coded as “White Only” or “Black Only” are coded as 1 on PIRL 215 and 213, respectively, and are not also of any other race; however, they may be of Hispanic ethnicity. Those included in the “Other Race” column could be of any race other than white or black, or could be white or black in combination with any other race.
Table VI-5 In the “Employment Status” columns, the “Not Employed” column includes those employed but with a notice of layoff, not in the labor force, and unemployed.
Table VI-6 In the “Unemployment Compensation Status” columns, the “Claimant” column includes exiters referred or not by RESEA or WPRS, and claimants exempt from work search.
Table VI-7 Columns are veterans, disabled veterans, those receiving SSI/SSDI public assistance, low income individuals, and those who are basic skills deficient. Those identified as “Basic Skills/English Deficient” are either basic skills deficient (PIRL 804) or English-language learners (PIRL 803), or both; as explained in TEGL 19-16, English-language learners count as basic skills deficient under the basic skills deficient priority category. The columns are not mutually exclusive.
Table VI-8 The columns are defined based on PIRL 408. Values on this element are mapped to the columns as follows: code 0= No Level Completed; codes 1, 2, 3=HS Graduate or Equivalent; code 4=Some Postsecondary; code 5=Technical or Vocational Certificate; and codes 6, 7, or 8=Postsecondary Degree.
Table VI-9 The “School Status” columns are defined based on PIRL 409. Values on this element are mapped to the columns as follows: codes 1,2,3=Attending; codes 4,5,6=Not Attending.
Table VI-10 & VI-11
These tables show the percentages (Table VI-10) and counts (Table VI-11) of characteristics of exiters by major service categories. The columns are defined based on PIRL elements using the guidance provided in TEGL 10-16 Change 1 Attachment 7 Table A. The columns are not mutually exclusive, because an exiter could have received any combination of basic career services, individualized career services, or training. The “Only Career Services” column includes those who received either basic career services or individualized career services (or both), but who did not also receive training. Those in the “Received Training” column (PIRL 1300=1) could also have received career services. Note that, consistent with TEGL 19-16, those who only receive self-services or informational services are not considered participants and, therefore, are not included in the tables in this section. A small number of exiters have an exit date but have no identifiable service. These individuals are included in the count of “All Exiters,” but are not included in any of the subsequent columns.
Appendix A
447 PY 2019 State Data Book
Tables VI-12 to VI-21
These tables show the services received by exiters identified by the column headings. Most numbers shown are the percentages within the column heading. Exceptions include the number of exiters and the average weeks of participation. In calculating percentages, exiters with missing data on either the row or column heading are excluded.
Basic and individualized career services, and training services, are defined based on PIRL elements using the guidance provided in TEGL 10-16 Change 1 Attachment 7 Table A (also see Appendix B of this Data Book). Under “Individualized Career Services,” those shown as receiving an internship or work experience include those with a date in PIRL 1203, those receiving employment opportunities excluding transitional jobs (codes 1 or 2 on PIRL 1205), those receiving transitional jobs (code 6 on PIRL element 1205, or 1 on PIRL 1211), and those receiving other work experience (codes 3, 4, 5, 7 on PIRL 1205). “Other individualized services” represent participants who had a date of first individualized career service (PIRL 1200) but received none of the services listed in the tables.
“Received any training” is based on PIRL 1300, which is not currently a required reporting item for Wagner-Peyser. The percentages shown are based on all Wagner-Peyser exiters, however, only those co-enrolled in WIOA programs have reported receipt of training.
Tables VI-12 & VI-13
These tables show trends over time in the percentage (the first table) or raw counts (the second table) of exiters who received various services. Column headings are defined as for Tables VI-1 & VI-2. All columns include four quarters of exiters. Columns prior to PY 2016 are not shown because the WIASRD included only Wagner-Peyser participants who were co-enrolled in WIOA programs and trends would, therefore, be misleading.
Table VI-15 Columns are defined as for Table VI-4.
Table VI-16 Columns are defined as for Table VI-5.
Table VI-17 Columns are defined as for Table VI-6.
Table VI-18 Columns are defined as for Table VI-7.
Table VI-19 Columns are as defined for Table VI-8.
Table VI-20 Columns are defined as for Table VI-9.
Table VI-21 This table shows services provided, by state. The column for Number of Exiters shows the count of exiters in the state. The remaining columns show the percentage within the state that received the service identified by the column (thus, unlike most other tables, this table presents row percentages, not column percentages). These values can be compared with the national values in the first row. Column headings are defined as for Tables VI-10 & VI-11.
The counts of exiters by state and the state’s distribution of exiters across the service categories may be affected by policies and practices regarding coenrollment, especially co-enrollment between the WIOA Adult and Wagner-Peyser programs. For example, in states that coenroll most or all WIOA participants in Wagner-Peyser, exit counts may be somewhat larger relative to Wagner-Peyser funding and the percent receiving training higher than in other states.
Tables VI-22 to VI-33
See notes to Tables II-25 to II-34.
Tables VI-22 & VI-23
See notes to Tables II-25 & II-26.
Table VI-25 Columns are defined as for Table VI-4.
Table VI-26 Columns are defined as for Table VI-5.

Appendix A
448 PY 2019 State Data Book
Table VI-27 Columns are defined as for Table VI-6.
Table VI-28 Columns are defined as for Table VI-7.
Table VI-29 Columns are defined as for Table VI-8.
Table VI-30 Columns are defined as for Table VI-9.
Table VI-31 Columns are defined as for Tables VI-10 and 11.
Tables VI-32 & VI-33
These tables show the WIOA performance indicators and WIA common measures calculated as described for Tables VI-22 to VI-31 within each state. The tables present row percentages, not column percentages. These values can be compared with the national values in the first row.

Appendix B
449 PY 2019 State Data Book
Appendix B: Cross-reference to PIRL Elements
This appendix denotes the PIRL element from which row categories for the table shells are drawn. Note that not all row categories are applicable for participants of each of the programs. For the definition of each PIRL element, their codes, and the programs to which each PIRL element applies, see the DOL-only specifications of the PIRL, available at: https://www.doleta.gov/ performance/reporting/ (the specifications for the PIRL on which this Data Book is based were downloaded on February 13, 2018).
Row Item PIRL Element
Characteristics of Exiters
Age 200 and 900 (see notes to Tables II-1 & II-3 to II-12 in Appendix A) Gender 201 Hispanic Ethnicity 210 (see notes to Tables II-1 & II-3 to II-12 in Appendix A) Race 211-215 (see notes to Tables II-1 & II-3 to II-12 in Appendix A) Employment Status 400 Veteran Status
Veterans 300 Disabled veterans 303 (not applicable for Youth before 7/1/2018) Homeless veterans 308 (only Wagner-Peyser) With other significant barrier 311 (only Wagner-Peyser)
Other eligible persons 301 (code 3) Active duty military spouses 316 (not applicable before 7/1/2018) Attended TAP workshop in 3 prior years 307 (Wagner-Peyser veterans or TSM only; not applicable before
7/1/2018) Unemployment Compensation Status 401 Highest Educational Level 408 (see notes to Tables II-1 & Tables II-3 to II-12 in Appendix A) School Attendance 409 School Status at Program Entry 409 (only Youth) Preprogram Quarterly Earnings 1700 and 1701 (see notes to Tables II-1 & Tables II-3 to II-12 in
Appendix A) Public Assistance Information
Any public assistance 600, 602, 603, 604 for Adults 600, 603 for Dislocated Workers; 602, 604 after 6/30/2018 600, 602, 603, 604 for Youth (not applicable for DWG and Wagner-Peyser)
TANF 600 (except Wagner-Peyser) SSI or SSDI 602 (not applicable for Dislocated Workers before 7/1/2018; not
applicable for DWG); includes Ticket Holders SNAP 603 (not applicable for DWG and Wagner-Peyser) Other public assistance 604 (not applicable for Dislocated Workers before 7/1/2018; not
applicable for DWG) Farmworker Designation 413 (only Wagner-Peyser) Other Characteristics
Any Adult Program priority group 300, 600, 802, 803, and 804 (see notes to Tables II-7 in Appendix A) (only Adults)
Individuals with a disability 202 Long-term unemployed 402 (not applicable for Youth before 7/1/2018)

Appendix B
450 PY 2019 State Data Book
Row Item PIRL Element
Exhausting TANF within 2 years 601 (not applicable for Youth and Wagner-Peyser before 7/1/2018)
Homeless individuals or runaway youth 800 Ex-offenders 801 (not applicable for Wagner-Peyser before 7/1/2018) Low income 802 English language learners 803 Basic skills deficient 804 Facing substantial cultural barrier 805 Single parents 806 Displaced homemakers 807 Pregnant or parenting youth 701 (Youth only) Youth who need additional assistance 702 (Youth only) Foster care youth 704 (Youth only)
Services
Any coenrollment Any of the codes below applicable for each program WIOA Adult 903 WIOA Dislocated Worker 904 WIOA Youth 905 Wagner-Peyser 918 Vocational Rehabilitation 917 Adult Education 910 WIOA National Farmworker Jobs 912 excludes unknown grant codes (not shown separately for
Youth) WIOA Indian and Native American 913 excludes unknown grant codes (not shown separately for
Youth) Veterans’ programs 914 Vocational Education 916 YouthBuild 919 (not applicable for Dislocated Workers and DWG) Senior Community Services 920 excludes unknown grant codes (not applicable for Youth) SNAP Employment and Training 921 (except for Dislocated Workers and DWGs; not shown
separately for Youth) Job Corps 911 (Youth only) Other partner programs 912, 913, 921 (for Youth)
908, 909, 922, 931, 932, 936, 937, 937 (for Wagner-Peyser) Homeless Veterans’ Reintegration Program (HVRP)
309 (Wagner-Peyser veterans only)
Basic Career Services (not applicable for Youth) Self-service or informational service 1000 or 1002 Any staff-assisted basic career service 1001 or 1103
Workforce information services 1103 Career guidance 1102 Staff-assisted job search 1104 Referred to employment 1105, 1108, 1109, 1110, 1111 Referred to Federal training 1106 or 1107 Assistance with UI 1112 Other basic services 1114, 1115 , or 1116
Individualized Career Services (not applicable for Youth) Any individualized career service 1200
IEP created 1202 Internships or work experience See notes to Tables II-13 to II-21 in Appendix A

Appendix B
451 PY 2019 State Data Book
Row Item PIRL Element
Financial literacy services 1206 English as a second language services 1207 Pre-vocational services 1210 (not applicable for Wagner-Peyser) Other individualized services 1200 but not 1202, 1206, 1207, 1210
Youth Program Elements (Youth only; see notes to Tables V-12 to V-20) Tutoring, study skills, dropout prevention 1402 Alternative school and dropout recovery 1403 Paid and unpaid work experiences 1205, 1211, or 1405; or 1303, 1310, 1315 (code 1) Occupational skills training 1303, 1310, 1315 (codes 2, 4, 5, 6, 8, 9, or 10) Education offered concurrently 1407 Leadership development opportunities 1408 Supportive services 1409 Adult mentoring 1410 Follow-up services 1412 Comprehensive guidance and counseling 1411 Financial literacy education 1206 Entrepreneurial skills training 1413, or 1303, 1310, or 1315 (code 3) Labor market information 1414 Postsecondary preparation and transition 1415
Other Youth Services Participanted in postsecondary education 1332 Received training 1300
Weeks Participated Weeks elapsed from 900 to 901 Other Assistance (not applicable for Youth)
Needs-related payments 1500 Supportive services 1409 Rapid response 908 (Dislocated Workers and DWGs only) Disaster relief employment 2004 (codes 1 and 2) (Dislocated Workers and DWGs only)
Other Reason for Exit 923 Characteristics of Training (not applicable for Wager-Peyser)
Received any training 1300 Number of trainees 1300 Type of training 1303, 1310, 1315 (not applicable for Youth) Completed training 1307, 1312, 1317 (at least one element is 1) ITA established 1319 Pell grant recipients 1320 Program(s) operated by the private sector 1333 (not applicable before 7/1/2018) Weeks of training Sum of weeks elapsed from 1302 to 1308, 1309 to 1313, and 1314
to 1318 Occupation of training 1306, 1311, and 1316 Types of Work Experience See notes to Tables V-12 to V-20 (Youth only)
Outcomes
WIOA Primary Indicators of Performance See notes to Tables II-25 to II-34 in Appendix A (for Adults, Dislocated Workers, and DWGs) or notes to Tables V-22 to V-31 (for Youth)
WIA Common Measures See notes to Tables II-25 to II-34 in Appendix A (not applicable for Youth)
Quarterly Employment Rate First quarter after exit 1600 Second quarter after exit 1602
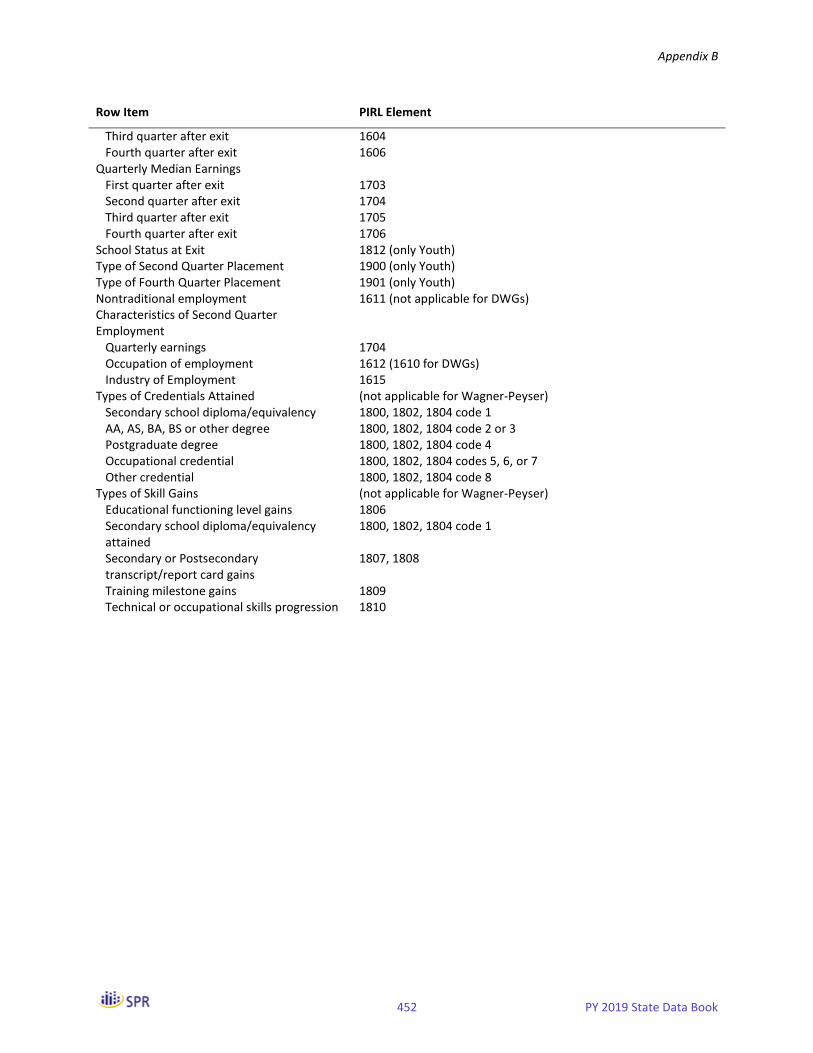
Appendix B
452 PY 2019 State Data Book
Row Item PIRL Element
Third quarter after exit 1604 Fourth quarter after exit 1606
Quarterly Median Earnings First quarter after exit 1703 Second quarter after exit 1704 Third quarter after exit 1705 Fourth quarter after exit 1706
School Status at Exit 1812 (only Youth) Type of Second Quarter Placement 1900 (only Youth) Type of Fourth Quarter Placement 1901 (only Youth) Nontraditional employment 1611 (not applicable for DWGs) Characteristics of Second Quarter Employment
Quarterly earnings 1704 Occupation of employment 1612 (1610 for DWGs) Industry of Employment 1615
Types of Credentials Attained (not applicable for Wagner-Peyser) Secondary school diploma/equivalency 1800, 1802, 1804 code 1 AA, AS, BA, BS or other degree 1800, 1802, 1804 code 2 or 3 Postgraduate degree 1800, 1802, 1804 code 4 Occupational credential 1800, 1802, 1804 codes 5, 6, or 7 Other credential 1800, 1802, 1804 code 8
Types of Skill Gains (not applicable for Wagner-Peyser) Educational functioning level gains 1806 Secondary school diploma/equivalency attained
1800, 1802, 1804 code 1
Secondary or Postsecondary transcript/report card gains
1807, 1808
Training milestone gains 1809 Technical or occupational skills progression 1810

Appendix C
453 PY 2019 State Data Book
Appendix C: Abbreviations
ABE Adult Basic Education
DOL U.S. Department of Labor
DWG Dislocated Worker Grants
ESL English as a second language
ETA Employment and Training Administration, U.S. Department of Labor
GED General educational development
IEP Individual employment plan
ITA Individual training account
PIRL WIOA Participant Individual Record Layout
PY Program year
SNAP Supplemental Nutrition Assistance Program
SSDI Social Security Disability Insurance
SSI Supplemental Security income
TANF Temporary Assistance to Needy Families
TEGL Training and Employment Guidance Letter
UI Unemployment Insurance
WIA Workforce Investment Act of 1998
WIASRD Workforce Investment Act Standardized Record Data
WIOA Workforce Investment and Opportunity Act