Embed Size (px)
DESCRIPTION
pressure volume temp
Citation preview
PVTPressure Volume
Temperature
1
Dr. Mohammed Abdalla Ayoub
Reservoir Engineering I
PCB2023
Lesson’s Outcomes
To describe various tests under PVT study
To relate oil physical properties generated from
PVT study for MBE applications
To determine gas physical properties from PVT
study
8/17/2015 2
PVT - Scope
Reservoir fluid analysis provides key data to
the petroleum engineer.
Quality of the testing is important to ensure
realistic values used in design.
Sample quality is the first quality issue.
8/17/2015 3
PVT Analysis
Provides data for field evaluation and design
Reservoir calculations
Well flow calculations
Surface facilities
8/17/2015 4
PVT Analysis
Correlation between pressure and volume at
reservoir temperature.
Various physical constants in reservoir calculations;
viscosity, density, compressibility.
Effect of separator conditions on Bo & GOR. etc.
Chemical composition of the volatile components.
8/17/2015 5
PVT Analysis Scope of the analysis depends on the nature of the fluid.
Dry gas:
composition, specific gravity, Bg, z, and viscosity
Wet gas:
as above plus information on liquid drop out, quantities andcompositions.
Oil system:
Bubble point pressure, composition of reservoir and producedfluids, Bo, GOR, Bt and viscosity. All as function of pressure. Co.
Below Pb considerations.
8/17/2015 6
PVT Analysis
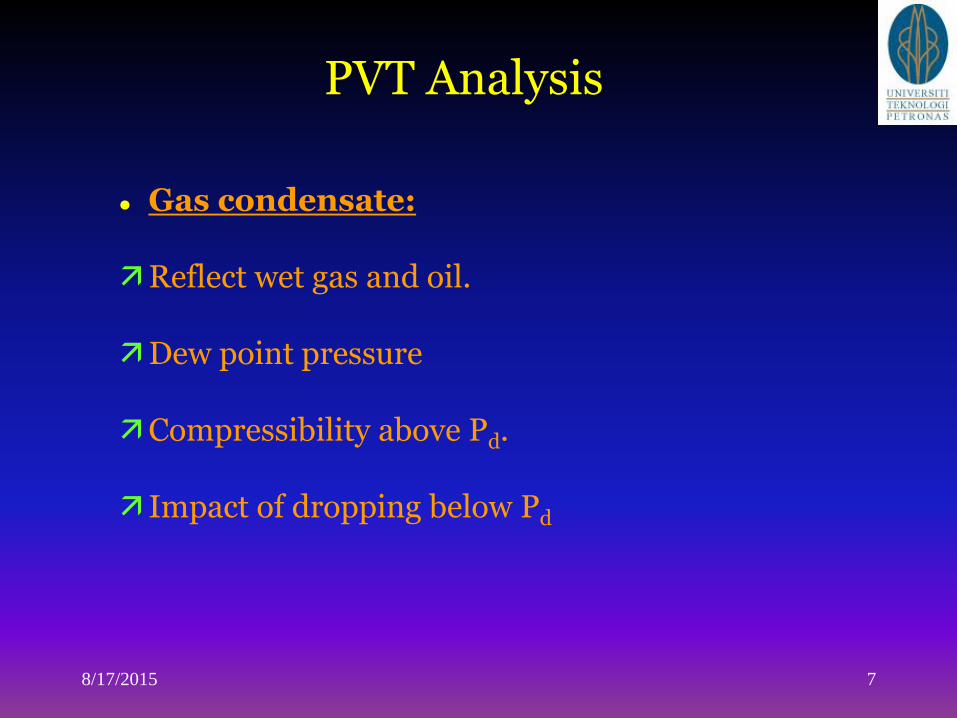
Gas condensate:
Reflect wet gas and oil.
Dew point pressure
Compressibility above Pd.
Impact of dropping below Pd
8/17/2015 7
Sampling
Clearly the sample has to be representative of
the reservoir contents or the drainage area.
Desirable to take samples early in the life of
the reservoir.
Either sub-surface or surface sampling.
8/17/2015 8
Surface Sampling
Samples of oil and gas taken from separator
connected with the well.
Fluids recombined in the laboratory on the basis
of the produced GOR.
8/17/2015 9
Sub-Surface Sampling
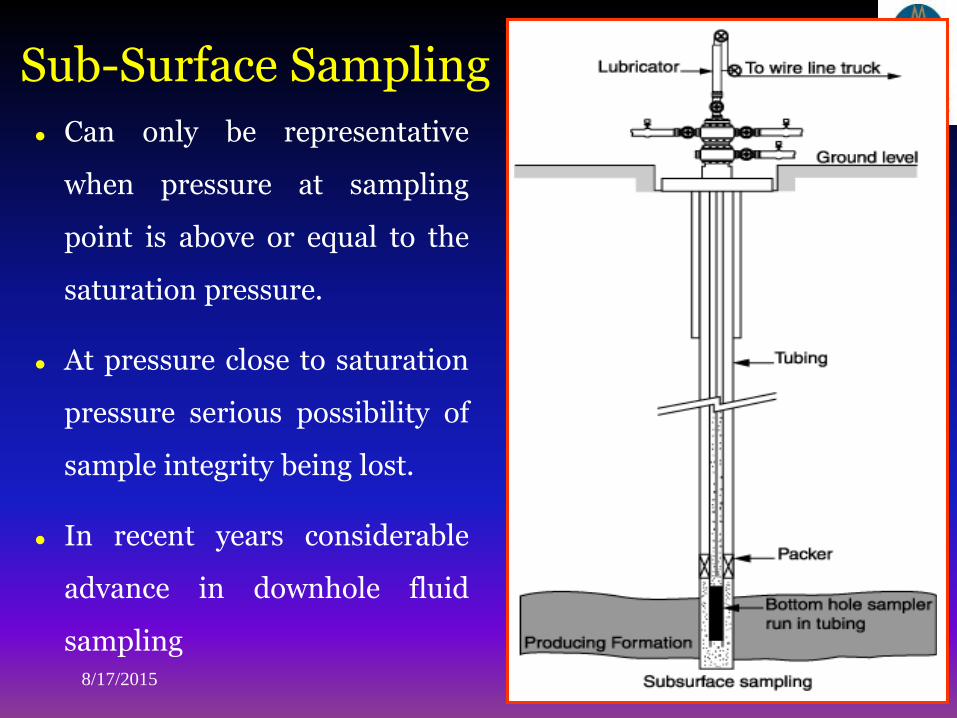
Can only be representative
when pressure at sampling
point is above or equal to the
saturation pressure.
At pressure close to saturation
pressure serious possibility of
sample integrity being lost.
In recent years considerable
advance in downhole fluid
sampling8/17/2015 10
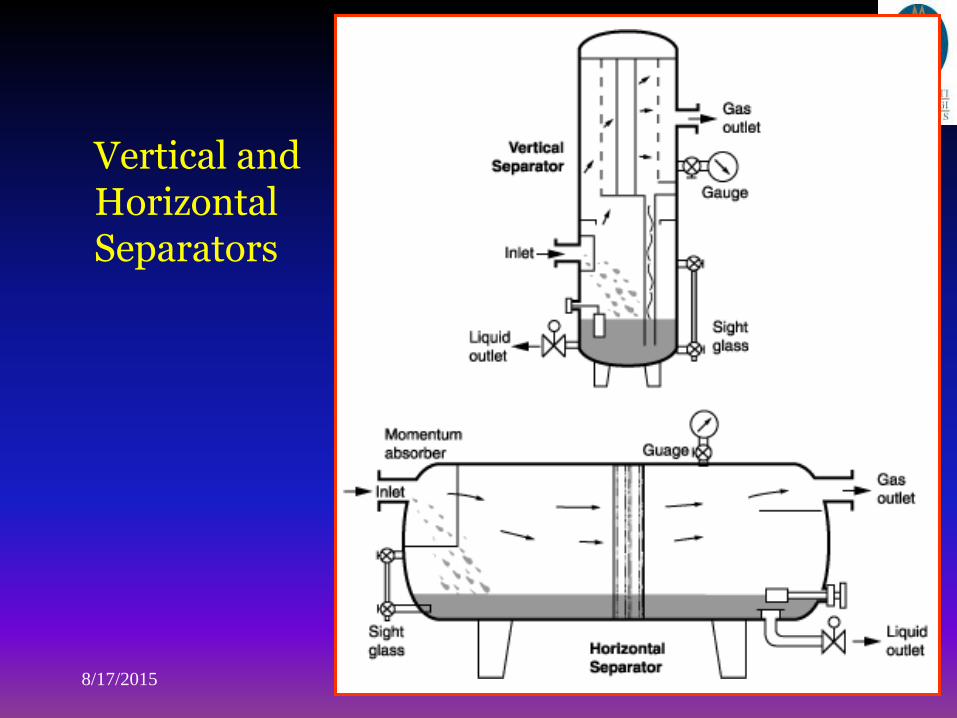
Vertical and Horizontal Separators
8/17/2015 11
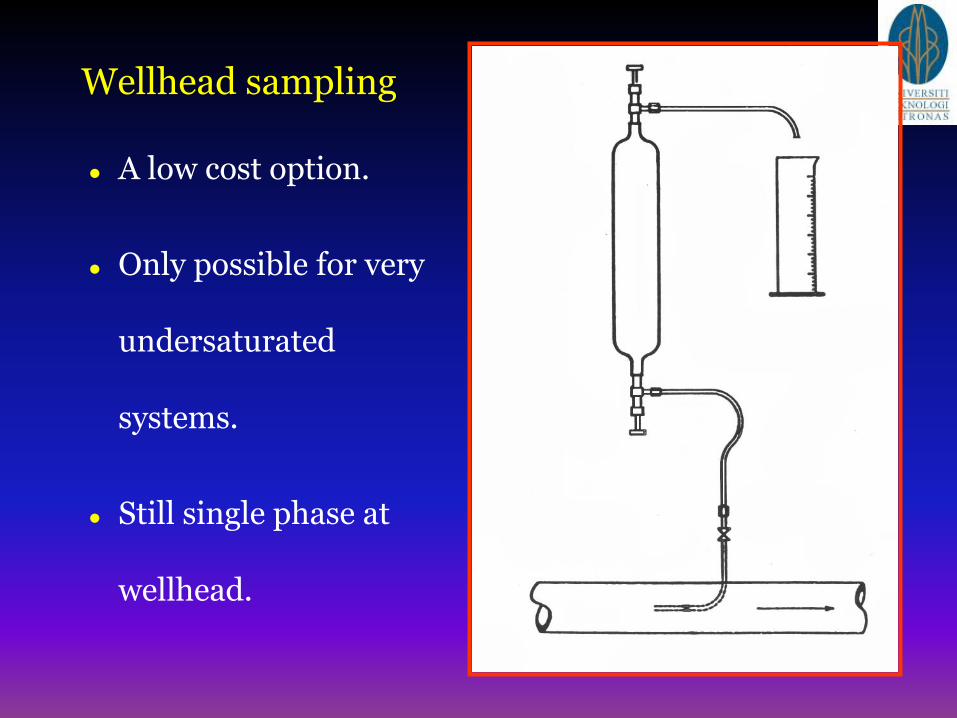
Wellhead sampling
A low cost option.
Only possible for very
undersaturated
systems.
Still single phase at
wellhead.
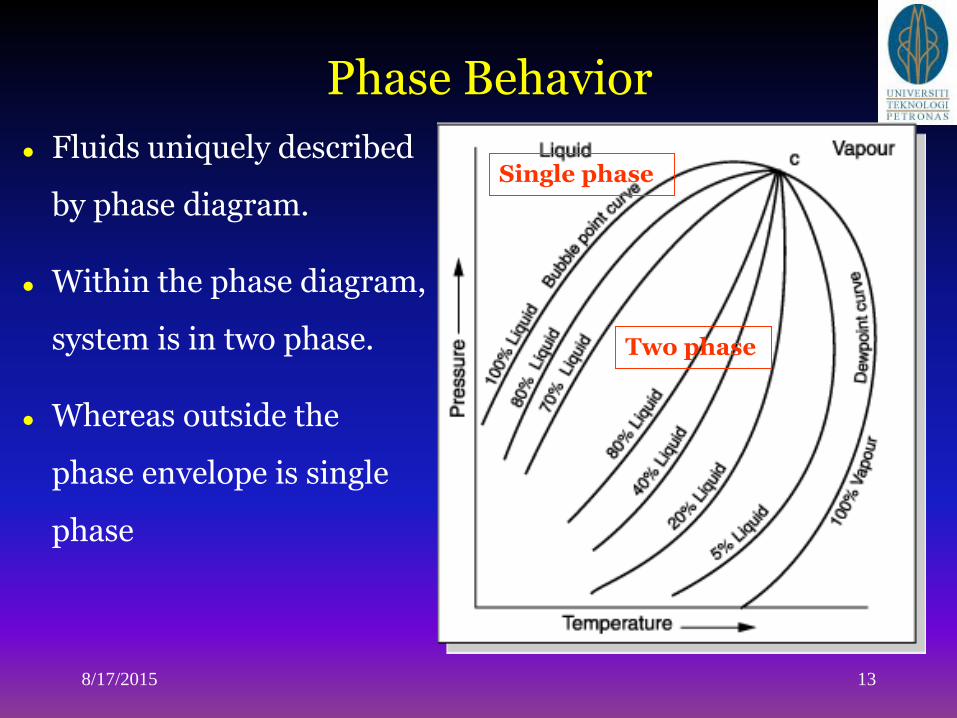
Phase Behavior
Fluids uniquely described
by phase diagram.
Within the phase diagram,
system is in two phase.
Whereas outside the
phase envelope is single
phase
8/17/2015 13
Single phase
Two phase
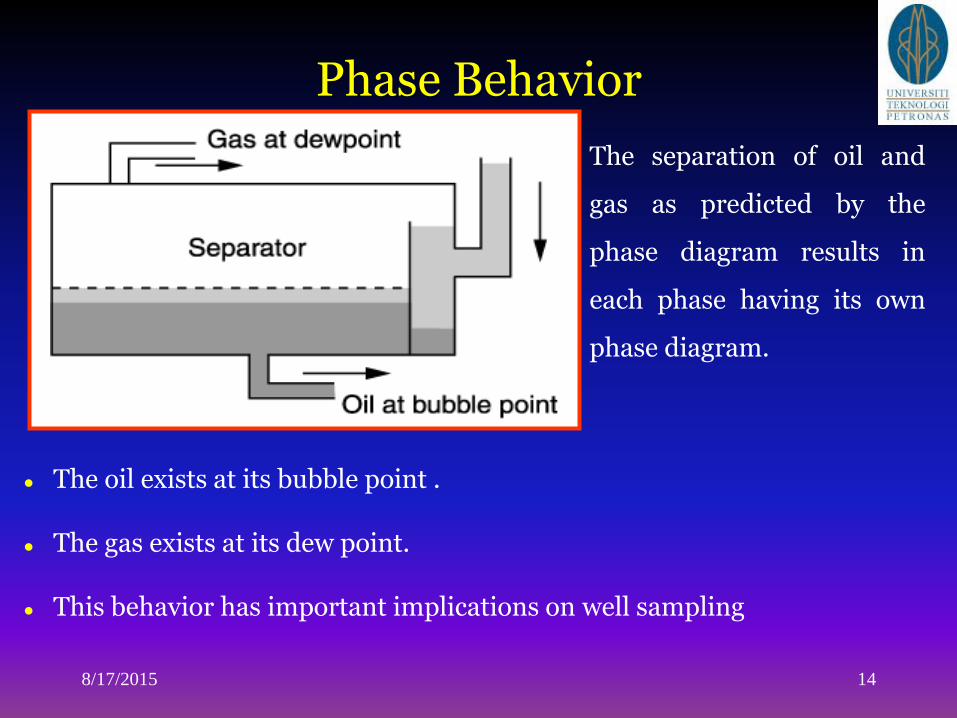
Phase Behavior
The oil exists at its bubble point .
The gas exists at its dew point.
This behavior has important implications on well sampling
8/17/2015 14
The separation of oil and
gas as predicted by the
phase diagram results in
each phase having its own
phase diagram.
Equipment for PVT Analysis
Apparatus for transfer and recombination of
separator oil and gas samples.
Apparatus for measuring gas and liquid volumes.
Apparatus for performing separator tests.
PVT cell and displacing pumps.
High pressure viscometer.
Gas chromatograph or equivalent.
8/17/2015 15
PVT Tests
To provide data for reservoir calculations
To provide physical property data for well flow calculations
For surface facility design
The reservoir calculations are the main driving force for the various
tests.
Over recent years reservoir simulation capability has generated the
need to extend compositional description from C7+ to in some cases
C29+.
PVT report provides source of all reservoir engineering properties
for behavior over exploration, development and production.
8/17/2015 16
Laboratory Tests
Primary tests
Routine laboratory tests
Special laboratory PVT tests
8/17/2015 17
Primary Tests
API
Gas specific gravity
Separator gas composition
GOR
8/17/2015 18
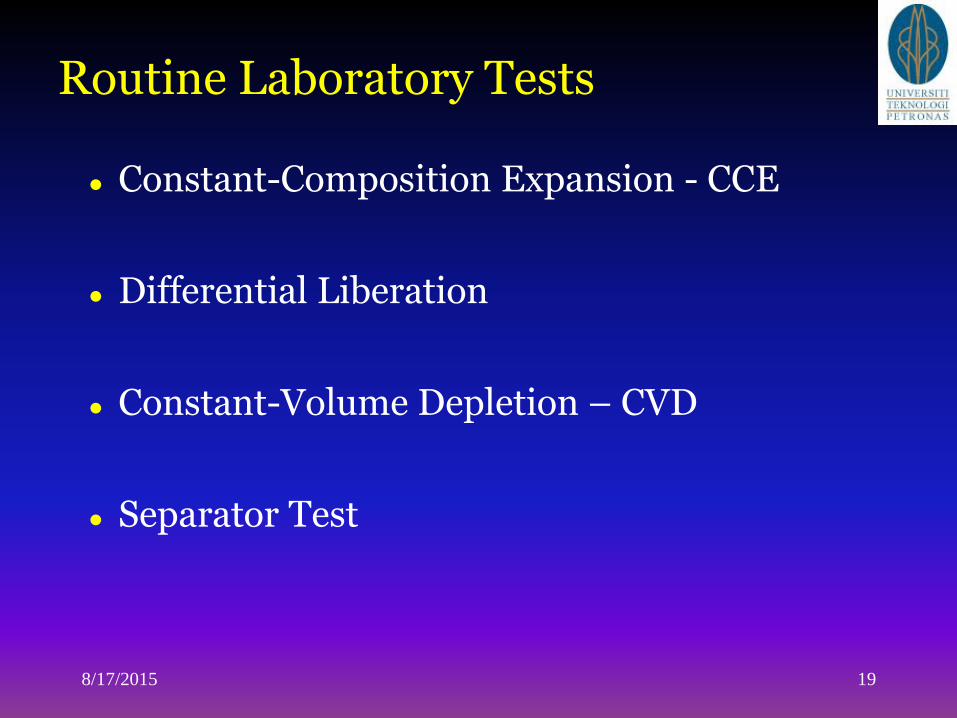
Routine Laboratory Tests
Constant-Composition Expansion - CCE
Differential Liberation
Constant-Volume Depletion – CVD
Separator Test
8/17/2015 19
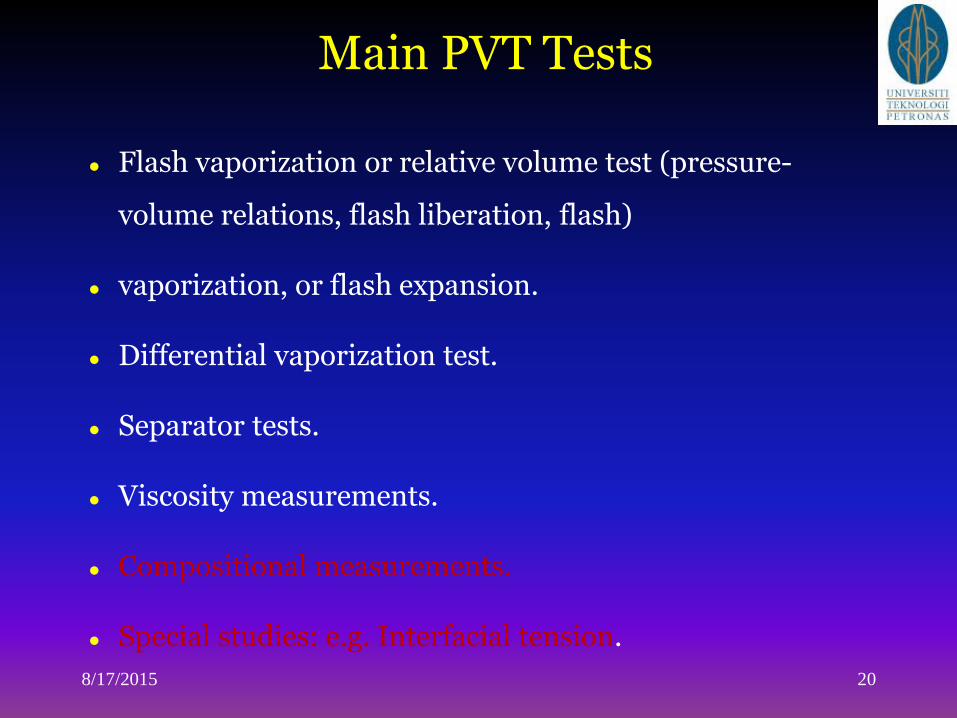
Main PVT Tests
Flash vaporization or relative volume test (pressure-
volume relations, flash liberation, flash)
vaporization, or flash expansion.
Differential vaporization test.
Separator tests.
Viscosity measurements.
Compositional measurements.
Special studies: e.g. Interfacial tension.
8/17/2015 20
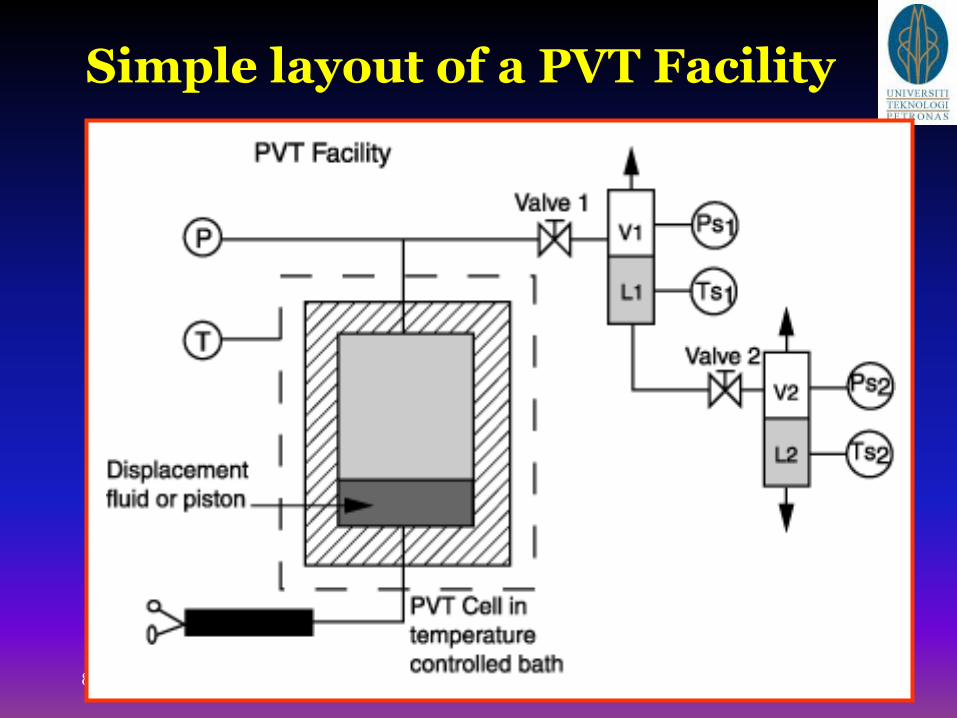
Simple layout of a PVT Facility
8/17/2015 21
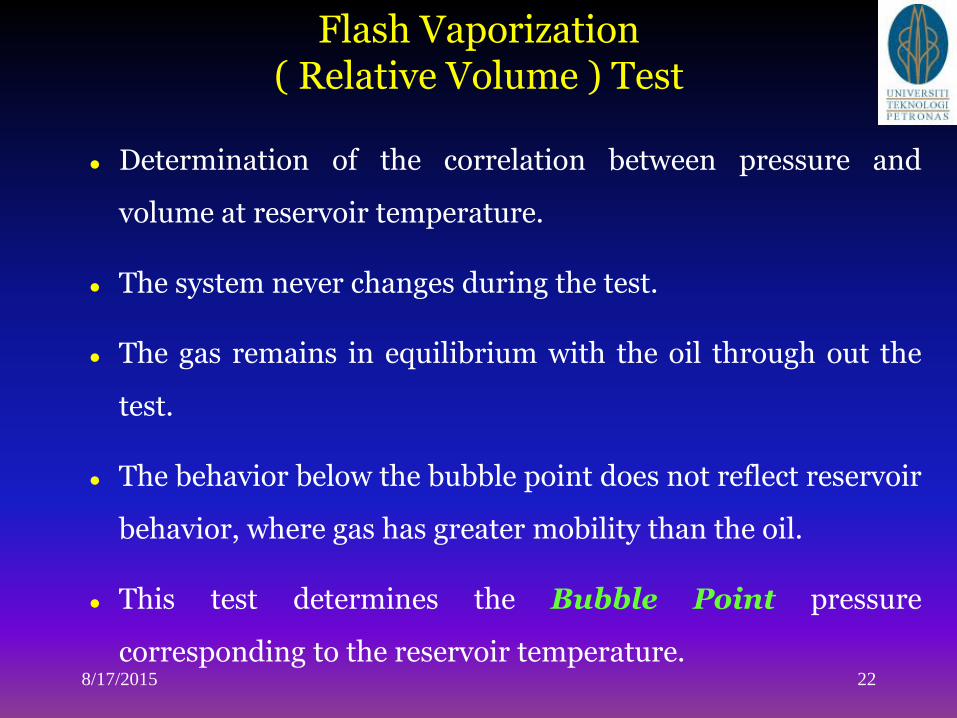
Flash Vaporization ( Relative Volume ) Test
Determination of the correlation between pressure and
volume at reservoir temperature.
The system never changes during the test.
The gas remains in equilibrium with the oil through out the
test.
The behavior below the bubble point does not reflect reservoir
behavior, where gas has greater mobility than the oil.
This test determines the Bubble Point pressure
corresponding to the reservoir temperature.8/17/2015 22
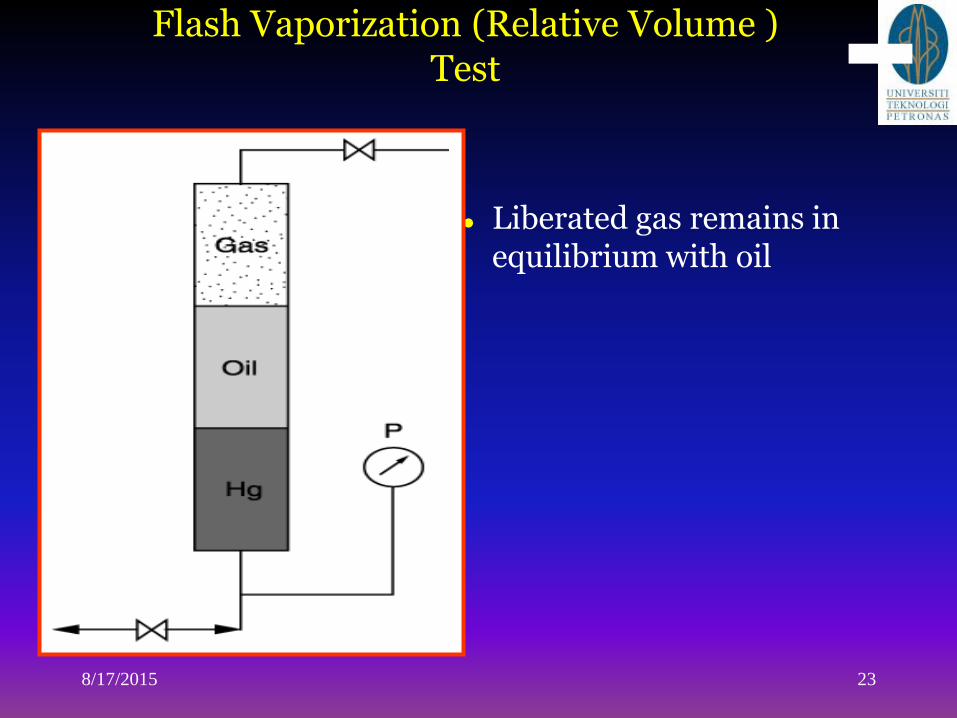
Flash Vaporization (Relative Volume ) Test
Liberated gas remains in equilibrium with oil
8/17/2015 23
Flash Vaporization (Relative Volume ) Test
8/17/2015 24
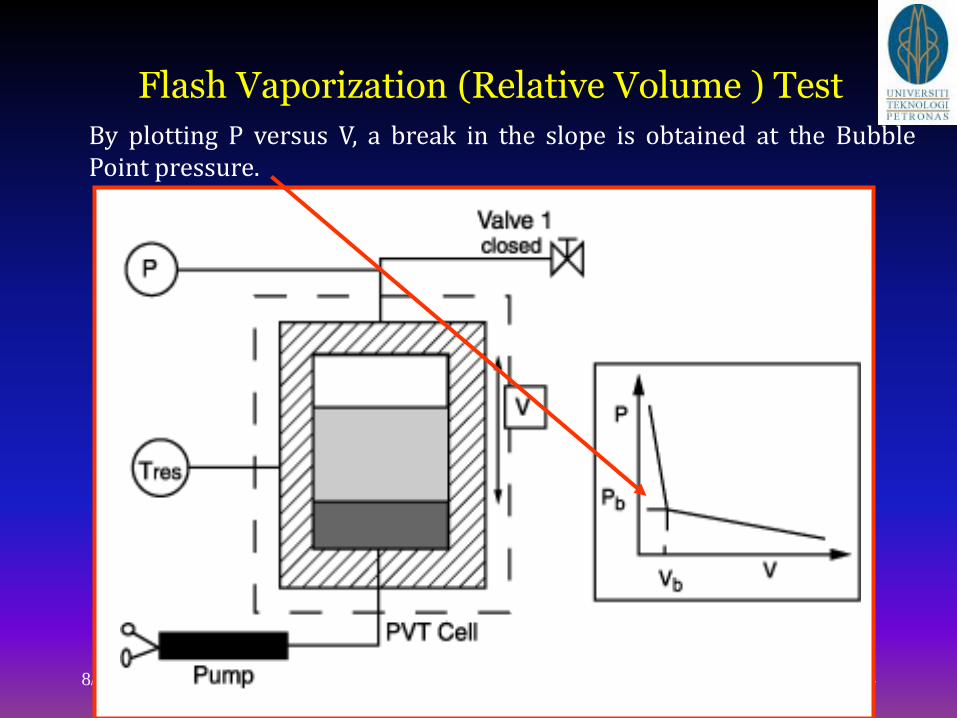
By plotting P versus V, a break in the slope is obtained at the BubblePoint pressure.
8/17/2015 25
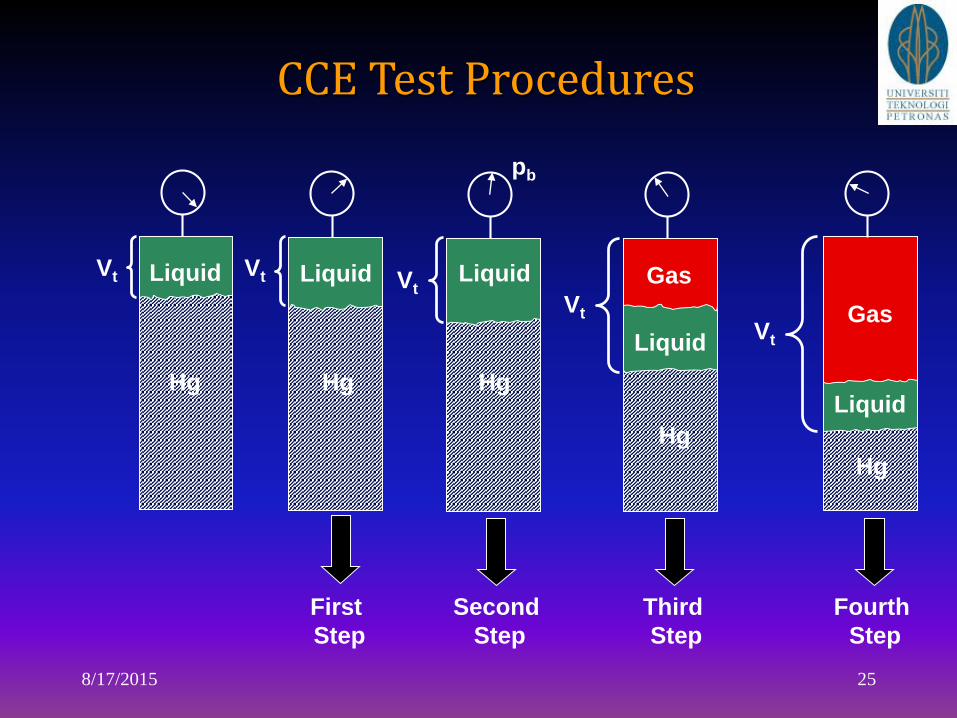
CCE Test Procedures
GasLiquid
Hg
Second
Step
Liqui
d
Hg
LiquidLiqui
d
Hg
First
Step
Hg
Third
Step
Hg
Fourth
Step
Liquid
GasVtLiquid
Vt
LiquidVtVt LiquidVt
pb
Flash Vaporization (Relative Volume ) Test
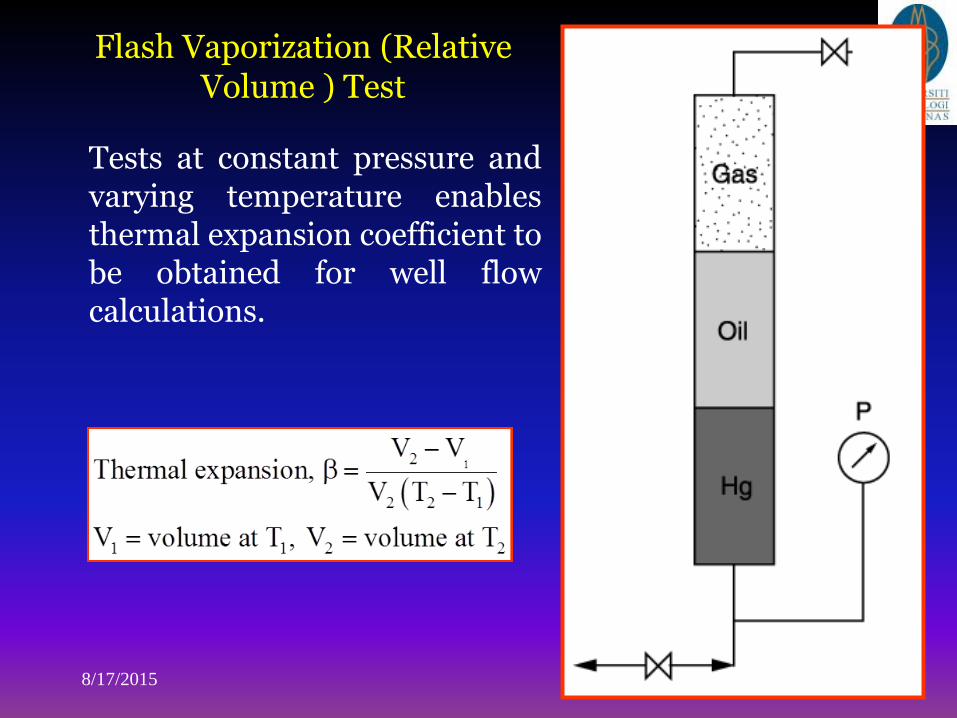
Tests at constant pressure andvarying temperature enablesthermal expansion coefficient tobe obtained for well flowcalculations.
8/17/2015 26
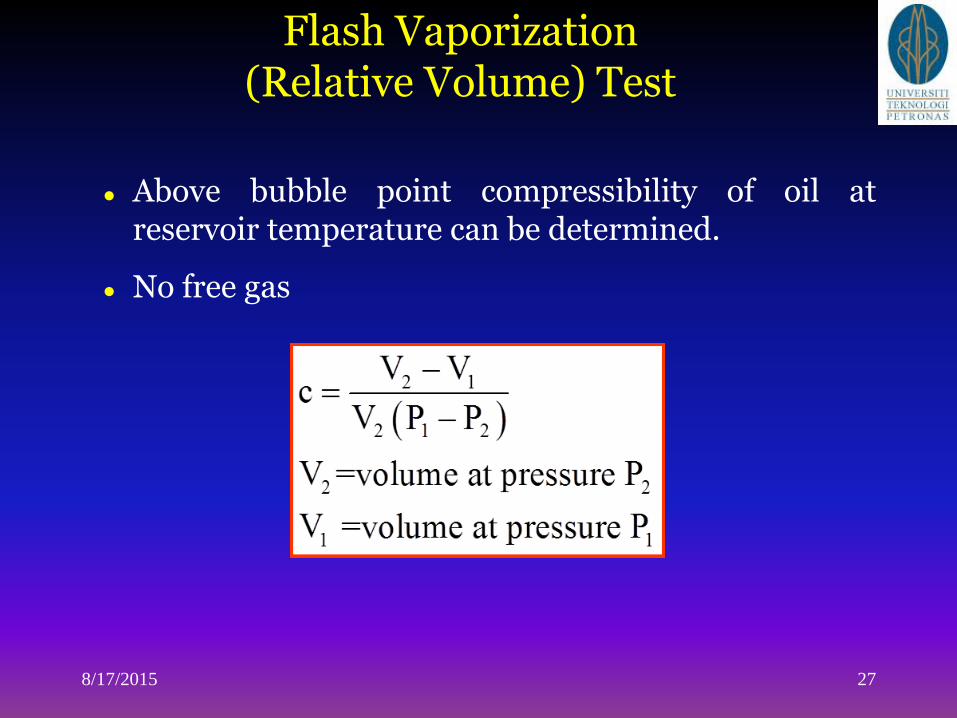
Flash Vaporization(Relative Volume) Test
Above bubble point compressibility of oil atreservoir temperature can be determined.
No free gas
8/17/2015 27
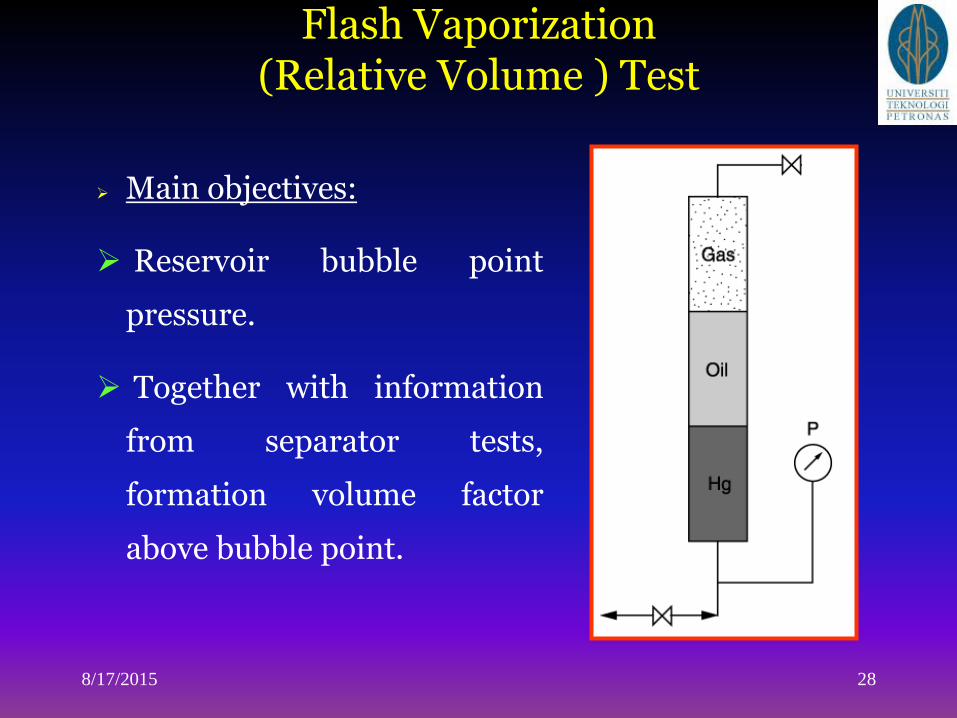
Flash Vaporization (Relative Volume ) Test
Main objectives:
Reservoir bubble point
pressure.
Together with information
from separator tests,
formation volume factor
above bubble point.
8/17/2015 28
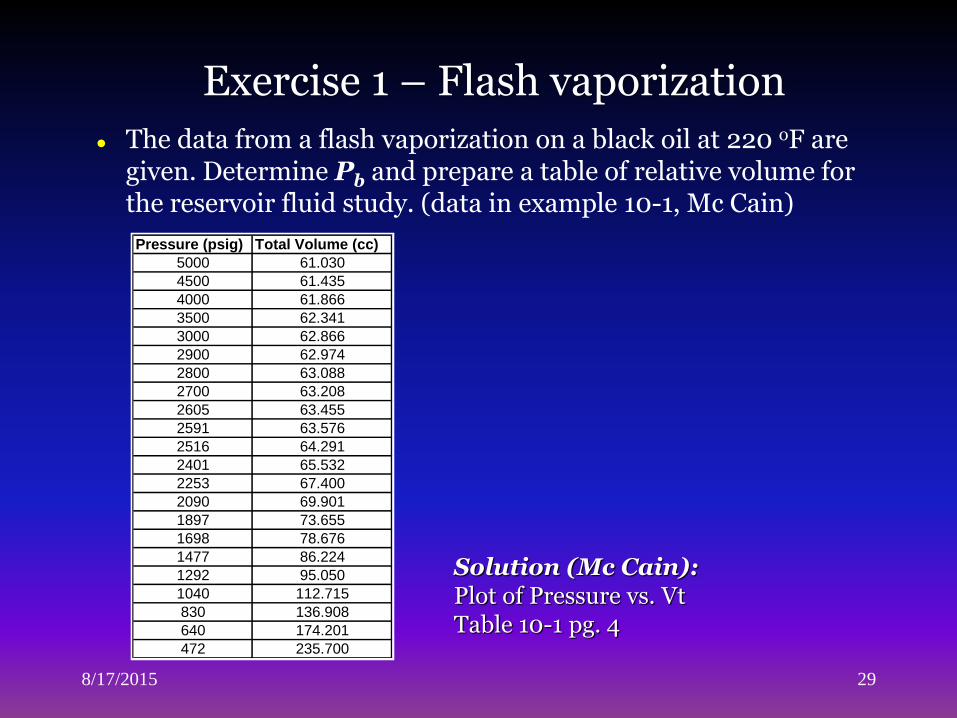
Exercise 1 – Flash vaporization
The data from a flash vaporization on a black oil at 220 oF are given. Determine Pb and prepare a table of relative volume for the reservoir fluid study. (data in example 10-1, Mc Cain)
8/17/2015 29
Solution (Mc Cain):Plot of Pressure vs. VtTable 10-1 pg. 4
Pressure (psig) Total Volume (cc)
5000 61.030
4500 61.435
4000 61.866
3500 62.341
3000 62.866
2900 62.974
2800 63.088
2700 63.208
2605 63.455
2591 63.576
2516 64.291
2401 65.532
2253 67.400
2090 69.901
1897 73.655
1698 78.676
1477 86.224
1292 95.050
1040 112.715
830 136.908
640 174.201
472 235.700
Differential Vaporization
Below bubble point in reservoir gas liquid separation in the
reservoir is a constant changing system.
A test has been designed to attempt to simulate this process.
In the differential vaporization test liberated gas is
removed from the cell step wise.
At each step below bubble point, volumes densities , gas
expansion and compressibility determined.
Bubble point starting point.
8/17/2015 30
Differential Liberation Test
The experimental data obtained from the test include:
Amount of gas in solution as a function of pressure
The shrinkage in the oil volume as a function of pressure
Properties of the evolved gas including the composition of
the liberated gas, the gas compressibility factor, and the gas
specific gravity
Density of the remaining oil as a function of pressure
8/17/2015 31
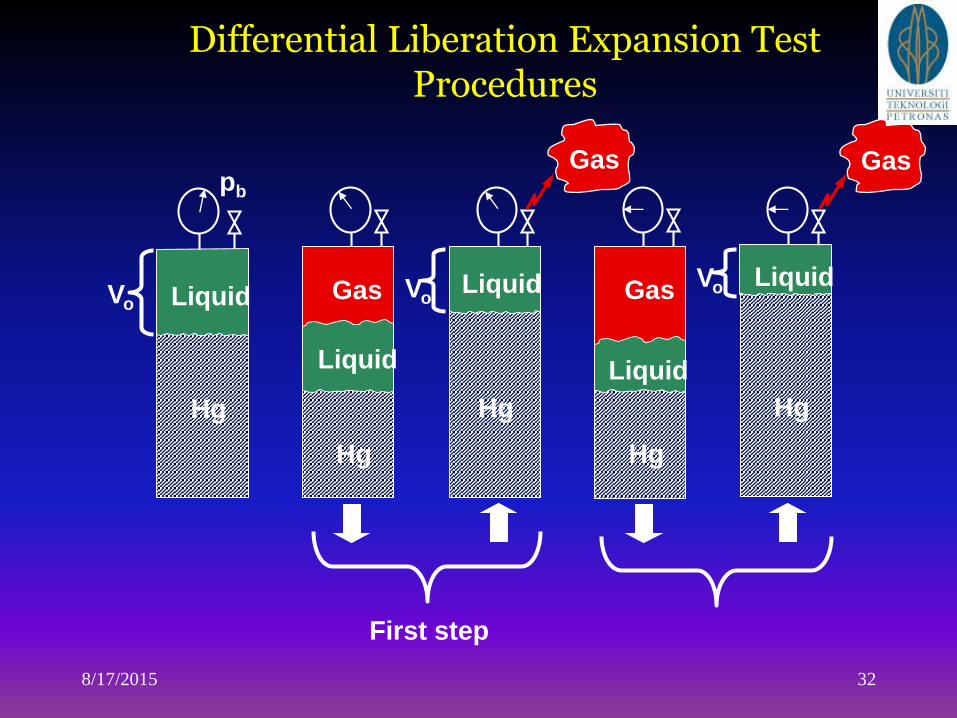
Differential Liberation Expansion Test Procedures
8/17/2015 32
VoLiquid
Hg
Gas
Hg
Liquid
Gas
First step
Hg
Liquid
GasLiquid
Hg
Vo
Gas
Vo
Hg
Liquid
pb
Differential Vaporization
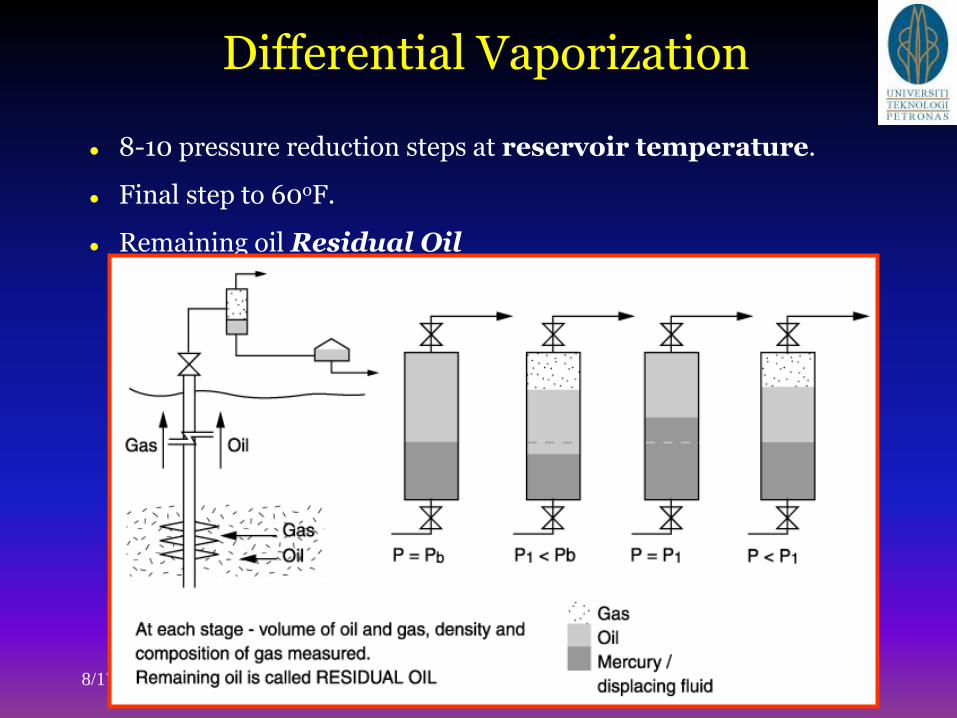
8-10 pressure reduction steps at reservoir temperature.
Final step to 60oF.
Remaining oil Residual Oil
8/17/2015 33
Differential Vaporization
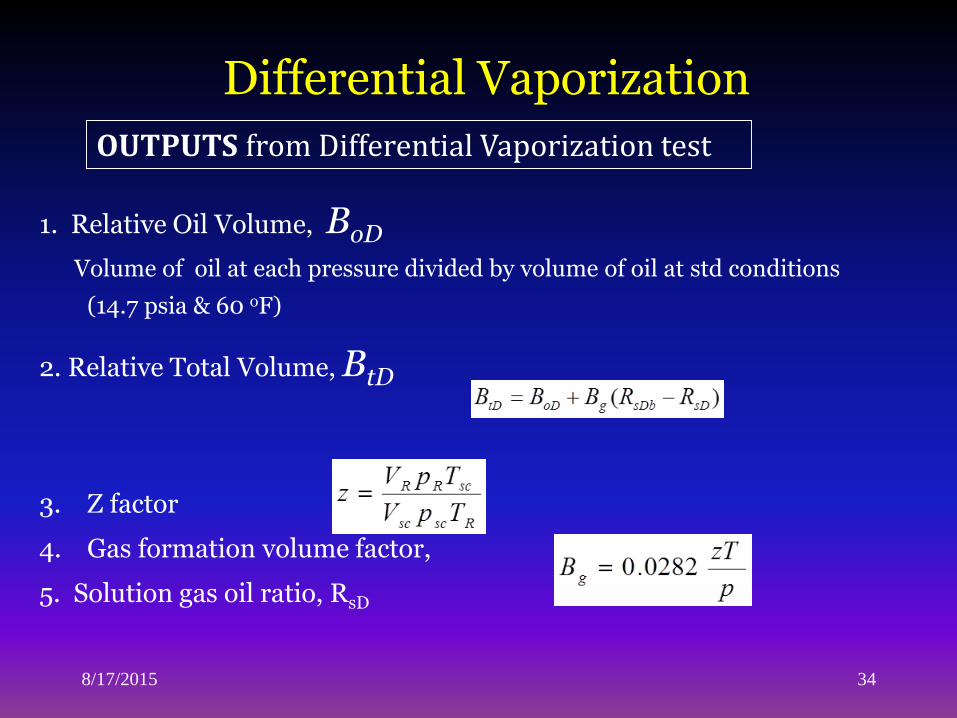
1. Relative Oil Volume, BoD
Volume of oil at each pressure divided by volume of oil at std conditions
(14.7 psia & 60 oF)
2. Relative Total Volume, BtD
3. Z factor
4. Gas formation volume factor,
5. Solution gas oil ratio, RsD
8/17/2015 34
OUTPUTS from Differential Vaporization test
Exercise 2: Differential Vaporization
The data from a differential vaporization on a black oil at 220 oF are
given. Prepare a table of solution gas-oil ratios, relative oil volumes,
and relative total volumes by this differential process. Also include
z-factors and formation volume factors of the increments of gas
removed.
8/17/2015 35
(Solution (Mc Cain example2):
Exercise 2: Differential Vaporization
Notes on answers
8/17/2015 36
1. Solution gas oil ratio, Rs has units at surface
conditions (scf/stb)
2. Oil formation volume factor has units at reservoir
conditions & surface condition (res. bbl/stb)
3. Gas formation volume factor has units at reservoir
conditions & surface condition (res. bbl/scf)
Differential Vaporization vs. Flash Vaporization
Flash liberation considered to take place between
reservoir and surface.
Differential liberation considered to be
representative of the process in the reservoir below
bubble point pressure.
Differential tests carried out to obtain oil formation
volume factors and GOR’s to predict behavior below
bubble point pressure.
8/17/2015 37
Separator Tests
Objective: to determine impact of separator conditions on
Bo, GOR, and produced fluid physical properties.
Carried out to give an indication of oil shrinkage and GOR
when fluids produced to surface.
There are no unique values for Bo & GOR. They depend on
separator conditions.
Starting point for the test is the bubble point pressure.
Fluid produced at surface conditions Stock tank oil
8/17/2015 38
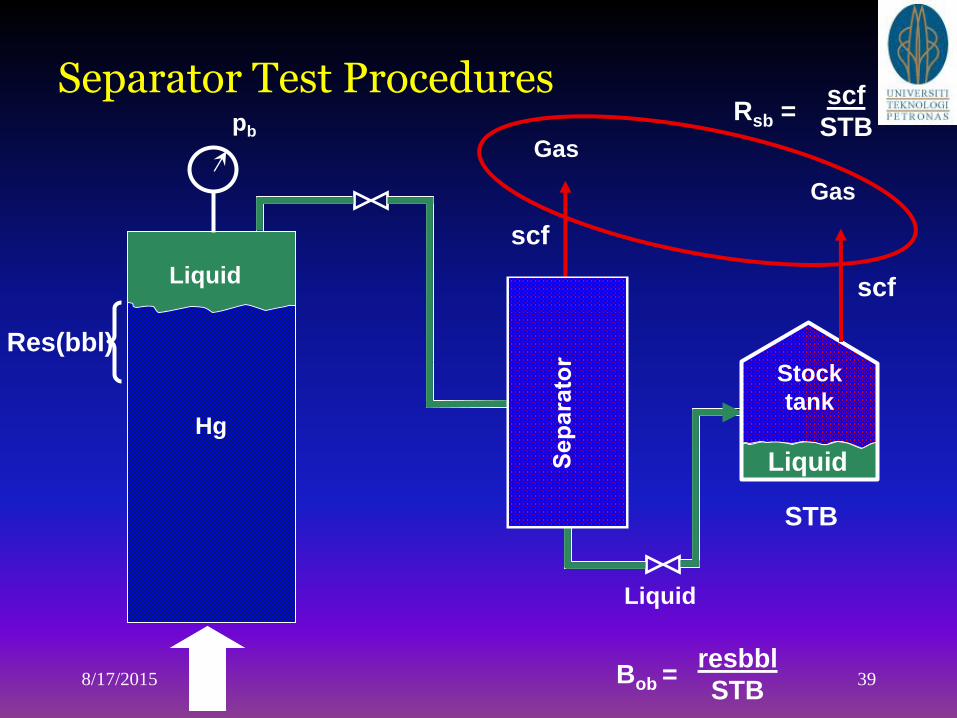
Separator Test Procedures
8/17/2015 39
LiquidHg
Liquid
Stock
tank
Gas
Gas
Liquid
Hg
pb
Res(bbl)
STB
resbbl
STBBob =
scf
scf
Rsb =scf
STB
Separator Tests
8/17/2015 40
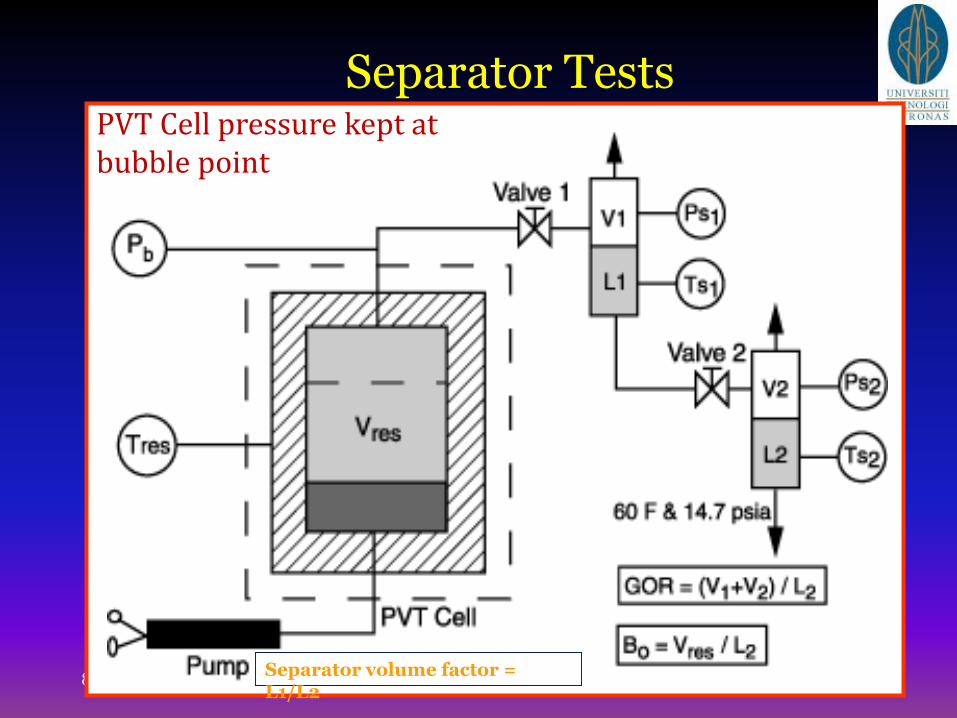
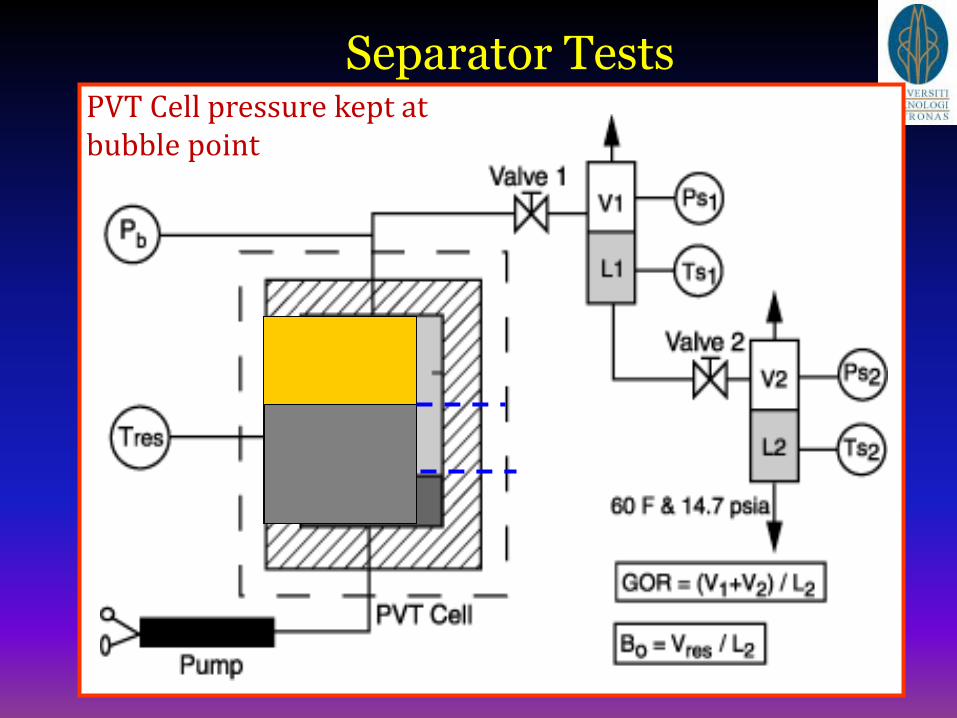
PVT Cell pressure kept at bubble point
Separator volume factor = L1/L2
Separator Tests
8/17/2015 41
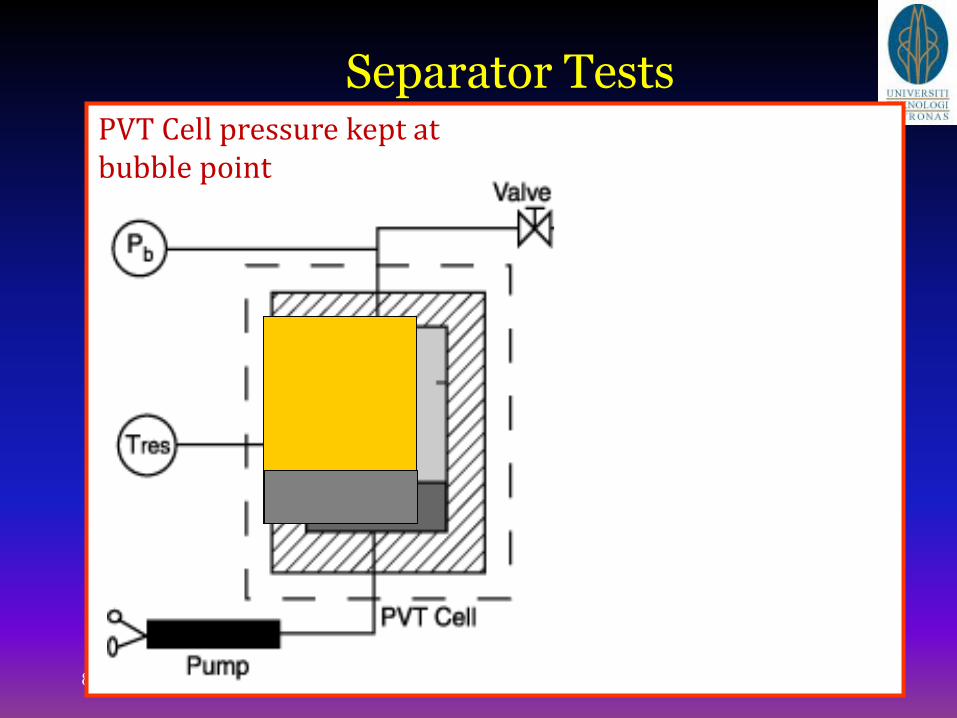
PVT Cell pressure kept at bubble point

Separator Tests
8/17/2015 42
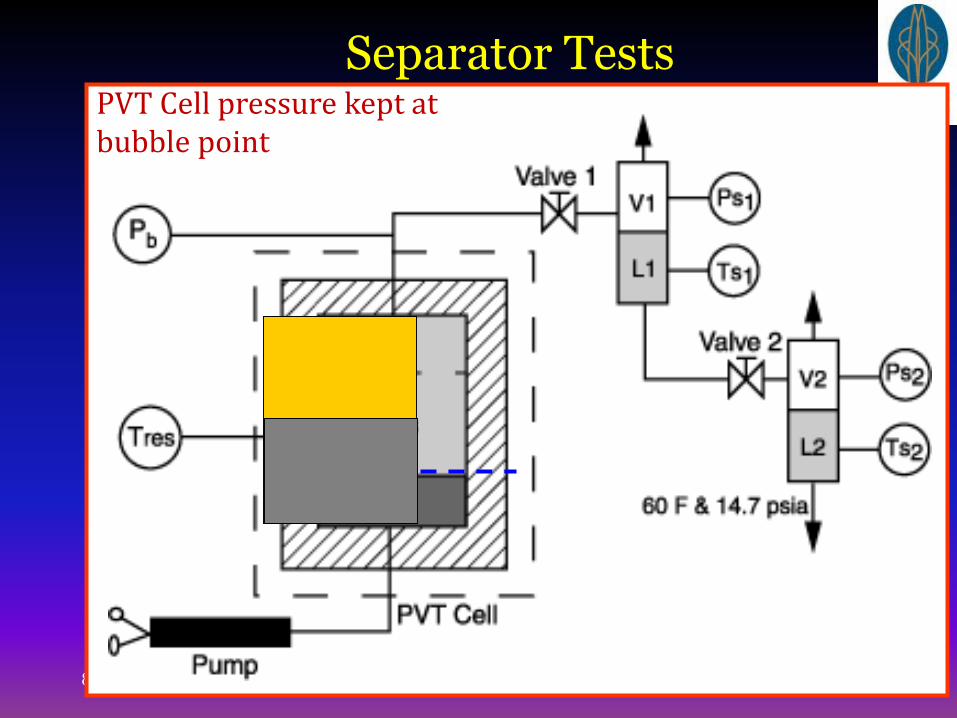
PVT Cell pressure kept at bubble point
Separator Tests
8/17/2015 43
PVT Cell pressure kept at bubble point
Separator Tests
V res
8/17/2015 44
PVT Cell pressure kept at bubble point
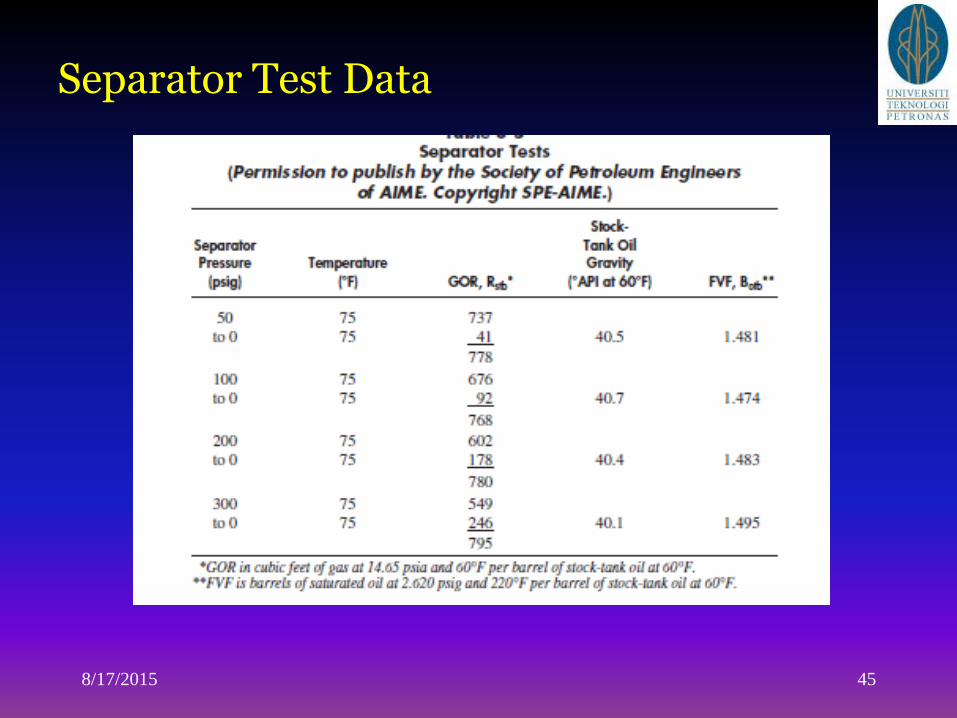
Separator Test Data
8/17/2015 45
Viscosity
Measured at different pressures above and
below bubble point pressure.
Below bubble point pressure carried out under
differential conditions.
Rolling ball or capillary tube methods of
measurement
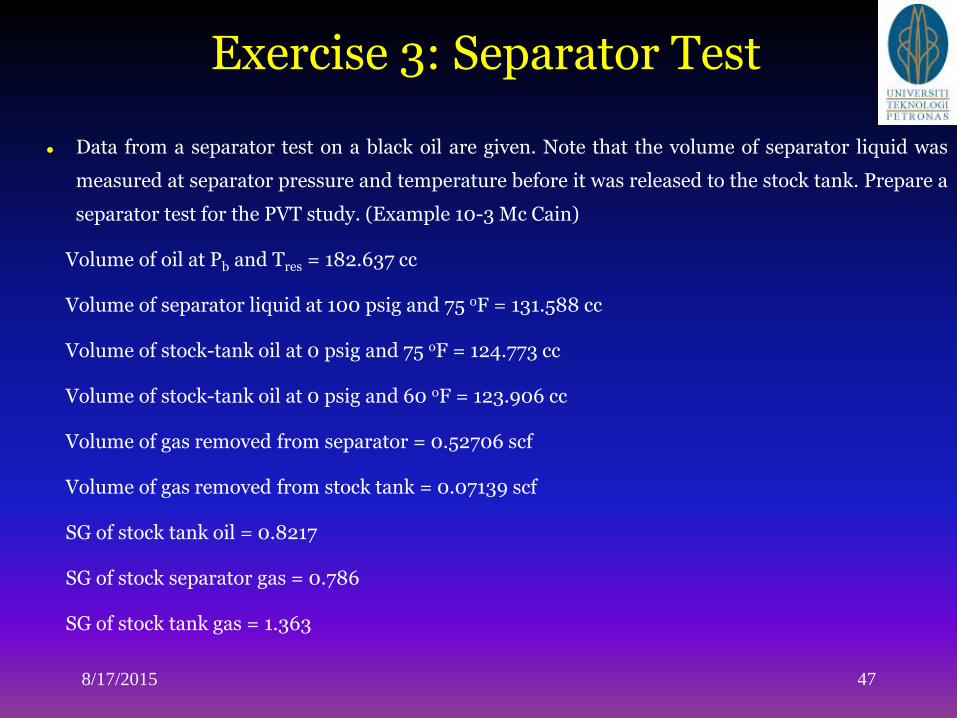
Exercise 3: Separator Test
Data from a separator test on a black oil are given. Note that the volume of separator liquid was
measured at separator pressure and temperature before it was released to the stock tank. Prepare a
separator test for the PVT study. (Example 10-3 Mc Cain)
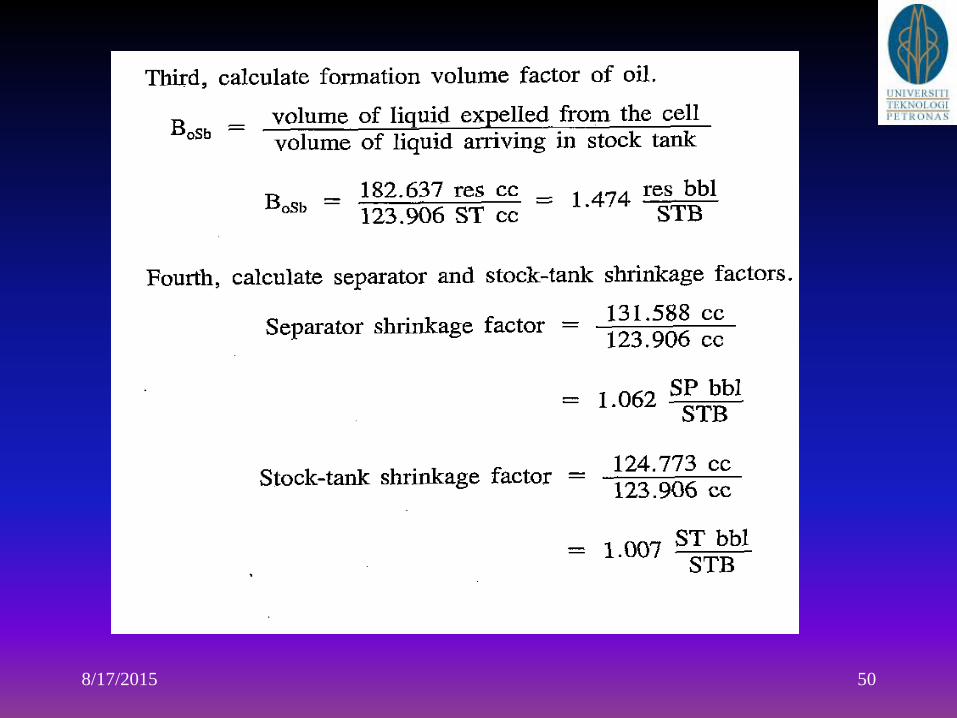
Volume of oil at Pb and Tres = 182.637 cc
Volume of separator liquid at 100 psig and 75 oF = 131.588 cc
Volume of stock-tank oil at 0 psig and 75 oF = 124.773 cc
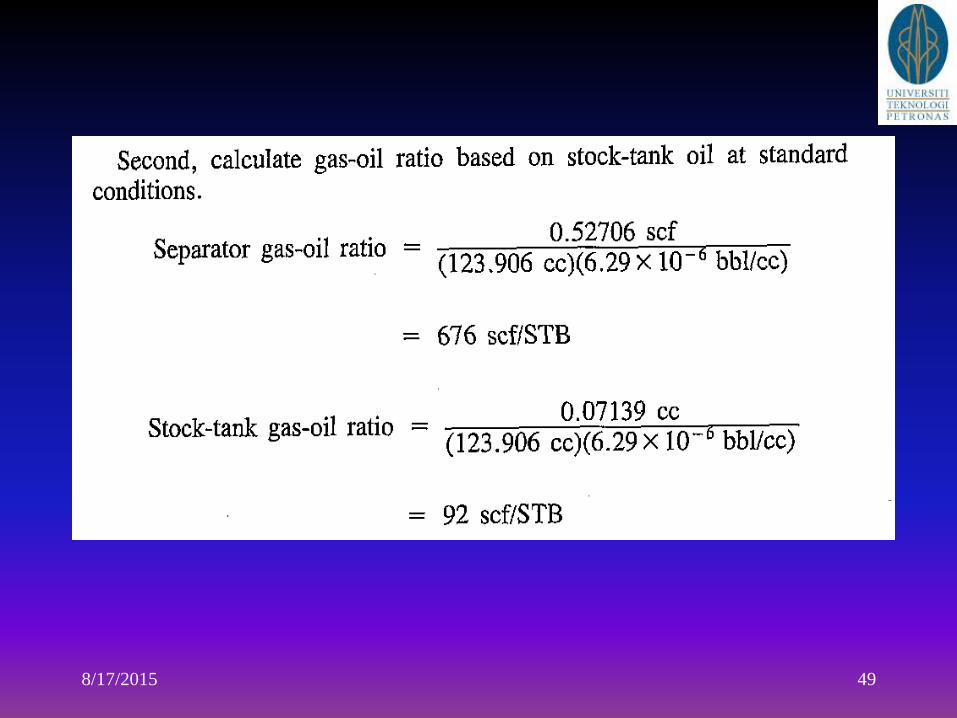
Volume of stock-tank oil at 0 psig and 60 oF = 123.906 cc
Volume of gas removed from separator = 0.52706 scf
Volume of gas removed from stock tank = 0.07139 scf
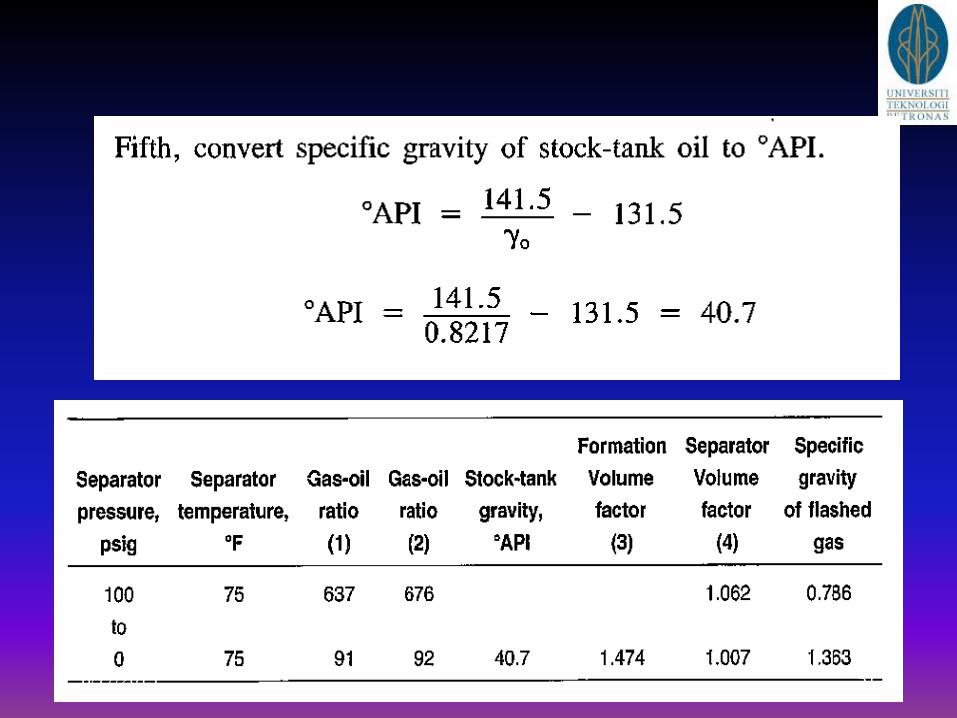
SG of stock tank oil = 0.8217
SG of stock separator gas = 0.786
SG of stock tank gas = 1.363
8/17/2015 47
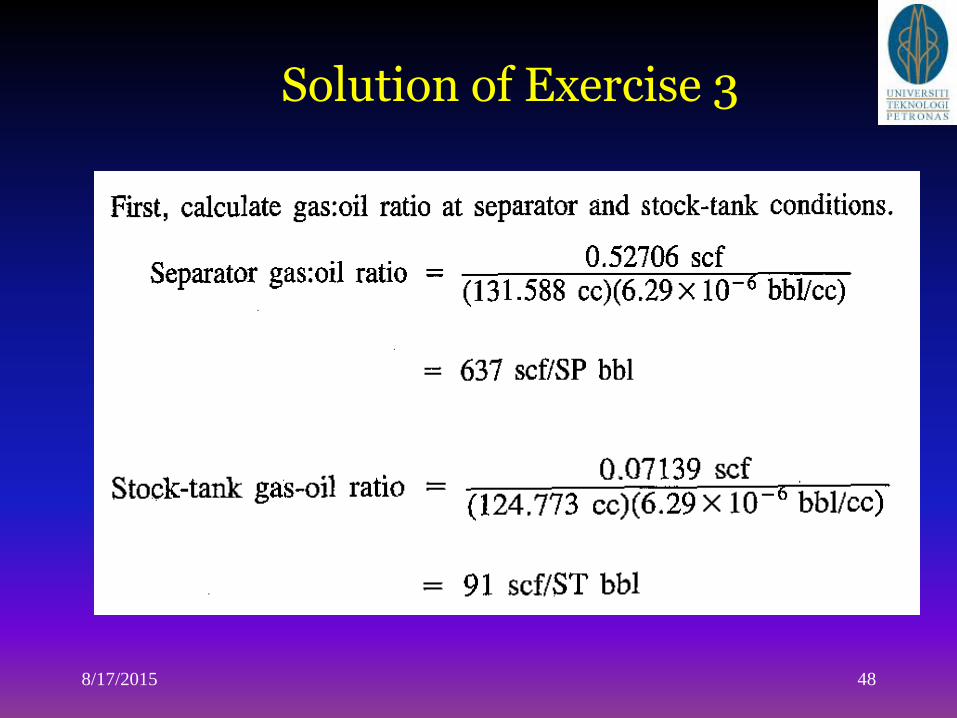
Solution of Exercise 3
8/17/2015 48
8/17/2015 49
8/17/2015 50
8/17/2015 51
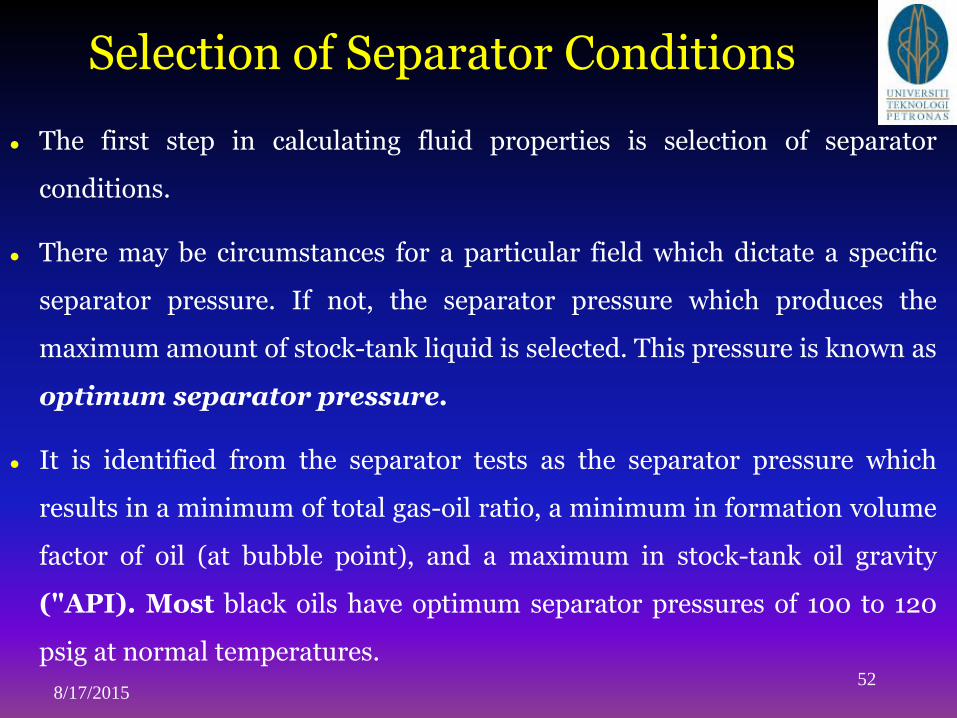
Selection of Separator Conditions
The first step in calculating fluid properties is selection of separator
conditions.
There may be circumstances for a particular field which dictate a specific
separator pressure. If not, the separator pressure which produces the
maximum amount of stock-tank liquid is selected. This pressure is known as
optimum separator pressure.
It is identified from the separator tests as the separator pressure which
results in a minimum of total gas-oil ratio, a minimum in formation volume
factor of oil (at bubble point), and a maximum in stock-tank oil gravity
("API). Most black oils have optimum separator pressures of 100 to 120
psig at normal temperatures.
8/17/201552
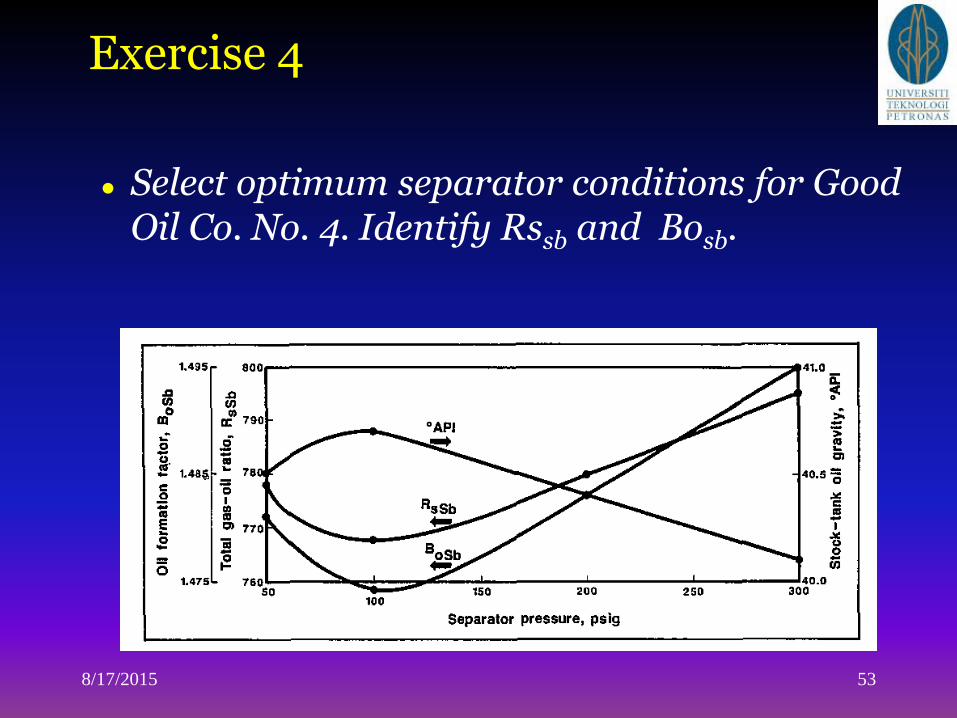
Exercise 4
Select optimum separator conditions for Good Oil Co. No. 4. Identify Rssb and Bosb.
8/17/2015 53
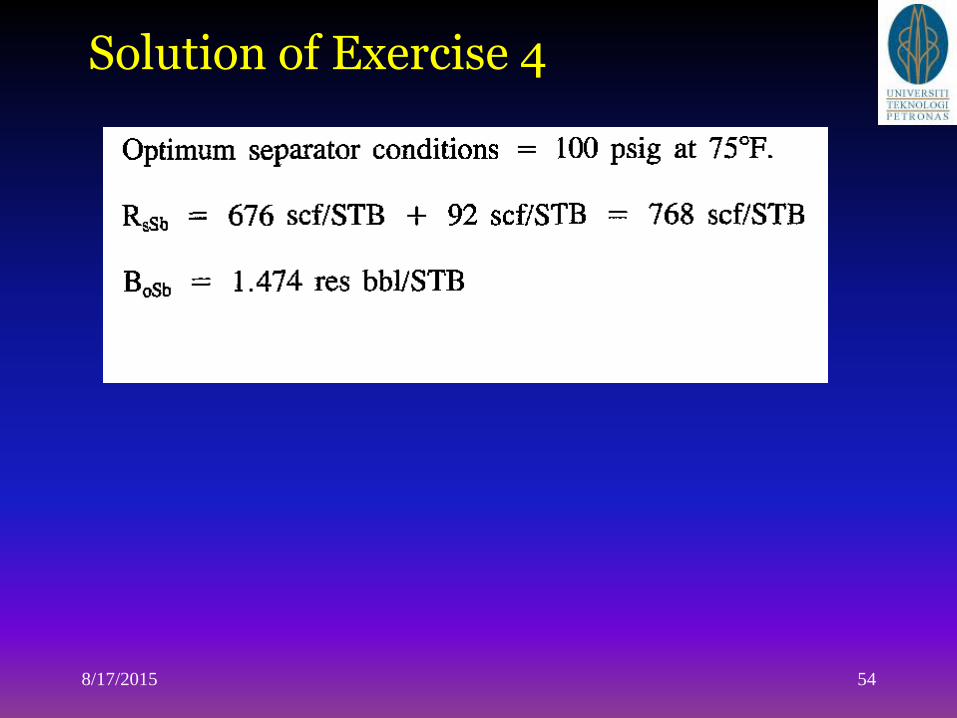
Solution of Exercise 4
8/17/2015 54
Outcomes
To describe various tests under PVT study
To relate oil physical properties generated
from PVT study for MBE applications
To determine gas physical properties from
PVT study
8/17/2015 55
8/17/2015 56
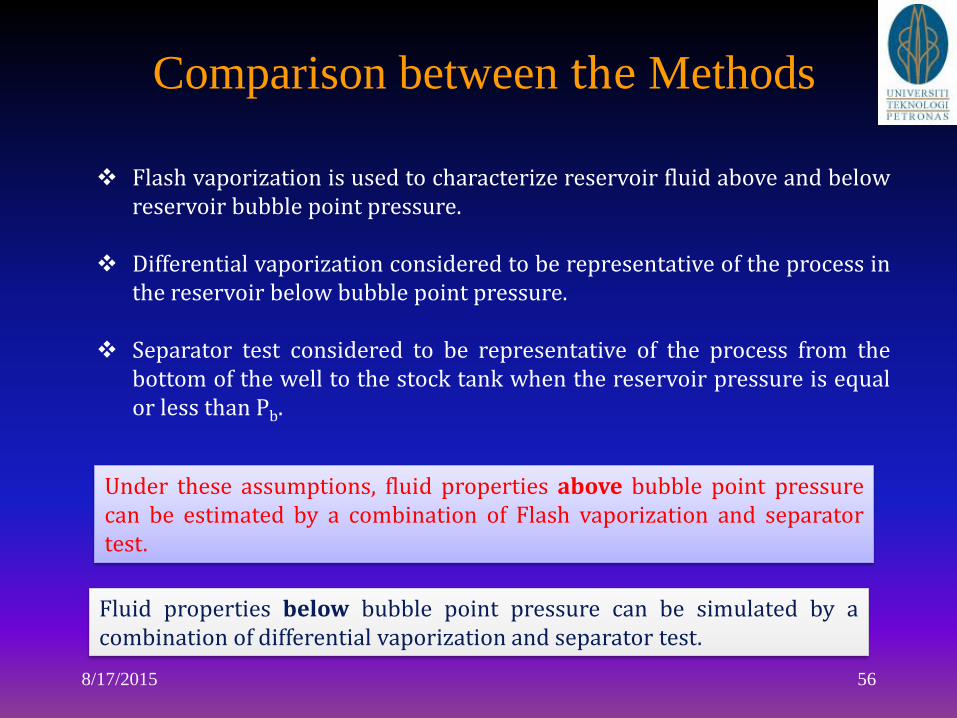
Flash vaporization is used to characterize reservoir fluid above and belowreservoir bubble point pressure.
Differential vaporization considered to be representative of the process inthe reservoir below bubble point pressure.
Separator test considered to be representative of the process from thebottom of the well to the stock tank when the reservoir pressure is equalor less than Pb.
Comparison between the Methods
Under these assumptions, fluid properties above bubble point pressurecan be estimated by a combination of Flash vaporization and separatortest.
Fluid properties below bubble point pressure can be simulated by acombination of differential vaporization and separator test.
8/17/2015 57
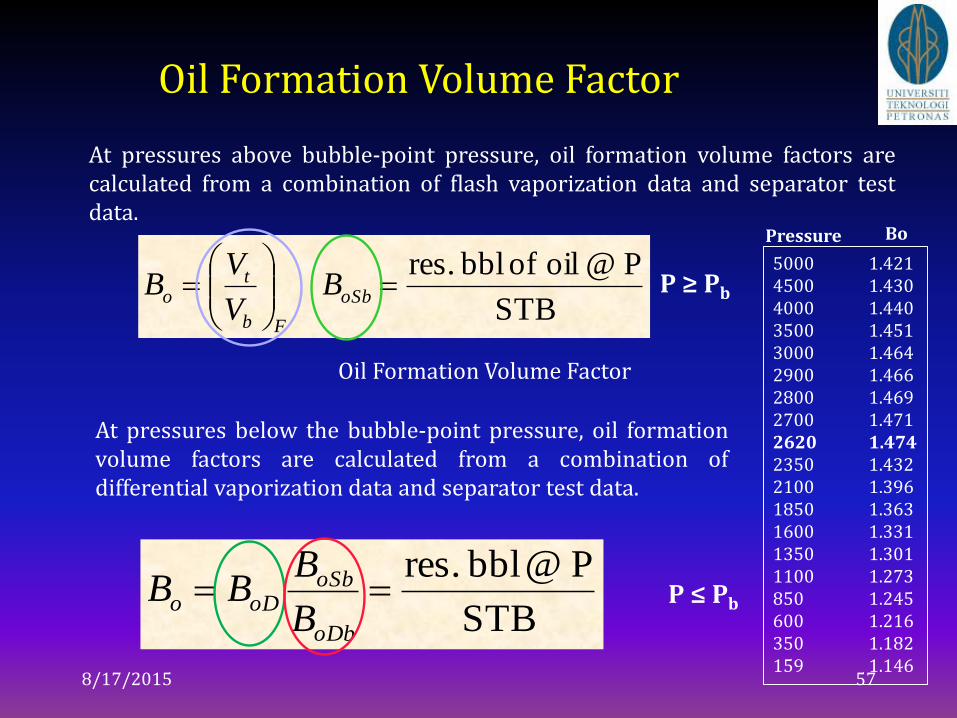
At pressures above bubble-point pressure, oil formation volume factors arecalculated from a combination of flash vaporization data and separator testdata.
P ≥ Pb
At pressures below the bubble-point pressure, oil formationvolume factors are calculated from a combination ofdifferential vaporization data and separator test data.
P ≤ Pb
Pressure Bo
5000 1.4214500 1.4304000 1.4403500 1.4513000 1.4642900 1.4662800 1.4692700 1.4712620 1.4742350 1.4322100 1.3961850 1.3631600 1.3311350 1.3011100 1.273850 1.245600 1.216350 1.182159 1.146
STB
P@ oil of bbl res.
oSb
Fb
to B
V
VB
STB
P@ bbl res.
oDb
oSboDo
B
BBB
Oil Formation Volume Factor
Oil Formation Volume Factor
8/17/2015 58
Solution Gas Oil Ratio (Rs)
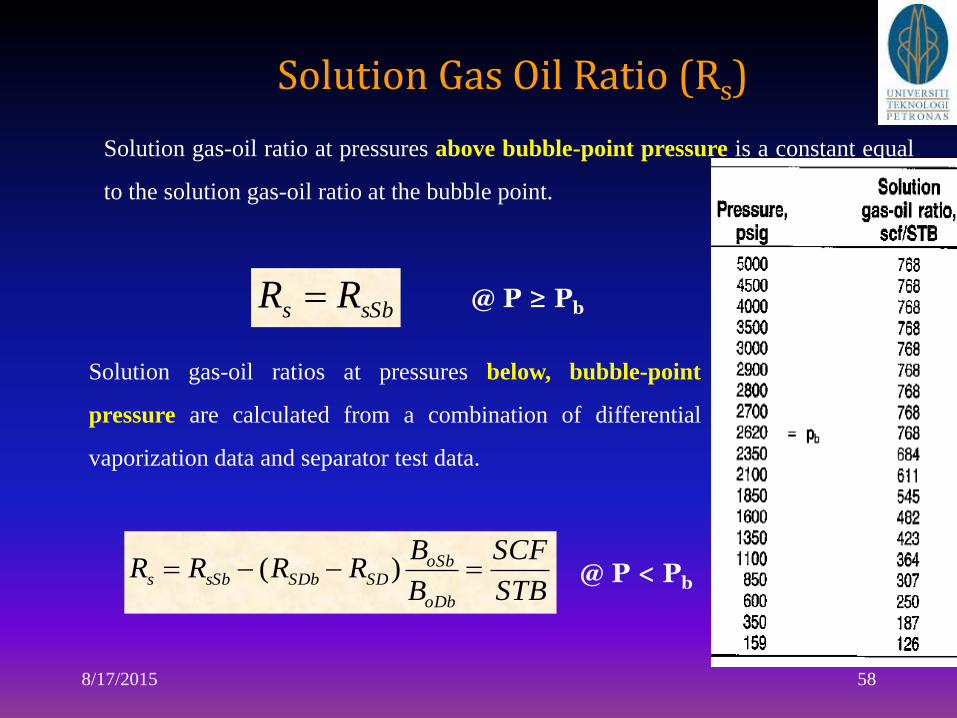
Solution gas-oil ratio at pressures above bubble-point pressure is a constant equal
to the solution gas-oil ratio at the bubble point.
@ P ≥ Pb
Solution gas-oil ratios at pressures below, bubble-point
pressure are calculated from a combination of differential
vaporization data and separator test data.
@ P < Pb
sSbs RR
STB
SCF
B
BRRRR
oDb
oSbSDSDbsSbs )(
8/17/2015 59
Gas Formation Volume Factor
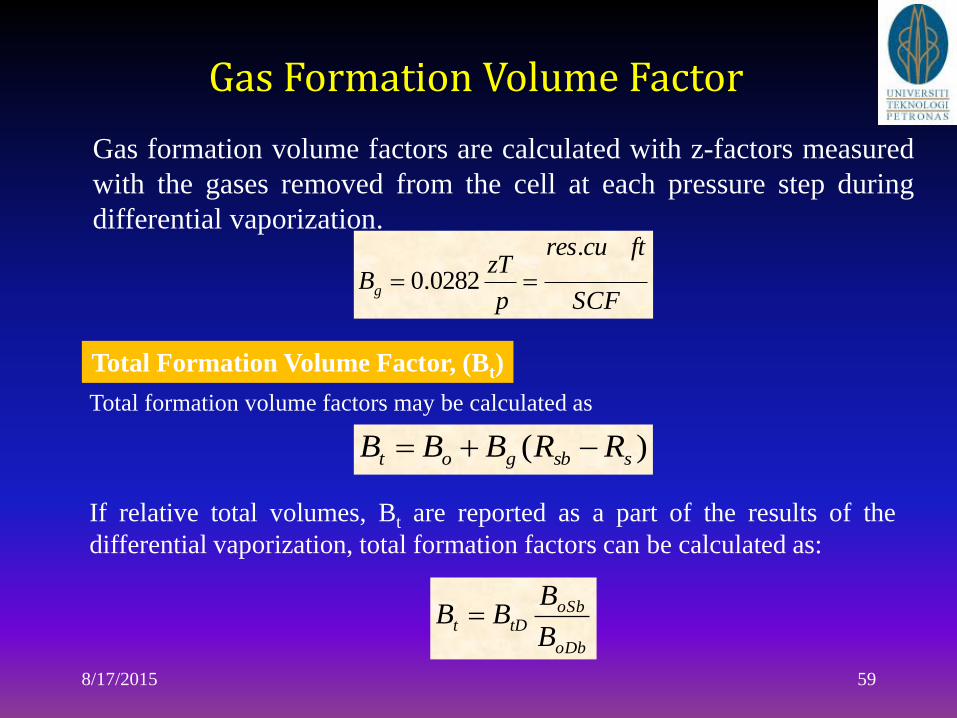
Gas formation volume factors are calculated with z-factors measured
with the gases removed from the cell at each pressure step during
differential vaporization.
Total Formation Volume Factor, (Bt)
Total formation volume factors may be calculated as
If relative total volumes, Bt are reported as a part of the results of the
differential vaporization, total formation factors can be calculated as:
SCF
ftcures
p
zTBg
.
0282.0
)( ssbgot RRBBB
oDb
oSbtDt
B
BBB
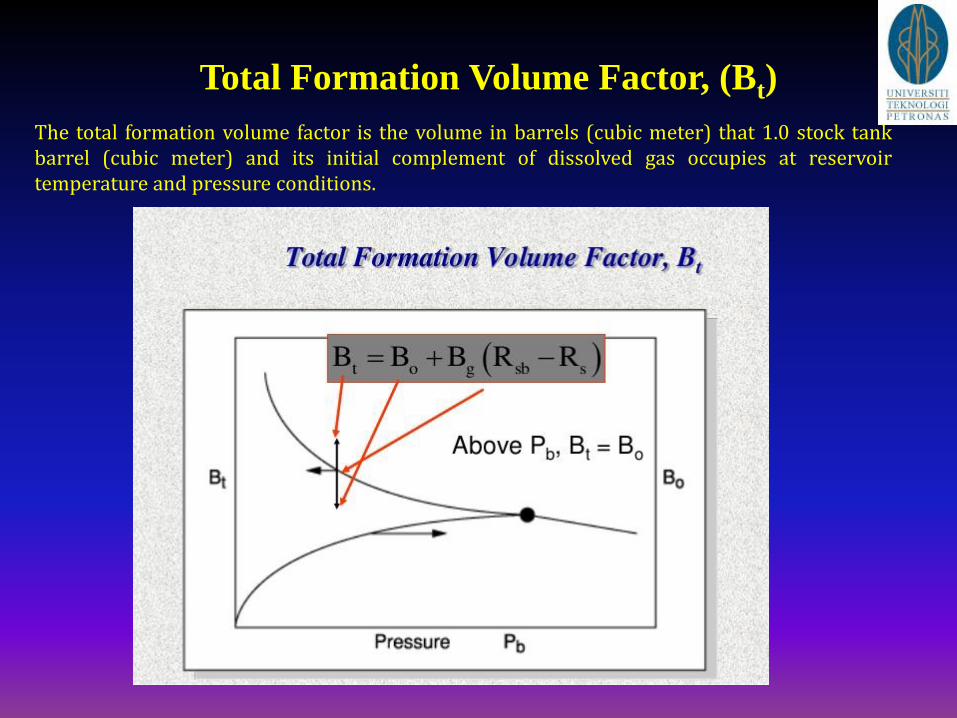
Total Formation Volume Factor, (Bt)
The total formation volume factor is the volume in barrels (cubic meter) that 1.0 stock tankbarrel (cubic meter) and its initial complement of dissolved gas occupies at reservoirtemperature and pressure conditions.
8/17/2015 61
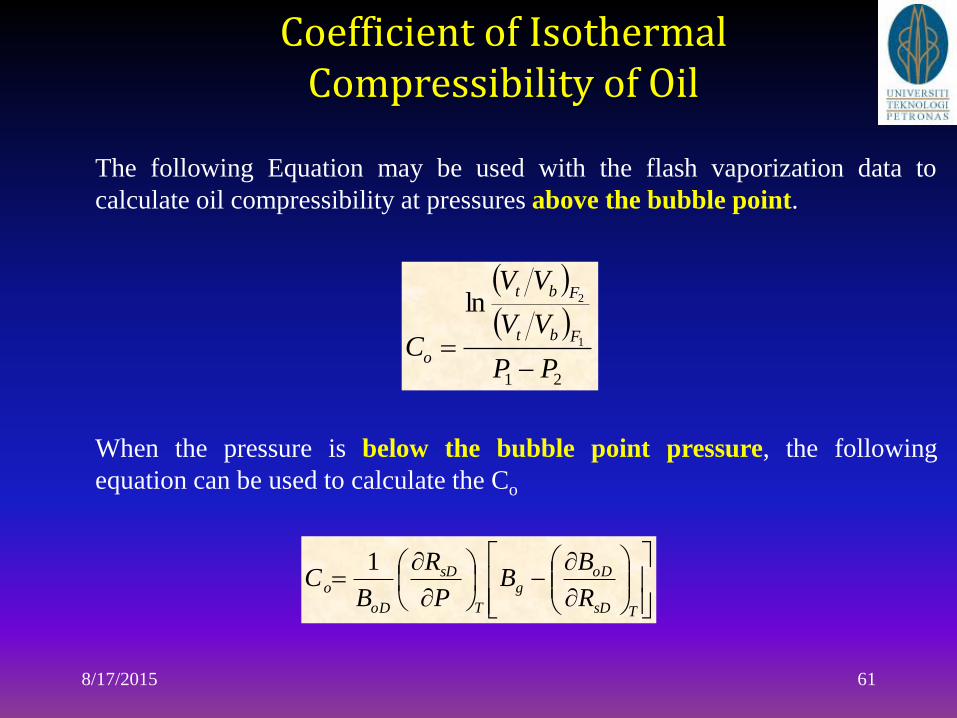
Coefficient of Isothermal Compressibility of Oil
The following Equation may be used with the flash vaporization data to
calculate oil compressibility at pressures above the bubble point.
When the pressure is below the bubble point pressure, the following
equation can be used to calculate the Co
21
1
2ln
PP
VV
VV
CFbt
Fbt
o
TsD
oDg
T
sD
oD
oR
BB
P
R
BC
1
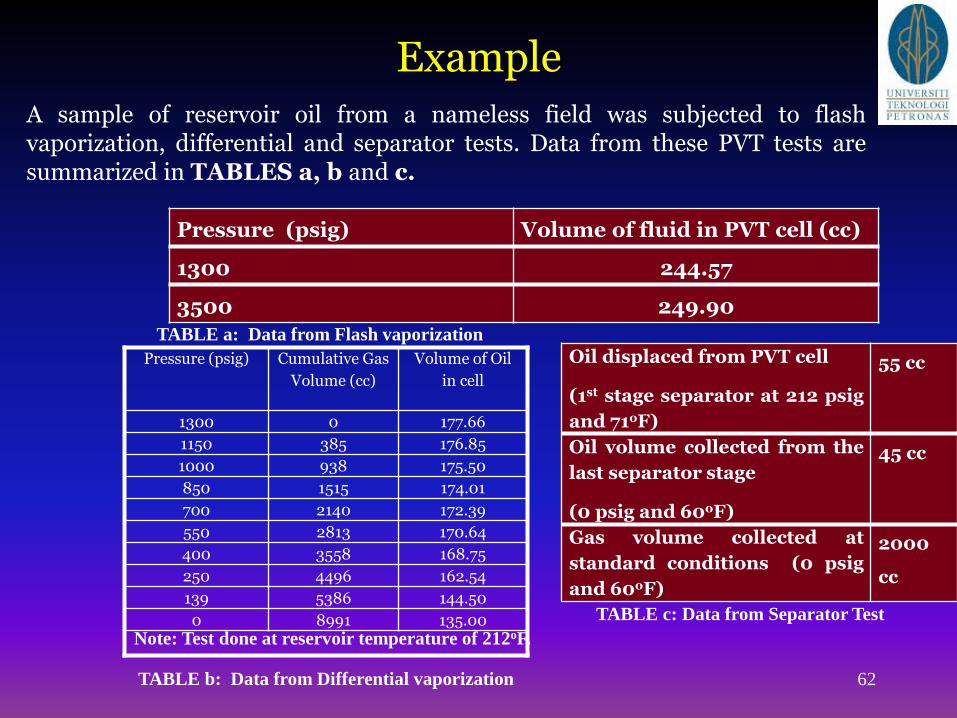
Example A sample of reservoir oil from a nameless field was subjected to flashvaporization, differential and separator tests. Data from these PVT tests aresummarized in TABLES a, b and c.
62
Pressure (psig) Volume of fluid in PVT cell (cc)
1300 244.57
3500 249.90
Pressure (psig) Cumulative Gas
Volume (cc)
Volume of Oil
in cell
1300 0 177.66
1150 385 176.85
1000 938 175.50
850 1515 174.01
700 2140 172.39
550 2813 170.64
400 3558 168.75
250 4496 162.54
139 5386 144.50
0 8991 135.00
Oil displaced from PVT cell
(1st stage separator at 212 psig
and 71oF)
55 cc
Oil volume collected from the
last separator stage
(0 psig and 60oF)
45 cc
Gas volume collected at
standard conditions (0 psig
and 60oF)
2000
cc
TABLE c: Data from Separator Test
TABLE b: Data from Differential vaporization
TABLE a: Data from Flash vaporization
Note: Test done at reservoir temperature of 212oF.
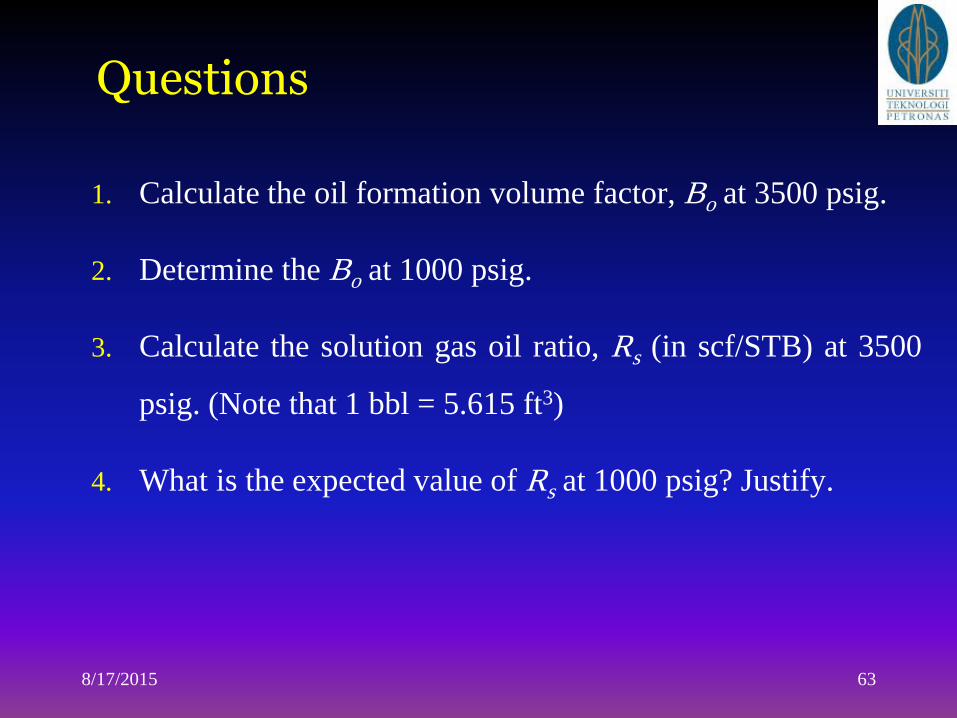
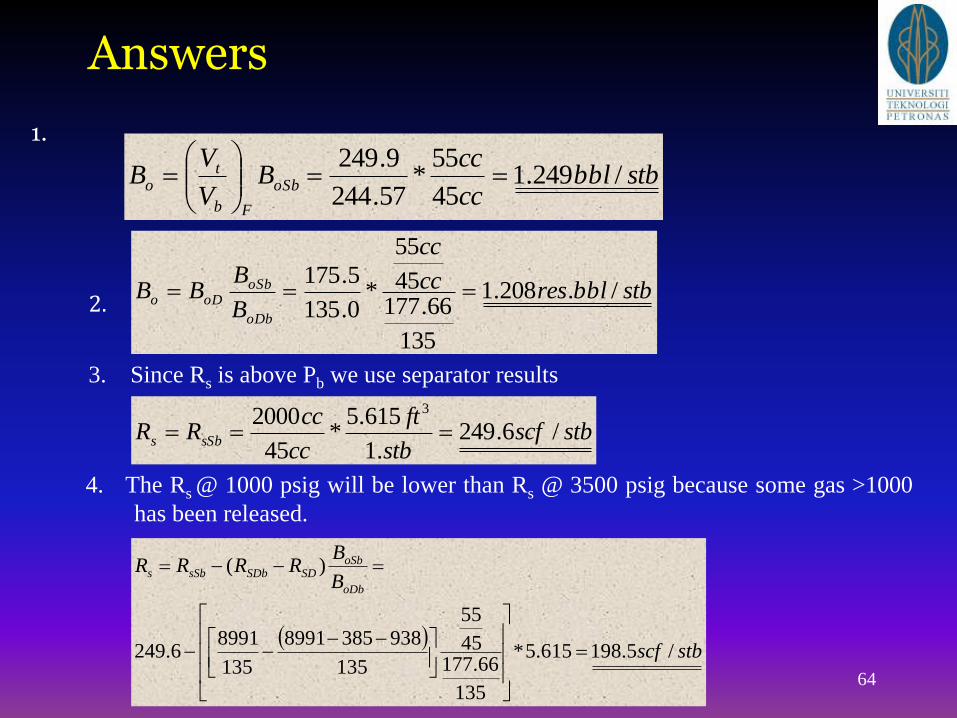
Questions
1. Calculate the oil formation volume factor, Bo at 3500 psig.
2. Determine the Bo at 1000 psig.
3. Calculate the solution gas oil ratio, Rs (in scf/STB) at 3500
psig. (Note that 1 bbl = 5.615 ft3)
4. What is the expected value of Rs at 1000 psig? Justify.
8/17/2015 63
Answers
64
stbbblcc
ccB
V
VB oSb
Fb
to /249.1
45
55*
57.244
9.249
1.
stbbblrescc
cc
B
BBB
oDb
oSboDo /.208.1
135
66.17745
55
*0.135
5.175
2.
3. Since Rs is above Pb we use separator results
stbscfstb
ft
cc
ccRR sSbs /6.249
.1
615.5*
45
2000 3
4. The Rs @ 1000 psig will be lower than Rs @ 3500 psig because some gas >1000
has been released.
stbscf
B
BRRRR
oDb
oSbSDSDbsSbs
/5.198615.5*
135
66.17745
55
135
9383858991
135
89916.249
)(
Summary of results provided by an oil sample PVT test.
Saturation pressure, -bubble point.
Compressibility coefficient.
Coefficient of thermal expansion.
Relative total volume of oil and gas, Vt
Cumulative relative volume of gas. Vg
Cumulative relative volume of oil. Vo
8/17/2015 65
Summary of results provided by an oil sample PVT test.
Gas formation volume factor or gas expansion factor.
Gas compressibility factor.
Specific gravity of gas.
Liquid density.
Viscosity of liquids as a function of pressure.
Oil formation volume factor.
Solution gas- oil ratio. Shrinkage of separator oil to tank oil.
Hydrocarbon analysis of reservoir and produced fluids.
8/17/2015 66
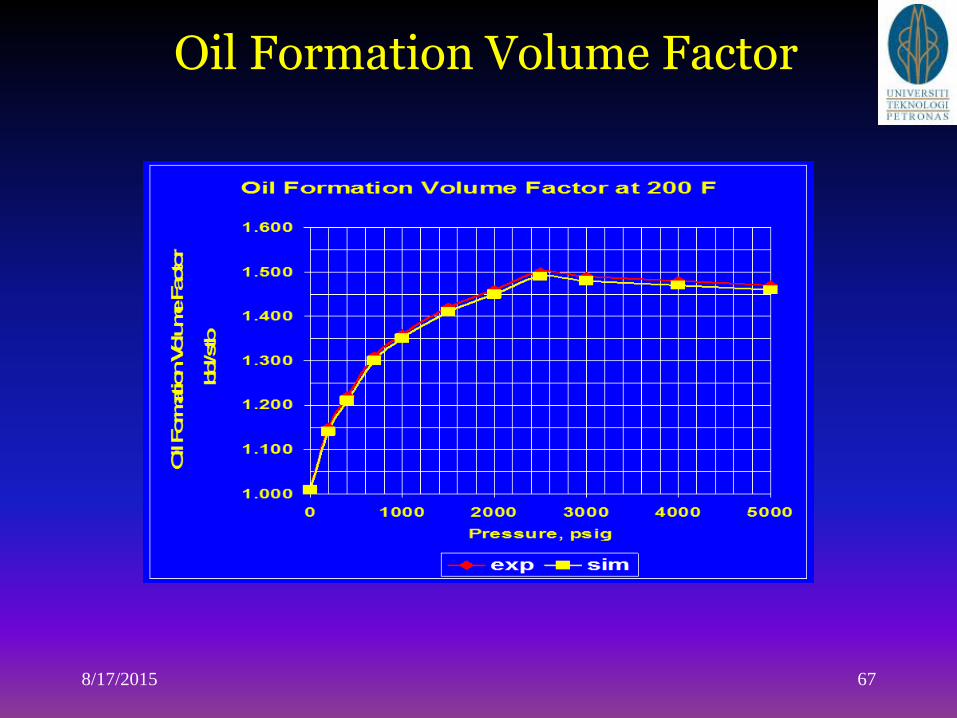
Oil Formation Volume Factor
8/17/2015 67
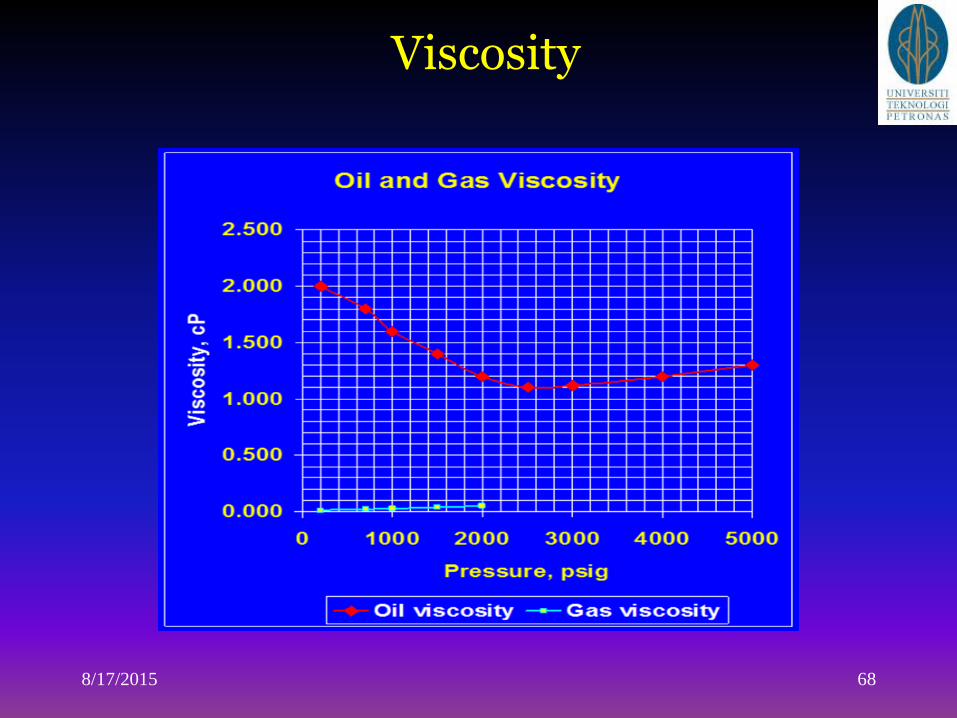
Viscosity
8/17/2015 68
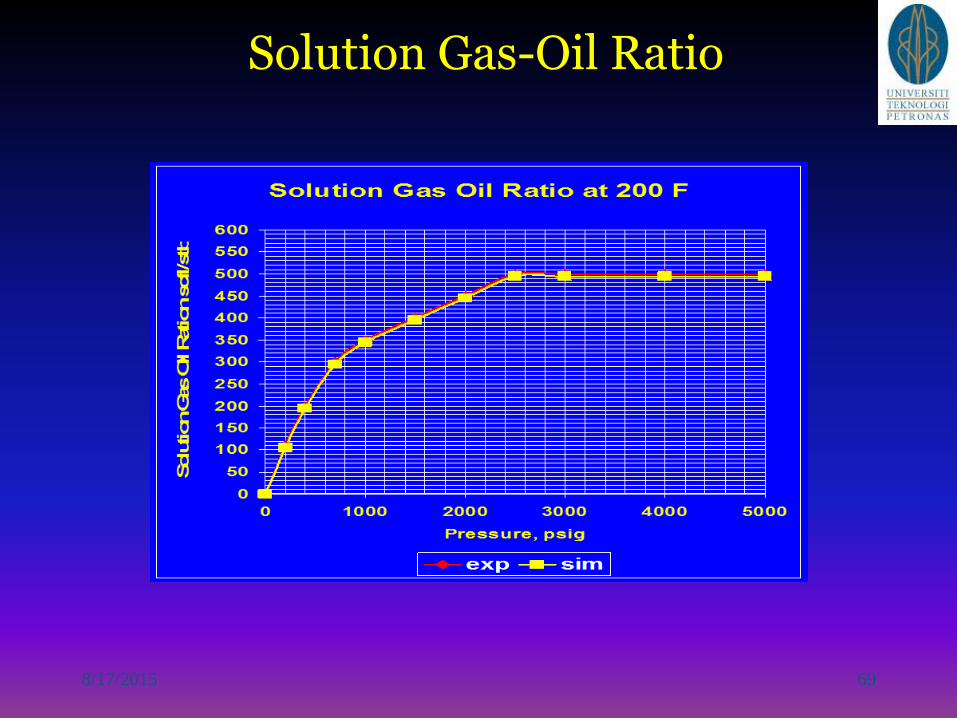
Solution Gas-Oil Ratio
8/17/2015 69
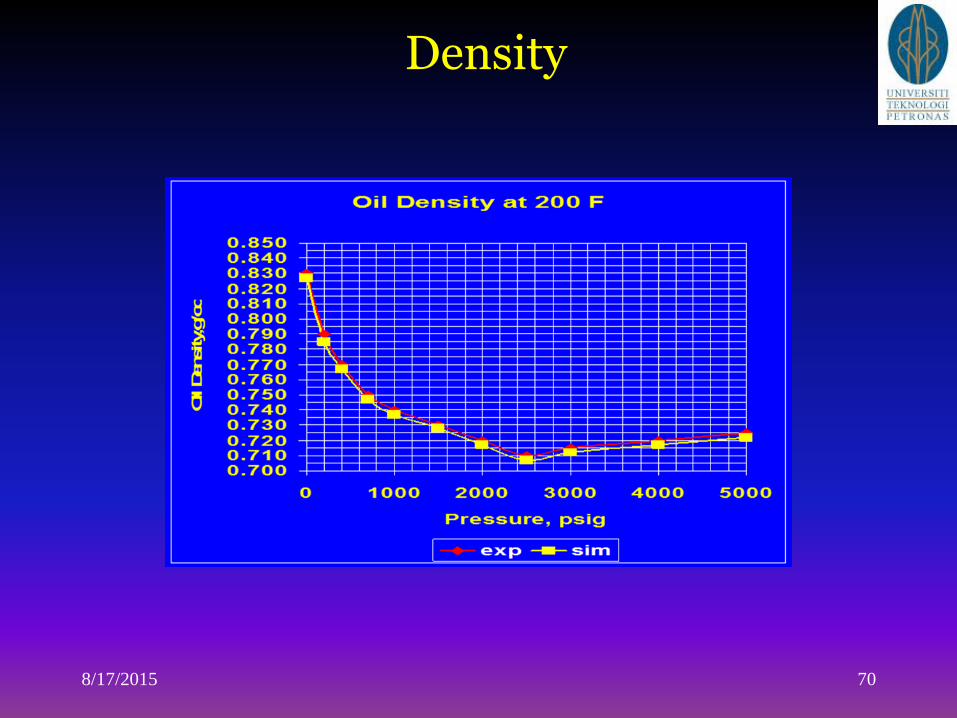
Density
8/17/2015 70