Embed Size (px)
Citation preview
LOSS AVERSE INVESTINGI N V E S T I N G W I T H A N E M P H A S I S O N C A P I TA L P R E S E RVAT I O N
P V G A S S E T M A N A G E M E N T
L O S S AV E R S E I N V E S T I N G
PVG Loss Averse Equity Income
Market Cycle Analysis
2001 – 2007 and 2007 - 2016
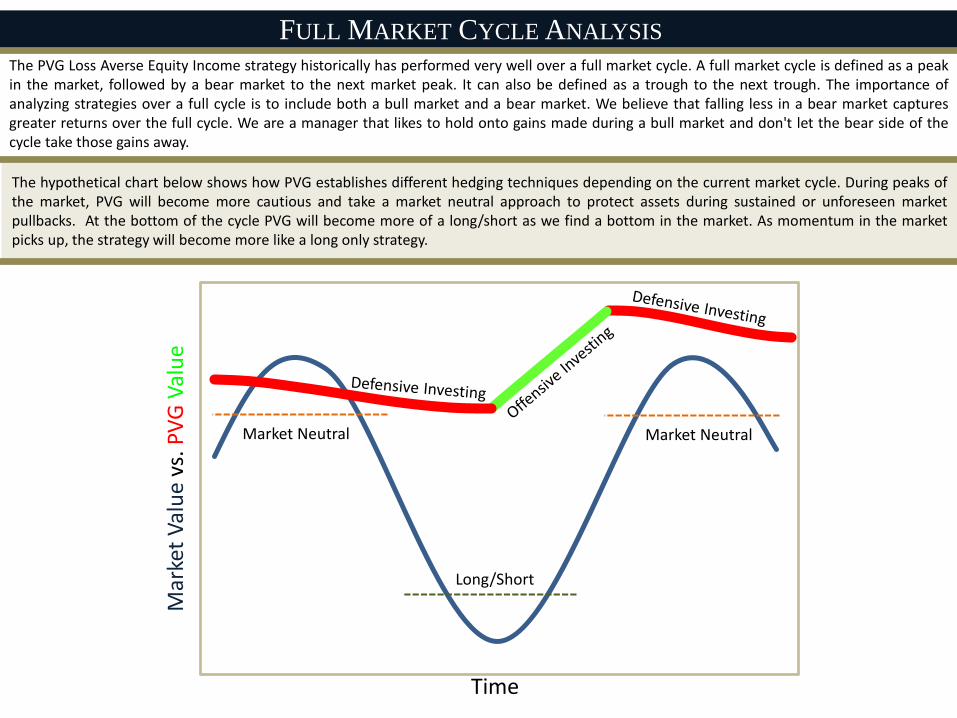
The hypothetical chart below shows how PVG establishes different hedging techniques depending on the current market cycle. During peaks ofthe market, PVG will become more cautious and take a market neutral approach to protect assets during sustained or unforeseen marketpullbacks. At the bottom of the cycle PVG will become more of a long/short as we find a bottom in the market. As momentum in the marketpicks up, the strategy will become more like a long only strategy.
The PVG Loss Averse Equity Income strategy historically has performed very well over a full market cycle. A full market cycle is defined as a peakin the market, followed by a bear market to the next market peak. It can also be defined as a trough to the next trough. The importance ofanalyzing strategies over a full cycle is to include both a bull market and a bear market. We believe that falling less in a bear market capturesgreater returns over the full cycle. We are a manager that likes to hold onto gains made during a bull market and don't let the bear side of thecycle take those gains away.
FULL MARKET CYCLE ANALYSIS
Market Neutral Market Neutral
Mar
ket
Val
ue
vs. P
VG
Val
ue
Time
Long/Short
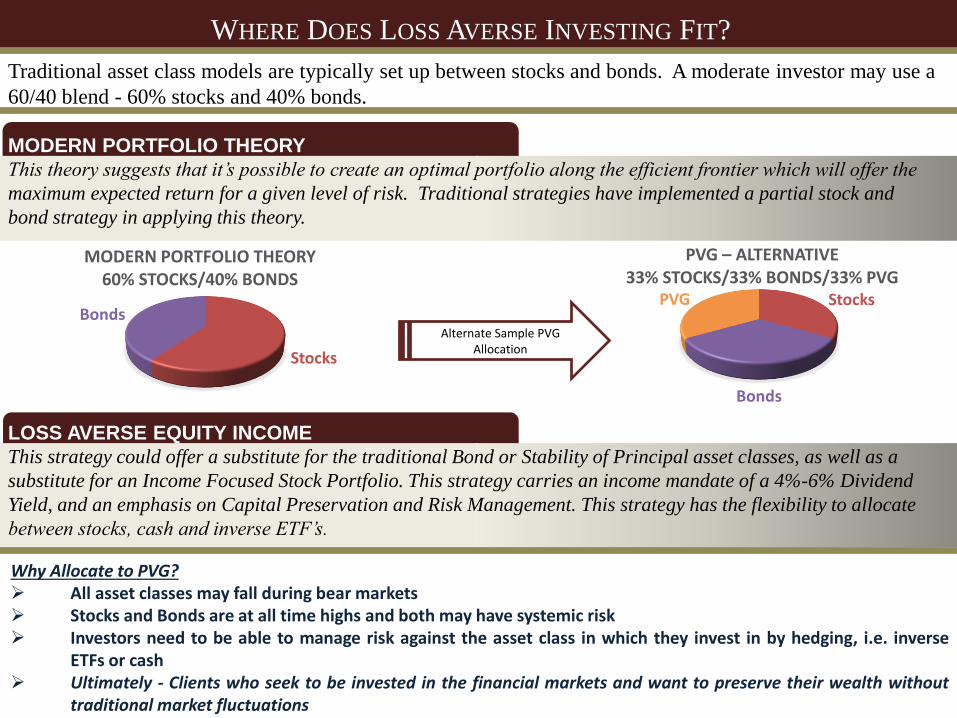
WHERE DOES LOSS AVERSE INVESTING FIT?
Traditional asset class models are typically set up between stocks and bonds. A moderate investor may use a
60/40 blend - 60% stocks and 40% bonds.
MODERN PORTFOLIO THEORY
This theory suggests that it’s possible to create an optimal portfolio along the efficient frontier which will offer the
maximum expected return for a given level of risk. Traditional strategies have implemented a partial stock and
bond strategy in applying this theory.
LOSS AVERSE EQUITY INCOME
This strategy could offer a substitute for the traditional Bond or Stability of Principal asset classes, as well as a
substitute for an Income Focused Stock Portfolio. This strategy carries an income mandate of a 4%-6% Dividend
Yield, and an emphasis on Capital Preservation and Risk Management. This strategy has the flexibility to allocate
between stocks, cash and inverse ETF’s.
Stocks
Bonds
PVG
PVG – ALTERNATIVE 33% STOCKS/33% BONDS/33% PVG
Stocks
Bonds
MODERN PORTFOLIO THEORY 60% STOCKS/40% BONDS
Alternate Sample PVG Allocation
Why Allocate to PVG? All asset classes may fall during bear markets Stocks and Bonds are at all time highs and both may have systemic risk Investors need to be able to manage risk against the asset class in which they invest in by hedging, i.e. inverse
ETFs or cash Ultimately - Clients who seek to be invested in the financial markets and want to preserve their wealth without
traditional market fluctuations
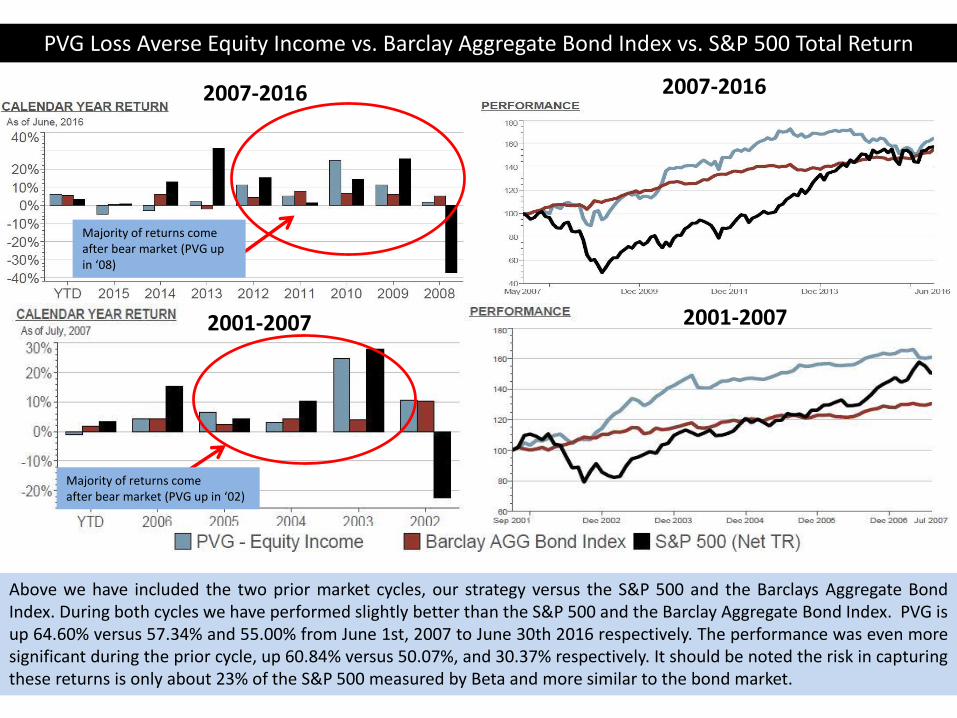
PVG Loss Averse Equity Income vs. Barclay Aggregate Bond Index vs. S&P 500 Total Return
2007-2016 2007-2016
Majority of returns comeafter bear market (PVG up in ‘08)
Above we have included the two prior market cycles, our strategy versus the S&P 500 and the Barclays Aggregate BondIndex. During both cycles we have performed slightly better than the S&P 500 and the Barclay Aggregate Bond Index. PVG isup 64.60% versus 57.34% and 55.00% from June 1st, 2007 to June 30th 2016 respectively. The performance was even moresignificant during the prior cycle, up 60.84% versus 50.07%, and 30.37% respectively. It should be noted the risk in capturingthese returns is only about 23% of the S&P 500 measured by Beta and more similar to the bond market.
2001-2007 2001-2007
Majority of returns comeafter bear market (PVG up in ‘02)
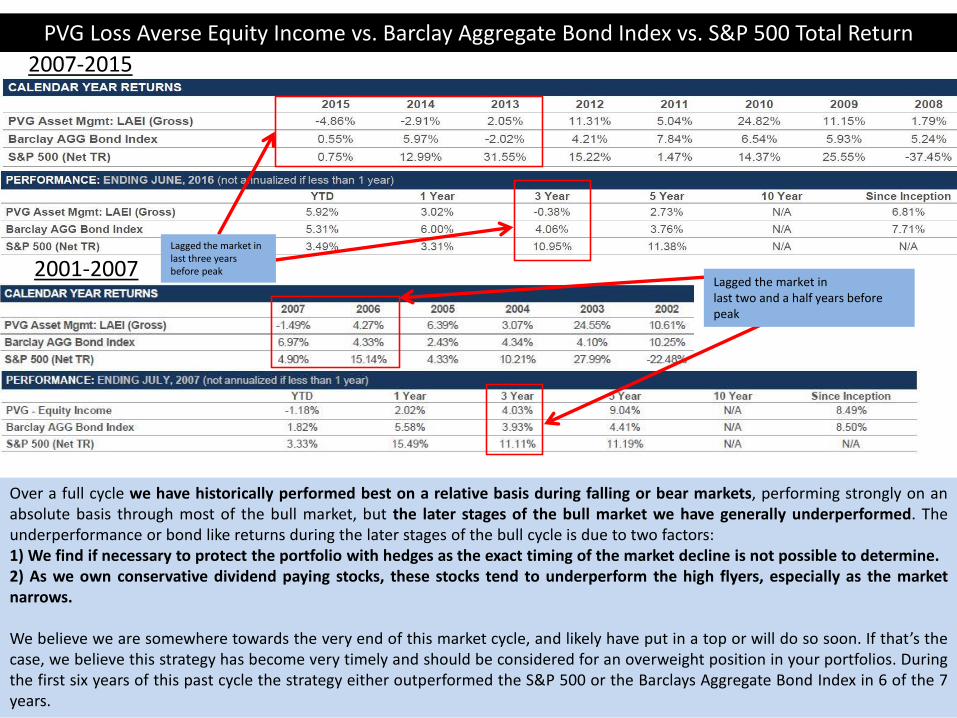
Lagged the market in last three years before peak
Over a full cycle we have historically performed best on a relative basis during falling or bear markets, performing strongly on anabsolute basis through most of the bull market, but the later stages of the bull market we have generally underperformed. Theunderperformance or bond like returns during the later stages of the bull cycle is due to two factors:1) We find if necessary to protect the portfolio with hedges as the exact timing of the market decline is not possible to determine.2) As we own conservative dividend paying stocks, these stocks tend to underperform the high flyers, especially as the marketnarrows.
We believe we are somewhere towards the very end of this market cycle, and likely have put in a top or will do so soon. If that’s thecase, we believe this strategy has become very timely and should be considered for an overweight position in your portfolios. Duringthe first six years of this past cycle the strategy either outperformed the S&P 500 or the Barclays Aggregate Bond Index in 6 of the 7years.
2007-2015
PVG Loss Averse Equity Income vs. Barclay Aggregate Bond Index vs. S&P 500 Total Return
2001-2007Lagged the market in last two and a half years before peak
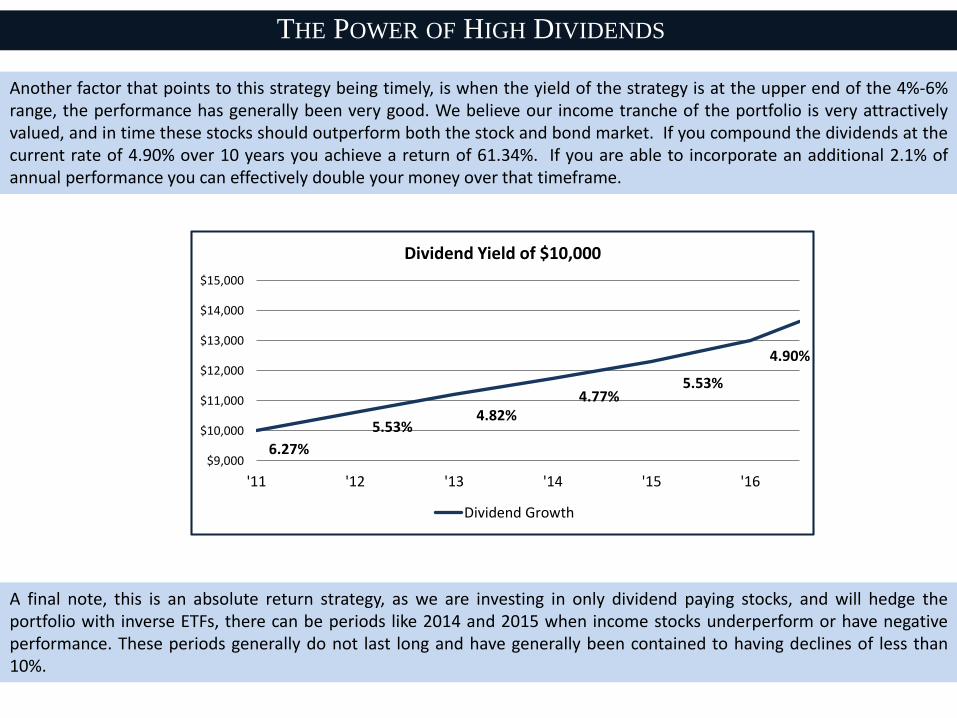
A final note, this is an absolute return strategy, as we are investing in only dividend paying stocks, and will hedge theportfolio with inverse ETFs, there can be periods like 2014 and 2015 when income stocks underperform or have negativeperformance. These periods generally do not last long and have generally been contained to having declines of less than10%.
6.27%
5.53%4.82%
4.77%5.53%
4.90%
$9,000
$10,000
$11,000
$12,000
$13,000
$14,000
$15,000
'11 '12 '13 '14 '15 '16
Dividend Yield of $10,000
Dividend Growth
Another factor that points to this strategy being timely, is when the yield of the strategy is at the upper end of the 4%-6%range, the performance has generally been very good. We believe our income tranche of the portfolio is very attractivelyvalued, and in time these stocks should outperform both the stock and bond market. If you compound the dividends at thecurrent rate of 4.90% over 10 years you achieve a return of 61.34%. If you are able to incorporate an additional 2.1% ofannual performance you can effectively double your money over that timeframe.
THE POWER OF HIGH DIVIDENDS
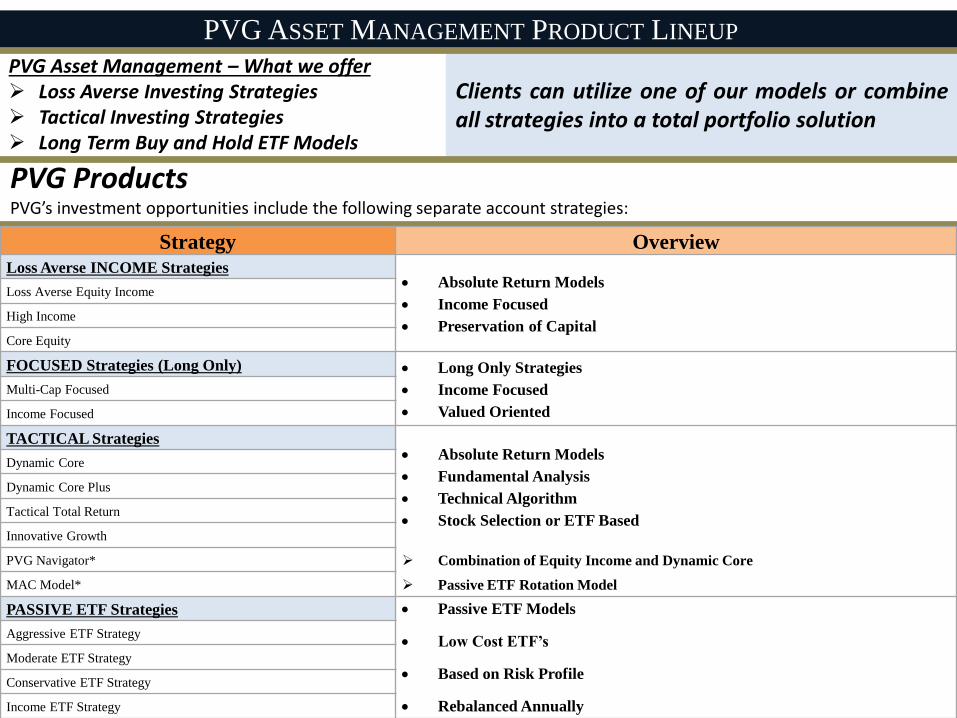
Clients can utilize one of our models or combineall strategies into a total portfolio solution
PVG ASSET MANAGEMENT PRODUCT LINEUP
PVG Asset Management – What we offer Loss Averse Investing Strategies Tactical Investing Strategies Long Term Buy and Hold ETF Models
PVG ProductsPVG’s investment opportunities include the following separate account strategies:
Strategy Overview
Loss Averse INCOME Strategies Absolute Return Models
Income Focused
Preservation of Capital
Loss Averse Equity Income
High Income
Core Equity
FOCUSED Strategies (Long Only) Long Only Strategies
Income Focused
Valued Oriented
Multi-Cap Focused
Income Focused
TACTICAL Strategies Absolute Return Models
Fundamental Analysis
Technical Algorithm
Stock Selection or ETF Based
Dynamic Core
Dynamic Core Plus
Tactical Total Return
Innovative Growth
PVG Navigator* Combination of Equity Income and Dynamic Core
MAC Model* Passive ETF Rotation Model
PASSIVE ETF Strategies Passive ETF Models
Low Cost ETF’s
Based on Risk Profile
Rebalanced Annually
Aggressive ETF Strategy
Moderate ETF Strategy
Conservative ETF Strategy
Income ETF Strategy
6898 S. University Blvd. | Centennial, CO 80122 | 800-777-0818
P V G A S S E T M A N A G E M E N T
L O S S AV E R S E I N V E S T I N G
WWW.PVGASSETMANAGEMENT.COM
Are Not FDIC Insured Are Not Bank Guaranteed May Lose Value
Investment Products:
Performance results are presented in U.S. dollars and are gross-of-actual-management fees and trading expenses of the composite and reflect the reinvestment of dividends
and capital gains. Actual fees may vary based on, among other factors, account size and custodial relationship. *Annual returns are compounded over the specified period.
The current dividend yield is calculated gross of fees as of quarter end date and is the expected forward yield. No current or prospective client should assume future
performance of any specific investment strategy will be profitable or equal to past performance levels. All investment strategies have the potential for profit or loss. Changes in
investment strategies, contributions or withdrawals may cause the performance results of your portfolio to differ materially from the reported composite performance. Different
types of investments involve varying degrees of risk, and there can be no assurance that any specific investment will either be suitable or profitable for a client's investment
portfolio. PVG’s Portfolio Risk Spectrum is based off a number of factors including portfolio structure, holdings, weighting and risk measures. It is not meant to define the
client’s risk profile or appetite when investing with PVG. The Portfolio Risk Spectrum may change from the current position at any time depending on the factors stated for
measurement. Historical performance results for market indices generally do not reflect the deduction of transaction and/or custodial charges or the deduction of an
investment-management fee, the incurrence of which would have the effect of decreasing historical performance results. Economic factors, market conditions, and investment
strategies will affect the performance of any portfolio and there are no assurances that it will match or outperform any particular benchmark. Portfolios in the composite
utilize levered index products. Leveraged ETFs are considered risky. The use of leverage strategies by a fund increases the risk to the fund and magnifies gains or losses on the
investment. You could incur significant losses even if the long-term performance of the underlying index showed a gain. Most leveraged ETFs “reset” daily. Due to the effect
of compounding, their performance over longer periods of time can differ significantly from the performance of their underlying index or benchmark during the same period of
time. Exchange traded funds (ETFs) are offered by prospectus only. Investors should consider a fund’s investment objective, risks, charges, and expenses carefully before
investing. The prospectus, which contains this and other important information, is available from your Financial Advisor and should be read carefully before investing. The
investment return and principal value of an investment will fluctuate, so that an investor’s shares, when redeemed, may be worth more or less than their original cost. ETFs
trade like stocks and may trade for less than their net asset value. The S&P500 Total Return Index is the total return version of the S&P 500 Index which includes the effects of
reinvested dividends. The S&P 500 Index is a capitalization-weighted index of 500 stocks designed to measure performance of the broad domestic economy through changes in
the aggregate market value of 500 stocks representing all major industries. The U.S. Aggregate Bond Index is a broad-based benchmark that measures the investment grade,
U.S. dollar-denominated, fixed-rate taxable bond market, including Treasuries, government-related and corporate securities, MBS (agency fixed-rate and hybrid ARM
passthroughs), ABS, and CMBS. The U.S. Aggregate rolls up into other Barclay’s flagship indices, such as the multi-currency Global Aggregate Index and the U.S. Universal
Index, which includes high yield and emerging markets debt. The U.S. Aggregate Index was created in 1986, with index history backfilled to January 1, 1976.The investment
strategy and types of securities held by the comparison indices may be substantially different from the investment strategy and the types of securities held by the PVG Equity
Income strategy. PVG Asset Management (“PVG”) is a registered investment advisor with the United States Securities Exchange Commission (the “SEC”). SEC registration
does not constitute an endorsement of the firm by the Commission nor does it indicate that the advisor has attained a particular level of skill or ability. Inception for the Equity
Income strategy is 10/1/2010; prior performance represents the Income portion of the Balanced Strategy Composite, which PVG believes was managed with the same
investment goals. Composite performance represents the results of the PVG management team, which has changed over time due to retirements and new staff. Additional
information is available upon request.


![PVG 32 Proportional Valve Group Installation Guide€¦ · LSB B A LSA P109135 Product Rated Pressure PVG 32 w. PVS 300 bar [4351 psi] PVG 32 w. PVSI 350 bar [5076 psi] PVG 32 w](https://img.pdfslide.us/doc/110x75/6061ebbf8add853ee82334b4/pvg-32-proportional-valve-group-installation-guide-lsb-b-a-lsa-p109135-product-rated.jpg)


![[PVG] B.o.B - Magic](https://img.pdfslide.us/doc/110x75/55cf8f4c550346703b9ae7e5/pvg-bob-magic.jpg)