Embed Size (px)
Citation preview
Available online at www.sciencedirect.com Construction
www.elsevier.com/locate/conbuildmat
Construction and Building Materials 22 (2008) 370–383
and Building
MATERIALS
Impact properties of geopolymer based extrudates incorporatedwith fly ash and PVA short fiber
Zhang Yunsheng a,*, Sun Wei a, Li Zongjin b, Zhou Xiangming b,Eddie b, Chau Chungkong b
a School of Materials Science and Engineering, Southeast University, Nanjing 210096, PR Chinab Department of Civil Engineering, The Hong Kong University of Science and Technology, Clear water Bay, Kowloon, PR China
Received 6 July 2006; received in revised form 24 August 2006; accepted 25 August 2006Available online 13 November 2006
Abstract
A PVA short fiber reinforced fly ash-geopolymer composites manufactured by extrusion technique (SFRGC) is developed in thisstudy. The effects of fly ash content and fiber volume fraction on the rheological and impact behaviors of SFRGC are systemically inves-tigated. Freeze–thaw cycles and sulfuric acid attack tests are also employed to study the durability of SFRGC. The experimental resultsshow that for normally curing SFRGC, the addition of PVA fiber increases greatly the ductility of SFRGC, especially in the case of highvolume fraction of fiber, resulting in the change of impact failure mode from brittle pattern to ductile one. As a result, a great increase inthe impact toughness is seen in SFRGC with high fiber content. Comparatively the addition of fly ash exhibits obvious influence on therhelogical and impact behaviors. The spherical shape of fly ash can greatly improve the extrudability of fresh SFRGC pastes. SFRGCwithout or with low percentage of fly ash possesses very high impact strength and stiffness. However, when too much fly ash is incor-porated, the impact resistance of SFRGC is reduced rapidly. For SFRGC undergone freeze–thaw cycles and 1 month of sulfuric acidsolution attack, only 5% or less of loss in impact strength is observed. The corresponding microstructure and failure mechanism are alsoexplored by Laser particle size analysis (LSA), X-ray diffraction analysis (XRD), Scanning Electron Microscope (SEM), and Mercuryintrusion porosimetry (MIP) techniques.� 2006 Elsevier Ltd. All rights reserved.
Keywords: Extrusion technique; Geopolymeric cement; Fly ash, PVA short fiber; Rheological behavior; Impact properties; Durability; Microstructure
1. Introduction
Recent years have seen a great development in new typeof high performance inorganic cementitious materials—geopolymeric cement around the world. Geopolymericcement is one type of three dimensional CaO-free alumino-silicate gel binders, which was firstly introduced into theinorganic cementitious world by Davidovits in the later1970s [1]. Geopolymeric cement can be synthesized by mix-ing aluminosilicate reactive materials with less or no CaOcomponent (such as metakaolin, dehydrated clay) andstrongly alkaline solutions (such as NaOH or KOH), then
0950-0618/$ - see front matter � 2006 Elsevier Ltd. All rights reserved.
doi:10.1016/j.conbuildmat.2006.08.006
* Corresponding author.E-mail address: [email protected] (Z. Yunsheng).
curing at room temperature. Under a strongly alkalinesolution, aluminosilicate reactive materials are rapidly dis-solved into solution to form free SiO4 and AlO4 tetrahedralunits. With the development of reaction, mix water is grad-ually split out and these SiO4 and AlO4 tetrahedral unitsare linked alternatively to yield polymeric precursors(–SiO4–AlO4–, or –SiO4–AlO4–SiO4–, or –SiO4–AlO4–SiO4–SiO4–) by sharing all oxygen atoms between twotetrahedral units, and thereby forming monolithic like geo-polymeric cement products [2].
Geopolymeric cement made with reasonable mix-designand formulation can exhibit superior properties to Port-land cement [3–6]: The production of geopolymeric cementrequires much lower calcining temperature (600–800 �C)and emits 80–90% less CO2 than Portland cement.
Z. Yunsheng et al. / Construction and Building Materials 22 (2008) 370–383 371
Reasonable strength can be gained in a short period at roomtemperature. In most cases, 70% of the final compressivestrength is developed in the first 12 h. Low permeability,comparable to natural granite, is another property of geo-polymeric cement. It is also reported that resistance to fireand acid attacks for geopolymeric cement are substantiallysuperior to those for Portland cement. Apart from the highearly strength, low permeability and good fire and acid resis-tance, geopolymeric cement also can attain higher uncon-fined compressive strength and shrink much less thanPortland cement. Other documented properties includegood resistance to freeze–thaw cycles as well as excellentsolidification of heavy metal ions. These properties makegeopolymeric cement a strong candidate for substitutingPortland cement applied in the fields of civil, bridge, pave-ment, hydraulic, underground and military engineering [7].
Extrusion is an important plastic forming process thatconsists of pushing a viscous, dough-like plastic mixturethrough a shaped die under high compressive and highshear forces generated by extruder. The process is continu-ous and simpler to use than other commonly used methods(Casting, Slurry infiltration, Spray suction, and Hatschekprocess), making it most suitable for industrial mass pro-duction. In addition, Extrusion technique enables intracta-ble substances to be shaped into various products ofcomplicated cross-section with minimal water contentwhich is critical in developing high strength, low permeabil-ity and excellent durability of products [8–25].
Fly ash is a by-product with pozzolanic reactivity fromcoal-fired power stations. Millions of tons of it are gener-ated each year around the worlds. Only in china, the totalamount of fly ash was accumulated up to 4 billion tons in2002, which occupied about 4000–5000 hectares of areas,and 200 million or more tons are still generated each year.However, less than 30% of fly ash is effectively used. Inorder to enlarge the applications, the use of fly ash as par-tial replacement of metakaolin to synthesis geopolymericcement is systematically investigated in this study.
Fiber reinforcement has been employed in variouscementitious materials to improve flexural, impact behav-ior, toughness, and to shift failure mode. The use of shortfiber is very preferable due to the simplicity and economicalnature in fabrication. Considering the quasi-brittle charac-teristics of hardened geopolymeric cement paste, polyvinylalcohol (PVA) short fiber is incorporated to improve theductility of hardened geopolymeric cement in this study.
In this paper, a PVA short fiber reinforced fly ash-geo-polymer composites (SFRGC) manufactured by extrusiontechnique is developed. The effects of fly ash and fiber onthe rheological and impact behaviors of SFRGC are sys-temically investigated. In order to better understand the
Table 1Chemical compositions and physical properties of raw materials
Raw materials SiO2 Al2O3 Fe2O3 CaO MgO TiO2
Metakaolin 62.97 26.91 2.62 0.60 – 1.24Fly ash 60.70 24.72 6.90 0.70 1.13 –
impact behavior of the SFRGC with different fly ash andfiber contents, laser particle size analysis (LSA), X-ray dif-fraction analysis (XRD), Scanning Electron Microscope(SEM), Mercury intrusion porosimetry (MIP) are employedto explore the microstructure and failure mechanism. Inaddition, the freeze–thaw, sulfuric acid attack tests are alsoconducted to characterize the durability performance ofSFRGC.
2. Materials and methods
2.1. Materials
Metakaolin used in this study is obtained by calciningpure kaolin at 700 �C for 12 h. Grade I fly ash, similar toClass F fly ash according to ASTM, is supplied by Qingz-hou power plant, Hong Kong, PR China. Chemical gradeNaOH and sodium silicate solution with the molar ratio ofSiO2 to Na2O of 3.2 are used as alkaline reagents. Twotypes of silica sand (600–300 lm and 150–90 lm in diame-ter) with the ratio of 0.6:0.4 and totally 32.5% by weight ofthe binder system are used as aggregate. PVA fiber is usedas reinforcement materials. The fiber length is 6 mm withan average diameter of 14 lm and a density of 1300 kg/m3. The average tensile strength and elastic modulus ofthe fiber are 1500 MPa and 36 GPa. The chemical compo-sitions and physical properties of raw materials are listed inTable 1.
2.2. Mixture proportions and specimen preparation
2.2.1. Mixture proportions
The mixture proportions of various SFRGC used toinvestigate the effect of fly ash and fiber on the rheological,impact and durability behaviors are summarized in Table2. Fb1 and Fb2 are used to study the effect of fiber volumefraction, while FA10 to FA50 are to investigate the effect offly ash content. The mixture proportion of the pureSFRGC without fly ash and fiber, i.e. Fb0, serves as a con-trol sample and its mix proportion is given as follows:
molar SiO2
molar Al2O3
¼ 4:5;molar Na2O
molar Al2O3
¼ 0:8;
molar H2O
molar Na2O¼ 6:4
The control sample is an optimum one, which is opti-mized in the literature [26].
2.2.2. Specimen preparation
To uniformly disperse PVA fibers, fibers and metakao-line powder are first dry-mixed for 3 min in a Hobart
MnO K2O P2O5 SO3 L.O.I Specific surface (m2/kg)
0.01 0.18 0.74 – 4.44 350– – – 1.50 2.35 400
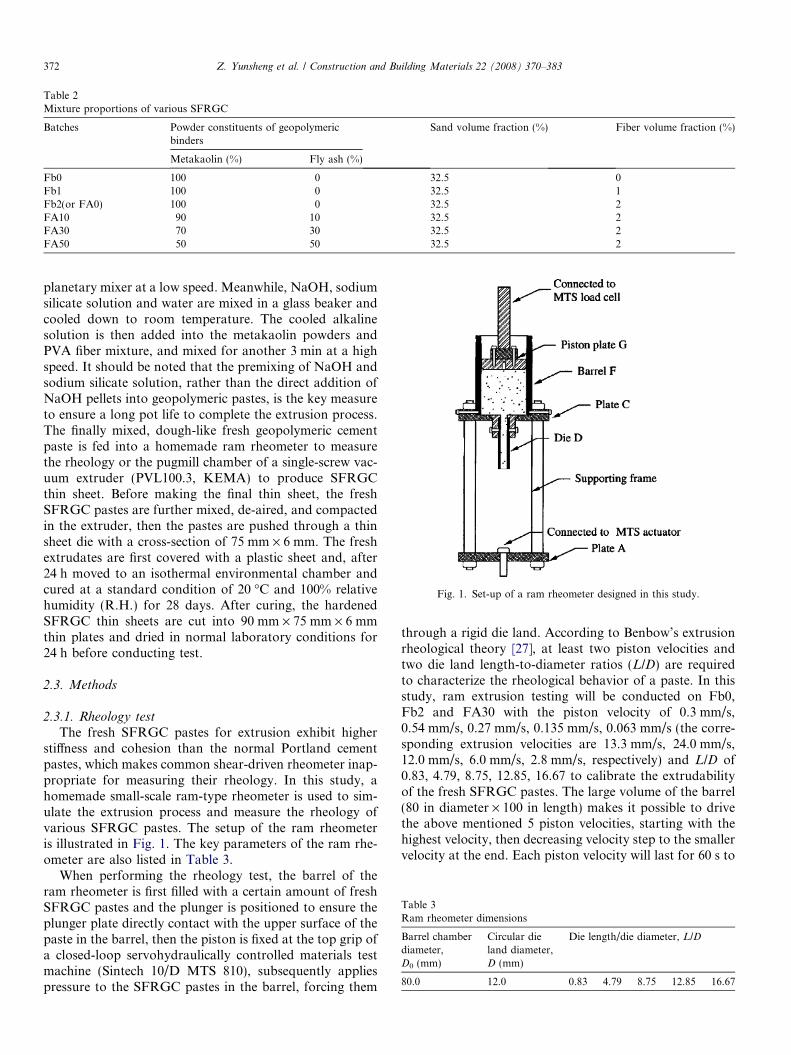
Table 2Mixture proportions of various SFRGC
Batches Powder constituents of geopolymericbinders
Sand volume fraction (%) Fiber volume fraction (%)
Metakaolin (%) Fly ash (%)
Fb0 100 0 32.5 0Fb1 100 0 32.5 1Fb2(or FA0) 100 0 32.5 2FA10 90 10 32.5 2FA30 70 30 32.5 2FA50 50 50 32.5 2
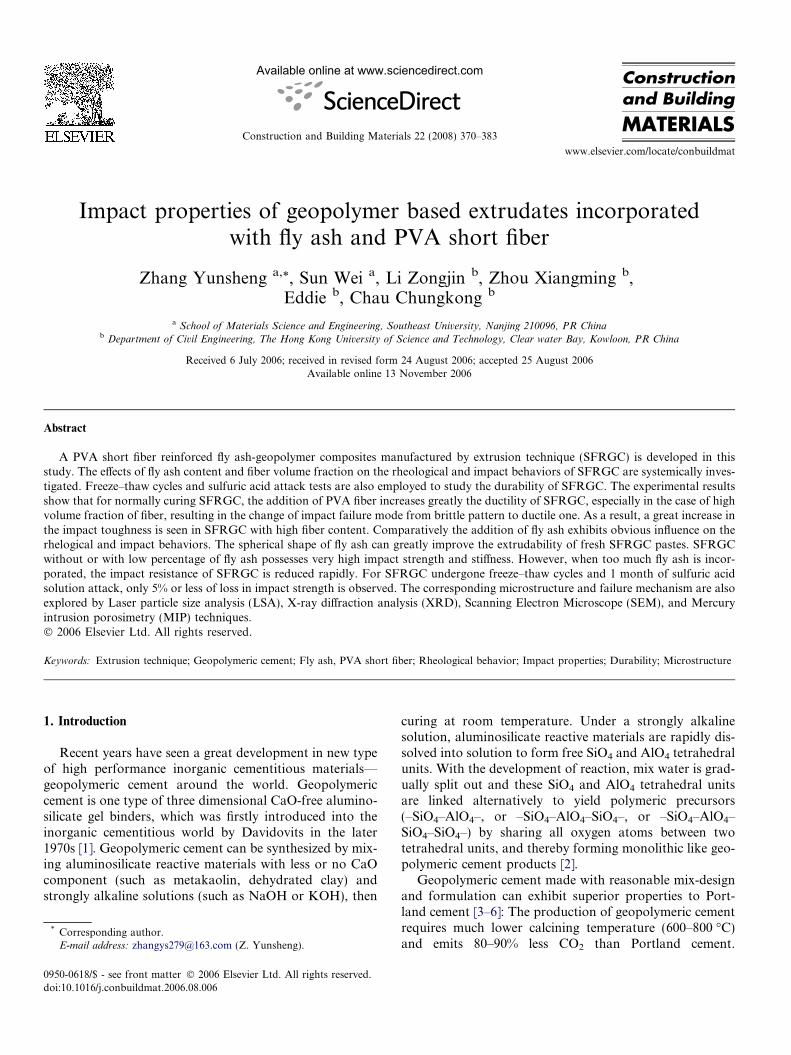
Fig. 1. Set-up of a ram rheometer designed in this study.
Table 3Ram rheometer dimensions
Barrel chamberdiameter,D0 (mm)
Circular dieland diameter,D (mm)
Die length/die diameter, L/D
80.0 12.0 0.83 4.79 8.75 12.85 16.67
372 Z. Yunsheng et al. / Construction and Building Materials 22 (2008) 370–383
planetary mixer at a low speed. Meanwhile, NaOH, sodiumsilicate solution and water are mixed in a glass beaker andcooled down to room temperature. The cooled alkalinesolution is then added into the metakaolin powders andPVA fiber mixture, and mixed for another 3 min at a highspeed. It should be noted that the premixing of NaOH andsodium silicate solution, rather than the direct addition ofNaOH pellets into geopolymeric pastes, is the key measureto ensure a long pot life to complete the extrusion process.The finally mixed, dough-like fresh geopolymeric cementpaste is fed into a homemade ram rheometer to measurethe rheology or the pugmill chamber of a single-screw vac-uum extruder (PVL100.3, KEMA) to produce SFRGCthin sheet. Before making the final thin sheet, the freshSFRGC pastes are further mixed, de-aired, and compactedin the extruder, then the pastes are pushed through a thinsheet die with a cross-section of 75 mm · 6 mm. The freshextrudates are first covered with a plastic sheet and, after24 h moved to an isothermal environmental chamber andcured at a standard condition of 20 �C and 100% relativehumidity (R.H.) for 28 days. After curing, the hardenedSFRGC thin sheets are cut into 90 mm · 75 mm · 6 mmthin plates and dried in normal laboratory conditions for24 h before conducting test.
2.3. Methods
2.3.1. Rheology test
The fresh SFRGC pastes for extrusion exhibit higherstiffness and cohesion than the normal Portland cementpastes, which makes common shear-driven rheometer inap-propriate for measuring their rheology. In this study, ahomemade small-scale ram-type rheometer is used to sim-ulate the extrusion process and measure the rheology ofvarious SFRGC pastes. The setup of the ram rheometeris illustrated in Fig. 1. The key parameters of the ram rhe-ometer are also listed in Table 3.
When performing the rheology test, the barrel of theram rheometer is first filled with a certain amount of freshSFRGC pastes and the plunger is positioned to ensure theplunger plate directly contact with the upper surface of thepaste in the barrel, then the piston is fixed at the top grip ofa closed-loop servohydraulically controlled materials testmachine (Sintech 10/D MTS 810), subsequently appliespressure to the SFRGC pastes in the barrel, forcing them
through a rigid die land. According to Benbow’s extrusionrheological theory [27], at least two piston velocities andtwo die land length-to-diameter ratios (L/D) are requiredto characterize the rheological behavior of a paste. In thisstudy, ram extrusion testing will be conducted on Fb0,Fb2 and FA30 with the piston velocity of 0.3 mm/s,0.54 mm/s, 0.27 mm/s, 0.135 mm/s, 0.063 mm/s (the corre-sponding extrusion velocities are 13.3 mm/s, 24.0 mm/s,12.0 mm/s, 6.0 mm/s, 2.8 mm/s, respectively) and L/D of0.83, 4.79, 8.75, 12.85, 16.67 to calibrate the extrudabilityof the fresh SFRGC pastes. The large volume of the barrel(80 in diameter · 100 in length) makes it possible to drivethe above mentioned 5 piston velocities, starting with thehighest velocity, then decreasing velocity step to the smallervelocity at the end. Each piston velocity will last for 60 s to
0 1 2 3 4 5 6 7 8 9 10
-25
-20
-15
-10
-5
0
5
10
15
20
25
Tem
pera
ture
(°C
)
Time (hour)
Fig. 3. Typical temperature change for one freeze–thaw cycle.
Z. Yunsheng et al. / Construction and Building Materials 22 (2008) 370–383 373
ensure that a stable state is observed and thus the accuracyof data is assured. The length of each plateau is propor-tional to its piston velocity. A data acquisition system isconnected to the ram rheometer, and the resulting pistonload-displacement is recorded. Typical load-displacementcurve obtained during ram test is displayed in Fig. 2. Itshould be note that the first plateau for load-displacementcurve is used to pre-pressure the SFRGC pastes at thebeginning of the ram test, which will not be suitable forthe calculation of rheological parameters. The extrusionpressure of the SFRGC pastes are evaluated by dividingthe load required for ram test by the cross-sectional areaof the die land.
2.3.2. Impact test
The thin plate specimens with the dimensions of75 mm · 90 mm · 6 mm are prepared for impact test onan instrument impact tester (ITR-200, RADMANA).When a test starts, the punch is raised to a specific heightand then pushed down by high-pressure gas. The averagevelocity of the punch before and after impact is adjustedto approximately 3 m/s. The peak resistant load, fractureenergy, and load gradient of the specimen can be measuredand recorded. These parameters provide useful indices forimpact strength, toughness, and stiffness of the SFRGCspecimen.
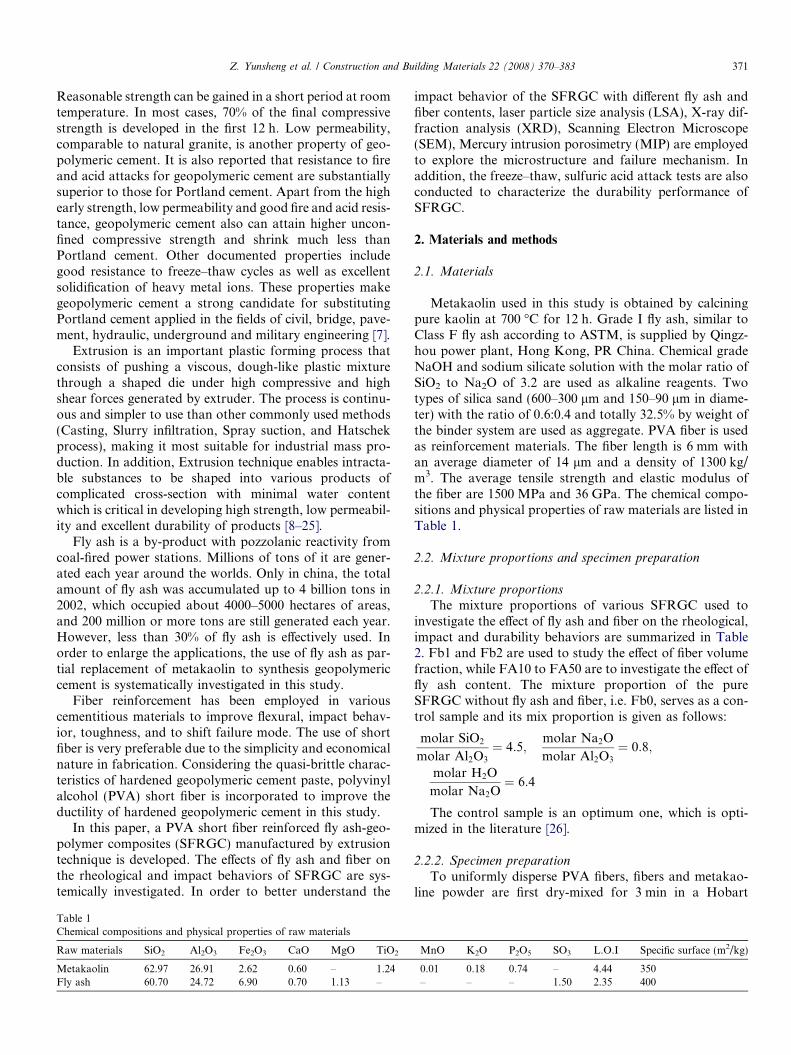
2.3.3. Freezing and thawing tests
With respect to the freeze–thaw test, one freeze–thawcycle involves the alternate lowering the temperature ofspecimen from 4.4 to �20 �C, and raising temperaturefrom �20 to 4.4 �C. One cycle lasts 9h including 4 h offreezing, 2.5 h of thawing, a certain amount of time fordeceasing and raising temperature, and time for drainingand filling water in the chamber used for depositing speci-mens. Fig. 3 shows the typical temperature change for onecycle. All the steps are automatically controlled by com-puter. For each batch, at least three samples are tested.The thin plates will be subjected to 20 freeze–thaw cycles.
-20 0 20 40 60 800
500
1000
1500
2000
2500
V0=13.3mm/s
V1=24.0mm/s
V2=12.0mm/s
V3=6.0mm/s
V4=2.8mm/s
Load
(N
)
Distance travelled by ram (mm)
Fig. 2. Typical load vs. stroke displacement curve.
2.3.4. Sulfuric acid attack test
The resistance to the acid solution attack in this study istested by immersion of SFRGC specimens in a solution ofsulfuric acid of pH=1. The acid solution is refreshed everyone week to ensure a relatively constant pH value. Theimpact test is conducted after 1 month of exposure. Thesurface images are also taken to study the effect of acidattack.
2.3.5. Microstructure analysis
Laser particle size analysis (LSA), X-ray diffractionanalysis (XRD), Scanning Electron Microscope (SEM)and Mercury intrusion porosimetry (MIP) are employedto examine the microstructure characteristics and impactfailure mechanism of the SFRGC.
2.3.5.1. LSA. To measure the particle size of raw materials,about 2 g of powder materials are added to a 100 ml beakerfully filled with water. About 0.5 g of sodium diphosphate(Na4P2O7), serving as dispersant, is added into the beakerto increase the dispersability of the powder materials. Aftera few minutes of vibration, the dispersed sample is pouredinto the chamber of the LSA particle Analyzer (CoulterLS2300) for testing. The testing duration is limited to10 min to avoid the possible hydration of the sample parti-cles. The data are recorded and analyzed automaticallywith Zirconia model by computer.
2.3.5.2. XRD. For the XRD test, samples from differentmixtures are finely crushed and collected at 28 days, andthen these crushed fractions are immersed for about 3 daysin an acetone to stop the further hydration process andremoved free water, subsequently oven-dried at 50 �C for12 h to eliminate the absorbed water. After that, these geo-polymeric fractions are further ground into very fine parti-cles, and sieved to remove most of the quartz sand andfiber. Therefore the diffraction lines representing quartztuned out to be vary quite a bit from sample to sample.This is an artifact that does not influence interpretationof the results of the present study and therefore it will beignored.
374 Z. Yunsheng et al. / Construction and Building Materials 22 (2008) 370–383
X-ray powder diffraction is recorded on a PhilipsPW1830 spectrometer using CuKa radiation with a scan-ning rate of 1� per min from 10� to 80�(2h). The wavelengthis selected as 15.40562 nm (Cu).
2.3.5.3. SEM. A JEOL-6300 SEM microscope is used toexamine the microstructure of the fractured composites atthe accelerating voltage of 15 kV. These samples that areused to conduct SEM observation are firstly dried at60 �C until the constant weight is reached. Then, these sam-ples are bonded on the sample holders with conductingglue, followed by 30-min sputter coating of carbon. Afterthat, the morphologies of the final products in samplesare observed at microscopic level using SEM.
2.3.5.4. MIP. An Autopore IV 9500 MIP is used for toinvestigate the porosity and pore size distribution of differ-ent SFRGC. The samples with size of approximate10 mm · 10 mm · 10 mm are obtained by cutting up theharden SFRGC pastes at an age of 28 days. These samplesare first oven-dried for 24 h at 50 �C to remove the physi-cally absorbed water in capillary, and then placed intothe glass penetrometer with the volume of 5 cc. After that,low pressure test is performed, followed by high pressuretest (the maximum mercury press reaches 30,000 psi). Theintrusion and evacuation of mercury is automatically con-trolled by computer with Autopore IV 9500 program. Thecumulative intrusion and differential pore volume vs. porediameter are also measured and recorded with an increaseof the pressure. The diameters of the pores intruded by themercury are calculated using ‘‘Washburn equation’’, with amercury contact angle of 130�.
3. Results and discussions
3.1. Rheological test program and results
Rheological behavior of fresh paste is very important tosuccessfully extrude thin sheet products. When the rheolog-ical behavior of SFRGC paste is not properly designed,defects such as lamination, surface fracture or edge tearwill form in the composites, thus reducing its finial mechan-ical and durable properties. It is well known that fly ashcan improve the fluidity of Portland cement paste. How-ever, it is not still understood that the effect of fly ash onthe rheological behaviors of the new type of geopolymericcement paste. In this study, rheological behavior of thefresh SFRGC pastes without and with fly ash is measuredto characterize the effect of fly ash. The effect of fiber on therheological behavior is also investigated by varying thefiber content from 0% to 2%. The ram extrusion mecha-nism can be well illustrated by the Benbow–Bridgwatermodel based on the assumption of plastic deformation inthe die entry and plug flow in the die land [27]. Accordingto this model, the total extrusion pressure drop Pe, throughcircular die with a die entry angle of 90� can be simply pre-sented by the following equation:
P e ¼ P 1 þ P 2
¼ 2ðr0 þ aV Þ lnðD0=DÞ þ 4ðs0 þ bV ÞðL=DÞ ð1Þ
where Pe is the overall extrusion pressure of piston ap-plied by MTS machine, while P1 and P2 are pressuredrops at the die entry and the die land, respectively; D0
and D are the barrel and the die land diameters, respec-tively; L is the die land length; V is the extrudate velocityin the die land; r0 is the initial bulk yield stress of freshSFRGC paste, i.e., the least stress to push SFRGC pastefrom the barrel into the die land; a is a factor character-izing the effect of velocity in the die entry, which is similarto a viscosity coefficient g; both r0 and a are regarded asthe material constants independent of die geometries andextrusion velocities and only associated with the move-ment of the paste as it flows from the barrel into the entryof the die land. s0 is the initial wall shear yield stress ofthe fresh SFRGC paste near the die land wall, i.e., theleast shear stress to overcome the wall shear stress exertedby the wall of the die land; b is a factor characterizing theeffect of velocity on die land extrusion pressure drop;Both s0 and b are also regarded as the material constantsand only associated with the resistance to flow in the dieland.
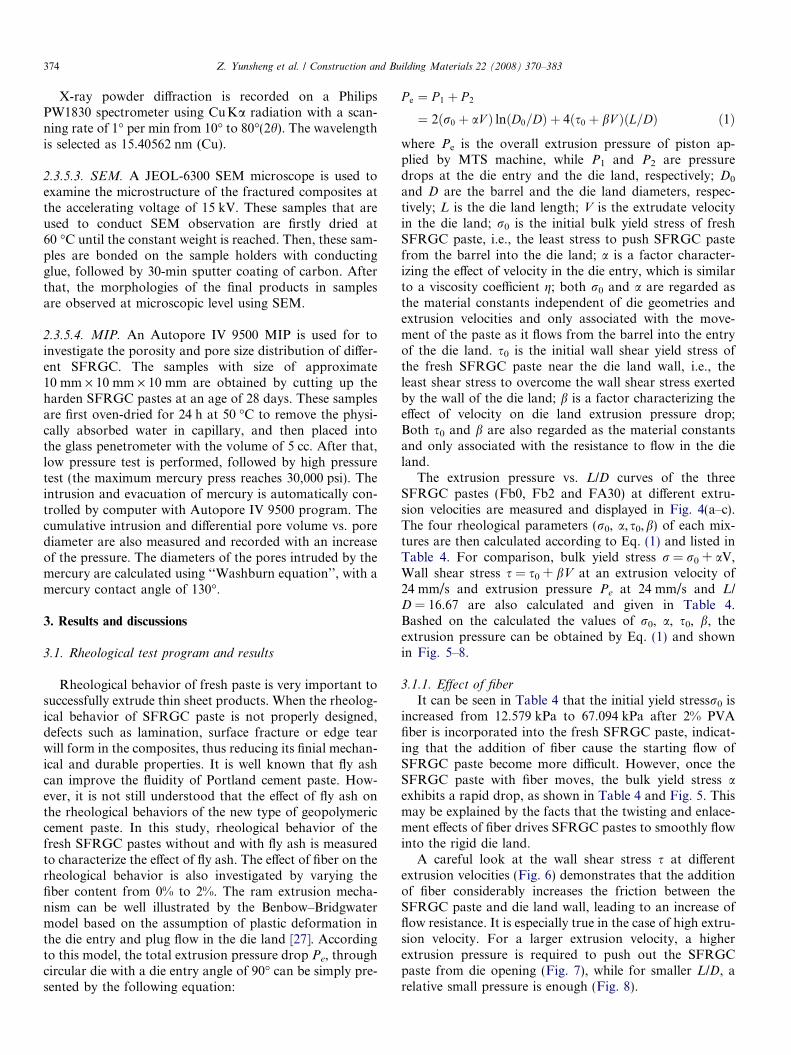
The extrusion pressure vs. L/D curves of the threeSFRGC pastes (Fb0, Fb2 and FA30) at different extru-sion velocities are measured and displayed in Fig. 4(a–c).The four rheological parameters (r0, a,s0,b) of each mix-tures are then calculated according to Eq. (1) and listed inTable 4. For comparison, bulk yield stress r = r0 + aV,Wall shear stress s = s0 + bV at an extrusion velocity of24 mm/s and extrusion pressure Pe at 24 mm/s and L/
D = 16.67 are also calculated and given in Table 4.Bashed on the calculated the values of r0, a, s0, b, theextrusion pressure can be obtained by Eq. (1) and shownin Fig. 5–8.
3.1.1. Effect of fiber
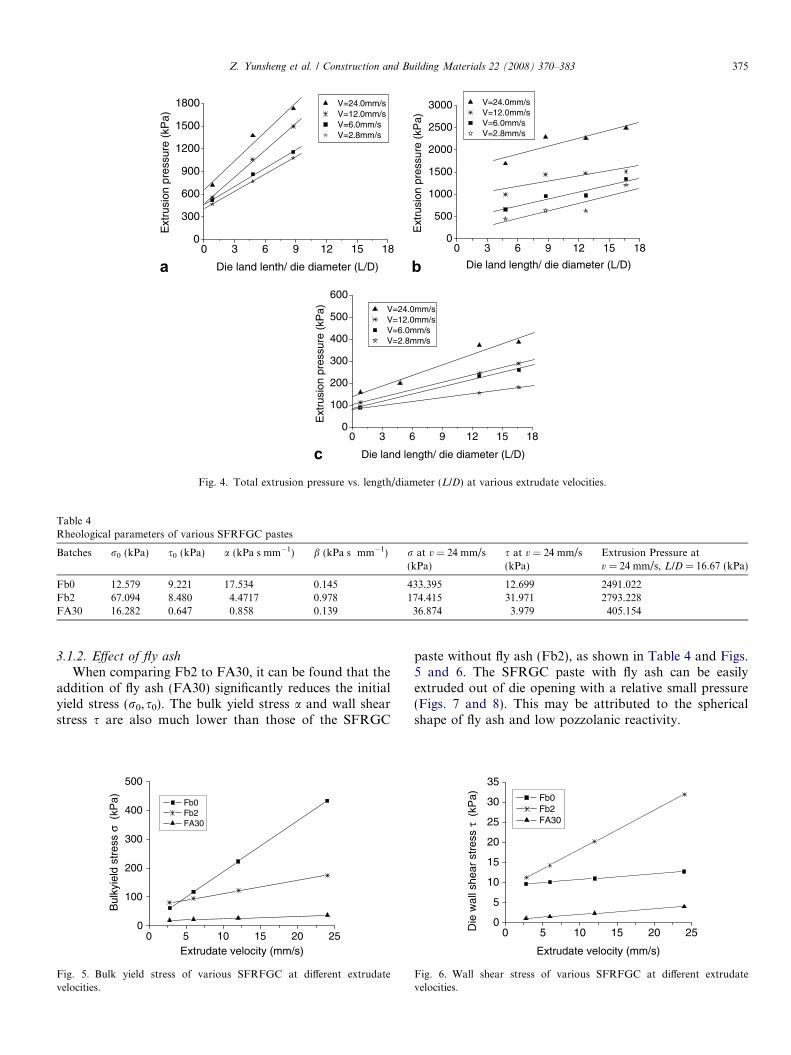
It can be seen in Table 4 that the initial yield stressr0 isincreased from 12.579 kPa to 67.094 kPa after 2% PVAfiber is incorporated into the fresh SFRGC paste, indicat-ing that the addition of fiber cause the starting flow ofSFRGC paste become more difficult. However, once theSFRGC paste with fiber moves, the bulk yield stress aexhibits a rapid drop, as shown in Table 4 and Fig. 5. Thismay be explained by the facts that the twisting and enlace-ment effects of fiber drives SFRGC pastes to smoothly flowinto the rigid die land.
A careful look at the wall shear stress s at differentextrusion velocities (Fig. 6) demonstrates that the additionof fiber considerably increases the friction between theSFRGC paste and die land wall, leading to an increase offlow resistance. It is especially true in the case of high extru-sion velocity. For a larger extrusion velocity, a higherextrusion pressure is required to push out the SFRGCpaste from die opening (Fig. 7), while for smaller L/D, arelative small pressure is enough (Fig. 8).
0 3 6 9 12 15 180
300
600
900
1200
1500
1800 V=24.0mm/sV=12.0mm/sV=6.0mm/sV=2.8mm/s
Ext
rusi
on p
ress
ure
(kP
a)
Die land lenth/ die diameter (L/D)
0 3 6 9 12 15 180
500
1000
1500
2000
2500
3000 V=24.0mm/s V=12.0mm/s V=6.0mm/s V=2.8mm/s
Ext
rusi
on p
ress
ure
(kP
a)
Die land length/ die diameter (L/D)
0 3 6 9 12 15 180
100
200
300
400
500
600
Ext
rusi
on p
ress
ure
(kP
a)
Die land length/ die diameter (L/D)
V=24.0mm/s V=12.0mm/s V=6.0mm/s V=2.8mm/s
a b
cFig. 4. Total extrusion pressure vs. length/diameter (L/D) at various extrudate velocities.
Table 4Rheological parameters of various SFRFGC pastes
Batches r0 (kPa) s0 (kPa) a (kPa s mm�1) b (kPa s mm�1) r at v = 24 mm/s(kPa)
s at v = 24 mm/s(kPa)
Extrusion Pressure atv = 24 mm/s, L/D = 16.67 (kPa)
Fb0 12.579 9.221 17.534 0.145 433.395 12.699 2491.022Fb2 67.094 8.480 4.4717 0.978 174.415 31.971 2793.228FA30 16.282 0.647 0.858 0.139 36.874 3.979 405.154
Z. Yunsheng et al. / Construction and Building Materials 22 (2008) 370–383 375
3.1.2. Effect of fly ash
When comparing Fb2 to FA30, it can be found that theaddition of fly ash (FA30) significantly reduces the initialyield stress (r0,s0). The bulk yield stress a and wall shearstress s are also much lower than those of the SFRGC
0 5 10 15 20 250
100
200
300
400
500
Bul
kyie
ld s
tres
s σ
(kP
a)
Extrudate velocity (mm/s)
Fb0 Fb2 FA30
Fig. 5. Bulk yield stress of various SFRFGC at different extrudatevelocities.
paste without fly ash (Fb2), as shown in Table 4 and Figs.5 and 6. The SFRGC paste with fly ash can be easilyextruded out of die opening with a relative small pressure(Figs. 7 and 8). This may be attributed to the sphericalshape of fly ash and low pozzolanic reactivity.
0 5 10 15 20 250
5
10
15
20
25
30
35
Die
wal
l she
ar s
tres
s τ
(kP
a)
Extrudate velocity (mm/s)
Fb0 Fb2 FA30
Fig. 6. Wall shear stress of various SFRFGC at different extrudatevelocities.
0 3 6 9 12 15 180
500
1000
1500
2000
2500
3000T
otal
ext
rusi
on p
ress
ure
Pe
(kP
a)
Die land length/ die diameter (L/D)
Fb0 Fb2 FA30
Fig. 7. Extrusion pressure at various extrudate velocities for a fixedL/D = 16.67.
0 5 10 15 20 250
500
1000
1500
2000
2500
3000
Tot
al e
xtru
sion
pre
ssur
e P
e (k
Pa)
Extrudate velocity (mm/s)
Fb0 Fb2 FA30
Fig. 8. Extrusion pressure at various L/D for a fixed extrudate velocitiesV = 24 mm/s.
Table 5Impact resistance of various SFRGC
Batches Impactstrength (N)
Impact stiffness(N/mm)
Impacttoughness (mJ)
Fb0 449.7 1150 209Fb1 426.0 873 1177Fb2 (or FA0) 429.6 749 1833FA10 443.3 1007 2108FA30 290.0 665 1587FA50 268.8 456 1307
376 Z. Yunsheng et al. / Construction and Building Materials 22 (2008) 370–383
3.2. Impact test program and results
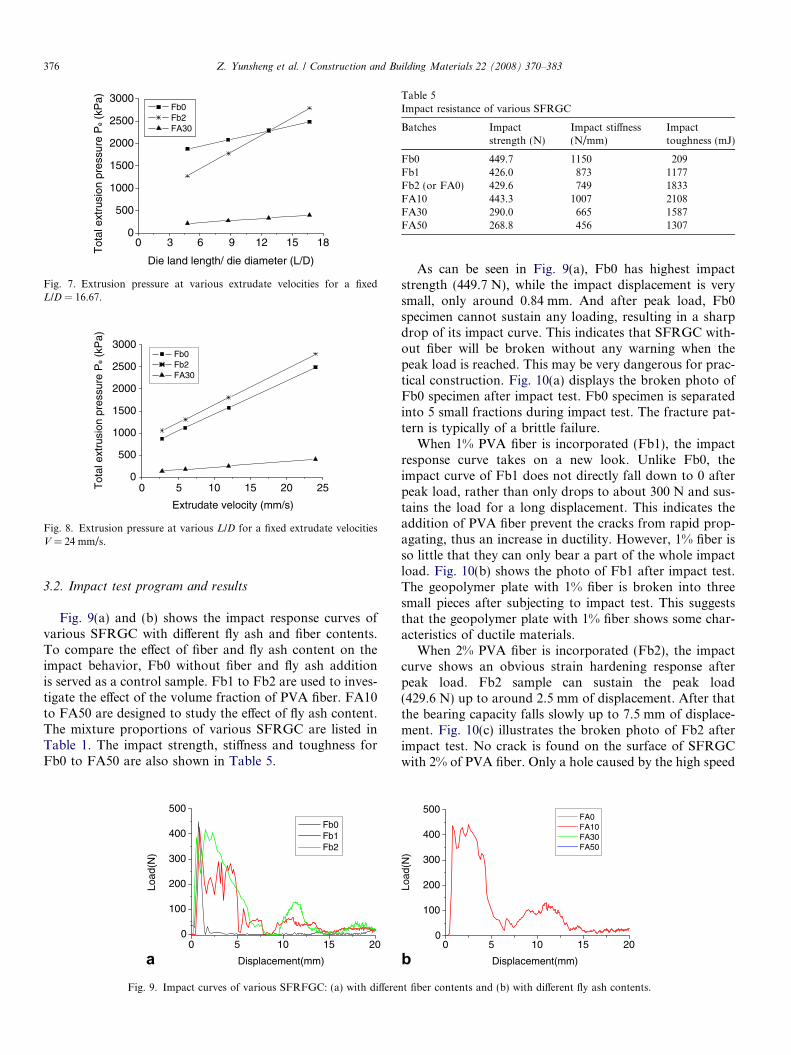
Fig. 9(a) and (b) shows the impact response curves ofvarious SFRGC with different fly ash and fiber contents.To compare the effect of fiber and fly ash content on theimpact behavior, Fb0 without fiber and fly ash additionis served as a control sample. Fb1 to Fb2 are used to inves-tigate the effect of the volume fraction of PVA fiber. FA10to FA50 are designed to study the effect of fly ash content.The mixture proportions of various SFRGC are listed inTable 1. The impact strength, stiffness and toughness forFb0 to FA50 are also shown in Table 5.
0 5 10 15 200
100
200
300
400
500
Load
(N)
Displacement(mm)
Fb0Fb1Fb2
aFig. 9. Impact curves of various SFRFGC: (a) with differe
As can be seen in Fig. 9(a), Fb0 has highest impactstrength (449.7 N), while the impact displacement is verysmall, only around 0.84 mm. And after peak load, Fb0specimen cannot sustain any loading, resulting in a sharpdrop of its impact curve. This indicates that SFRGC with-out fiber will be broken without any warning when thepeak load is reached. This may be very dangerous for prac-tical construction. Fig. 10(a) displays the broken photo ofFb0 specimen after impact test. Fb0 specimen is separatedinto 5 small fractions during impact test. The fracture pat-tern is typically of a brittle failure.
When 1% PVA fiber is incorporated (Fb1), the impactresponse curve takes on a new look. Unlike Fb0, theimpact curve of Fb1 does not directly fall down to 0 afterpeak load, rather than only drops to about 300 N and sus-tains the load for a long displacement. This indicates theaddition of PVA fiber prevent the cracks from rapid prop-agating, thus an increase in ductility. However, 1% fiber isso little that they can only bear a part of the whole impactload. Fig. 10(b) shows the photo of Fb1 after impact test.The geopolymer plate with 1% fiber is broken into threesmall pieces after subjecting to impact test. This suggeststhat the geopolymer plate with 1% fiber shows some char-acteristics of ductile materials.
When 2% PVA fiber is incorporated (Fb2), the impactcurve shows an obvious strain hardening response afterpeak load. Fb2 sample can sustain the peak load(429.6 N) up to around 2.5 mm of displacement. After thatthe bearing capacity falls slowly up to 7.5 mm of displace-ment. Fig. 10(c) illustrates the broken photo of Fb2 afterimpact test. No crack is found on the surface of SFRGCwith 2% of PVA fiber. Only a hole caused by the high speed
0 5 10 15 200
100
200
300
400
500
Load
(N)
Displacement(mm)
FA0FA10FA30FA50
bnt fiber contents and (b) with different fly ash contents.
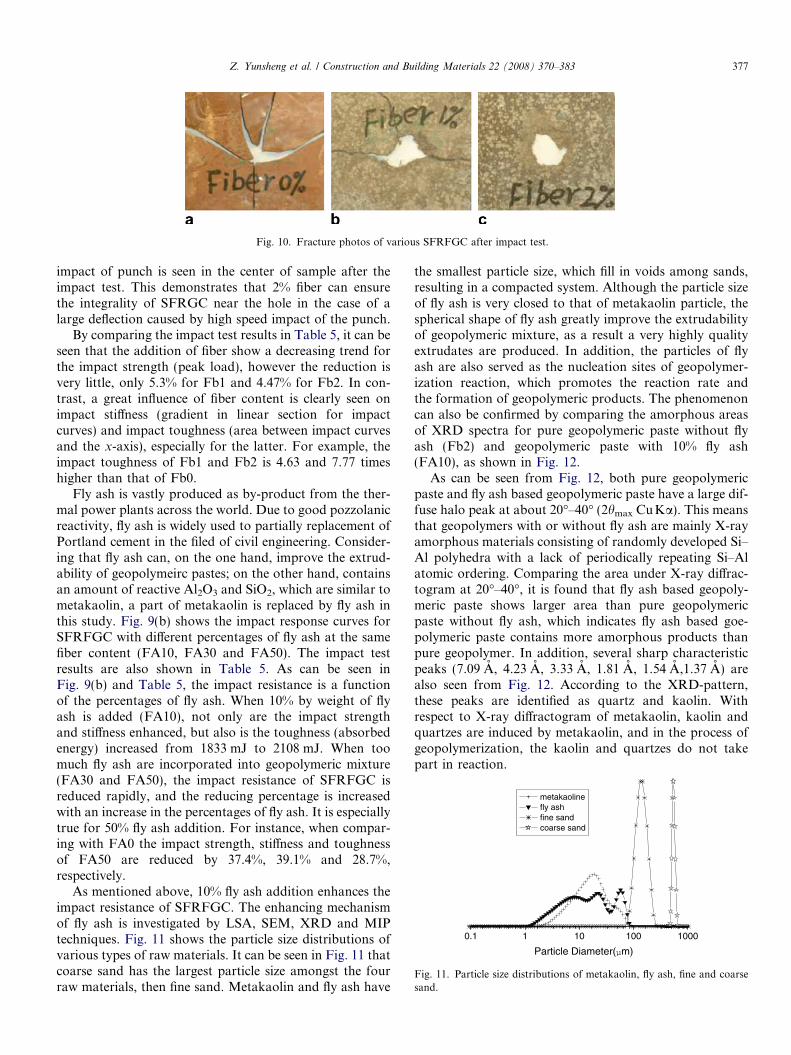
Fig. 10. Fracture photos of various SFRFGC after impact test.
0.1 1 10 100 1000
Particle Diameter(µm)
metakaoline fly ash fine sand coarse sand
Fig. 11. Particle size distributions of metakaolin, fly ash, fine and coarsesand.
Z. Yunsheng et al. / Construction and Building Materials 22 (2008) 370–383 377
impact of punch is seen in the center of sample after theimpact test. This demonstrates that 2% fiber can ensurethe integrality of SFRGC near the hole in the case of alarge deflection caused by high speed impact of the punch.
By comparing the impact test results in Table 5, it can beseen that the addition of fiber show a decreasing trend forthe impact strength (peak load), however the reduction isvery little, only 5.3% for Fb1 and 4.47% for Fb2. In con-trast, a great influence of fiber content is clearly seen onimpact stiffness (gradient in linear section for impactcurves) and impact toughness (area between impact curvesand the x-axis), especially for the latter. For example, theimpact toughness of Fb1 and Fb2 is 4.63 and 7.77 timeshigher than that of Fb0.
Fly ash is vastly produced as by-product from the ther-mal power plants across the world. Due to good pozzolanicreactivity, fly ash is widely used to partially replacement ofPortland cement in the filed of civil engineering. Consider-ing that fly ash can, on the one hand, improve the extrud-ability of geopolymeirc pastes; on the other hand, containsan amount of reactive Al2O3 and SiO2, which are similar tometakaolin, a part of metakaolin is replaced by fly ash inthis study. Fig. 9(b) shows the impact response curves forSFRFGC with different percentages of fly ash at the samefiber content (FA10, FA30 and FA50). The impact testresults are also shown in Table 5. As can be seen inFig. 9(b) and Table 5, the impact resistance is a functionof the percentages of fly ash. When 10% by weight of flyash is added (FA10), not only are the impact strengthand stiffness enhanced, but also is the toughness (absorbedenergy) increased from 1833 mJ to 2108 mJ. When toomuch fly ash are incorporated into geopolymeric mixture(FA30 and FA50), the impact resistance of SFRFGC isreduced rapidly, and the reducing percentage is increasedwith an increase in the percentages of fly ash. It is especiallytrue for 50% fly ash addition. For instance, when compar-ing with FA0 the impact strength, stiffness and toughnessof FA50 are reduced by 37.4%, 39.1% and 28.7%,respectively.
As mentioned above, 10% fly ash addition enhances theimpact resistance of SFRFGC. The enhancing mechanismof fly ash is investigated by LSA, SEM, XRD and MIPtechniques. Fig. 11 shows the particle size distributions ofvarious types of raw materials. It can be seen in Fig. 11 thatcoarse sand has the largest particle size amongst the fourraw materials, then fine sand. Metakaolin and fly ash have
the smallest particle size, which fill in voids among sands,resulting in a compacted system. Although the particle sizeof fly ash is very closed to that of metakaolin particle, thespherical shape of fly ash greatly improve the extrudabilityof geopolymeric mixture, as a result a very highly qualityextrudates are produced. In addition, the particles of flyash are also served as the nucleation sites of geopolymer-ization reaction, which promotes the reaction rate andthe formation of geopolymeric products. The phenomenoncan also be confirmed by comparing the amorphous areasof XRD spectra for pure geopolymeric paste without flyash (Fb2) and geopolymeric paste with 10% fly ash(FA10), as shown in Fig. 12.
As can be seen from Fig. 12, both pure geopolymericpaste and fly ash based geopolymeric paste have a large dif-fuse halo peak at about 20�–40� (2hmax CuKa). This meansthat geopolymers with or without fly ash are mainly X-rayamorphous materials consisting of randomly developed Si–Al polyhedra with a lack of periodically repeating Si–Alatomic ordering. Comparing the area under X-ray diffrac-togram at 20�–40�, it is found that fly ash based geopoly-meric paste shows larger area than pure geopolymericpaste without fly ash, which indicates fly ash based goe-polymeric paste contains more amorphous products thanpure geopolymer. In addition, several sharp characteristicpeaks (7.09 A, 4.23 A, 3.33 A, 1.81 A, 1.54 A,1.37 A) arealso seen from Fig. 12. According to the XRD-pattern,these peaks are identified as quartz and kaolin. Withrespect to X-ray diffractogram of metakaolin, kaolin andquartzes are induced by metakaolin, and in the process ofgeopolymerization, the kaolin and quartzes do not takepart in reaction.
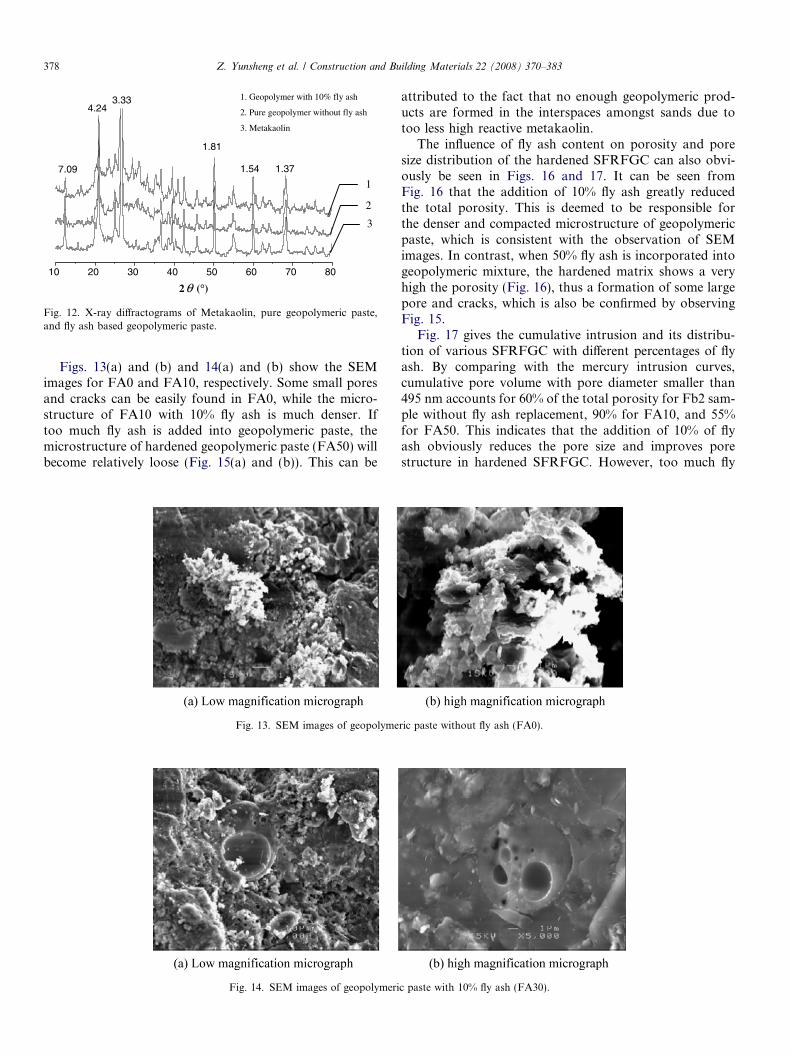
1. Geopolymer with 10% fly ash
2. Pure geopolymer without fly ash
3. Metakaolin
10 20 30 40 50 60 70 80
7.09 1.371.54
1.81
4.243.33
1
2
3
2θ (°)
Fig. 12. X-ray diffractograms of Metakaolin, pure geopolymeric paste,and fly ash based geopolymeric paste.
378 Z. Yunsheng et al. / Construction and Building Materials 22 (2008) 370–383
Figs. 13(a) and (b) and 14(a) and (b) show the SEMimages for FA0 and FA10, respectively. Some small poresand cracks can be easily found in FA0, while the micro-structure of FA10 with 10% fly ash is much denser. Iftoo much fly ash is added into geopolymeric paste, themicrostructure of hardened geopolymeric paste (FA50) willbecome relatively loose (Fig. 15(a) and (b)). This can be
Fig. 14. SEM images of geopolymeri
Fig. 13. SEM images of geopolyme
attributed to the fact that no enough geopolymeric prod-ucts are formed in the interspaces amongst sands due totoo less high reactive metakaolin.
The influence of fly ash content on porosity and poresize distribution of the hardened SFRFGC can also obvi-ously be seen in Figs. 16 and 17. It can be seen fromFig. 16 that the addition of 10% fly ash greatly reducedthe total porosity. This is deemed to be responsible forthe denser and compacted microstructure of geopolymericpaste, which is consistent with the observation of SEMimages. In contrast, when 50% fly ash is incorporated intogeopolymeric mixture, the hardened matrix shows a veryhigh the porosity (Fig. 16), thus a formation of some largepore and cracks, which is also be confirmed by observingFig. 15.
Fig. 17 gives the cumulative intrusion and its distribu-tion of various SFRFGC with different percentages of flyash. By comparing with the mercury intrusion curves,cumulative pore volume with pore diameter smaller than495 nm accounts for 60% of the total porosity for Fb2 sam-ple without fly ash replacement, 90% for FA10, and 55%for FA50. This indicates that the addition of 10% of flyash obviously reduces the pore size and improves porestructure in hardened SFRFGC. However, too much fly
c paste with 10% fly ash (FA30).
ric paste without fly ash (FA0).
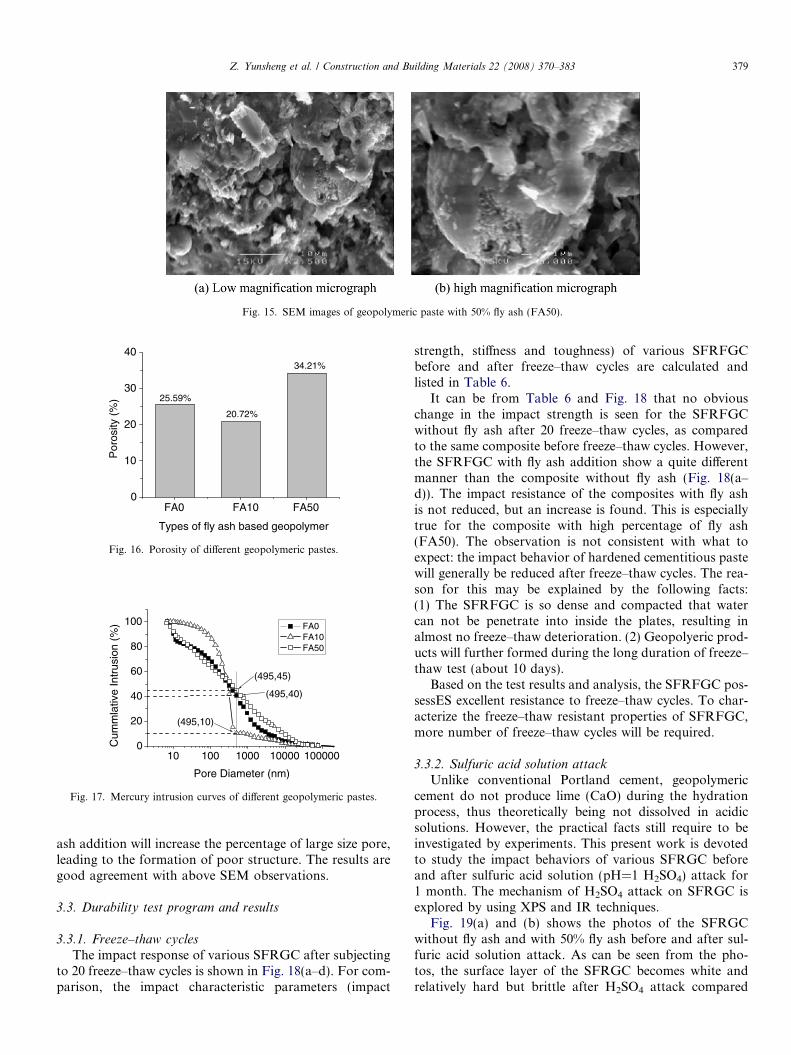
Fig. 15. SEM images of geopolymeric paste with 50% fly ash (FA50).
FA0 FA10 FA500
10
20
30
4034.21%
20.72%
25.59%
Por
osity
(%
)
Types of fly ash based geopolymer
Fig. 16. Porosity of different geopolymeric pastes.
10 100 1000 10000 1000000
20
40
60
80
100
(495,45)
(495,40)
(495,10)
Cum
mla
tive
Intr
usio
n (%
)
Pore Diameter (nm)
FA0 FA10 FA50
Fig. 17. Mercury intrusion curves of different geopolymeric pastes.
Z. Yunsheng et al. / Construction and Building Materials 22 (2008) 370–383 379
ash addition will increase the percentage of large size pore,leading to the formation of poor structure. The results aregood agreement with above SEM observations.
3.3. Durability test program and results
3.3.1. Freeze–thaw cycles
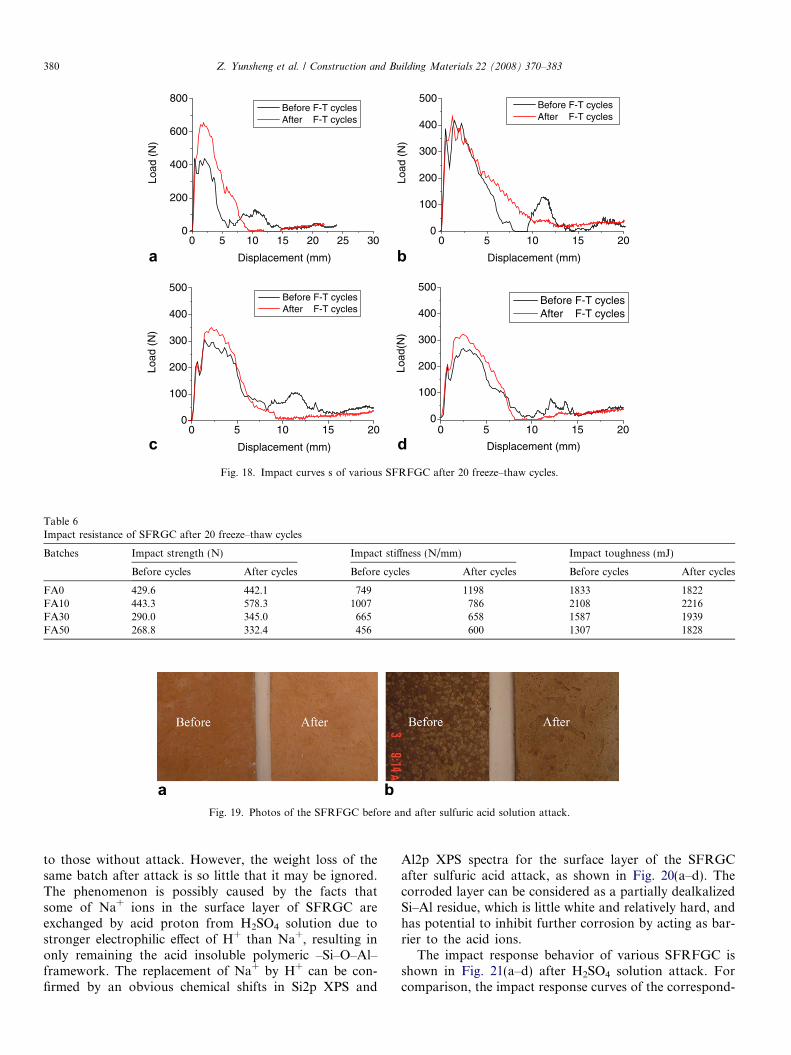
The impact response of various SFRGC after subjectingto 20 freeze–thaw cycles is shown in Fig. 18(a–d). For com-parison, the impact characteristic parameters (impact
strength, stiffness and toughness) of various SFRFGCbefore and after freeze–thaw cycles are calculated andlisted in Table 6.
It can be from Table 6 and Fig. 18 that no obviouschange in the impact strength is seen for the SFRFGCwithout fly ash after 20 freeze–thaw cycles, as comparedto the same composite before freeze–thaw cycles. However,the SFRFGC with fly ash addition show a quite differentmanner than the composite without fly ash (Fig. 18(a–d)). The impact resistance of the composites with fly ashis not reduced, but an increase is found. This is especiallytrue for the composite with high percentage of fly ash(FA50). The observation is not consistent with what toexpect: the impact behavior of hardened cementitious pastewill generally be reduced after freeze–thaw cycles. The rea-son for this may be explained by the following facts:(1) The SFRFGC is so dense and compacted that watercan not be penetrate into inside the plates, resulting inalmost no freeze–thaw deterioration. (2) Geopolyeric prod-ucts will further formed during the long duration of freeze–thaw test (about 10 days).
Based on the test results and analysis, the SFRFGC pos-sessES excellent resistance to freeze–thaw cycles. To char-acterize the freeze–thaw resistant properties of SFRFGC,more number of freeze–thaw cycles will be required.
3.3.2. Sulfuric acid solution attack
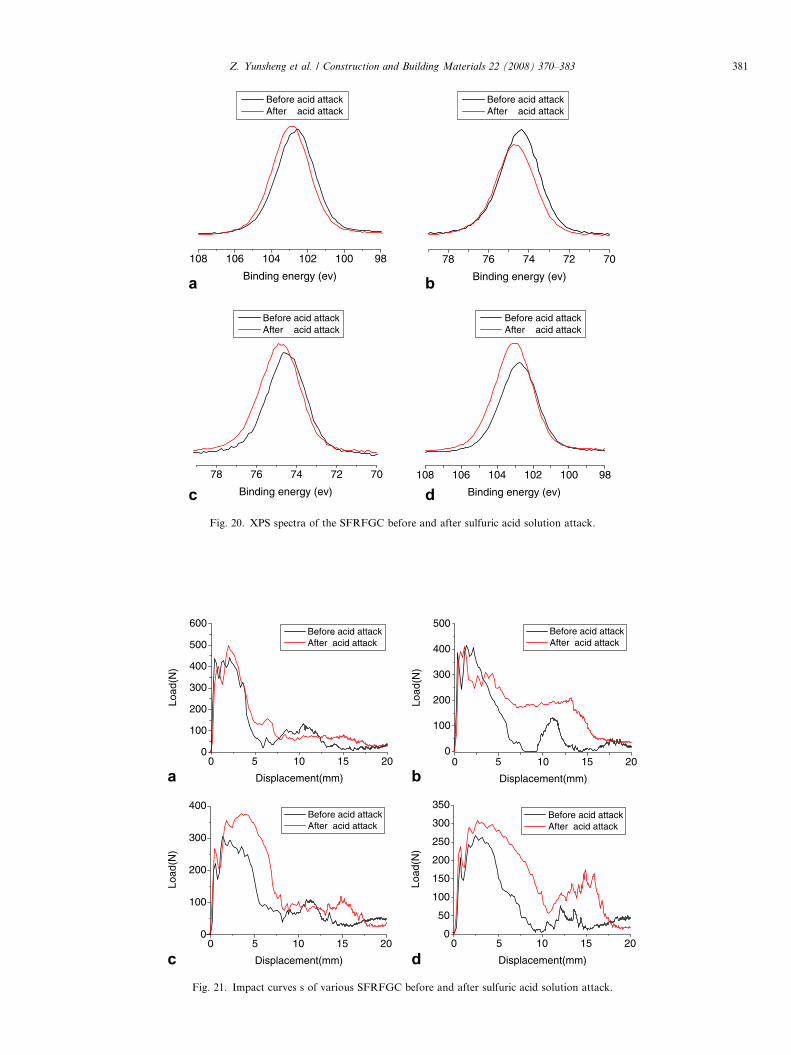
Unlike conventional Portland cement, geopolymericcement do not produce lime (CaO) during the hydrationprocess, thus theoretically being not dissolved in acidicsolutions. However, the practical facts still require to beinvestigated by experiments. This present work is devotedto study the impact behaviors of various SFRGC beforeand after sulfuric acid solution (pH=1 H2SO4) attack for1 month. The mechanism of H2SO4 attack on SFRGC isexplored by using XPS and IR techniques.
Fig. 19(a) and (b) shows the photos of the SFRGCwithout fly ash and with 50% fly ash before and after sul-furic acid solution attack. As can be seen from the pho-tos, the surface layer of the SFRGC becomes white andrelatively hard but brittle after H2SO4 attack compared
0 5 10 15 20 25 300
200
400
600
800
Load
(N
)
Displacement (mm)
Before F-T cycles After F-T cycles
0 5 10 15 200
100
200
300
400
500
Load
(N
)
Displacement (mm)
Before F-T cycles After F-T cycles
0 5 10 15 200
100
200
300
400
500
Load
(N
)
Displacement (mm)
Before F-T cycles After F-T cycles
0 5 10 15 200
100
200
300
400
500
Load
(N)
Displacement (mm)
Before F-T cycles After F-T cycles
a
c d
b
Fig. 18. Impact curves s of various SFRFGC after 20 freeze–thaw cycles.
Table 6Impact resistance of SFRGC after 20 freeze–thaw cycles
Batches Impact strength (N) Impact stiffness (N/mm) Impact toughness (mJ)
Before cycles After cycles Before cycles After cycles Before cycles After cycles
FA0 429.6 442.1 749 1198 1833 1822FA10 443.3 578.3 1007 786 2108 2216FA30 290.0 345.0 665 658 1587 1939FA50 268.8 332.4 456 600 1307 1828
Fig. 19. Photos of the SFRFGC before and after sulfuric acid solution attack.
380 Z. Yunsheng et al. / Construction and Building Materials 22 (2008) 370–383
to those without attack. However, the weight loss of thesame batch after attack is so little that it may be ignored.The phenomenon is possibly caused by the facts thatsome of Na+ ions in the surface layer of SFRGC areexchanged by acid proton from H2SO4 solution due tostronger electrophilic effect of H+ than Na+, resulting inonly remaining the acid insoluble polymeric –Si–O–Al–framework. The replacement of Na+ by H+ can be con-firmed by an obvious chemical shifts in Si2p XPS and
Al2p XPS spectra for the surface layer of the SFRGCafter sulfuric acid attack, as shown in Fig. 20(a–d). Thecorroded layer can be considered as a partially dealkalizedSi–Al residue, which is little white and relatively hard, andhas potential to inhibit further corrosion by acting as bar-rier to the acid ions.
The impact response behavior of various SFRFGC isshown in Fig. 21(a–d) after H2SO4 solution attack. Forcomparison, the impact response curves of the correspond-
108 106 104 102 100 98
Before acid attack After acid attack
Before acid attack After acid attack
Binding energy (ev)
78 76 74 72 70
Binding energy (ev)
78 76 74 72 70
Before acid attack After acid attack
Before acid attack After acid attack
Binding energy (ev)
108 106 104 102 100 98
Binding energy (ev)
a b
c dFig. 20. XPS spectra of the SFRFGC before and after sulfuric acid solution attack.
0 5 10 15 200
100
200
300
400
500
600
Load
(N)
Displacement(mm)
Before acid attack After acid attack
0 5 10 15 200
100
200
300
400
500
Load
(N)
Displacement(mm)
Before acid attack After acid attack
0 5 10 15 200
100
200
300
400
Load
(N)
Displacement(mm)
Before acid attack After acid attack
0 5 10 15 200
50
100
150
200
250
300
350
Load
(N)
Displacement(mm)
Before acid attack After acid attack
a b
c dFig. 21. Impact curves s of various SFRFGC before and after sulfuric acid solution attack.
Z. Yunsheng et al. / Construction and Building Materials 22 (2008) 370–383 381
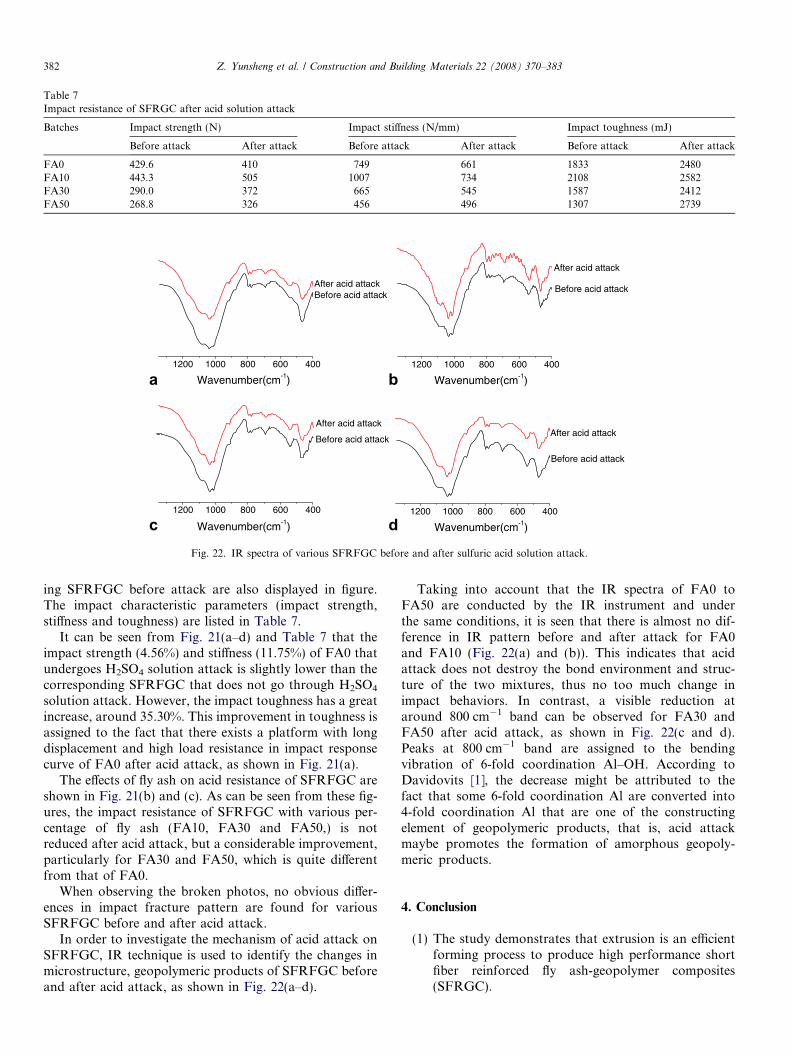
Table 7Impact resistance of SFRGC after acid solution attack
Batches Impact strength (N) Impact stiffness (N/mm) Impact toughness (mJ)
Before attack After attack Before attack After attack Before attack After attack
FA0 429.6 410 749 661 1833 2480FA10 443.3 505 1007 734 2108 2582FA30 290.0 372 665 545 1587 2412FA50 268.8 326 456 496 1307 2739
1200 1000 800 600 400
Before acid attackAfter acid attack
Wavenumber(cm-1)
1200 1000 800 600 400
After acid attack
Before acid attack
Wavenumber(cm-1)
1200 1000 800 600 400
After acid attack
Before acid attack
Wavenumber(cm-1)1200 1000 800 600 400
Before acid attack
After acid attack
Wavenumber(cm-1)
a
c
b
dFig. 22. IR spectra of various SFRFGC before and after sulfuric acid solution attack.
382 Z. Yunsheng et al. / Construction and Building Materials 22 (2008) 370–383
ing SFRFGC before attack are also displayed in figure.The impact characteristic parameters (impact strength,stiffness and toughness) are listed in Table 7.
It can be seen from Fig. 21(a–d) and Table 7 that theimpact strength (4.56%) and stiffness (11.75%) of FA0 thatundergoes H2SO4 solution attack is slightly lower than thecorresponding SFRFGC that does not go through H2SO4
solution attack. However, the impact toughness has a greatincrease, around 35.30%. This improvement in toughness isassigned to the fact that there exists a platform with longdisplacement and high load resistance in impact responsecurve of FA0 after acid attack, as shown in Fig. 21(a).
The effects of fly ash on acid resistance of SFRFGC areshown in Fig. 21(b) and (c). As can be seen from these fig-ures, the impact resistance of SFRFGC with various per-centage of fly ash (FA10, FA30 and FA50,) is notreduced after acid attack, but a considerable improvement,particularly for FA30 and FA50, which is quite differentfrom that of FA0.
When observing the broken photos, no obvious differ-ences in impact fracture pattern are found for variousSFRFGC before and after acid attack.
In order to investigate the mechanism of acid attack onSFRFGC, IR technique is used to identify the changes inmicrostructure, geopolymeric products of SFRFGC beforeand after acid attack, as shown in Fig. 22(a–d).
Taking into account that the IR spectra of FA0 toFA50 are conducted by the IR instrument and underthe same conditions, it is seen that there is almost no dif-ference in IR pattern before and after attack for FA0and FA10 (Fig. 22(a) and (b)). This indicates that acidattack does not destroy the bond environment and struc-ture of the two mixtures, thus no too much change inimpact behaviors. In contrast, a visible reduction ataround 800 cm�1 band can be observed for FA30 andFA50 after acid attack, as shown in Fig. 22(c and d).Peaks at 800 cm�1 band are assigned to the bendingvibration of 6-fold coordination Al–OH. According toDavidovits [1], the decrease might be attributed to thefact that some 6-fold coordination Al are converted into4-fold coordination Al that are one of the constructingelement of geopolymeric products, that is, acid attackmaybe promotes the formation of amorphous geopoly-meric products.
4. Conclusion
(1) The study demonstrates that extrusion is an efficient
forming process to produce high performance shortfiber reinforced fly ash-geopolymer composites(SFRGC).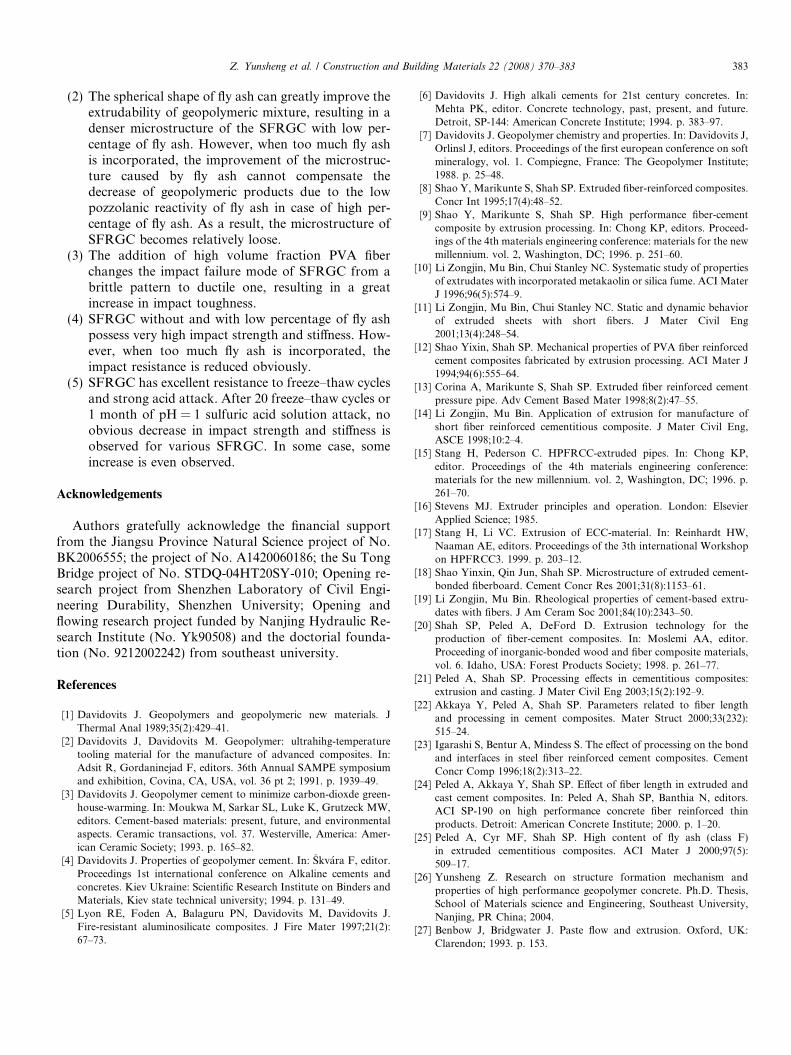
Z. Yunsheng et al. / Construction and Building Materials 22 (2008) 370–383 383
(2) The spherical shape of fly ash can greatly improve theextrudability of geopolymeric mixture, resulting in adenser microstructure of the SFRGC with low per-centage of fly ash. However, when too much fly ashis incorporated, the improvement of the microstruc-ture caused by fly ash cannot compensate thedecrease of geopolymeric products due to the lowpozzolanic reactivity of fly ash in case of high per-centage of fly ash. As a result, the microstructure ofSFRGC becomes relatively loose.
(3) The addition of high volume fraction PVA fiberchanges the impact failure mode of SFRGC from abrittle pattern to ductile one, resulting in a greatincrease in impact toughness.
(4) SFRGC without and with low percentage of fly ashpossess very high impact strength and stiffness. How-ever, when too much fly ash is incorporated, theimpact resistance is reduced obviously.
(5) SFRGC has excellent resistance to freeze–thaw cyclesand strong acid attack. After 20 freeze–thaw cycles or1 month of pH = 1 sulfuric acid solution attack, noobvious decrease in impact strength and stiffness isobserved for various SFRGC. In some case, someincrease is even observed.
Acknowledgements
Authors gratefully acknowledge the financial supportfrom the Jiangsu Province Natural Science project of No.BK2006555; the project of No. A1420060186; the Su TongBridge project of No. STDQ-04HT20SY-010; Opening re-search project from Shenzhen Laboratory of Civil Engi-neering Durability, Shenzhen University; Opening andflowing research project funded by Nanjing Hydraulic Re-search Institute (No. Yk90508) and the doctorial founda-tion (No. 9212002242) from southeast university.
References
[1] Davidovits J. Geopolymers and geopolymeric new materials. JThermal Anal 1989;35(2):429–41.
[2] Davidovits J, Davidovits M. Geopolymer: ultrahihg-temperaturetooling material for the manufacture of advanced composites. In:Adsit R, Gordaninejad F, editors. 36th Annual SAMPE symposiumand exhibition, Covina, CA, USA, vol. 36 pt 2; 1991. p. 1939–49.
[3] Davidovits J. Geopolymer cement to minimize carbon-dioxde green-house-warming. In: Moukwa M, Sarkar SL, Luke K, Grutzeck MW,editors. Cement-based materials: present, future, and environmentalaspects. Ceramic transactions, vol. 37. Westerville, America: Amer-ican Ceramic Society; 1993. p. 165–82.
[4] Davidovits J. Properties of geopolymer cement. In: Skvara F, editor.Proceedings 1st international conference on Alkaline cements andconcretes. Kiev Ukraine: Scientific Research Institute on Binders andMaterials, Kiev state technical university; 1994. p. 131–49.
[5] Lyon RE, Foden A, Balaguru PN, Davidovits M, Davidovits J.Fire-resistant aluminosilicate composites. J Fire Mater 1997;21(2):67–73.
[6] Davidovits J. High alkali cements for 21st century concretes. In:Mehta PK, editor. Concrete technology, past, present, and future.Detroit, SP-144: American Concrete Institute; 1994. p. 383–97.
[7] Davidovits J. Geopolymer chemistry and properties. In: Davidovits J,Orlinsl J, editors. Proceedings of the first european conference on softmineralogy, vol. 1. Compiegne, France: The Geopolymer Institute;1988. p. 25–48.
[8] Shao Y, Marikunte S, Shah SP. Extruded fiber-reinforced composites.Concr Int 1995;17(4):48–52.
[9] Shao Y, Marikunte S, Shah SP. High performance fiber-cementcomposite by extrusion processing. In: Chong KP, editors. Proceed-ings of the 4th materials engineering conference: materials for the newmillennium. vol. 2, Washington, DC; 1996. p. 251–60.
[10] Li Zongjin, Mu Bin, Chui Stanley NC. Systematic study of propertiesof extrudates with incorporated metakaolin or silica fume. ACI MaterJ 1996;96(5):574–9.
[11] Li Zongjin, Mu Bin, Chui Stanley NC. Static and dynamic behaviorof extruded sheets with short fibers. J Mater Civil Eng2001;13(4):248–54.
[12] Shao Yixin, Shah SP. Mechanical properties of PVA fiber reinforcedcement composites fabricated by extrusion processing. ACI Mater J1994;94(6):555–64.
[13] Corina A, Marikunte S, Shah SP. Extruded fiber reinforced cementpressure pipe. Adv Cement Based Mater 1998;8(2):47–55.
[14] Li Zongjin, Mu Bin. Application of extrusion for manufacture ofshort fiber reinforced cementitious composite. J Mater Civil Eng,ASCE 1998;10:2–4.
[15] Stang H, Pederson C. HPFRCC-extruded pipes. In: Chong KP,editor. Proceedings of the 4th materials engineering conference:materials for the new millennium. vol. 2, Washington, DC; 1996. p.261–70.
[16] Stevens MJ. Extruder principles and operation. London: ElsevierApplied Science; 1985.
[17] Stang H, Li VC. Extrusion of ECC-material. In: Reinhardt HW,Naaman AE, editors. Proceedings of the 3th international Workshopon HPFRCC3. 1999. p. 203–12.
[18] Shao Yinxin, Qin Jun, Shah SP. Microstructure of extruded cement-bonded fiberboard. Cement Concr Res 2001;31(8):1153–61.
[19] Li Zongjin, Mu Bin. Rheological properties of cement-based extru-dates with fibers. J Am Ceram Soc 2001;84(10):2343–50.
[20] Shah SP, Peled A, DeFord D. Extrusion technology for theproduction of fiber-cement composites. In: Moslemi AA, editor.Proceeding of inorganic-bonded wood and fiber composite materials,vol. 6. Idaho, USA: Forest Products Society; 1998. p. 261–77.
[21] Peled A, Shah SP. Processing effects in cementitious composites:extrusion and casting. J Mater Civil Eng 2003;15(2):192–9.
[22] Akkaya Y, Peled A, Shah SP. Parameters related to fiber lengthand processing in cement composites. Mater Struct 2000;33(232):515–24.
[23] Igarashi S, Bentur A, Mindess S. The effect of processing on the bondand interfaces in steel fiber reinforced cement composites. CementConcr Comp 1996;18(2):313–22.
[24] Peled A, Akkaya Y, Shah SP. Effect of fiber length in extruded andcast cement composites. In: Peled A, Shah SP, Banthia N, editors.ACI SP-190 on high performance concrete fiber reinforced thinproducts. Detroit: American Concrete Institute; 2000. p. 1–20.
[25] Peled A, Cyr MF, Shah SP. High content of fly ash (class F)in extruded cementitious composites. ACI Mater J 2000;97(5):509–17.
[26] Yunsheng Z. Research on structure formation mechanism andproperties of high performance geopolymer concrete. Ph.D. Thesis,School of Materials science and Engineering, Southeast University,Nanjing, PR China; 2004.
[27] Benbow J, Bridgwater J. Paste flow and extrusion. Oxford, UK:Clarendon; 1993. p. 153.


