Embed Size (px)
Citation preview

Payback Ground RulesNo subsidies or incentives have been factored into these payback scenarios—the paybacks are based on simple rates of return and are used to show the relative value of each technology based on its estimated cost and energy production. The scenarios do not include system maintenance, although some maintenance will probably be required over the life of each. The payback periods will vary with location depending upon the climate, the cost of utility-generated electricity, and installation costs.
Solar energy systems hang their hats on payback. Financial payback is as tangible as money in your bank account, while other types of payback—like
environmental externalities—are not usually calculated in dollars. There’s no doubt that photovoltaic (PV) and solar hot water (SHW) systems will pay you back. Maybe not as quickly as you’d like, but all systems will significantly offset their cost over their lifetimes. Here we’ll try to answer: Which system will give the quickest return on investment (ROI)?
Financially, solar pool heaters and off-grid PV systems have the quickest payback of all home-scale solar energy. Solar pool heaters pay back in three to ten years. Off-grid PV systems can have an immediate ROI if they eliminate the need for costly utility-line extensions. However, not everyone uses those kinds of systems. Most U.S. homes have utility-generated electricity and are without swimming pools. The two most common solar energy systems are utility grid-tied PV and domestic SHW. These systems can reduce your utility bills and cut your carbon footprint. Let’s take a closer look at the economics of the two technologies.
home power 127 / october & november 200840
PV vs. Solar Water HeatingSimple Solar Payback
Solar System Costs & Efficiencies
Technology
Collector or Module Efficiency
System
Efficiency Cost
System Cost
Per KWH*
SHW: 64 sq. ft. of collectors + 80 gal. water heater
50%–70% 35%–50% $8,000 $0.09
Grid-tied PV: 2 KW 5%–19% 4%–13% 20,000 0.27*Over 30 yrs. in Richmond, Virginia; maintenance costs not included
The owners of this Oregon home use both solar electric and thermal—making it cheaper to offset their energy consumption with renewable energy.

ROI calculations can be much more complex than the simple methods used here. We left out the future value of the initial investment and the tax-free nature of solar returns and just tried to keep this as simple as possible. Our methodology concentrates on the comparison of grid-connected PV and SHW systems. Information similar to return on investment is an integral part of information given to policy makers to support the need for incentives to offset the initial cost of the solar energy systems. Quicker payback periods that are incentive-driven through local rebates and tax credits have resulted in big increases in market penetration. Without dramatically higher utility rates and/or more attractive incentives, solar energy systems in most of the United States will have a tough time being installed on the basis of economic payback alone.
www.homepower.com
PV & SHW payback
41
by Chuck Marken & Justine Sanchez
Solar-thermal collectors (above) are only part of a SHW system. The balance of system components (left) and labor can be up 75% of the system cost. Together, these components make an RE system that is two to three times as efficient as a PV system.
A Simple SHW Payback ScenarioFirst, we’ll look at a simple solar heating system payback. The installed cost of a two-collector direct forced-circulation antifreeze system with an 80-gallon tank is typically between $8,000 and $9,000. In Richmond, Virginia, this system will produce an estimated 3,100 KWH per year (equivalent to about 10.6 million Btu), according to the Solar Rating and Certification Corporation (SRCC). Richmond, with an average of 4.8 peak sun-hours per day, has a moderate climate and is near the U.S. average for payback times (see table). The SRCC publishes estimated production data for many other cities on their Web site (see Access).
www.shawnschreiner.com
Mild ClimatesIn Hawaii and the southern part of each state that borders Mexico or the Gulf, the climate is mild enough to allow lower-cost SHW systems. Integral collector storage (ICS), thermosyphon, and direct forced-circulation systems are also used in these climates. The installation cost of these systems can be thousands of dollars less than the example two-collector SHW system, dropping payback length by 10% to 30%.
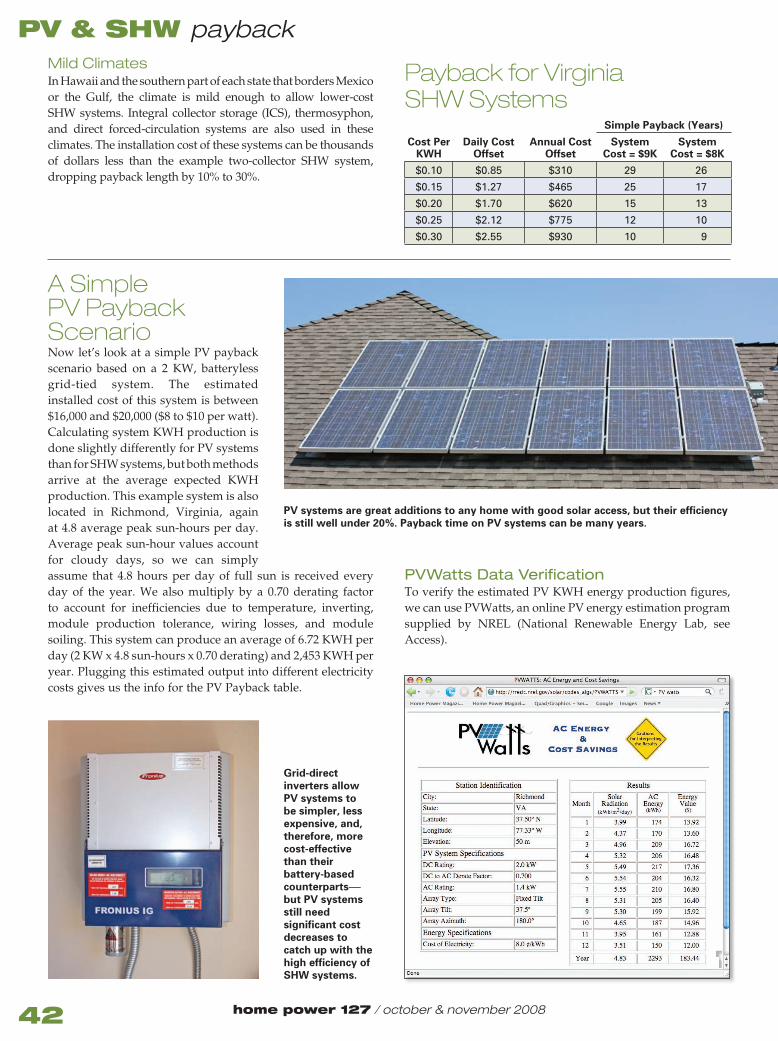
PVWatts Data VerificationTo verify the estimated PV KWH energy production figures, we can use PVWatts, an online PV energy estimation program supplied by NREL (National Renewable Energy Lab, see Access).
home power 127 / october & november 200842
PV & SHW payback
Payback for Virginia SHW Systems
Simple Payback (Years)
Cost Per KWH
Daily Cost Offset
Annual Cost Offset
System Cost = $9K
System Cost = $8K
$0.10 $0.85 $310 29 26
$0.15 $1.27 $465 25 17
$0.20 $1.70 $620 15 13
$0.25 $2.12 $775 12 10
$0.30 $2.55 $930 10 9
A Simple PV Payback ScenarioNow let’s look at a simple PV payback scenario based on a 2 KW, batteryless grid-tied system. The estimated installed cost of this system is between $16,000 and $20,000 ($8 to $10 per watt). Calculating system KWH production is done slightly differently for PV systems than for SHW systems, but both methods arrive at the average expected KWH production. This example system is also located in Richmond, Virginia, again at 4.8 average peak sun-hours per day. Average peak sun-hour values account for cloudy days, so we can simply assume that 4.8 hours per day of full sun is received every day of the year. We also multiply by a 0.70 derating factor to account for inefficiencies due to temperature, inverting, module production tolerance, wiring losses, and module soiling. This system can produce an average of 6.72 KWH per day (2 KW x 4.8 sun-hours x 0.70 derating) and 2,453 KWH per year. Plugging this estimated output into different electricity costs gives us the info for the PV Payback table.
PV systems are great additions to any home with good solar access, but their efficiency is still well under 20%. Payback time on PV systems can be many years.
Grid-direct inverters allow PV systems to be simpler, less expensive, and, therefore, more cost-effective than their battery-based counterparts—but PV systems still need significant cost decreases to catch up with the high efficiency of SHW systems.

www.homepower.com
PV & SHW payback
43
This easy-to-use program allows us to select our site (Richmond, VA) and enter the 2 KW system size to calculate energy production data on a monthly and yearly basis. In this case, PVWatts estimates average AC energy production to be 2,532 KWH per year. Our estimation of 2,453 KWH per year is within 3% of the PVWatts estimation. You can use this calculator to find energy production values for other PV system sizes in other cities and states.
Payback ComparisonLooking at the solar payback tables, we can see that the sample solar hot water system’s payback is about 2 1/2 times faster than our sample grid-tied PV system. Of course our estimations assume no available incentives, so actual payback times will depend heavily on available solar rebates and tax credits (see “Solar Assistance” sidebar). Also check out the incredibly fast payback times of the energy-efficiency upgrade example (in the “Efficiency Pays” sidebar), where we see full financial payback in months, rather than years.
NREL also has payback maps for SHW and PV systems. These maps illustrate how payback times vary for different locations across the United States. Although the NREL payback maps are a little outdated with 2004 data, they are still worth a look. The fine print states that the grid-tied PV systems have an installed cost of $10 per watt—a reasonable figure, but perhaps a little high. The SHW map assumes a cost of $900 per square meter (about 10 square feet) and 40% efficiency. This cost is too low for the pump-driven 80-gallon example system (according to NREL estimates, our $8,000 to $9,000 system
Payback for Virginia PV Systems
Simple Payback (Years)
Cost Per KWH
Daily Cost Offset
Annual Cost Offset
System Cost = $20K
System Cost = $16K
$0.10 $0.67 $245 82 65
$0.15 $1.01 $368 54 44
$0.20 $1.34 $491 41 33
$0.25 $1.68 $613 33 26
$0.30 $2.02 $736 27 22
would only cost $6,000). The rise in copper prices in the last four years is probably a factor in this discrepancy. Even with this cost difference, the maps are an eye-opener for how the two types of systems pay back their owners. What the maps don’t show is the current trends of lower PV installation costs and higher SHW material prices—which are somewhat narrowing the previously wide gap in the respective payback times.
While these simple payback calculations are important to the pocketbook, the primary motivator for many is not which investments will yield the fastest payback, but rather how can they produce renewable, clean electricity or hot water.
Photovoltaic System Payback
Solar Hot Water System Payback
Assumptions: 1. Annual average solar resource, module tilt=latitude; 2. 2004 commercial electricity rates for utilities from Platts POWERmap & POWERdat, ©2006, & supplemented by state average 2004 commercial electricity rates reported by the U.S. EIA; 3. PV System cost=$10,000 per KW.
Assumptions: 1. Annual average solar resource, collector tilt=latitude; 2. 2004 commercial electricity rates for utilities from Platts POWERmap & POWERdat, ©2006, & supplemented by state average 2004 commercial electricity rates reported by the U.S. EIA; 3. SHW System cost=$900 per sq. m.; 4. System efficiency=40%.
Payback in Years
<1010–2020–5050–80> 80
Payback in Years
<1010–2020–5050–80> 80

home power 127 / october & november 200844
PV & SHW payback
Solar Assistance These financial payback scenarios are calculated without including any financial incentives, but tax credits are available from the federal government until the end of the year. Many U.S. states, regions, and utilities also offer substantial rebates, tax credits, tax exemptions, loans, and other economic incentives for solar-electric and solar hot water systems.
Each state offers different incentive programs. For example, Connecticut offers a rebate for small residential PV systems of $5 per watt for the first 5 KW and $4.30 per watt thereafter. So a 2 KW system installed in Connecticut would have a lower cost of $6,000 to $10,000 (rather than $16,000 to $20,000), not including federal incentives or tax exemptions. The federal tax credit would reduce this cost by an additional $2,000 for qualified taxpayers.
In some locations, the residential tax credit is equal for PV and SHW, but in most cases, PV systems have more generous incentives. Hawaii favors solar hot water systems with a recent law that mandates SHW systems on all new homes built after January 1, 2010. For more information about incentive programs, visit the Database of State Incentives for Renewables & Efficiency (www.dsireusa.org).
Efficiency PaysIt is worthwhile to look at the payback times for simple energy efficiency-upgrades (negawatts), such as changing out incandescent lights for more energy-efficient compact fluorescent lights (CFLs). Ten 60 W incandescent light bulbs can be replaced with ten 15 W CFL bulbs for $30 and still produce about the same amount of light. Each bulb saves 45 watt-hours (60 W – 15 W = 45 W) per hour of operation. Assuming an average operating time of 5 hours per day, the energy savings for all ten bulbs is 2,250 watt-hours or 2.25 KWH per day (450 W x 5 hrs. per day)—about 821 KWH per year. These bulbs will last about 10,000 hours (about 5 1/2 years), compared to the 30 years of example solar systems, but the ROI shown is 4.3 months at the most.
Payback for the Ten $3 CFLsCost
Per KWHDaily Cost
OffsetMonthly Cost
OffsetPayback (Months)
$0.10 $0.23 $7 4.3
$0.15 $0.34 $10 3.0
$0.20 $0.45 $14 2.1
$0.25 $0.56 $17 1.8
$0.30 $0.68 $21 1.4
Compared to PV systems, SHW systems produce more energy at a lower installed cost. But many people opt to install both
types of systems to offset more of their total energy use.
“...these (solar) examples substantially reduce greenhouse gas emissions and air pollutants WHILE they are paying back the up-front cost...”
Photo courtesy www.sunearthinc.com

www.homepower.com
PV & SHW payback
45
The reduction of pollutants such as carbon dioxide (CO2), sulfur dioxide (SO2) and nitrogen oxides (NOx), as a result of replacing “average” U.S. utility energy—which includes hydroelectricity, nuclear, oil- and coal-based generation—with renewables or efficiency measures is shown in the “Pollutant Savings” table. Note that emissions from strictly coal-based electricity, which accounts for about 50% of all electricity generation in the United States, will be higher.
All these examples substantially reduce greenhouse gas emissions and air pollutants while they are paying back the up-front cost—and will continue to produce pollution-free energy (or reduce pollutants, in the case of the energy-efficiency upgrade) after they have achieved financial payback.
Annual Pollutant Savings
TypeEnergy (KWH) Cost
CO2 Savings
(Lbs.)
SO2 Savings
(Lbs.)
NOx Savings
(Lbs.)
SHW (80 gal.) 3,100 $8K–-$9K 4,340 25 16
PV (2 KW) 2,453 $16K–-$20K 3,434 20 12
CFLs (10 bulbs) 821 $30 1,149 7 4
Leveling the Playing Field
No matter how you feel about solar incentives, it is important to realize that all power production is subsidized. Conventional (coal, oil, natural gas, and nuclear) power production is subsidized in many ways, including direct financial support (grants, low-interest loans, R&D), preferential tax treatment (tax credits, exemptions on royalties, accelerated depreciation), trade restrictions (quotas, trade embargoes), and liability limits (for nuclear energy). According to the World Energy Assessment Overview—2004 Update, annual worldwide subsidies for conventional energy averaged $250 billion, without considering military costs. Subsidies for renewable energy were about 4% of that—about $10 billion combined for the United States and Europe in 2004. It is through these subsidies that conventional power rates are kept artificially low.
Since we did not include any incentive programs in our simple payback scenario, a true economic comparison between renewable and conventional energy could only be established if subsidies for conventional power were also removed. If were we also able to quantify other externalities to conventional power—such as its environmental impact (climate change; water, soil, and air pollution), impacts to public health, and military requirements to protect the fuel supply and nuclear power plants (and waste storage)—and include this in our comparison, we would get much closer to comparing “apples to apples.”
Because it is unlikely that subsidies for conventional power production will be removed or environmental externalities will be incorporated in the dollars per KWH for conventional energy, offering financial incentives (e.g., rebates, tax credits, tax exemptions) and other subsidies—such as government funds for renewable energy R&D—to renewable energy consumers and producers helps level the playing field between conventional and renewable energy (see “Power Politics,” this issue).
Utility Energy Rates & Payback TimeWhile many utilities sell electricity at affordable rates, inflation as well as energy price history and forecasts indicate price increases in our future, which will make RE systems’ payback even quicker. Historical data reported by the Edison Electric Institute shows that from 1929 to 2005, the average annual price increase for electricity has been 2.94% per year. And according to the Energy Information Administration June 2008 Short Term Energy Outlook, utility rates are projected to increase by an average of 3.7% in 2008 and by another 3.6% in 2009.
Note also that we are figuring payback times on utility rates based on conventional energy production, which does not account for “externalities.” If consumers had to pay for the true price of conventional energy (coal, natural gas, fuel oil, and nuclear) without the benefit of hidden subsidies and unaccounted-for environmental and military costs (see “Leveling the Playing Field” sidebar), payback times for solar would decrease dramatically.
AccessSolar Thermal Editor Chuck Marken (chuck.marken@homepower.
com) is a New Mexico-licensed plumber, electrician, and heating and
air conditioning contractor. He has been installing and servicing solar
thermal systems since 1979. Chuck is a part-time instructor for Solar
Energy International and the University of New Mexico.
Justine Sanchez ([email protected]) is a NABCEP-
certified PV installer, Home Power technical editor, and Solar Energy
International instructor. Justine lives, works, and teaches from an on-
grid PV-powered home in Paonia, Colorado. And while her PV system
will not reach the financial payback milestone for another 44 years (at
the local utility rate of $0.09 per KWH), she couldn’t care less—it has
negated 8,769 pounds of CO2 in its 24 months of operation.
SRCC • www.solar-rating.org
NREL’s PVWatts • http://rredc.nrel.gov/solar/codes_algs/PVWATTS/