Embed Size (px)
Citation preview
Puzzlingly High Correlationsin fMRI Studies of Emotion,Personality, and SocialCognition1Edward Vul,1 Christine Harris,2 Piotr Winkielman,2 & Harold Pashler2
1Massachussetts Institute of Technology and 2University of California, San Diego
ABSTRACT—Functional magnetic resonance imaging (fMRI)studies of emotion, personality, and social cognition havedrawn much attention in recent years, with high-profilestudies frequently reporting extremely high (e.g., >.8) cor-relations between brain activation andpersonalitymeasures.We show that these correlations are higher than should beexpected given the (evidently limited) reliability of both fMRIand personality measures. The high correlations are all themore puzzling because method sections rarely contain muchdetail about how the correlationswere obtained.We surveyedauthors of 55 articles that reported findings of this kind todetermine a few details on how these correlations werecomputed. More than half acknowledged using a strategythat computes separate correlations for individual voxels andreports means of only those voxels exceeding chosen thresh-olds. We show how this nonindependent analysis inflatescorrelations while yielding reassuring-looking scattergrams.This analysis technique was used to obtain the vast majorityof the implausibly high correlations in our survey sample. Inaddition, we argue that, in some cases, other analysis prob-lems likely created entirely spurious correlations. We outlinehow the data from these studies could be reanalyzedwith unbiased methods to provide accurate estimates of thecorrelations in question and urge authors to perform suchreanalyses. The underlying problems described here appearto be common in fMRI research of many kinds—not just instudies of emotion, personality, and social cognition.
Functional magnetic resonance imaging (fMRI) studies ofemotion, personality, and social cognition scarcely existed 10
years ago, and yet the field has already achieved a remarkablelevel of attention and prominence. Within the space of a fewyears, it has spawned several new journals (Social Neuroscience,Social Cognitive and Affective Neuroscience) and is the focus ofsubstantial new funding initiatives (National Institute of Mental
Health, 2007) while receiving lavish attention from the popularpress (Hurley, 2008) and the trade press of the psychological
research community (e.g., Fiske, 2003). Perhaps even moreimpressive, however, is the number of papers from this area thathave appeared in such prominent journals as Science, Nature,and Nature Neuroscience.Although the questions and methods used in such research
are quite diverse, a substantial number of widely cited papers inthis field have reported a specific type of empirical finding that
appears to bridge the divide between mind and brain: extremelyhigh correlations between measures of individual differencesrelating to personality, emotion, and social cognition and mea-
sures of brain activity obtained using fMRI. We focus on thesestudies2 here because this was the area where these correlations
came to our attention; we have no basis for concluding that theproblems discussed here are necessarily any worse in this areathan in some other areas.
The following are a few examples of many studies that will bediscussed in this article:
1This article was formerly known as ‘‘Voodoo Correlations in SocialNeuroscience.’’
Address correspondence to Harold Pashler, Department of Psy-chology 0109, University of California, San Diego, La Jolla, CA92093; e-mail: [email protected].
2Studies of the neural substrates of emotion, personality, and social cognitionrely on many methods besides fMRI and positron emission tomography, in-cluding electroencephalography and magnetoencephalography, animal re-search (e.g., cross-species comparisons), and neuroendocrine andneuroimmunological investigations (Harmon-Jones & Winkielman, 2007).
PERSPECTIVES ON PSYCHOLOGICAL SCIENCE
274 Volume 4—Number 3Copyright r 2009 Association for Psychological Science

1. Eisenberger, Lieberman, and Williams (2003), writing in
Science, described a game they created to expose individualsto social rejection in the laboratory. The authors measured
the brain activity in 13 individuals while the actual rejectiontook place, and they later obtained a self-report measure of
how much distress the subject had experienced. Distress wascorrelated at r 5 .88 with activity in the anterior cingulatecortex (ACC).
2. In another Science article, Singer et al. (2004) found that themagnitude of differential activation within the ACC and left
insula induced by an empathy-related manipulation dis-played a correlation between .52 and .72 with two scales of
emotional empathy (the Empathic Concern Scale of Davisand the Balanced Emotional Empathy Scale of Mehrabian).
3. Writing in NeuroImage, Sander et al. (2005) reported that a
subject’s proneness to anxiety reactions (as measured by anindex of the Behavioral Inhibition System), correlated at r5.96 with the difference in activation of the right cuneus be-tween attended and ignored angry speech.
In this article, we will discuss many studies reporting similarsorts of correlations. The work that led to the present article
began when we became puzzled about how such impressivelyhigh correlations could arise. We describe our efforts to resolve
this puzzlement, and the conclusions that our inquiries have ledus to.Why should it be puzzling to find high correlations between
brain activity and social and emotional measures? After all, ifnew techniques are providing a deeper window on the link be-
tween brain and behavior, does it not make sense that re-searchers should be able to find the neural substrates of
individual traits and thus potentially reveal stronger relation-ships than have often been found in purely behavioral studies?The problem is this: It is a statistical fact (first noted by re-
searchers in the field of classical psychometric test theory) thatthe strength of the correlation observed betweenMeasures A and
B (rObservedA,ObservedB) reflects not only the strength of the rela-tionship between the traits underlying A and B (rA,B), but alsothe reliability of the measures of A and B (reliabilityA and re-liabilityB, respectively). In general,
rObservedA; ObservedB ! rA;B "p#reliabilityA " reliabilityB$
Thus, the reliabilities of two measures provide an upperbound on the possible correlation that can be observed between
the two measures (Nunnally, 1970).3
RELIABILITY ESTIMATES
So what are the reliabilities of fMRI and personality and emo-tional measures likely to be?4 The reliability of personality and
emotional scales varies between measures and according to thenumber of items used in a particular assessment. However, test–
retest reliabilities as high as .8 seem to be relatively uncommonand are usually found only with large and highly refined scales.
Viswesvaran and Ones (2000) surveyed many studies on thereliability of the Big Five factors of personality, and they con-cluded that the different scales have reliabilities ranging from
.73 to .78. Hobbs and Fowler (1974) carefully assessed the re-liability of the subscales of the MMPI and found numbers
ranging between .66 and .94, with an average of .84. In general, arange of .7 to .8 would seem to be a somewhat optimistic estimatefor the smaller and more ad hoc scales used in much of the re-
search described below, which could well have substantiallylower reliabilities.
Less is known about the reliability of blood oxygenation leveldependent (BOLD) signal measures in fMRI, but some relevant
studies have recently been performed.5 Kong et al. (2006) hadsubjects engage in six sessions of a finger-tapping task whilerecording brain activation. They found test–retest correlations of
the change in BOLD signal ranging between 0 and .76 for the setof areas that showed significant activity in all sessions.6 Man-
oach et al. (2001, their Fig. 1, p. 956) scanned subjects in twosessions of performance with the Sternberg memory scanningtask and found reliabilities ranging between .23 to .93, with an
average of .60. Aron, Gluck, and Poldrack (2006) had peopleperform a classification learning task on two separate occasions
widely separated in time and found voxel-level reliabilities withmodal values (see their Fig. 5, p. 1005) a little below .8.7
Johnstone et al. (2005, p. 1118) examined the stability ofamygdala BOLD response to presentations of fearful faces inmultiple sessions: Intraclass correlations for the left and right
amygdale regions of interest were in the range of .4 to .7 for thetwo sessions (which were separated by 2 weeks). Thus, from the
literature that does exist, it would seem reasonable to supposethat fMRI measures computed at the voxel level will not often
have reliabilities greater than about .7.
3This is the case because the correlation coefficient is defined as the ratiobetween the covariance of two measures and the product of their standarddeviations: rx;y ! sxy
sxsy. Real-world measurements will be corrupted by (inde-
pendent) noise, thus the standard deviations of the measured distributions willbe increased by the additional noise (with a magnitude assessed by the mea-sure’s reliability). This will make the measured correlation lower than the trueunderlying correlation by a factor equal to the geometric mean of reliabilities.
4We consider test–retest reliabilities here (rather than interitem, or split–halfreliability) because, for the most part, the studies we discuss gathered behav-ioral measure at different points in time than the fMRI data. In any case, in-ternal reliability measures, like coefficient alpha, do not generally appear to bemuch higher in this domain.
5We focus here on studies that look at the reliability of BOLD signal acti-vation measures rather than the reliability of patterns of voxels exceedingspecific thresholds, which tend to be substantially lower (e.g., Stark et al.,2004).
6It seems likely that restricting the reliability analysis to regions consistentlyactive in all sessions would tend to overestimate the reliability of BOLD signalin general.
7They found somewhat higher reliabilities for voxels within a frontostriatalsystem that they believed was most specifically involved in carrying out theprobabilistic classification learning.
Volume 4—Number 3 275
Edward Vul, Christine Harris, Piotr Winkielman, and Harold Pashler
THE PUZZLE
This, then, is the puzzle. Measures of personality and emotionevidently do not often have reliabilities greater than .8. Neu-
roimaging measures seem typically to be reliable at .7 or less. Ifwe assume that a neuroimaging study is performed in a case
where the underlying correlation between activation in the brainarea and the individual differencemeasure (i.e., the correlation that
would be observed if there were no measurement error) is perfect,8
then the highest expected correlation would bep
(.8" .7), or .74.Surprisingly, correlations exceeding this upper bound are often
reported in recent fMRI studies on emotion, personality, andsocial cognition.
META-ANALYSIS METHODS
We turned to the original articles to find out how common theseremarkable correlations are andwhat analysesmight yield them.
Unfortunately, after a brief review of several articles, it becameapparent that the analyses used varied greatly from one inves-
tigator to the next and that the exact methods were simply notmade clear in the typically brief and sometimes opaque method
sections.To probe the issue further, we conducted a survey of the in-
vestigators. We first attempted to pull together a large sample of
the literature reporting correlations between evoked BOLDsignal activity and behavioral measures of individual differ-
ences in personality, emotionality, social cognition, and relateddomains. We then e-mailed the authors of the articles we iden-tified a brief survey to determine how the reported correlation
values were computed.
Literature ReviewOur literature review was conducted using the keyword fMRI(and variants) in conjunction with a list of social terms (e.g.,jealousy, altruism, personality, grief ). Within the articles re-trieved by these searches, we selected all the articles that re-
ported across-subject correlations between a trait measure andevoked BOLD signal activity. This resulted in 55 articles, with
274 significant correlations between BOLD signal and a traitmeasure. It should be emphasized that we do not suppose this
literature review to be exhaustive. Undoubtedly, wemissed somearticles reporting these kinds of numbers, but our sample seemslikely to be quite representative and perhaps slanted toward
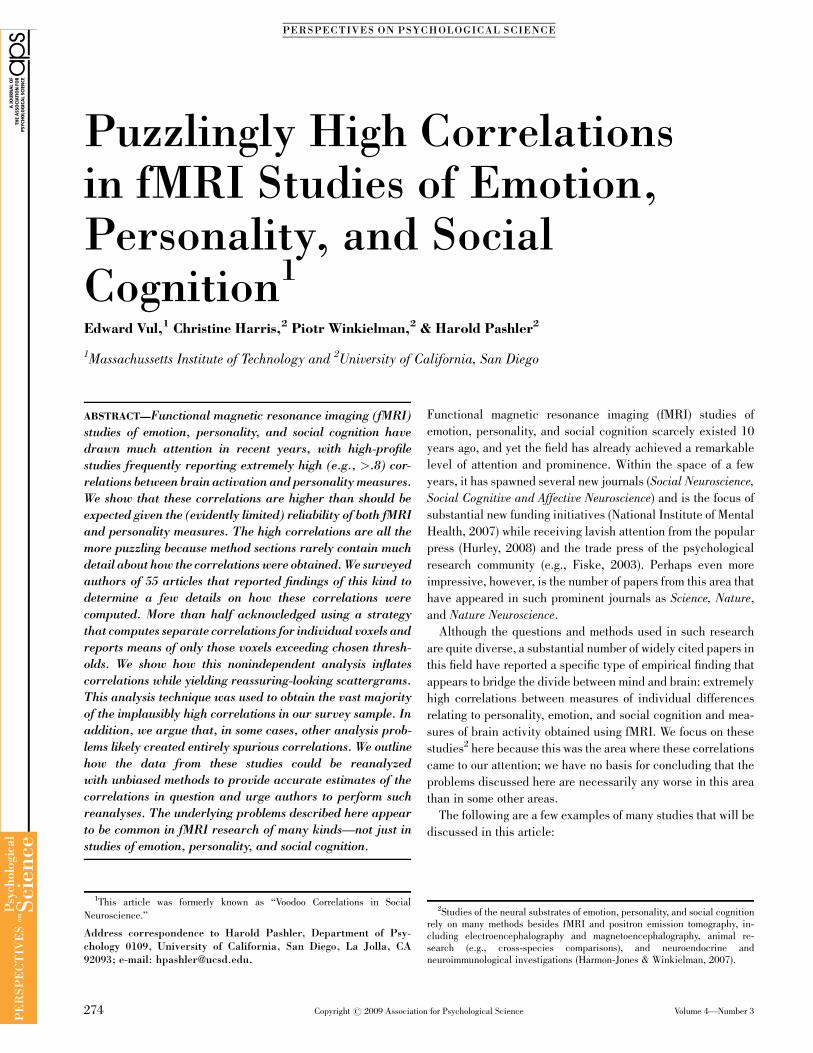
articles that appeared in higher impact journals.A histogram of these significant correlations is displayed in
Figure 1. One can see that correlations in excess of .74 areplentiful indeed.
Next, we ask, ‘‘Where do these numbers come from?’’ Beforedoing so, we have to provide a bit of background for readersunfamiliar with methods in this area.
Elements of fMRI AnalysisFor those not familiar with fMRI analysis, the essential steps injust about any neuroimaging study can be described rather
simply (those familiar with the techniques may wish to skip thissection). The output of an fMRI experiment typically consists oftwo types of ‘‘3D pictures’’ (image volumes): anatomical scans (ahigh-resolution scan that shows anatomical structure, notfunction) and functional scans. Functional image volumes are
lower resolution scans showing measurements reflecting, amongother things, the amount of deoxygenated hemoglobin in theblood (the BOLD signal). A functional image volume is com-
posed of many measurements of the BOLD signal in small,roughly cube-shaped regions called voxels (‘‘volumetric pix-
els’’). The number of voxels in the whole image volume depends
35
30
25
20
15
10
5
0 0.1 0.2 0.3 0.4 0.5 0.6 0.7 0.8 0.9 1Absolute correlation value
Freq
uenc
y(n
umbe
r of s
igni
fican
t cor
rela
tions
repo
rted)
Fig. 1. A histogram of the correlations between evoked blood oxygenationlevel dependent response and behavioral measures of individual differ-ences seen in the studies identified for analysis in the current article.
8There are several reasons why a true correlation of 1.0 seems highly un-realistic. First, it is far-fetched to suppose that only one brain area influencesany behavioral trait. Second, even if the neural underpinnings of a trait wereconfined to one particular region, it would seem to require an extraordinarilyfavorable set of coincidences for the BOLD signal (basically a blood flowmeasure) assessed in one particular stimulus or task contrast to capture allfunctions relevant to the behavioral trait, which, after all, reflects the organi-zation of complex neural circuitry residing in that brain area.
276 Volume 4—Number 3
High Correlations in fMRI Studies

on the scanner settings, but it typically ranges between 10" 64
" 64 and 30 " 128 " 128 voxels. Thus, each functional imagecontains somewhere between 40,000 and 500,000 voxels, with
each of these voxels covering between 1 mm3 (1 mm" 1mm" 1mm) to 125 mm3 (5 mm" 5 mm" 5 mm) of brain tissue (except
for voxels outside of the brain). A new functional image volumeis usually acquired every 2 or 3 s (which is referred to as therepetition time or TR) during a scan, so one ends up with a time
series of these functional images.These data are typically preprocessed to reduce noise and to
allow comparisons between different brains. The preprocessingusually includes smoothing (weighted averaging of each voxelwith
its neighbors where the weighting is provided by some functionthat falls off with distance, typically a Gaussian function). Thestudies we focus on here ultimately compute correlations across
subjects: In this kind of study, the voxels are usually mapped ontoan average brain (although not always; e.g., Yovel & Kanwisher,
2005). A number of average-brain models exist, the most famousbeing Talairach (Talairach & Tournoux, 1988) and MontrealNeurological Institute (Evans et al., 1993), but some investigators
compute an average brain model for their particular subjects andnormalize their functional image scans onto that model.
Following preprocessing, some measure of the activation in agiven voxel needs to be derived to assess if it is related to what
the person is doing, seeing, or feeling. The simplest procedure isjust to extract the average activation in the voxel while theperson does a task. However, because any task will engage most
of the brain (the visual cortex is needed to see the stimulus, themotor cortex is needed to produce a response, etc.), fMRI re-
searchers typically focus not on the activation in particularvoxels during one task, but rather on a contrast between theactivation arising when the person performs one task versus the
activation arising when they do another. This is usually mea-sured as follows: While functional images are being acquired,
the subject does amixed sequence of two different tasks (A, B, B,A, A, B, A, and so forth, where A might be reading words and B
might be looking at nonlinguistic patterns). Thus, the experi-menter ends up with two different time series to compare: thesequence of tasks the person performed and the sequence of
activation levels measured separately at each voxel. A regres-sion analysis can now be performed to ask, ‘‘Is this voxel’s ac-
tivity different when the subject was performing Task A than itwas when the subject performed Task B?’’
These basic steps common to most fMRI data analyses yieldmatrices consisting of tens or hundreds of thousands of numbersindicating activation levels in different voxels. These can be
(and indeed generally are) displayed as images. However, toobtain quantitative summaries of these results and do further
statistics on them (such as correlating them with behavioralmeasures—the topic of the present article), an investigator mustsomehow select a subset of voxels and aggregate measurements
across them. This can be done in various ways. A subset of voxelsin the whole brain image may be selected based on purely an-
atomical constraints (e.g., all voxels in a region generally agreed
to represent the amygdala, or all voxels within a certain radius ofsome a priori specified brain coordinates). Alternatively,
regions can be selected based on ‘‘functional constraints,’’meaning that voxels are selected based on their activity
pattern in functional scans. For example, one could selectall the voxels for a particular subject that responded more toreading than to nonlinguistic stimuli. Finally, voxels could be
chosen based on some combination of anatomy and functionalresponse.
In the articles we are focusing on here, the final result, as wehave seen, was always a correlation value—a correlation be-
tween each person’s score on some behavioral measure and somesummary statistic of their brain activation. The latter summarystatistic reflects the activation or activation contrast within a
certain set of voxels. In either case, the critical question is,‘‘How was this set of voxels selected?’’ As we have seen, voxels
may be selected based on anatomical criteria, functional crite-ria, or both. Within these broad options, there are a number ofadditional more fine-grained choices. It is hardly surprising,
then, that brief method sections rarely suffice to describe howthe analyses were done in adequate detail to really understand
what choices were being made.
Survey MethodsTo learn more than the Method sections of these articles
disclosed about the analyses that yielded these correlations,we e-mailed the corresponding authors of these articles.
The exact wording of our questions is included in Appendix A,but we often needed to send customized follow-up questionsto figure out the exact details when the survey questions
were misunderstood or when we had trouble reconcilingauthors’ responses with what they had written in their methods
section.In our survey, we first inquired whether the fMRI signal
measure that was correlated across subjects with a behavioral
measure represented the average of some number of voxels orthe activity from just one voxel that was deemed most informa-
tive (referred to as the peak voxel).If it was the average of some number of voxels, we asked
whether the voxels were selected on the basis of anatomy,or the activation seen in those voxels, or both. If activationwas used to select voxels, or if one voxel was determined
to be most informative based on its activation, we asked whatmeasure of activation was used. Was it the difference in
activation between two task conditions computed on individualsubjects, or was it a measure of how this task contrastcorrelated with the individual difference measure? Finally,
if functional data were used to select the voxels, we askedif the same functional data were used to compute the reported
correlation.
Volume 4—Number 3 277
Edward Vul, Christine Harris, Piotr Winkielman, and Harold Pashler
Survey ParticipantsOf the 55 articles we found in our review, we received meth-odological details from 53, and 2 did not respond to repeatedrequests.
SURVEY RESULTS
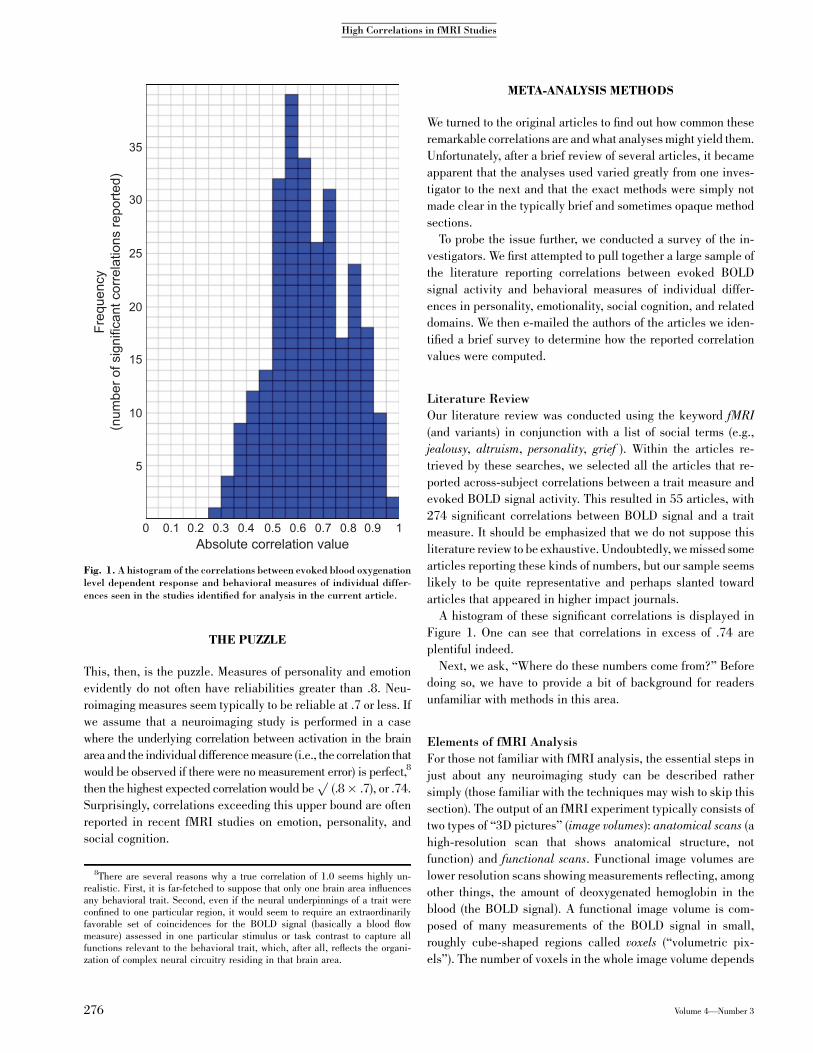
We display the raw results from our survey as the proportion ofstudies that investigators described with a particular answer to
each question (see Fig. 2). As some questions only applied to asubset of participants, we display only the proportion of therelevant subset of studies.
The raw answers to our survey do not by themselves explainhow respondents arrived at the (implausibly high, or so we have
argued) correlations. The key, we believe, lies in the 53% of
respondents who said that ‘‘regression across subjects’’ was the
functional constraint used to select voxels, indicating thatvoxels were selected because they correlated highly with thebehavioral measure of interest.9
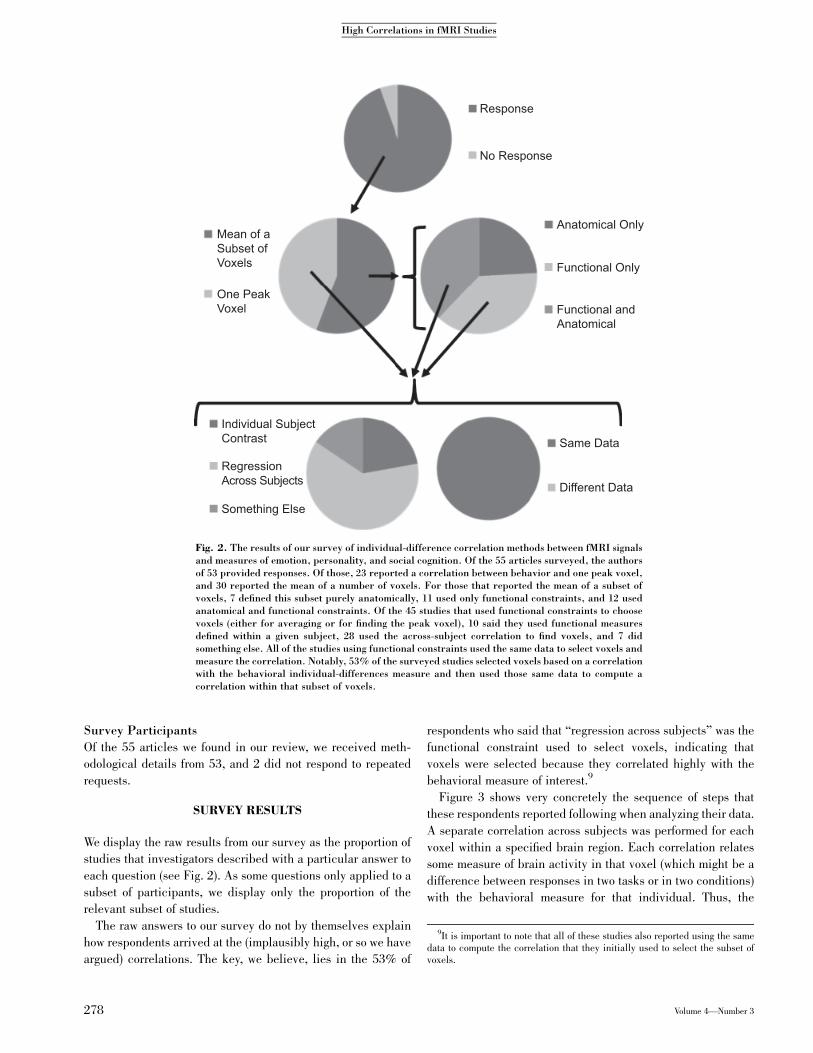
Figure 3 shows very concretely the sequence of steps thatthese respondents reported following when analyzing their data.
A separate correlation across subjects was performed for eachvoxel within a specified brain region. Each correlation relates
some measure of brain activity in that voxel (which might be adifference between responses in two tasks or in two conditions)with the behavioral measure for that individual. Thus, the
Response
No Response
Anatomical Only
Functional Only
Functional andAnatomical
Same Data
Different Data
Mean of aSubset ofVoxels
One PeakVoxel
Individual SubjectContrast
RegressionAcross Subjects
Something Else
Fig. 2. The results of our survey of individual-difference correlation methods between fMRI signalsand measures of emotion, personality, and social cognition. Of the 55 articles surveyed, the authorsof 53 provided responses. Of those, 23 reported a correlation between behavior and one peak voxel,and 30 reported the mean of a number of voxels. For those that reported the mean of a subset ofvoxels, 7 defined this subset purely anatomically, 11 used only functional constraints, and 12 usedanatomical and functional constraints. Of the 45 studies that used functional constraints to choosevoxels (either for averaging or for finding the peak voxel), 10 said they used functional measuresdefined within a given subject, 28 used the across-subject correlation to find voxels, and 7 didsomething else. All of the studies using functional constraints used the same data to select voxels andmeasure the correlation. Notably, 53% of the surveyed studies selected voxels based on a correlationwith the behavioral individual-differences measure and then used those same data to compute acorrelation within that subset of voxels.
9It is important to note that all of these studies also reported using the samedata to compute the correlation that they initially used to select the subset ofvoxels.
278 Volume 4—Number 3
High Correlations in fMRI Studies
number of correlations computed was equal to the numberof voxels, meaning that thousands of correlations were
computed in many cases. At the next stage, researchers selectedthe set of voxels for which this correlation exceeded a
certain threshold, and reported the correlation within this set ofvoxels.
What are the implications of selecting voxels in this fashion?Such an analysis will inflate observed across-subject correla-tions and can even produce significant measures out of pure
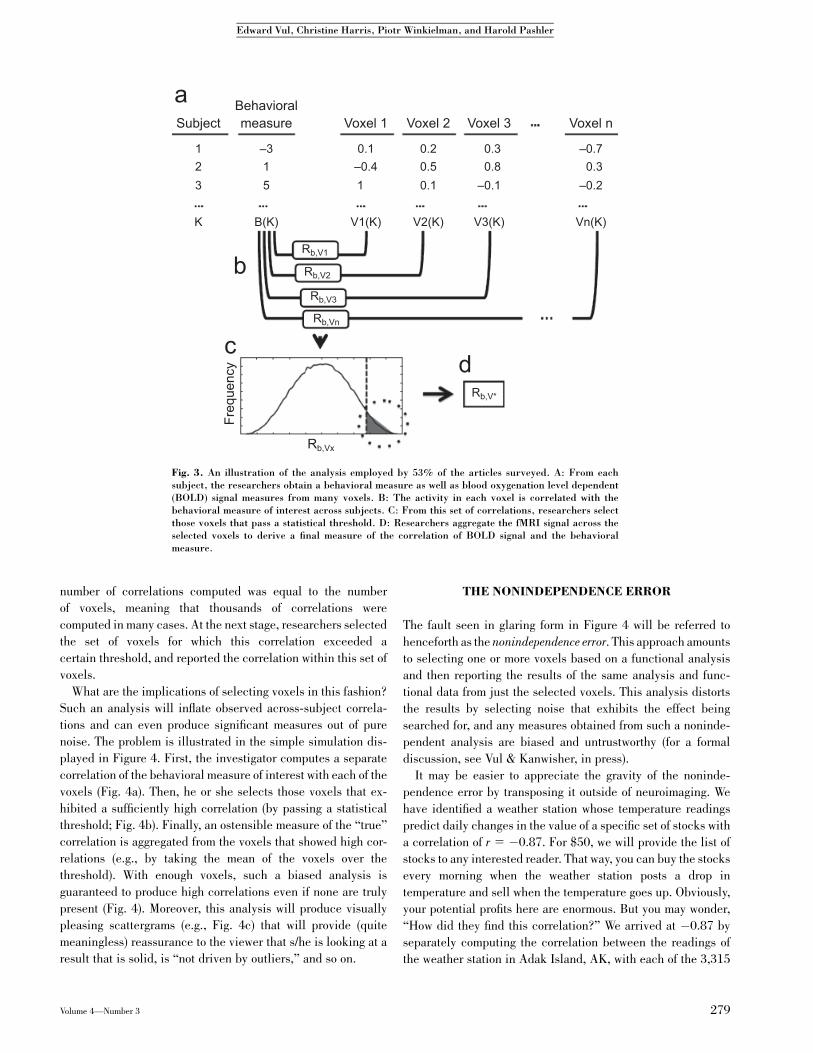
noise. The problem is illustrated in the simple simulation dis-played in Figure 4. First, the investigator computes a separate
correlation of the behavioral measure of interest with each of thevoxels (Fig. 4a). Then, he or she selects those voxels that ex-
hibited a sufficiently high correlation (by passing a statisticalthreshold; Fig. 4b). Finally, an ostensible measure of the ‘‘true’’correlation is aggregated from the voxels that showed high cor-
relations (e.g., by taking the mean of the voxels over thethreshold). With enough voxels, such a biased analysis is
guaranteed to produce high correlations even if none are trulypresent (Fig. 4). Moreover, this analysis will produce visuallypleasing scattergrams (e.g., Fig. 4c) that will provide (quite
meaningless) reassurance to the viewer that s/he is looking at aresult that is solid, is ‘‘not driven by outliers,’’ and so on.
THE NONINDEPENDENCE ERROR
The fault seen in glaring form in Figure 4 will be referred to
henceforth as the nonindependence error. This approach amountsto selecting one or more voxels based on a functional analysisand then reporting the results of the same analysis and func-
tional data from just the selected voxels. This analysis distortsthe results by selecting noise that exhibits the effect being
searched for, and any measures obtained from such a noninde-pendent analysis are biased and untrustworthy (for a formal
discussion, see Vul & Kanwisher, in press).It may be easier to appreciate the gravity of the noninde-
pendence error by transposing it outside of neuroimaging. We
have identified a weather station whose temperature readingspredict daily changes in the value of a specific set of stocks with
a correlation of r 5 %0.87. For $50, we will provide the list ofstocks to any interested reader. That way, you can buy the stocksevery morning when the weather station posts a drop in
temperature and sell when the temperature goes up. Obviously,your potential profits here are enormous. But you may wonder,
‘‘How did they find this correlation?’’ We arrived at %0.87 byseparately computing the correlation between the readings of
the weather station in Adak Island, AK, with each of the 3,315
Subject
a
b
cd
measureBehavioral
Voxel 1 Voxel 2 Voxel 3 Voxel n
–0.70.3
–0.2
Vn(K)V3(K)V2(K)V1(K)B(K)K
123
–315
0.1–0.41
0.20.50.1
0.30.8
–0.1
Rb,V1
Rb,V2
Rb,V3
Rb,Vn
Rb,Vx
Rb,V*
Freq
uenc
y
Fig. 3. An illustration of the analysis employed by 53% of the articles surveyed. A: From eachsubject, the researchers obtain a behavioral measure as well as blood oxygenation level dependent(BOLD) signal measures from many voxels. B: The activity in each voxel is correlated with thebehavioral measure of interest across subjects. C: From this set of correlations, researchers selectthose voxels that pass a statistical threshold. D: Researchers aggregate the fMRI signal across theselected voxels to derive a final measure of the correlation of BOLD signal and the behavioralmeasure.
Volume 4—Number 3 279
Edward Vul, Christine Harris, Piotr Winkielman, and Harold Pashler
financial instruments available for the New York Stock Ex-change (through the Mathematica function FinancialData;
Wolfram Research, Champaign, IL) over the 10 days that themarket was open between November 18 and December 3, 2008.
We then averaged the correlation values of the stocks whosecorrelation exceeded a high threshold of our choosing, thusyielding the figure of %0.87. Should you pay us for this invest-
ment strategy? Probably not: Of the 3,315 stocks assessed, somewere sure to be correlated with the Adak Island temperature
measurements simply by chance—and if we select just those (asour selection process would do), there is no doubt we would find
a high average correlation. Thus, the final measure (the averagecorrelation of a subset of stocks) was not independent of theselection criteria (how stocks were chosen): this, in essence, is
the nonindependence error. The fact that random noise in pre-vious stock fluctuations aligned with the temperature readings is
no reason to suspect that future fluctuations can be predicted bythe same measure, and one would be wise to keep one’s moneyfar away from us or any other such investment adviser.10
Variants of the nonindependence error occur inmany differenttypes of neuroimaging studies and in many different domains.
The nonindependence error is by no means confined to fMRIstudies on emotion, personality, and social cognition, nor to
studies correlating individual behavioral differences with evokedfMRI activity. (For broader discussions of how nonindependent
analyses producemisleading results in other domains, see Baker,Hutchinson, & Kanwisher, 2007; Baker, Simmons, Bellgowan,
& Kriegeskorte, 2007; Kriegeskorte, Simmons, Bellgowan, &Baker, in press; Vul & Kanwisher, in press.)Our survey allows us to determine which of the studies were
committing variants of the nonindependence error by findinganalyses in which researchers selected voxels (i.e., they an-
swered A or B to Question 1) based on correlation with theacross-subject behavioral measure of interest (i.e., they an-
swered B or C to Question 2 and B to Question 3) and thenplotted or reported the observed correlations from just thosevoxels (i.e., they answered A to Question 4).
RESULTS AND DISCUSSION
For maximum clarity, we will present the results of our survey, as
well as our overall analysis of how these results should be in-terpreted, in the form of a number of questions and answers.
Are the Correlation Values Reported in ThisLiterature Meaningful?Of the 53 articles we successfully surveyed, 28 provided re-sponses indicating that a nonindependent analysis, like the one
portrayed in Figures 3 and 4, was used to obtain the across-
–1 0
a
c
b
1
–1 0 1
–2–2
0
0
2
2
Freq
uenc
y
Mea
n Vo
xel A
ctiv
ity
Freq
uenc
yCorrelation (Rb,Vx)
Correlation (Rb,V*)
Behavioral Measure
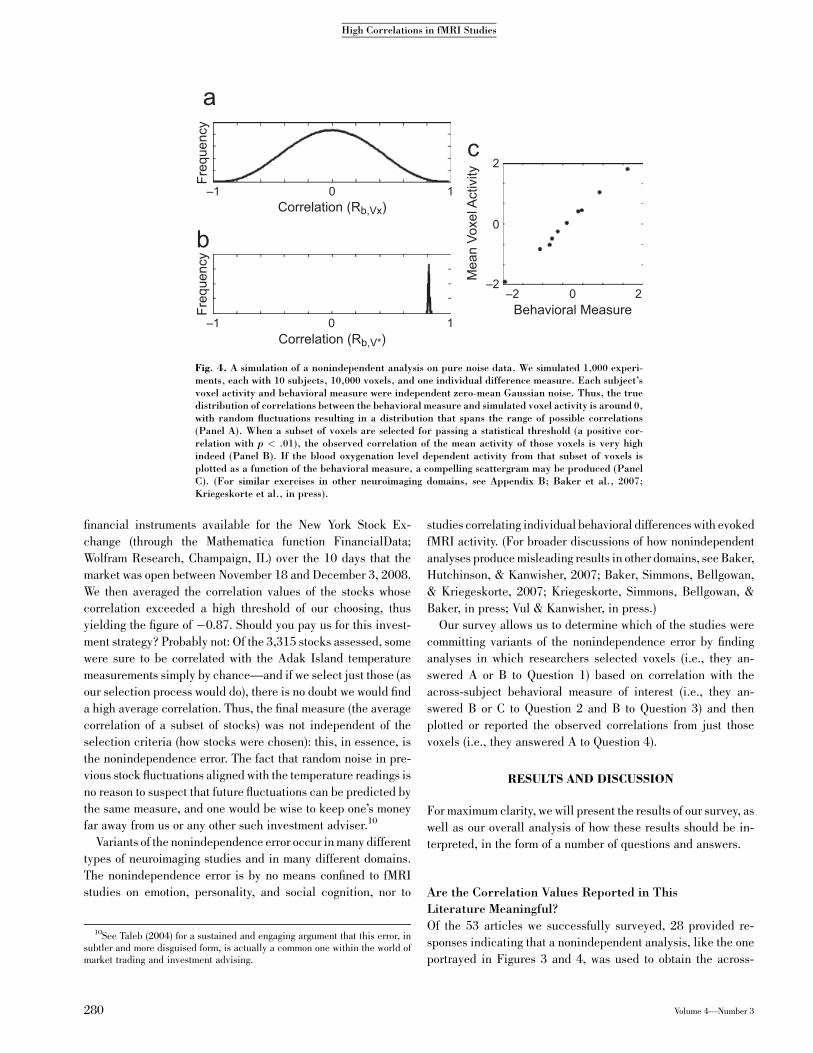
Fig. 4. A simulation of a nonindependent analysis on pure noise data. We simulated 1,000 experi-ments, each with 10 subjects, 10,000 voxels, and one individual difference measure. Each subject’svoxel activity and behavioral measure were independent zero-mean Gaussian noise. Thus, the truedistribution of correlations between the behavioral measure and simulated voxel activity is around 0,with random fluctuations resulting in a distribution that spans the range of possible correlations(Panel A). When a subset of voxels are selected for passing a statistical threshold (a positive cor-relation with p < .01), the observed correlation of the mean activity of those voxels is very highindeed (Panel B). If the blood oxygenation level dependent activity from that subset of voxels isplotted as a function of the behavioral measure, a compelling scattergram may be produced (PanelC). (For similar exercises in other neuroimaging domains, see Appendix B; Baker et al., 2007;Kriegeskorte et al., in press).
10See Taleb (2004) for a sustained and engaging argument that this error, insubtler and more disguised form, is actually a common one within the world ofmarket trading and investment advising.
280 Volume 4—Number 3
High Correlations in fMRI Studies
subject correlations between evoked BOLD signal activity and a
measure of individual differences. As we saw in Figure 4, a non-independent analysis systematically distorts any true correla-
tions thatmight exist. Thus, in half of the studies we surveyed, thereported correlation coefficients mean almost nothing, because
they are systematically inflated by the biased analysis. Themagnitude of this distortion depends on variables that a readerwould have no way of knowing (such as the number of voxels
within the brain, noise and signal variance, etc.), so it is notpossible to correct for it. The problem is exacerbated in the case
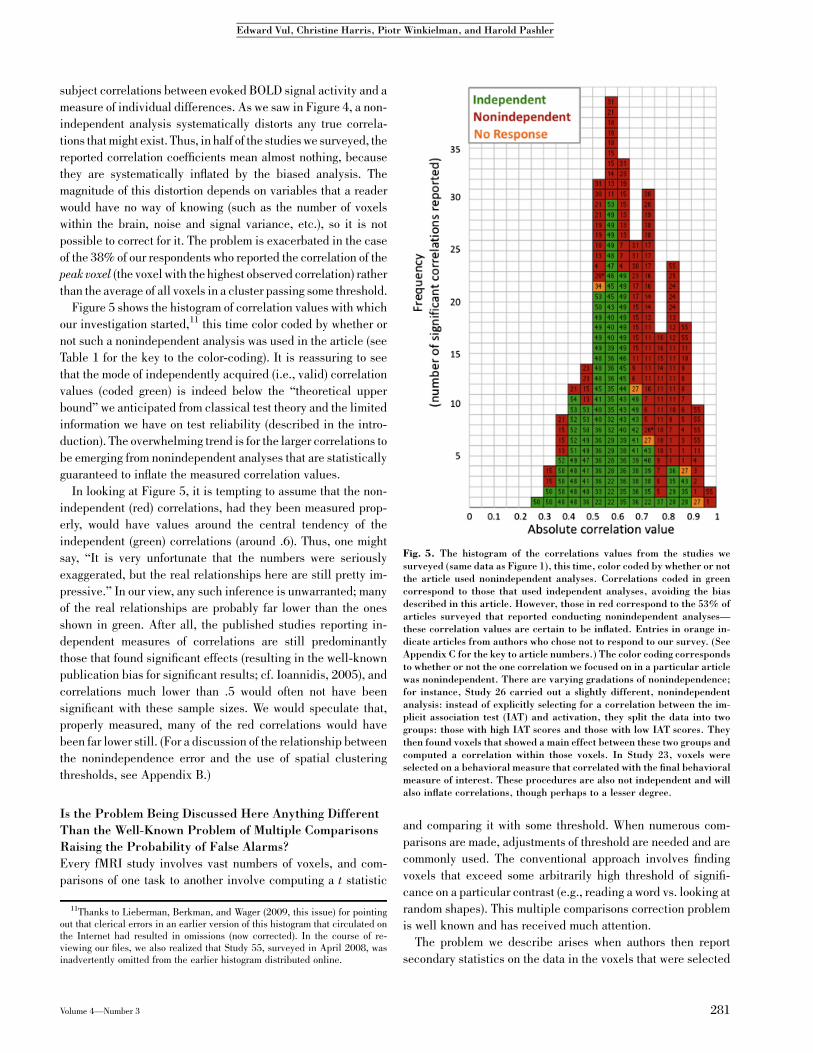
of the 38% of our respondents who reported the correlation of thepeak voxel (the voxel with the highest observed correlation) ratherthan the average of all voxels in a cluster passing some threshold.Figure 5 shows the histogram of correlation values with which
our investigation started,11 this time color coded by whether or
not such a nonindependent analysis was used in the article (seeTable 1 for the key to the color-coding). It is reassuring to see
that the mode of independently acquired (i.e., valid) correlationvalues (coded green) is indeed below the ‘‘theoretical upperbound’’ we anticipated from classical test theory and the limited
information we have on test reliability (described in the intro-duction). The overwhelming trend is for the larger correlations to
be emerging from nonindependent analyses that are statisticallyguaranteed to inflate the measured correlation values.
In looking at Figure 5, it is tempting to assume that the non-independent (red) correlations, had they been measured prop-erly, would have values around the central tendency of the
independent (green) correlations (around .6). Thus, one mightsay, ‘‘It is very unfortunate that the numbers were seriously
exaggerated, but the real relationships here are still pretty im-pressive.’’ In our view, any such inference is unwarranted; manyof the real relationships are probably far lower than the ones
shown in green. After all, the published studies reporting in-dependent measures of correlations are still predominantly
those that found significant effects (resulting in the well-knownpublication bias for significant results; cf. Ioannidis, 2005), and
correlations much lower than .5 would often not have beensignificant with these sample sizes. We would speculate that,properly measured, many of the red correlations would have
been far lower still. (For a discussion of the relationship betweenthe nonindependence error and the use of spatial clustering
thresholds, see Appendix B.)
Is the Problem Being Discussed Here Anything DifferentThan the Well-Known Problem of Multiple ComparisonsRaising the Probability of False Alarms?Every fMRI study involves vast numbers of voxels, and com-parisons of one task to another involve computing a t statistic
and comparing it with some threshold. When numerous com-
parisons are made, adjustments of threshold are needed and arecommonly used. The conventional approach involves finding
voxels that exceed some arbitrarily high threshold of signifi-cance on a particular contrast (e.g., reading a word vs. looking at
random shapes). This multiple comparisons correction problemis well known and has received much attention.The problem we describe arises when authors then report
secondary statistics on the data in the voxels that were selected
Fig. 5. The histogram of the correlations values from the studies wesurveyed (same data as Figure 1), this time, color coded by whether or notthe article used nonindependent analyses. Correlations coded in greencorrespond to those that used independent analyses, avoiding the biasdescribed in this article. However, those in red correspond to the 53% ofarticles surveyed that reported conducting nonindependent analyses—these correlation values are certain to be inflated. Entries in orange in-dicate articles from authors who chose not to respond to our survey. (SeeAppendix C for the key to article numbers.) The color coding correspondsto whether or not the one correlation we focused on in a particular articlewas nonindependent. There are varying gradations of nonindependence;for instance, Study 26 carried out a slightly different, nonindependentanalysis: instead of explicitly selecting for a correlation between the im-plicit association test (IAT) and activation, they split the data into twogroups: those with high IAT scores and those with low IAT scores. Theythen found voxels that showed a main effect between these two groups andcomputed a correlation within those voxels. In Study 23, voxels wereselected on a behavioral measure that correlated with the final behavioralmeasure of interest. These procedures are also not independent and willalso inflate correlations, though perhaps to a lesser degree.
11Thanks to Lieberman, Berkman, and Wager (2009, this issue) for pointingout that clerical errors in an earlier version of this histogram that circulated onthe Internet had resulted in omissions (now corrected). In the course of re-viewing our files, we also realized that Study 55, surveyed in April 2008, wasinadvertently omitted from the earlier histogram distributed online.
Volume 4—Number 3 281
Edward Vul, Christine Harris, Piotr Winkielman, and Harold Pashler
originally. In the case discussed in this article, correlations are
both the selection criterion and the secondary statistic.When people compare reading a word with reading a letter
and find brain areas with a t value of 13.2 (with 11 degrees offreedom, comparable to an r of .97 or an effect size of d5 2.4),
few people would interpret the t value as a measure of effect size.On the other hand, we would contend that essentially everyoneinterprets the r values under discussion here in that way.
What May Be Inferred From the Scattergrams OftenExhibited in Connection With Nonindependent Analyses?Many of the articles reporting biased correlation values displayscattergram plots of evoked activity as a function of the be-havioral measure. These plots are presumably included to show
the reader that the correlation is not being driven by a fewoutliers or by other aberrations in the data. However, when
nonindependent selection criteria are used to pick out a subsetof voxels, the voxels passing this criterion will inevitably containa large admixture of noise favoring the correlation (see the
scattergram in Figure 4c for an example of a case in which therelationship is pure noise). Thus, the shape of the resulting
scattergrams provides no reliable indication about the nature ofthe possible correlation signal underlying the noise, if any.
How Can These Same Methods Sometimes ProduceNo Correlations?It may be as surprising to some readers, as it was to us, that a few
articles reporting extraordinarily high correlations arrived atthrough nonindependent analyses also reported some negative
results (correlations that failed to reach significance). If thesame analysis methods were applied to each correlation inves-tigated, shouldn’t the same correlation-amplifying bias apply to
each one?Indeed it should. However, with a bit of investigation, we were
able to track down the source of (at least some of) the incon-sistency: in certain articles, the bias inherent in nonindepen-dent analyses was sometimes wielded selectively, in such a way
as to inflate certain correlations but not others.Take for instance Takahashi et al. (2006), reporting an inter-
action in the presence of a correlation between evoked BOLDsignal activity and rated jealousy in men and women: Activity in
the insula correlated with self-reported jealousy about emo-tional infidelity in men (r5 .88), but not women (r5%.03). Theopposite was true of the activity in the posterior superior tem-
poral sulcus, which correlated with self-reported jealousy inwomen (r 5 .88), but not men (r 5 %.07). At first blush, the
scattergrams and correlations exhibit a very striking interaction(reported as significant at p< .001). However, the insula activitycorresponds to the peak voxel of a cluster that passed statistical
threshold for the correlation between rated jealousy and BOLDsignal in males; thus, the observed correlation with rated jeal-
ousy in males was nonindependent and biased, whereas the
same correlation for rated jealousy in females was independent.
The posterior superior temporal sulcus activity was selectedbecause of the correlation with rated jealousy in females, and
thus only the jealousy correlation in males was independent inthat region.
It should come as no surprise, therefore, that such noninde-pendently selected data produced a striking interaction in whichthe nonindependent analyses showed high correlations, whereas
the independent analyses showed no correlation. Thus, thepresence of the interaction, along with the magnitude of the
correlations themselves, is quite meaningless and couldhave been obtained with completely random data like those
utilized in the simulation shown in Figure 4.
But Is There Really Any Viable Alternative to TheseNonindependent Analyses?It is all very well to point out ways in which researchmethods fallshort of the ideal. However, the ideal experiment and the ideal
analysis are often out of reach, especially in fields like psy-chology and cognitive neuroscience. Perhaps we must settle for
somewhat imperfect designs and methods to get any informationwhatsoever about across-subject brain–behavior correlations.
Are any better methods available?We contend that the answer is a clear-cut ‘‘Yes.’’ These kinds
of brain–behavior linkages can be readily investigated with
methods that do not produce any of the rather disastrouscomplications that accompany the use of nonindependent
analyses.One method is to select the voxels comprising different re-
gions of interest in a principled way that is ‘‘blind’’ to the cor-relations of those voxels with the behavioral measure andalso mindful of the fact that individuals’ brains are far from
identical. For instance, to assess the relationship between ACCactivity during exclusion and reactions to social rejection
measured in a questionnaire, one would first put the social re-jection data aside and not ‘‘peek’’ at it while analyzing the fMRIdata. The researcher can then define regions of interest in in-
dividual subjects in whatever way seems appropriate (e.g., byidentifying voxels within the anatomical confines of the ACC
that were significantly active for the excluded–included con-trast, or, even better, by using a different contrast or different
data altogether). Once a subset of voxels is defined within anindividual subject, one number should be aggregated from thesevoxels (e.g., the mean signal change). Only then can one ex-
amine the behavioral data and compute an unbiased correlationbetween the ACC region of interest and the behavioral measure.
This method was used by a few of the authors of the currentstudies (e.g., Kross, Egner, Ochsner, Hirsch, & Downey, 2007).In addition to providing an unbiased measure of any relation-
ships between evoked activity and individual differences, this‘‘functional Region of Interest’’ method avoids implausible as-
sumptions about voxel-wise correspondence across different
282 Volume 4—Number 3
High Correlations in fMRI Studies

individuals’ functional anatomy12 (Saxe, Brett, & Kanwisher,
2006).If one feels that it makes sense to draw voxel-wise corre-
spondences between the functional anatomy of one subject andanother, a second alternative exists: a ‘‘split half’’ analysis.
Here, half of the data are used to select a subset of voxels ex-hibiting the correlation of interest, and the other half of the dataare used to measure the effect (examining the same voxels, but
looking at different runs of the scanner). For example, if thereare four runs in the social exclusion and four runs in the neutral
condition, one can use two exclusion runs and two neutral runsto identify voxels that maximize the correlation, and then test the
correlation of the behavioral trait with these same voxels whilelooking only at the other two pairs of runs. Such a procedure usesindependent data for voxel selection and the subsequent cor-
relation test and thus avoids the nonindependence error.13 Thisstraightforward analysis may be computed on all of the suspect
results noted in our article thus far and can be used to provideunbiased estimates of the correlations reported in these articles.Techniques of this kind (hold out validation and cross-
validation) are used in a variety of fields (including fMRI) toevaluate the generality of conclusions when overfitting is a
possibility (Geisser, 1993), as is the case when picking a smallsubset of many measured correlations as a measure of the true
correlation.It may often be advisable to use both of the methods just de-
scribed, because they may find slightly different kinds of (real)
patterns in the data. The first type of analysis focuses on thevoxels that are most active in the task contrast at issue. This
is a sensible place to look first to find relationships with indi-vidual differences. However, it is possible that the behavioralindividual differences may be most closely associated with ac-
tivity in some subset of voxels that may not show the greatestactivity in this contrast. For example, it is possible that there
could be neural structures within the ACC whose magnitude of
response is related to rejection, even if the mean activation in
those structures across subjects does not differ from zero.
Even If Correlations Were Overestimated Due toNonindependent Analyses, Can’t We At Least Be Sure theCorrelations Are Statistically Significant and That a Real,Nonzero Correlation Exists?In most of the nonindependent analyses, the voxels included inthe computation of the reported correlation were those that
passed a threshold for significance that was based on somecombination of the correlation value for each voxel and the
spatial contiguity between the voxel and other above: thresholdvoxels—a threshold that typically included some ostensibleadjustment for multiple comparisons. Given that, can we not be
sure that there is a real correlation, albeit one that is weaker thanreported? In principle, this ought to be the case, but only if the cor-
rection for multiple comparisons is appropriately implemented.We did not explicitly survey the authors about their multiple
comparisons correction procedures, but we do see evidence that
some of the corrections used in this literature may be less thantrustworthy. The most common method of correcting for multiple
comparisons used in this literature is family-wise error correctionrelying on ‘‘minimum cluster size thresholds.’’14 In this approach,
the correlation in clusters of voxels is determined to be significantif the cluster contains a sufficiently large number of contiguousvoxels, each of which exceed some statistical threshold. This
procedure ‘‘relies on the assumption that areas of true neuralactivity will tend to stimulate signal changes over contiguous
pixels’’ (Forman et al., 1995; i.e., ‘‘signal’’ will tend to show up asactivity that extends beyond a single voxel, whereas statistical
noise will generally be independent from one voxel to its neigh-boring voxel and thus will not usually appear in large clusters).15
Given particular scan parameters,16 one can use various so-
phisticated techniques to compute the probability of falselydetecting a cluster of voxels (Type I error). This probability may
be estimated using the AlphaSim tool from the AFNI (Analysisfor Functional NeuroImaging) program (Cox, 1996).17 We12Although it is possible for voxels registered to the ‘‘average brain’’ to be
functionally matched across subjects, the variability in anatomical location ofwell-studied regions in early visual processing (V1, MT) and visual cognition(FFA) suggests to us that higher level functions determining individual differ-ences in personality and emotionality are not likely to be anatomically uniformacross individuals (Saxe, Brett, & Kanwisher, 2006).
13At first blush, one might worry that using only half of the data to select thecorrelated regions will greatly decrease statistical power. However, there aretwo reasons why this should not be a concern. First, removing half of the datafrom each subject does not reduce the number of data points that go into theacross-subject correlation—it simply makes the estimate of BOLD activity foran individual subject more noisy by a factor of
p2. This is not as detrimental to
the ability to evaluate a correlation as is the reduction of the number of datapoints. Second, stringent corrections for multiple comparisons are unnecessaryfor an independent split-half analysis; thus, a (reasonable) liberal threshold maybe chosen to select the subset of voxels that correlate with the behavioralmeasure in the first half of the data. The statistical inference relies on themagnitude of the correlation observed in those voxels in the second half of thedata using a single comparison, which will have ample power to detect anyeffect that may be close to significant in a properly corrected whole-brainanalysis. For an even more data-efficient (but computationally intensive) in-dependent validation technique, variants of the ‘‘k-fold method’’ can also beused (Brieman & Spector, 1992).
14See Appendix B for a discussion of whether the problem of inflated cor-relations is eliminated by the use of a cluster-based threshold.
15Technically, the rationale is somewhat more complicated and relies onestimates of the spatial correlations known to be present in the voxels (e.g., dueto smoothing). The smoothness assumption defines how likely it is for pure noiseobservations with these spatial statistics to contain clusters with a particularnumber of contiguous voxels exceeding statistical threshold.
16These parameters include voxel dimensions, volume dimensions, smooth-ing parameter (sometimes data smoothness as estimated from the data), mini-mum cluster size, and minimum single-voxel p threshold.
17AlphaSim allows users to enter an estimate of smoothness of the data (theliteral smoothing kernel is often an underestimate, and a better estimate is touse the output of the FWHMx function, which computes a measure ofsmoothness by measuring the spatial correlation in the data in addition to thesmoothing parameter applied—this is the default in the Statistical ParametricMapping software package). Thus, simply entering the smoothing kernel intoAlphaSim underestimates the smoothness of the data and underestimates theprobability of a falsely detected cluster. For our purposes, this means that thenumbers obtained from AlphaSim will actually underestimate how large theclusters must be to reach a certain false alarm probability.
Volume 4—Number 3 283
Edward Vul, Christine Harris, Piotr Winkielman, and Harold Pashler
noticed that many articles in our sample used p thresholds of
.005 and cluster size thresholds of 10, and the researchers statedthat these choices were made relying upon Forman et al. (1995)
as an authority. For instance, Eisenberger et al. (2003) claimedthat their analysis had a per-voxel false positive probability of
less than 0.000001. They used these thresholds on 19" 64" 64voxel imaging volumes at 3.125 mm " 3.125 mm " 4.000 mm,smoothed with 8 mm full-width at half-max Gaussian kernel. We
were puzzled that these parameters would be able to reduce therate of false alarms to the degree claimed, and so we used Al-
phaSim to investigate. According to the AlphaSim simulations,pure noise data is likely to yield a cluster passing this threshold
in nearly 100% of all runs (a per-voxel false alarm probability of0.002)! To hold the false detection probability for a particularcluster below .00003 (thus keeping the overall probability of a
false positive in the analysis below the commonly desired alphalevel of 0.05), a far larger cluster size (namely, 41 voxels) would
need to be used.18 Thus, we suspect that the .000001 figure citedby Eisenberger et al. (2003) and other authors actually reflects amisinterpretation of Forman’s simulations results.19 It seems
that ostensible corrections for multiple comparisons with thecluster size method are at least sometimes misapplied, and thus
even the statistical significance of some correlations in thisliterature may be questionable.
In general, it is important to keep in mind what statistics theconclusions of a particular paper rely on. In many papers, re-searchers use a liberal threshold to select a region of interest
(ROI; one that would be insufficiently conservative to address themultiple comparisons problem) and then compute an indepen-
dent test on the ROI voxels. The conclusions of such papersusually rest on the secondary statistic computed within the ROI;the threshold used to select the ROI voxels does not matter as
much. In the cases we discuss in this article, the secondary sta-tistics are nonindependent and are thus biased and meaningless.
In these cases, the criteria used to select voxels becomes the onlystatistic that may legitimately be used to evaluate the probability
of a false alarm in the results; thus, the selection criteria are ofutmost importance for the conclusions of the article.It should be emphasized that we certainly do not contend that
problems with corrections for multiple comparisons exist in all
(or even a majority) of the articles surveyed. Many comparisons
are corrected in a defensible fashion. Moreover, even articlesusing multiple comparisons corrections that, strictly speaking,
rely on assumptions that were not really met likely report rela-tionships that do indeed exist at least to some nonzero extent. In
any case, we argue that (a) the actual correlation values reportedby the nonindependent analyses comprising over half of thestudies we examined are sure to be inflated to the point of being
completely untrustworthy; (b) assertions of statistical signifi-cance of the whole-brain analysis used to select voxels require
careful scrutiny—which does not always appear to have beendone in the publication process; and, perhaps most importantly,
(c) if researchers would use the approaches recommended onp. 282, they could avoid the whole treacherous terrain of non-independent analyses and its attendant uncertainties and
complexities. In this way, the statistics would only need to bedone once, the false alarm risk would be completely transparent,
and there would be no need to use highly complex corrections formultiple comparisons that rest on hard-to-assess assumptions.
Isn’t a Significant (Nonzero) Correlation Really WhatMatters, Anyway? Does the Actual Correlation ValueReally Matter So Much?We contend that the magnitude, rather than the mere existence,of the correlation is what really matters. A correlation of 0.96 (as
in Sander et al., 2005), indicates that 92% of the variance inproneness to anxiety is predicted by the right cuneus response to
angry speech. A relationship of such strength would be a mile-stone in the understanding of brain–behavior linkages and
would promise potential diagnostic and therapeutic spin-offs. Incontrast, suppose—and here we speak purely hypothetically—that the true correlation in this case were 0.1, accounting for 1%
of the variance. The practical implications would be far less, andthe scientific interest would be greatly reduced as well. A cor-
relation of 0.1 could be mediated by a wide variety of highlyindirect relationships devoid of any generality or interest. Forinstance, proneness to anxiety may lead people to breathe faster,
drink more coffee, or make slightly different choices in whichlipids they ingest. All of these are known to have effects on
BOLD responses (Mulderink, Gitelman, Mesulam, & Parrish,2002; Noseworthy, Alfonsi, & Bells, 2003; Weckesser et al.,
1999), and those effects could easily interact slightly with thespecific hemodynamic responses of different brain areas. Orperhaps anxious people are more afraid of failing to follow task
instructions and thus attend ever so slightly more to the requiredauditory stream. The weaker the correlation, the greater the
number of indirect and uninteresting causal chains that might beaccounting for it, and the greater the chance that the effect itselfwill appear and disappear in different samples in a completely
inscrutable fashion (e.g., if the dietary propensities of anxiouspeople in England differ from those of anxious people in Japan).
We suspect that it is for this reason that the field of risk-factor
18Even if the brain occupied just one tenth of the imaging volume (7,700voxels), the parameters described would falsely detect a cluster 60% of the timein pure noise—in this case, the appropriate minimum cluster-size thresholdwould need to be 27, rather than 10, to reach a false detection rate of 0.05.
19The per-voxel false detection probabilities described by Eisenberger et al.(2003) and others seem to come from Forman et al.’s Table 2C. Values in Formanet al.’s table report the probability of false alarms that cluster within a single 2Dslice (a single 128 " 128 voxel slice, smoothed with a Gaussian kernel with afull-width at half max of 0.6" voxel size). However, the statistics of clusters in asingle 2D slice are very different from those of a 3D volume: There are manymore opportunity for spatially clustering false alarm voxels in the 3D case thanin the 2D case. Moreover, the smoothing parameter used in the articles inquestion was much larger than 0.6" voxel size assumed by Forman in Table 2C(in Eisenberger et al., 2003, this was >2 " voxel size). The smoothing, too,increases the chances of false alarms appearing in larger spatial clusters.
284 Volume 4—Number 3
High Correlations in fMRI Studies
epidemiology is said to have reached some consensus that
findings involving modest but statistically significant risk ratios(e.g., ratios between 1.0 and 2.0) have not generally proven to be
robust or important. It seems likely to us that most reviewers inbehavioral and brain sciences also implicitly view correlation
magnitude as important, and we suspect that the very fact that somany of the studies reviewed here appeared in high-impactjournals partly reflects the high correlation values they reported.
CONCLUDING REMARKS
We began this article by arguing that many correlations reportedin recent fMRI studies on emotion, personality, and socialcognition are ‘‘impossibly high.’’ Correlations of this magnitude
are unlikely to occur even if one makes the (implausible) as-sumption that the true underlying correlations—the correlations
that would be observed if there were no measurement error—are perfect. We then described our efforts to figure out how theseimpossible results could possibly be arising. Although the
method sections of articles in this area did not provide muchinformation about how analyses were being done, a survey of
researchers provided a clear and worrisome picture. Over half ofthe investigators in this area used methods that are guaranteed
to offer greatly inflated estimates of correlations. As seen inFigure 5, these procedures turn out to be associated with thegreat majority of the correlations in the literature that struck us
as impossibly high.20
We suspect that the problems brought to light here are ones
that most editors and reviewers of studies using purely behav-ioral measures would usually be quite sensitive to. Suppose anauthor reported that a questionnaire measure was correlated
with some target behavioral measure at r5 .85 and that he or shearrived at this number by separately computing the correlation
between the target measure and each of the items on the ques-tionnaire and reporting just the average of the highest correlated
questionnaire items. Moreover, to assess whether these highestcorrelated questionnaire items were just the tail of a chancedistribution across the many items, the author used a filtering
procedure with properties too complex to derive analytically. Webelieve that few prestigious psychology journals would publish
such findings. It may be that the problems are not being rec-ognized in this field because of the relative unfamiliarity of the
measures and the relatively greater complexity of the data an-alyses. Moreover, perhaps the fact that the articles report usingprocedures that include some precautions relating to the issue of
multiple comparisons leads reviewers to assume that suchmatters are all well taken care of.
As discussed above, one thing our conclusions leave open iswhether there is at least some real relationship behind any giveninflated correlation (i.e., a true correlation higher than zero).
Most investigators used thresholds that ostensibly correct for
multiple comparisons, but we have argued that these correctionswere seriously misapplied in some cases. Based on the analysis
described above, we suspect that although the reported rela-tionships probably reflect some underlying relationship in many
cases (albeit amuchweaker relationship than the numbers in thearticles implied), it is quite possible that a considerable numberof relationships reported in this literature are entirely illusory.
To sum up, then, we are led to conclude that a disturbinglylarge, and quite prominent, segment of fMRI research on emo-
tion, personality, and social cognition is using seriously defec-tive research methods and producing a profusion of numbers
that should not be believed. Although we have focused here onstudies relating to emotion, personality, and social cognition, wesuspect that the questionable analysis methods discussed here
are also widespread in other fields that use fMRI to study in-dividual differences, such as cognitive neuroscience, clinical
neuroscience, and neurogenetics.Despite the dismal scenario painted in the last paragraph, we
can end on a much more positive note. We pointed out earlier
how investigators could have explored these behavioral-trait/brain-activity correlations using methods that do not have any of
the logical and statistical deficiencies described here. The goodnews is that in almost all cases the correct (and simpler) analyses
can still be performed. It is routine for researchers to archivelarge neuroimaging data sets (which have usually been collectedat great cost to public agencies), and journals and funders often
require it. Therefore, in most cases, it is not too late to performthe analyses advocated here (or possibly others that also avoid
the problem of nonindependence). Thus, we urge investigatorswhose results have been questioned here to perform such ana-lyses and to correct the record by publishing follow-up errata
that provide valid numbers. At present, all studies performedusing these methods have large question marks over them. In-
vestigators can erase these question marks by reanalyzing theirdata with appropriate methods.
Acknowledgments—Phil Nguyen provided invaluable assis-
tance with literature review and management of the survey of
researchers reported here, and Shirley Leong provided capable
assistance with data management and analysis. We thank all the
researchers who responded to our questionnaire. This work was
supported by the National Institute of Mental Health (Grant P50
MH0662286-01A1), Institute of Education Sciences (Grants
R305H020061 and R305H040108 to H. Pashler), and the Na-
tional Science Foundation (Grant BCS-0720375 to H. Pashler;
Grant SBE-0542013 toG.Cottrell) and by a collaborative activity
grant to H. Pashler from the James S. McDonnell Foundation.
The authors gratefully acknowledge comments and sugges-
tions from Chris Baker, Jon Baron, Hart Blanton, John Cacioppo,
Max Coltheart, Danny Dilks, Victor Ferreira, Timothy Gentner,
Michael Gorman, Alex Holcombe, David Huber, Richard Ivry,
20The other studies (high green numbers in Figure 5) could simply reflectnormal sampling variability of the sort found with any kind of imperfect mea-surement.
Volume 4—Number 3 285
Edward Vul, Christine Harris, Piotr Winkielman, and Harold Pashler

James C. Johnston, Nancy Kanwisher, Brian Knutson, Niko
Kriegeskorte, James Kulik, Hans Op de Beeck, Russ Poldrack,
Anina Rich, Seth Roberts, Rebecca Saxe, Jay Schulkin, John
Serences, Marty Sereno, Mark Williams, John Wixted, Steven
Yantis, and Galit Yovel.
REFERENCES
Aron, A.R., Gluck, M.A., & Poldrack, R.A. (2006). Long-term test-retest reliability of functional MRI in a classification learningtask. NeuroImage, 29, 1000–1006.
Baker, C.I., Hutchison, T.L., & Kanwisher, N. (2007). Does the fusi-form face area contain subregions highly selective for nonfaces?Nature Neuroscience, 10, 3–4.
Baker, C.I., Simmons, W.K., Bellgowan, P.S., & Kriegeskorte, N.(2007, November). Circular inference in neuroscience: The dan-gers of double dipping. Paper presented at the annual meeting ofthe Society for Neuroscience, San Diego, CA.
Brieman, L., & Spector, P. (1992). Submodel selection and evaluationin regression. The X-random case. International Statistical Re-view, 60, 291–319.
Cox, R.W. (1996). AFNI: Software for analysis and visualization offunctional magnetic resonance neuroimages. Computers andBiomedical Research, 29, 162–173.
Eisenberger, N.I., Lieberman, M.D., & Williams, K.D. (2003). Doesrejection hurt? An FMRI study of social exclusion. Science, 302,290–292.
Evans, A.C., Collins, D.L., Mills, S.R., Brown, E.D., Kelly R, L., &Peters, T.M. (1993). 3D statistical neuroanatomical models from305 MRI volunteers. Nuclear Science Symposium and MedicalImaging Conference, 3, 1813–1817.
Fiske, S. (2003). So you want to be a neuroscientist? APS Observer,16(4), pp. 5, 46. Retrieved from http://www.psychologicalsci-ence.org/observer/getArticle.cfm?id=1242
Forman, S.D., Cohen, J.D., Fitzgerald, M., Eddy, W.F., Mintun, M.A., &Noll, D.C. (1995). Improved assessment of significant activationin functional magnetic resonance imaging (fMRI): Use of a clus-ter-size threshold.Magnetic Resonance in Medicine, 33, 636–647.
Friston, K.J., Holmes, A.P., Poline, J.B., Price, C.J., & Frith, C. (1995).Detecting activations in PET and fMRI: Levels of inference andpower. NeuroImage, 40, 223–235.
Geisser, S. (1993). Predictive inference: An introduction. Boca Raton,FL: CRC Press.
Harmon-Jones, E., & Winkielman, P. (2007). Social neuroscience: In-tegrating biological and psychological explanations of social be-havior. New York: Guilford Press.
Hobbs, T.R., & Fowler, R.D. (1974). Reliability and scale equivalenceof the Mini-Mult and MMPI. Journal of Consulting and ClinicalPsychology, 42, 89–92.
Hurley, D. (2008, June 3) The science of sarcasm (not that you care).The New York Times, Retrieved from http://www.nytimes.com/2008/06/03/health/research/03sarc.html?_r=1&oref=slogin
Ioannidis, J.P.A. (2005). Why most published research findings arefalse. Public Library of Science, Medicine, 2, e124.
Johnstone, T., Somerville, L.H., Alexander, A.L., Oakes, T.R., David-son, R., Kalin, N.H., & Whalen, P.J. (2005). Stability of amygdaleBOLD response to fearful faces over multiple scan sessions.NeuroImage, 25, 1112–1123.
Kong, J., Gollub, R.L., Webb, J.M., Kong, J.-T, Vangel, M.G., &Kwong, K. (2007). Test-retest study of fMRI signal change
evoked by electroacupuncture stimulation. NeuroImage, 34,1171–1181.
Kriegeskorte, N., Simmons, W.K., Bellgowan, P.S., & Baker, C.I. (inpress). Circular analysis in systems neuroscience: The dangers ofdouble dipping. Nature Neuroscience.
Kross, E., Egner, T., Ochsner, K., Hirsch, J., & Downey, G. (2007).Neural dynamics of rejection sensitivity. Journal of CognitiveNeuroscience, 19, 945–956.
Lieberman, M.D., Berkman, E.T., & Wager, T.D. (2009). Correlationsin social neuroscience aren’t voodoo: Commentary on Vul et al.(2009). Perspectives on Psychological Science, 4, xx–xx.
Manoach, D.S., Halpern, E.F., Kramer, T.S., Chang, Y., Goff, D.C.,Rauch, S.L., et al. (2001). Test–retest reliability of a functionalMRI working memory paradigm in normal and schizophrenicsubjects. American Journal of Psychiatry, 158, 955–958.
Mulderink, T.A., Gitelman, D.R., Mesulam, N.M., & Parrish, T.B.(2002). On the use of caffeine as a contrast booster for BOLDfMRI studies. NeuroImage, 15, 37–44.
National Institute of Mental Health. (2007). New social neurosciencegrants to help unravel autism, anxiety disorders. Retrieved fromhttp://www.nimh.nih.gov/science-news/2007/new-social-neuro-science-grants-to-help-unravel-autism-anxiety-disorders.shtml
Noseworthy, M.D., Alfonsi, J., & Bells, S. (2003). Attenuation of brainBOLD response following lipid ingestion. Human Brain Mapping,20, 116–121.
Nunnally, J.C. (1970). Introduction to psychological measurement. NewYork: McGraw-Hill.
Sander, D., Grandjean, D., Pourtois, G., Schwartz, S., Seghier, M.L.,Scherer, K.R., & Vuilleumier, P. (2005). Emotion and attentioninteractions in social cognition: Brain regions involved in pro-cessing anger prosody. NeuroImage, 28, 848–858.
Saxe, R., Brett, M., & Kanwisher, N. (2006). Divide and conquer: Adefense of functional localizers. NeuroImage, 30, 1088–1096.
Singer, T., Seymour, B., O’Doherty, J., Kaube, H., Dolan, R.J., & Frith,C.D. (2004). Empathy for pain involves the affective but notsensory components of pain. Science, 303, 1157–1162.
Stark, R., Schienle, A., Walter, B., Kirsch, P., Blecker, C., & Ott, U.(2004). Hemodynamic effects of negative emotional pictures: Atest–retest analysis. Neuropsychobiology, 50, 108–118.
Takahashi, H., Matsuura, M., Yahata, N., Koeda, M., Suhara, T., &Okubo, Y. (2006). Men and women show distinct brain activationsduring imagery of sexual and emotional infidelity. NeuroImage,32, 1299–1307.
Talairach, J., & Tournoux, P. (1988). Co-planar stereotaxis atlas of thehuman brain. New York: Thieme Medical Publishers.
Taleb, N. (2004). Fooled by randomness: The hidden role of chance inlife and in the market. New York: Thomson/Texere.
Viswesvaran, C., & Ones, D.S. (2000). Measurement error in ‘‘Big FiveFactors’’ personality assessment: Reliability generalizationacross studies and measures. Educational and PsychologicalMeasurement, 60, 224–235.
Vul, E., & Kanwisher, N. (in press). Begging the question: The non-independence error in fMRI data analysis. In S. Hanson & M.Bunzl (Eds.), Foundational issues for human brain mapping.Cambridge, MA: MIT Press.
Weckesser, M., Posse, S., Olthoff, U., Kemna, L., Dager, S., & Muller-Gartner, H.W. (1999). Functional imaging of the visual cortexwith bold-contrast MRI: Hyperventilation decreases signal re-sponse. Magnetic Resonance Medicine, 41, 213–216.
Yovel, G., & Kanwisher, N. (2005). The neural basis of the behavioralface-inversion effect. Current Biology, 15, 2256–2262.
286 Volume 4—Number 3
High Correlations in fMRI Studies
APPENDIX A: FMRI SURVEY QUESTION TEST
Would you please be so kind as to answer a few very quickquestions about the analysis that produced, i.e., the correlations
on page XX. We expect this will just take you a minute or two atmost.To make this as quick as possible, we have framed these as
multiple choice questions and listed the more commonanalysis procedures as options, but if you did something
different, we’d be obliged if you would describe what you ac-tually did.
The data plotted reflect the percent signal change ordifference in parameter estimates (according to some contrast)of . . .
1. . . . the average of a number of voxels.2. . . . one peak voxel that was most significant according to
some functional measure.3. . . . something else?If 1:
The voxels whose data were plotted (i.e., the ‘‘region of in-terest’’) were selected based on . . .
1a. . . . only anatomical constraints (no functional data wereused to define the region, e.g., all voxels representing the hip-
pocampus).1b. . . . only functional constraints (voxels were selected
if they passed some threshold according to a functional
measure – no anatomical constraints were used; e.g., all voxelssignificant at p<.0001, or all voxels within a 5 mm radius of the
peak voxel)1c. . . . anatomical and functional constraints (voxels
were selected if they were within a particular region of thebrain and passed some threshold according to a functionalmeasure; e.g., all voxels significant at p<.0001 in the anterior
cingulate)1d. . . . something else?
If you picked [1b, 1c, or 2] above could you please advise usabout the following:The functional measure used to select the voxel(s) plotted in
the figure was . . .[A]. . . . a contrast within individual subjects (e.g., condition A
greater than condition B at some p value for a given subject)[B]. . . . the result of running a regression, across subjects, of
the behavioral measure of interest against brain activation (for acontrast) at each voxel.[C]. . . . something else?
Finally: the fMRI data (runs/blocks/trials) displayed in thefigure were . . .
[A]. . . . the same data as those employed in the analysis usedto select voxels (the functional localizer).[B]. . . . different data from those employed in the analysis
used to select voxels (the functional localizer).Thank you very much for giving us this information so that we
can describe your study accurately in our review.
APPENDIX B: CLUSTER-SIZE CORRECTION ANDCORRELATION INFLATION
Most papers use cluster size, not just a high threshold, to capturecorrelations. Does the inflation of correlation problem still exist inthis case?Yes. The problem arises from imposing any threshold that
does not capture the full distribution of the ‘‘true effect.’’ As any
true signal will also be corrupted by measurement noise, mea-surements of voxels that really do correlate with the behavioralmeasure of interest will also produce a distribution (although in
this case the distribution will have a mean with a value thatdiffers from zero). Imposing a threshold on this distribution will
select only some samples: those with more favorable patterns ofnoise. If nearly the whole distribution is selected (statistical
power is nearly 1) and there are no false alarm clusters, therewould be no inflation. However, the lower the power, the morebiased the selected subsample. Although cluster-size correction
methods effectively increase power, they do not increase itsufficiently to mitigate bias. For simple whole-brain contrasts,
cluster-size methods appear to provide power that does notexceed 0.4 (and will more likely be substantially lower than
that; Friston, Holmes, Poline, Price, & Frith, 1995). If statisticalpower is at 0.4, that means that only the top 40% of the truedistribution will be selected—the mean of these selected
samples will be very much higher than the true mean.For the moderately technical audience, we provide a simplified
cluster-size threshold simulation to show the magnitude withwhich the underlying signal can be inflated by an analysisprocedure of roughly the sort we describe in this article (see
Fig. B1). We generated a random 1000" 1000 voxel slice (300"300 subset shown; the dimensions are irrelevant in our case,
because we had a constant proportion of signal voxels) by gener-ating random noise for each voxel (Gaussian noise with mean
0 and standard deviation of 3.5). We blurred this slice withGaussian smoothing (kernel standard deviation of 2), thus in-ducing a spatial correlation between voxels; this resulted in an
effective standard deviation of 0.5 per voxel. We then added‘‘signals’’ to this noise: Signals were square ‘‘pulses’’ added
to randomly chosen 5 " 5 subregions of the matrix. Withinone simulated matrix, 25% of the voxels were increased by 1.
The color map shows measured intensity of a given voxel, with 0being the noise average and 1 (marked with an asterisk) being thesignal average.
We then did a simple cluster search (finding 5 " 5 regions inwhich every voxel exceeded a particular threshold). We tried a
number of different height thresholds, and for each threshold wemeasured the probability of a false alarm (the probability that avoxel that was within a 5 " 5 region in which all voxels passed
threshold did not contain a true signal)—the logarithm (base 10) ofthis probability is the x axis (%2 corresponds to p(FA) 5 0.01,
%0.3: p(FA)5 0.5).We also computed the inflation of themeasuredsignal and compared it with the true signal in the detected voxels,
Volume 4—Number 3 287
Edward Vul, Christine Harris, Piotr Winkielman, and Harold Pashler
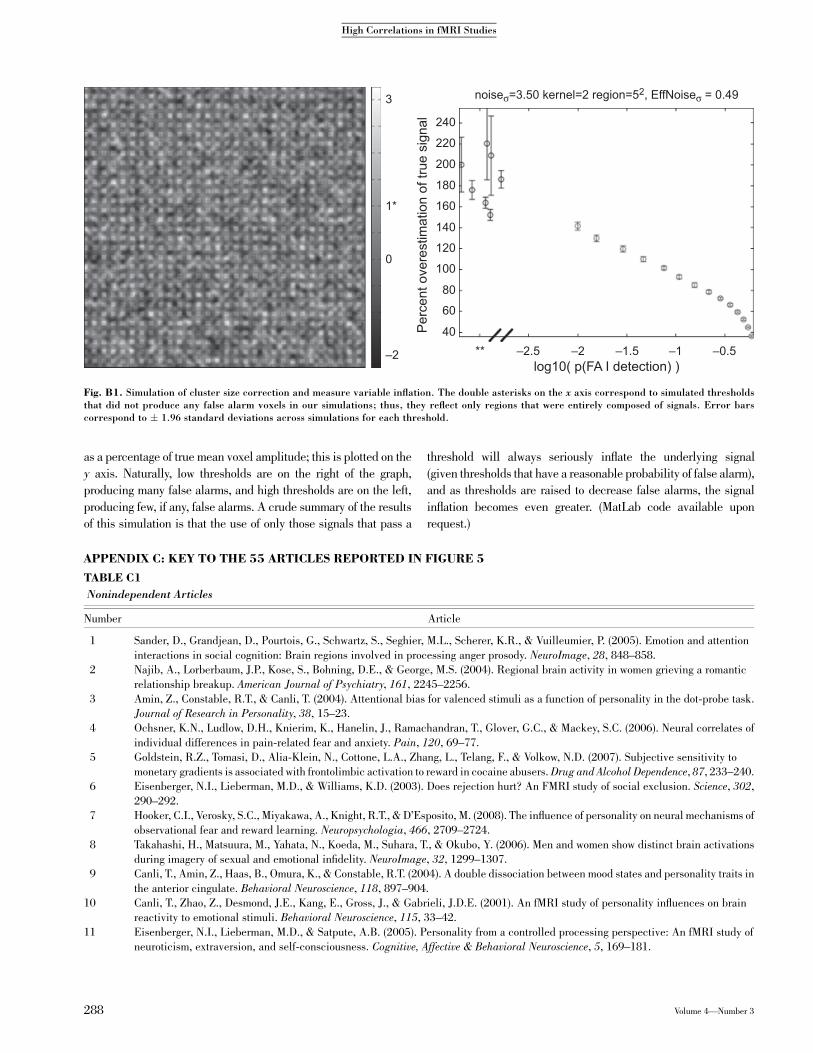
as a percentage of true mean voxel amplitude; this is plotted on the
y axis. Naturally, low thresholds are on the right of the graph,producing many false alarms, and high thresholds are on the left,
producing few, if any, false alarms. A crude summary of the resultsof this simulation is that the use of only those signals that pass a
threshold will always seriously inflate the underlying signal
(given thresholds that have a reasonable probability of false alarm),and as thresholds are raised to decrease false alarms, the signal
inflation becomes even greater. (MatLab code available uponrequest.)
3
0
–2
1*
240
220
200
180160
140120100
8060
40** –2.5 –2 –1.5 –1 –0.5
log10( p(FA I detection) )
noise!=3.50 kernel=2 region=52, EffNoise! = 0.49
Perc
ent o
vere
stim
atio
n of
true
sig
nal
Fig. B1. Simulation of cluster size correction and measure variable inflation. The double asterisks on the x axis correspond to simulated thresholdsthat did not produce any false alarm voxels in our simulations; thus, they reflect only regions that were entirely composed of signals. Error barscorrespond to & 1.96 standard deviations across simulations for each threshold.
APPENDIX C: KEY TO THE 55 ARTICLES REPORTED IN FIGURE 5
TABLE C1
Nonindependent Articles
Number Article
1 Sander, D., Grandjean, D., Pourtois, G., Schwartz, S., Seghier, M.L., Scherer, K.R., & Vuilleumier, P. (2005). Emotion and attentioninteractions in social cognition: Brain regions involved in processing anger prosody. NeuroImage, 28, 848–858.
2 Najib, A., Lorberbaum, J.P., Kose, S., Bohning, D.E., & George, M.S. (2004). Regional brain activity in women grieving a romanticrelationship breakup. American Journal of Psychiatry, 161, 2245–2256.
3 Amin, Z., Constable, R.T., & Canli, T. (2004). Attentional bias for valenced stimuli as a function of personality in the dot-probe task.Journal of Research in Personality, 38, 15–23.
4 Ochsner, K.N., Ludlow, D.H., Knierim, K., Hanelin, J., Ramachandran, T., Glover, G.C., & Mackey, S.C. (2006). Neural correlates ofindividual differences in pain-related fear and anxiety. Pain, 120, 69–77.
5 Goldstein, R.Z., Tomasi, D., Alia-Klein, N., Cottone, L.A., Zhang, L., Telang, F., & Volkow, N.D. (2007). Subjective sensitivity tomonetary gradients is associated with frontolimbic activation to reward in cocaine abusers.Drug and Alcohol Dependence, 87, 233–240.
6 Eisenberger, N.I., Lieberman, M.D., & Williams, K.D. (2003). Does rejection hurt? An FMRI study of social exclusion. Science, 302,290–292.
7 Hooker, C.I., Verosky, S.C., Miyakawa, A., Knight, R.T., & D’Esposito, M. (2008). The influence of personality on neural mechanisms ofobservational fear and reward learning. Neuropsychologia, 466, 2709–2724.
8 Takahashi, H., Matsuura, M., Yahata, N., Koeda, M., Suhara, T., & Okubo, Y. (2006). Men and women show distinct brain activationsduring imagery of sexual and emotional infidelity. NeuroImage, 32, 1299–1307.
9 Canli, T., Amin, Z., Haas, B., Omura, K., & Constable, R.T. (2004). A double dissociation between mood states and personality traits inthe anterior cingulate. Behavioral Neuroscience, 118, 897–904.
10 Canli, T., Zhao, Z., Desmond, J.E., Kang, E., Gross, J., & Gabrieli, J.D.E. (2001). An fMRI study of personality influences on brainreactivity to emotional stimuli. Behavioral Neuroscience, 115, 33–42.
11 Eisenberger, N.I., Lieberman, M.D., & Satpute, A.B. (2005). Personality from a controlled processing perspective: An fMRI study ofneuroticism, extraversion, and self-consciousness. Cognitive, Affective & Behavioral Neuroscience, 5, 169–181.
288 Volume 4—Number 3
High Correlations in fMRI Studies

Table C1. (Contd.)
Number Article
12 Takahashi, H., Kato, M., Matsuura, M., Koeda, M., Yahata, N., Suhara, T., & Okubo, Y. (2008). Neural correlates of human virtuejudgment. Cerebral Cortex, 18, 1886–1891.
13 Britton, J.C., Ho, S.H., Taylor, S.F., & Liberzon, I. (2007). Neuroticism associated with neural activation patterns to positive stimuli.Psychiatry Research: Neuroimaging, 156, 263–267.
14 Straube, T., Mentzel, H.J., & Miltner, W.H. (2007). Waiting for spiders: Brain activation during anticipatory anxiety in spider phobics.NeuroImage, 37, 1427–1436.
15 Jabbi, M., Swart, M., & Keysers, C. (2007). Empathy for positive and negative emotions in the gustatory cortex. NeuroImage, 34, 1744–1753.
16 Killgore, W.D., Gruber, S.A., & Yurgelun-Todd, D.A. (2007). Depressed mood and lateralized prefrontal activity during a Stroop task inadolescent children. Neuroscience Letters, 416, 43–48.
17 Takahashi, H., Yahata, N., Koeda, M., Matsuda, T., Asai, K., & Okubo, Y. (2004). Brain activation associated with evaluative processesof guilt and embarrassment: An fMRI study. NeuroImage, 23, 967–974.
18 Aron, A., Fisher, H., Mashek, D.J., Strong, G., Li, H., & Brown, L.L. (2005). Reward, motivation, and emotion systems associated withearly-stage intense romantic love. Journal of Neurophysiology, 94, 327–337.
19 Singer, T., Seymour, B., O’Doherty, J., Kaube, H., Dolan, R.J., & Frith, C.D. (2004). Empathy for pain involves the affective but notsensory components of pain. Science, 303, 1157–1162.
20 Canli, T., Sivers, H., Whitfield, S.L., Gotlib, I.H., & Gabrieli, J.D.E. (2002). Amygdala response to happy faces as a function ofextraversion. Science, 296, 2191.
21 Rilling, J.K., Glenn, A.L., Jairam, M.R., Pagnoni, G., Goldsmith, D.R., Elfenbein, H.A., & Lilienfeld, S.O. (2007). Neural correlates ofsocial cooperation and non-cooperation as a function of psychopathy. Biological Psychiatry, 61, 1260–1271.
22 Mobbs, D., Hagan, C.C., Azim, E., Menon, V., & Reiss, A.L. (2005). Personality predicts activity in reward and emotional regionsassociated with humor. Proceedings of the National Academy of Sciences, USA, 102, 16502–16506.
23 Somerville, L.H., Kim, H., Johnstone, T., Alexander, A.L., & Whalen, P.J. (2004). Human amygdala responses during presentation ofhappy and neutral faces: Correlations with state anxiety. Biological Psychiatry, 55, 897–903.
24 Mantani, T., Okamoto, Y., Shirao, N., Okada, G., & Yamawaki, S. (2005). Reduced activation of posterior cingulate cortex duringimagery in subjects with high degrees of alexithymia: A functional magnetic resonance imaging study. Biological Psychiatry, 57, 982–990.
25 Barrett, J., Pike, G.B., & Paus, T. (2004). The role of the anterior cingulate cortex in pitch variation during sad affect. European Journalof Neuroscience, 19, 458–464.
26 Mitchell, J.P., Macrae, C.M., & Banaji, M.R. (2006). Dissociable medial prefrontal contributions to judgments of similar and dissimilarothers. Neuron, 50, 655–663.
30 Reuter, M., Stark, R., Hennig, J., Walter, B., Kirsch, P., Schienle, A., & Vaitl, D. (2004). Personality and emotion: Test of Gray’spersonality theory by means of an fMRI study. Behavioral Neuroscience, 118, 462–469.
31 Singer, T., Seymour, B., O’Doherty, J.P., Stephan, K.E., Dolan, R.J., & Frith, C.D. (2006). Empathic neural responses are modulated bythe perceived fairness of others. Nature, 439, 466–469.
55 Sareen, J., Campbell, D.W., Leslie, W.D., Malisza, K.L., Stein, M.B., Paulus, M.P., et al. (2007). Striatal function in generalized socialphobia: A functional magnetic resonance imaging study. Biological Psychiatry, 61, 396–404.
TABLE C2
No-Response Articles (Authors Who Did Not Respond)
Number Article
27 Abler, B., Erk, S., Herwig, U., &Walter, H. (2007). Anticipation of aversive stimuli activates extended amygdala in unipolar depression.Journal of Psychiatric Research, 41, 511–522.
34 Glahn, D.C., Lovallo,W.R., & Fox, P.T. (2007). Reduced amygdala activation in young adults at high risk of alcoholism: Studies from theOklahoma Family Health Patterns Project. Biological Psychiatry, 61, 1306–1309.
Volume 4—Number 3 289
Edward Vul, Christine Harris, Piotr Winkielman, and Harold Pashler

TABLE C3
Independent Articles
Number Article
28 Phelps, E.A., O’Connor, K.J., Gatenby, J.C., Gore, J.C., Grillon, C., & Davis, M. (2001). Activation of the left amygdala to a cognitiverepresentation of fear. Nature Neuroscience, 4, 437–441.
29 Lee, K.H., Brown ,W.H., Egleston, P.N., Green, R.D.J., Farrow, T.F.D., Hunter, M.D., et al. (2006). A functional magnetic resonanceimaging study of social cognition in schizophrenia during an acute episode and after recovery. American Journal of Psychiatry, 163,1926–1933.
32 Phelps, E., O’Connor, K., Cunningham, W., Funayama, E., Gatenby, J., Gore, J., & Banaji, M.R. (2000). Performance on indirectmeasures of race evaluation predicts amygdala activation. Journal of Cognitive Neuroscience, 12, 729–738.
33 Coccaro, E.F., McCloskey, M.S., Fitzgerald, D.A., & Phan, K.L. (2007). Amygdala and orbitofrontal reactivity to social threat inindividuals with impulsive aggression. Biological Psychiatry, 62, 168–178.
35 McClernon, F.J., Hiott, F.B., Huettel, S.A., & Rose, J.E. (2005) Abstinence-induced changes in self-report craving correlate with event-related FMRI responses to smoking cues. Neuropsychopharmacology, 30, 1940–1947.
36 Herwig, U., Kaffenberger, T., Baumgartner, T., & Jancke, L. (2007). Neural correlates of a ‘‘pessimistic’’ attitude when anticipatingevents of unknown emotional valence. NeuroImage, 34, 848–858.
37 Nitschke, J.B., Nelson, E.E., Rusch, B.D., Fox, A.S., Oakes, T.R., & Davidson, R.J. (2004). Orbitofrontal cortex tracks positive mood inmothers viewing pictures of their newborn infants. NeuroImage, 21, 583–592.
38 Lee, B.T., Cho, S.W., Khang, H.S., Lee, B.C., Choi, I.G., Lyoo, I.K., & Ham, B.J. (2007). The neural substrates of affective processingtoward positive and negative affective pictures in patients with major depressive disorder. Progress in Neuro-Psychopharmacology &Biological Psychiatry, 31, 1487–1492.
39 Posse, S., Fitzgerald, D., Gao, K., Habel, U., Rosenberg, D., Moore, G.J., & Schneider, F. (2003). Real-time fMRI of temporolimbicregions detects amygdala activation during single-trial self-induced sadness. NeuroImage, 18, 760–768.
40 Paulus, M.P., Rogalsky, C., Simmons, A., Feinstein, J.S., & Stein, M.B. (2003). Increased activation in the right insula during risk-takingdecision making is related to harm avoidance and neuroticism. NeuroImage, 19, 1439–1448.
41 Richeson, J.A., Baird, A.A., Gordon, H.L., Heatherton, T.F., Wyland, C.L., Trawalter, S., & Shelton, J.N. (2003). An fMRI investigationof the impact of interracial contact on executive function. Nature Neuroscience, 6, 1323–1328.
42 Rilling, J.K., Gutman, D.A., Zeh, T.R., Pagnoni, G., Berns, G.S., & Kilts, C.D. (2002). A neural basis for social cooperation.Neuron, 35,395–405.
43 Heinz, A., Wrase, J., Kahnt, T., Beck, A., Bromand, Z., Grusser, S.M., et al. (2007). Brain activation elicited by affectively positivestimuli is associated with a lower risk of relapse in detoxified alcoholic subjects. Alcoholism Clinical and Experimental Research, 31,1138–1147.
44 Schneider, F., Habel, U., Kessler, C., Salloum, J.B., & Posse, S. (2000). Gender differences in regional cerebral activity during sadness.Human Brain Mapping, 9, 226–238.
45 Leland, D., Arce, E., Feinstein, J., & Paulus, M. (2006). Young adult stimulant users increased striatal activation during uncertainty isrelated to impulsivity. NeuroImage, 33, 725–731.
46 Schneider, F., Weiss, U., Kessler, C., Salloum, J.B., Posse, S., Grodd, W., & Muller-Gartner, H.W. (1998). Differential amygdalaactivation in schizophrenia during sadness. Schizophrenia Research, 34, 133–142.
47 Yucel, M., Lubman, D.I., Harrison, B.J., Fornito, A., Allen, N.B., Wellard, R.M., et al. (2007). A combined spectroscopic and functionalMRI investigation of the dorsal anterior cingulate region in opiate addiction. Molecular Psychiatry, 12, 691–702.
48 Stein, M.B., Simmons, A.N., Feinstein, J.S., & Paulus,M.P. (2007). Increased amygdala and insula activation during emotion processingin anxiety-prone subjects. American Journal of Psychiatry, 164, 318–327.
49 Dannlowski, U., Ohrmann, P., Bauer, J., Kugel, H., Arolt, V., Heindel, W., & Suslow, T. (2007). Amygdala reactivity predicts automaticnegative evaluations for facial emotions. Psychiatry Research: Neuroimaging, 154, 13–20.
50 Moriguchi, Y., Ohnishi, T., Lane, R.D., Maeda, M., Mori, T., Nemoto, K., et al. (2006). Impaired self-awareness and theory of mind: anfMRI study of mentalizing in alexithymia. NeuroImage, 32, 1472–1482.
51 Habel, U.,Windischberger, C., Derntl, B., Robinson, S., Kryspin-Exner, I., Gur, R.C., & Moser, E. (2007). Amygdala activation andfacial expressions: Explicit emotion discrimination versus implicit emotion processing. Neuropsychologia, 45, 2369–2377.
52 Samanez-Larkin, G.R., Gibbs, S.E.B., Khanna, K., Nielsen, L., Carstensen, L.L., & Knutson, B. (2007). Anticipation of monetary gainbut not loss in healthy older adults. Nature Neuroscience, 10, 787–791.
53 Kross, E., Egner, T., Ochsner, K., Hirsch, J., & Downey, G. (2007). Neural dynamics of rejection sensitivity. Journal of CognitiveNeuroscience, 19, 945–956.
54 Sanfey, A.G., Rilling, J.K., Aronson, J.A., Nystrom, L.E., & Cohen, J.D. (2003). The neural basis of economic decision-making in theUltimatum Game. Science, 300, 1755–1758.
290 Volume 4—Number 3
High Correlations in fMRI Studies