Embed Size (px)
Citation preview
Putting it all Together: Annual Differentiation under ESSA
Scott Marion & Jenn Dunn
Center for Assessment
New York Regents Retreat
April 4, 2017
Key Questions for the Regents
1. Are the indicators that Linda shared the right indicators for Tier 1?
2. Do the general depictions of the accountability models (presented shortly) resonate with you?
3. Does the approach for identifying schools for Comprehensive Support and Improvement make sense?
2Center for Assessment/LPI. NY Regents Meeting. April 4, 2017
What does the law say?
‘‘(C) ANNUAL MEANINGFUL DIFFERENTIATION.—Establish a system of meaningfully differentiating, on an annual basis, all public schools in the State, which shall—
‘‘(i) be based on all indicators in the State’s accountability system under subparagraph (B), for all students and for each of subgroup of students, consistent with the requirements of such subparagraph;
‘‘(ii) with respect to the indicators described in clauses (i) through (iv) of subparagraph (B) afford—
‘‘(I) substantial weight to each such indicator; and
‘‘(II) in the aggregate, much greater weight than is afforded to the indicator or indicators utilized by the State and described in subparagraph (B)(v), in the aggregate; and
‘‘(iii) include differentiation of any such school in which any subgroup of students is consistently underperforming, as determined by the State, based on all indicators under subparagraph (B) and the system established under this subparagraph.
3Center for Assessment/LPI. NY Regents Meeting. April 4, 2017
What does the system look like?
• As Linda just showed us, you selected several important indicators of school quality for Tier 1 and Tier 2
• We really have two related, but separate systems:– High schools
– Elementary and middle schools
• In fact, depending on the School Quality and Student Success indicator(s) selected for middle schools, we might have three systems
4Center for Assessment/LPI. NY Regents Meeting. April 4, 2017
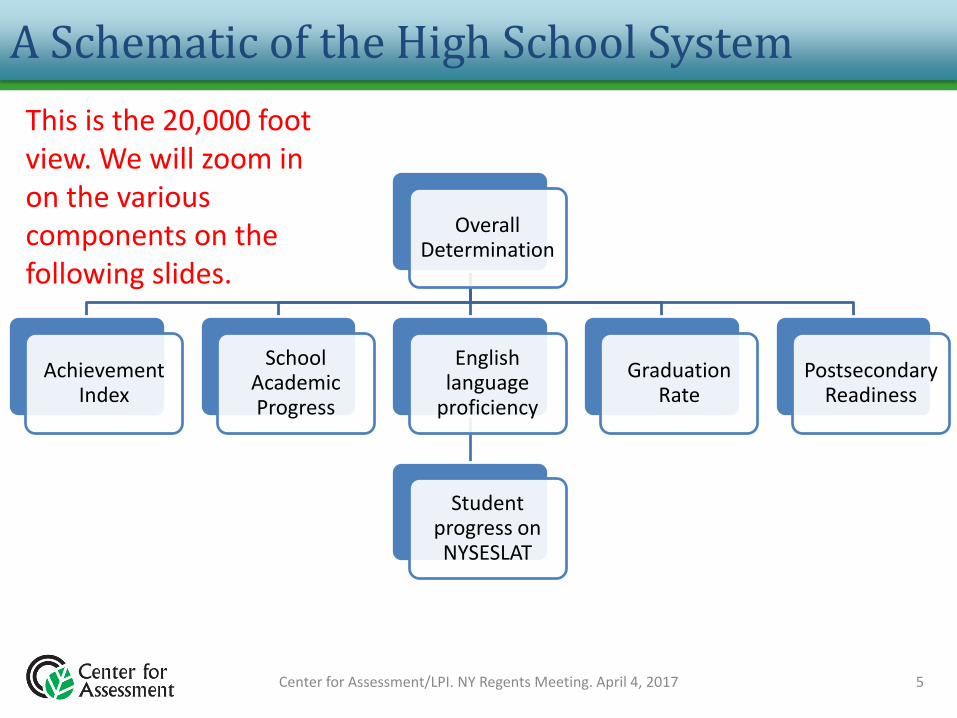
A Schematic of the High School System
5Center for Assessment/LPI. NY Regents Meeting. April 4, 2017
Overall Determination
Achievement Index
School Academic Progress
English language
proficiency
Student progress on NYSESLAT
Graduation Rate
Postsecondary Readiness
This is the 20,000 foot view. We will zoom in on the various components on the following slides.

Zooming into the HS system-Academic indicators
School Academic Progress
Achievement Index
MathematicsELAScienceSocial Studies
6Center for Assessment/LPI. NY Regents Meeting. April 4, 2017
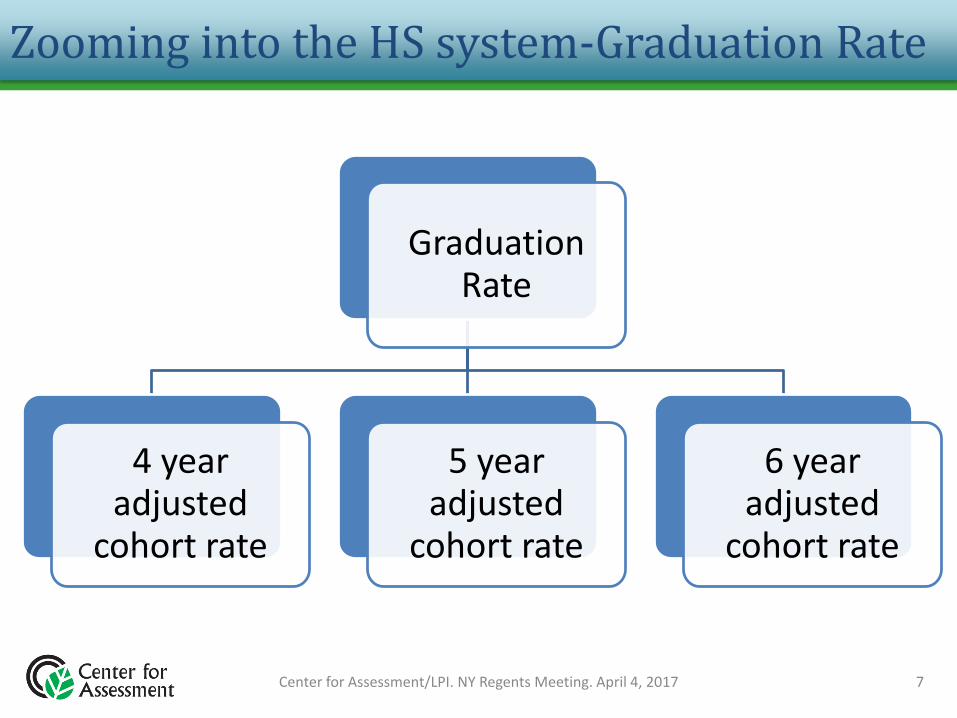
Zooming into the HS system-Graduation Rate
Graduation Rate
4 year adjusted
cohort rate
5 year adjusted
cohort rate
6 year adjusted
cohort rate
7Center for Assessment/LPI. NY Regents Meeting. April 4, 2017
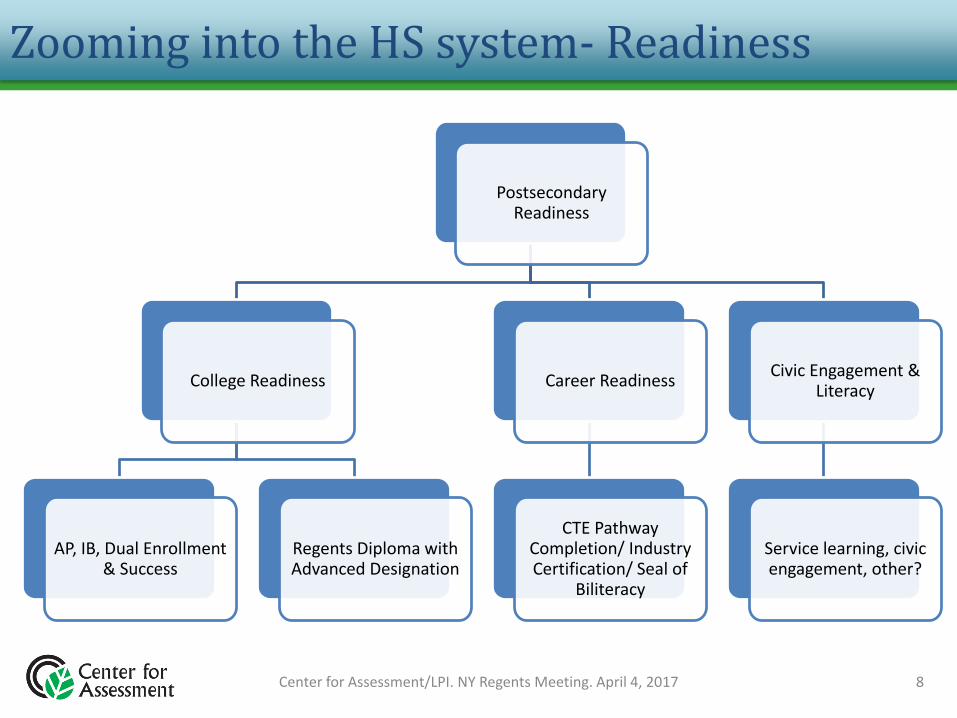
Zooming into the HS system- Readiness
Postsecondary Readiness
College Readiness
AP, IB, Dual Enrollment & Success
Regents Diploma with Advanced Designation
Career Readiness
CTE Pathway Completion/ Industry Certification/ Seal of
Biliteracy
Civic Engagement & Literacy
Service learning, civic engagement, other?
8Center for Assessment/LPI. NY Regents Meeting. April 4, 2017
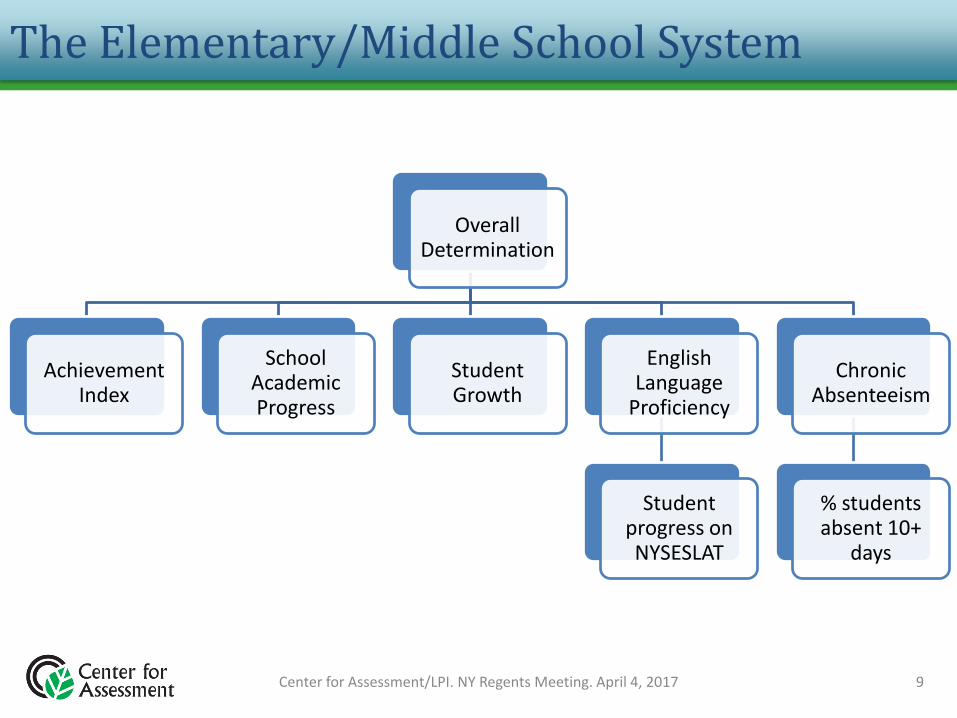
The Elementary/Middle School System
9Center for Assessment/LPI. NY Regents Meeting. April 4, 2017
Overall Determination
Achievement Index
School Academic Progress
Student Growth
English Language
Proficiency
Student progress on NYSESLAT
Chronic Absenteeism
% students absent 10+
days
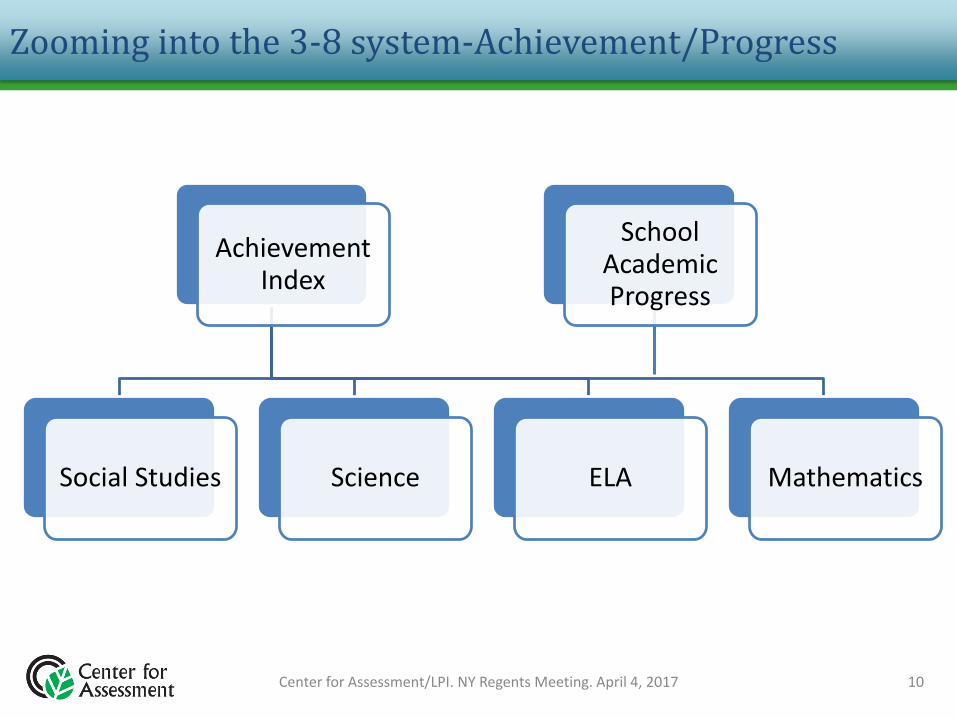
Zooming into the 3-8 system-Achievement/Progress
School Academic Progress
Achievement Index
MathematicsELAScienceSocial Studies
10Center for Assessment/LPI. NY Regents Meeting. April 4, 2017
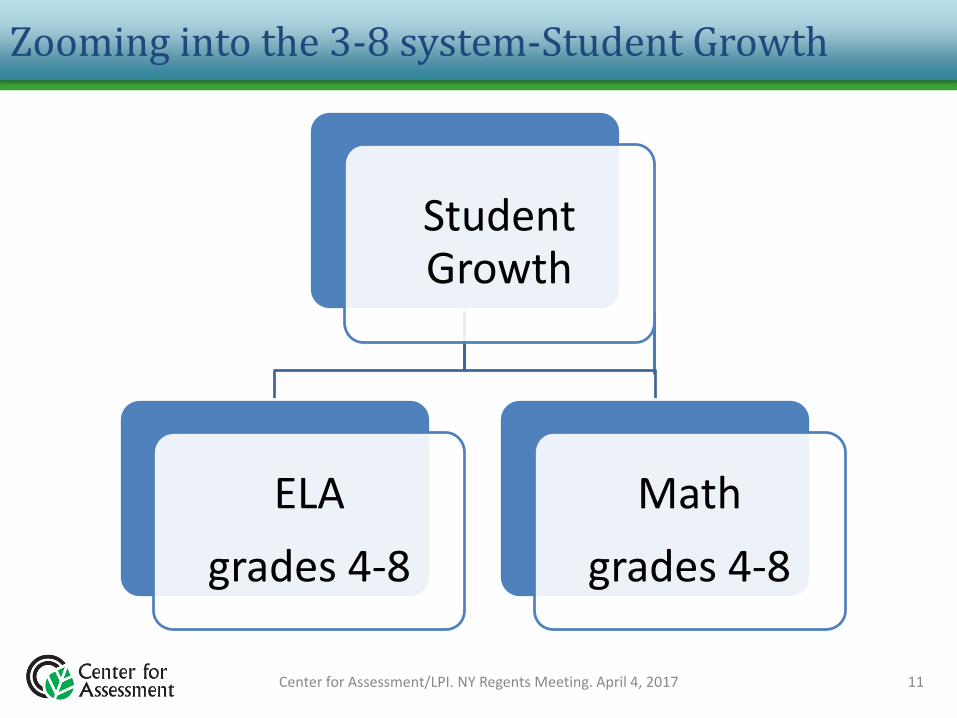
Zooming into the 3-8 system-Student Growth
11Center for Assessment/LPI. NY Regents Meeting. April 4, 2017
Student Growth
ELA
grades 4-8
Math
grades 4-8
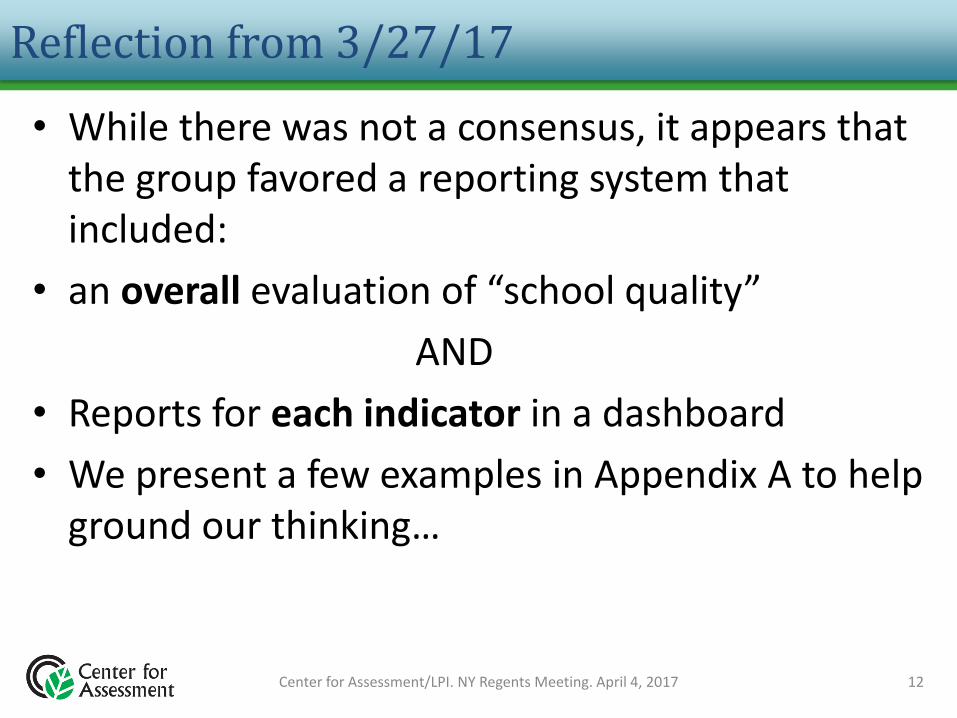
Reflection from 3/27/17
• While there was not a consensus, it appears that the group favored a reporting system that included:
• an overall evaluation of “school quality”
AND
• Reports for each indicator in a dashboard
• We present a few examples in Appendix A to help ground our thinking…
12Center for Assessment/LPI. NY Regents Meeting. April 4, 2017
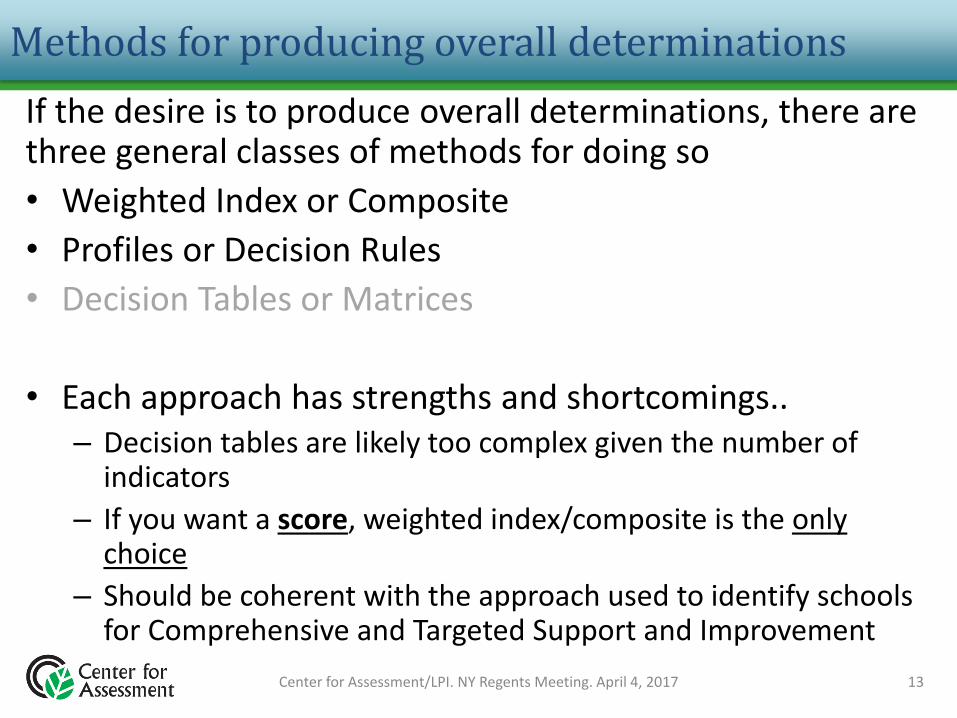
Methods for producing overall determinations
If the desire is to produce overall determinations, there are three general classes of methods for doing so
• Weighted Index or Composite
• Profiles or Decision Rules
• Decision Tables or Matrices
• Each approach has strengths and shortcomings..– Decision tables are likely too complex given the number of
indicators
– If you want a score, weighted index/composite is the only choice
– Should be coherent with the approach used to identify schools for Comprehensive and Targeted Support and Improvement
13Center for Assessment/LPI. NY Regents Meeting. April 4, 2017
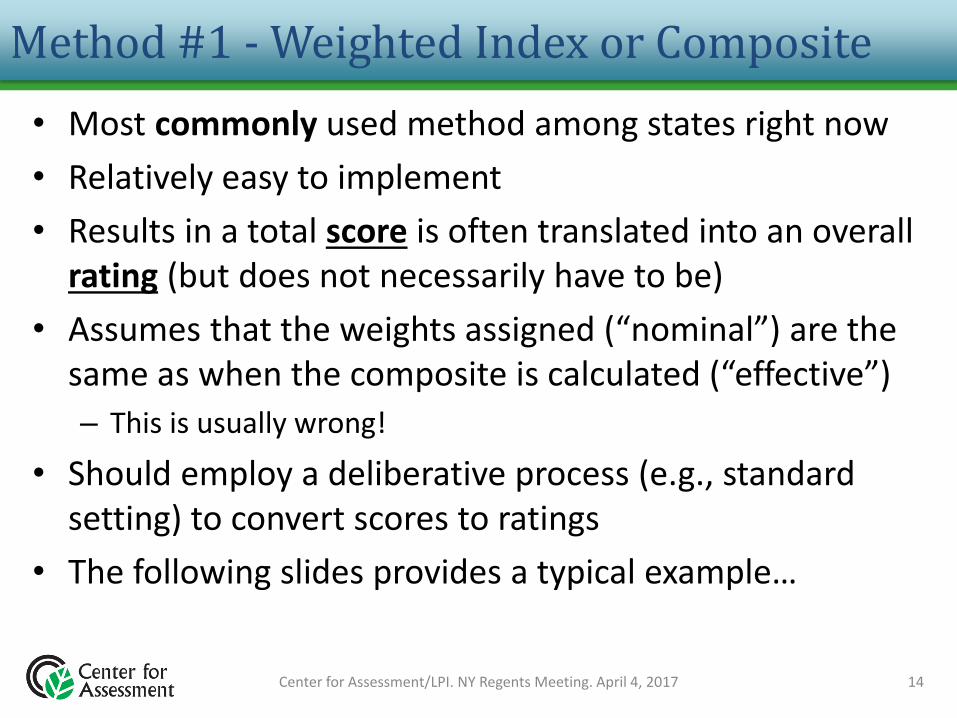
Method #1 - Weighted Index or Composite
• Most commonly used method among states right now
• Relatively easy to implement
• Results in a total score is often translated into an overall rating (but does not necessarily have to be)
• Assumes that the weights assigned (“nominal”) are the same as when the composite is calculated (“effective”)
– This is usually wrong!
• Should employ a deliberative process (e.g., standard setting) to convert scores to ratings
• The following slides provides a typical example…
14Center for Assessment/LPI. NY Regents Meeting. April 4, 2017
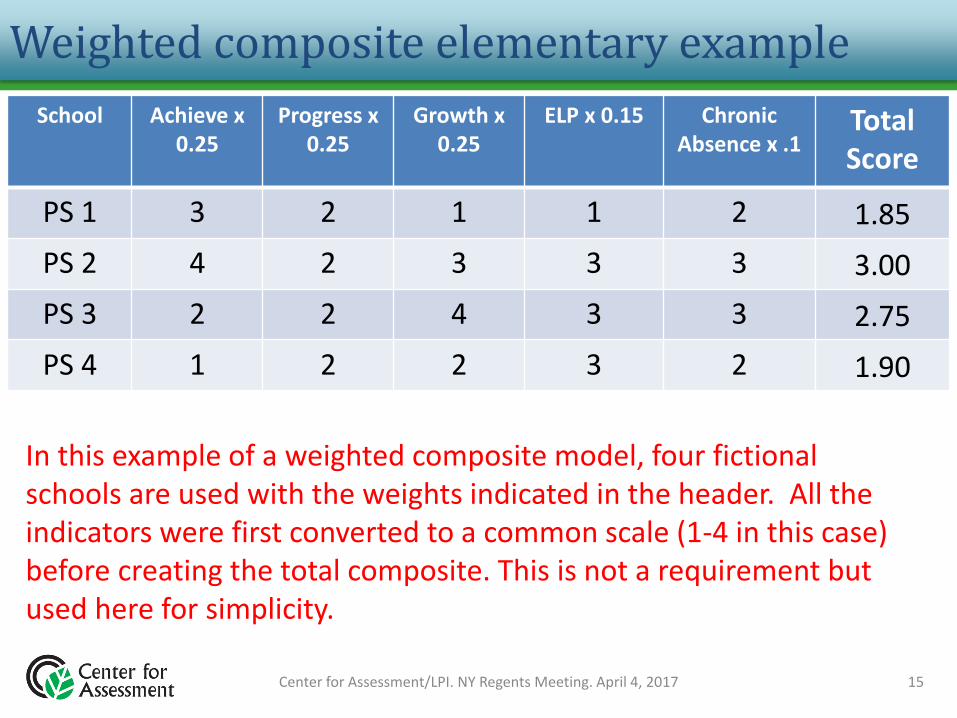
Weighted composite elementary example
School Achieve x 0.25
Progress x 0.25
Growth x 0.25
ELP x 0.15 Chronic Absence x .1
Total Score
PS 1 3 2 1 1 2 1.85
PS 2 4 2 3 3 3 3.00
PS 3 2 2 4 3 3 2.75
PS 4 1 2 2 3 2 1.90
15Center for Assessment/LPI. NY Regents Meeting. April 4, 2017
In this example of a weighted composite model, four fictional schools are used with the weights indicated in the header. All the indicators were first converted to a common scale (1-4 in this case) before creating the total composite. This is not a requirement but used here for simplicity.
Method #2 - Profiles or Decision Rules
• A set of decision rules used to evaluate school profiles (scores on the various indicators) against narrative descriptions of performance
• By working through this process, rules are established to place schools into various overall levels based on the constellation of indicator values
16Center for Assessment/LPI. NY Regents Meeting. April 4, 2017
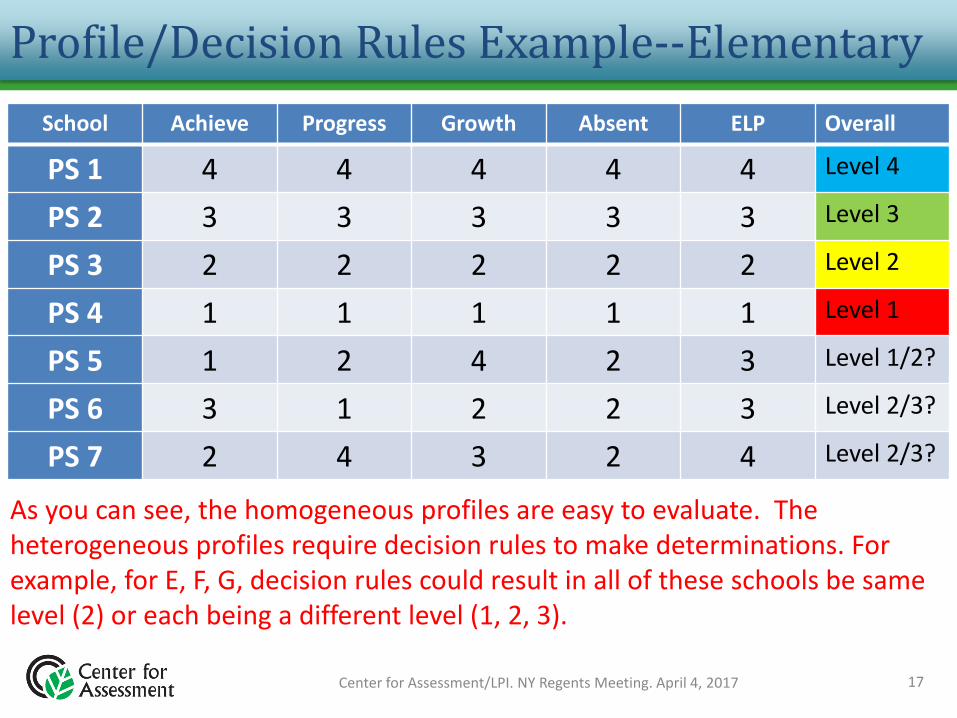
Profile/Decision Rules Example--Elementary
School Achieve Progress Growth Absent ELP Overall
PS 1 4 4 4 4 4 Level 4
PS 2 3 3 3 3 3 Level 3
PS 3 2 2 2 2 2 Level 2
PS 4 1 1 1 1 1 Level 1
PS 5 1 2 4 2 3 Level 1/2?
PS 6 3 1 2 2 3 Level 2/3?
PS 7 2 4 3 2 4 Level 2/3?
17Center for Assessment/LPI. NY Regents Meeting. April 4, 2017
As you can see, the homogeneous profiles are easy to evaluate. The heterogeneous profiles require decision rules to make determinations. For example, for E, F, G, decision rules could result in all of these schools be same level (2) or each being a different level (1, 2, 3).
What do you value?
• Which approaches do you think will have the most credibility with district and school leaders, policymakers, and the general public?
• Sometimes it is difficult to have both transparency and high technical quality. Which feature should be prioritized?
• Should this be an empirical decision largely by (once we settle on indicators) seeing how schools fare under the different approaches to shed light on how the different approaches work with NY data?
18Center for Assessment/LPI. NY Regents Meeting. April 4, 2017
Identification for Comprehensive Support
• We have been discussing two potential options, both of which are based on the notion that low achievement, combined with other factors, puts the children most at risk
• For high schools, keep in mind that all high schools with graduation rates (can use 5- or 6-year rate) less than 67% must be identified for Comprehensive Support and Improvement
Center for Assessment/LPI. NY Regents Retreat. March 27, 2017 19
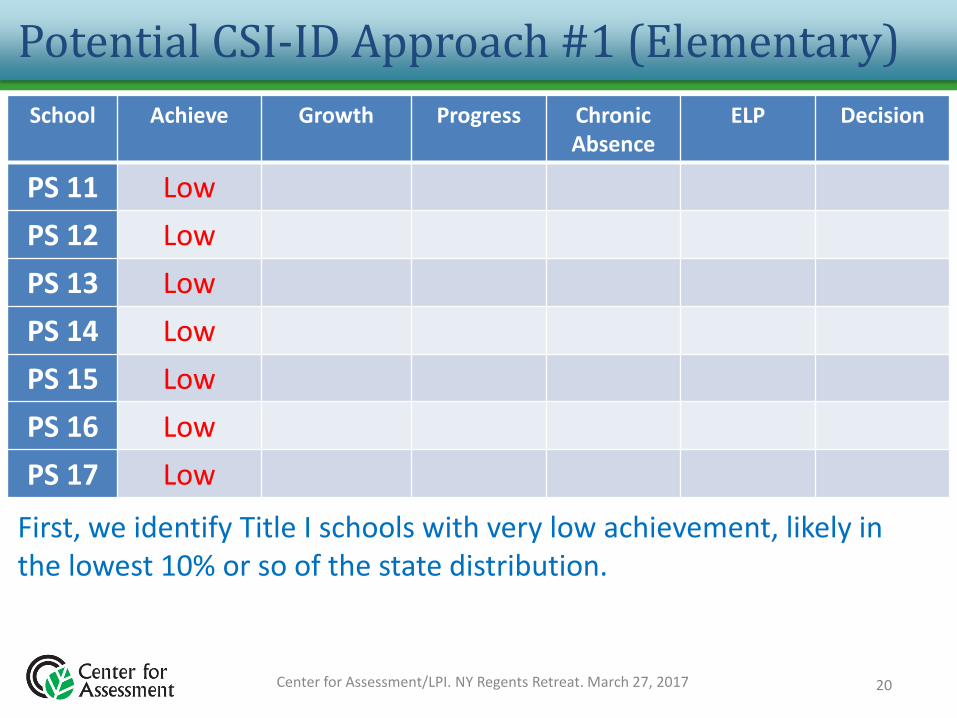
Potential CSI-ID Approach #1 (Elementary)
20Center for Assessment/LPI. NY Regents Retreat. March 27, 2017
School Achieve Growth Progress Chronic Absence
ELP Decision
PS 11 Low
PS 12 Low
PS 13 Low
PS 14 Low
PS 15 Low
PS 16 Low
PS 17 Low
First, we identify Title I schools with very low achievement, likely in the lowest 10% or so of the state distribution.
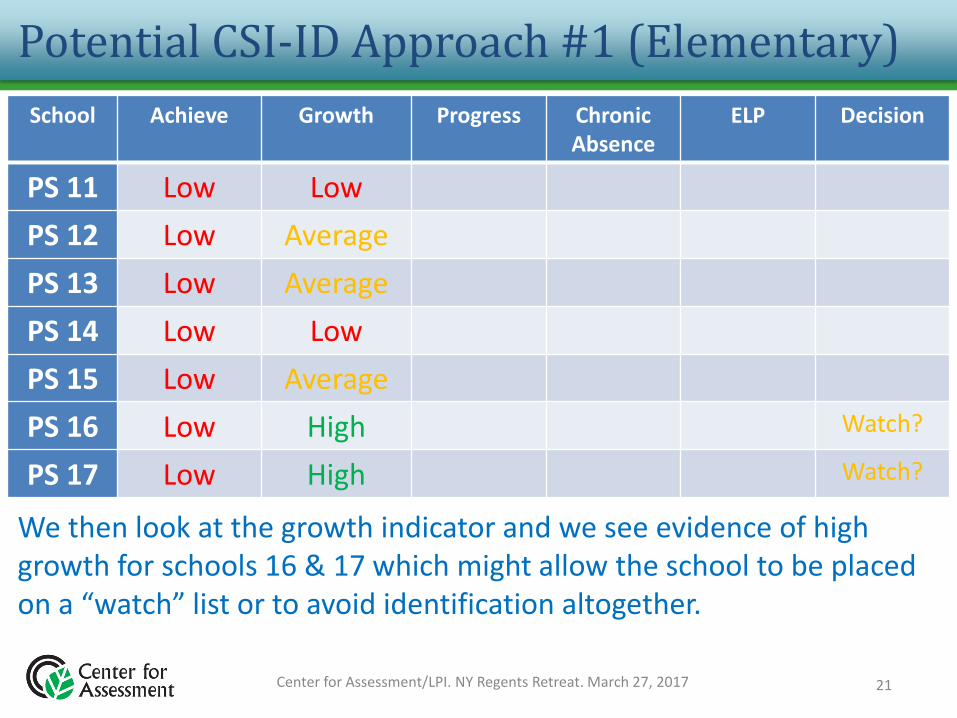
Potential CSI-ID Approach #1 (Elementary)
21Center for Assessment/LPI. NY Regents Retreat. March 27, 2017
School Achieve Growth Progress Chronic Absence
ELP Decision
PS 11 Low Low
PS 12 Low Average
PS 13 Low Average
PS 14 Low Low
PS 15 Low Average
PS 16 Low High Watch?
PS 17 Low High Watch?
We then look at the growth indicator and we see evidence of high growth for schools 16 & 17 which might allow the school to be placed on a “watch” list or to avoid identification altogether.
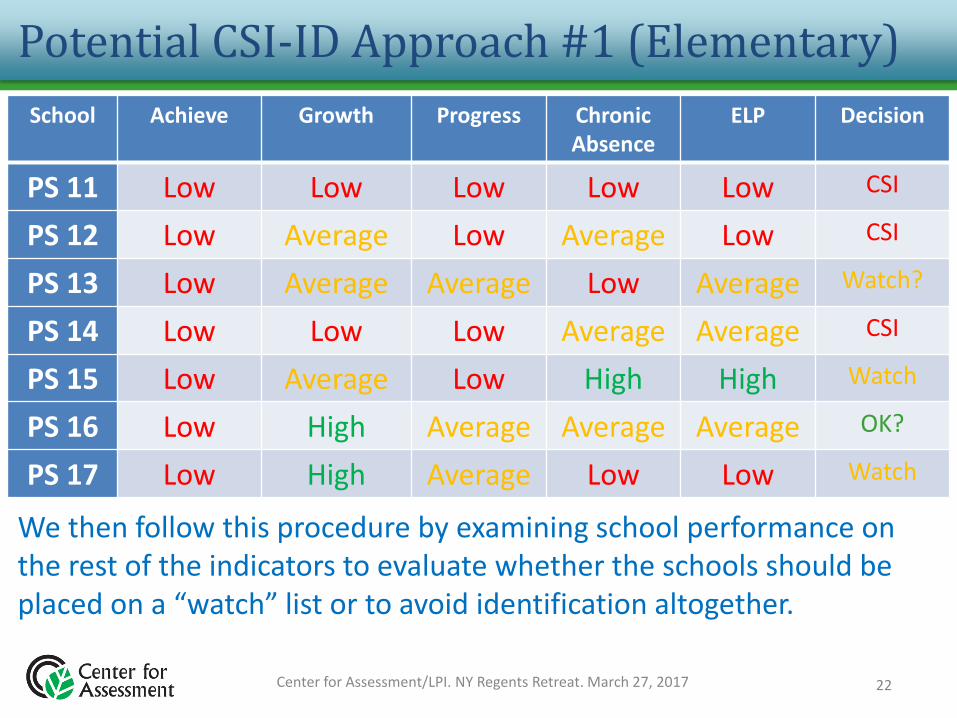
Potential CSI-ID Approach #1 (Elementary)
22Center for Assessment/LPI. NY Regents Retreat. March 27, 2017
School Achieve Growth Progress Chronic Absence
ELP Decision
PS 11 Low Low Low Low Low CSI
PS 12 Low Average Low Average Low CSI
PS 13 Low Average Average Low Average Watch?
PS 14 Low Low Low Average Average CSI
PS 15 Low Average Low High High Watch
PS 16 Low High Average Average Average OK?
PS 17 Low High Average Low Low Watch
We then follow this procedure by examining school performance on the rest of the indicators to evaluate whether the schools should be placed on a “watch” list or to avoid identification altogether.
80706050403020
2014-15 Average MGP
200
150
100
50
020
14
-15
A
ve
ra
ge
Co
mb
in
ed
3
-8
E
LA
an
d M
ath
Pe
rfo
rm
an
ce
In
de
x
Accountability Status of Elementary and Middle Schools Based on
2014-15 ELA and Math Achievement and Growth Results
Priority Schools
Focus Schools
Local
Assistance Plan
Good Standing
Accountability
Status
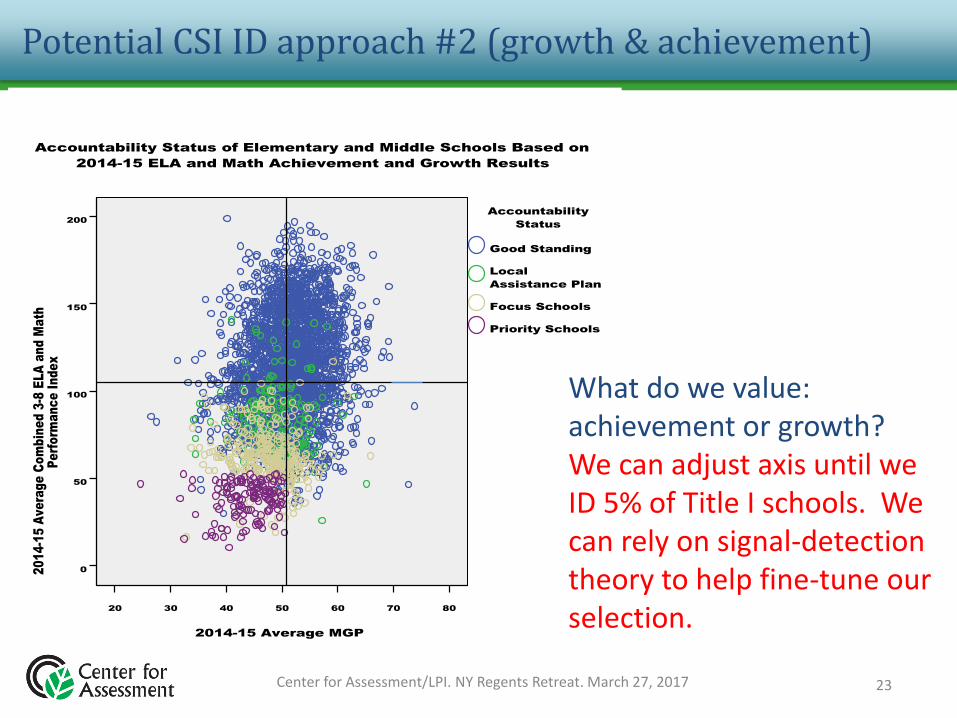
Potential CSI ID approach #2 (growth & achievement)
23Center for Assessment/LPI. NY Regents Retreat. March 27, 2017
What do we value: achievement or growth?We can adjust axis until we ID 5% of Title I schools. We can rely on signal-detection theory to help fine-tune our selection.
Potential CSI Approaches
• Which of these approaches, if either, make the most sense to you?
• Are there other approaches that we should consider?
• Which is most coherent with the proposed method for producing annual determinations for all NY schools?
24Center for Assessment/LPI. NY Regents Retreat. March 27, 2017
Questions/Comments
• Other questions and comments?
25Center for Assessment/LPI. NY Regents Meeting. April 4, 2017
Appendix A: Reporting Considerations and Examples
26
Center for Assessment/LPI. NY Regents Meeting. April 4, 2017
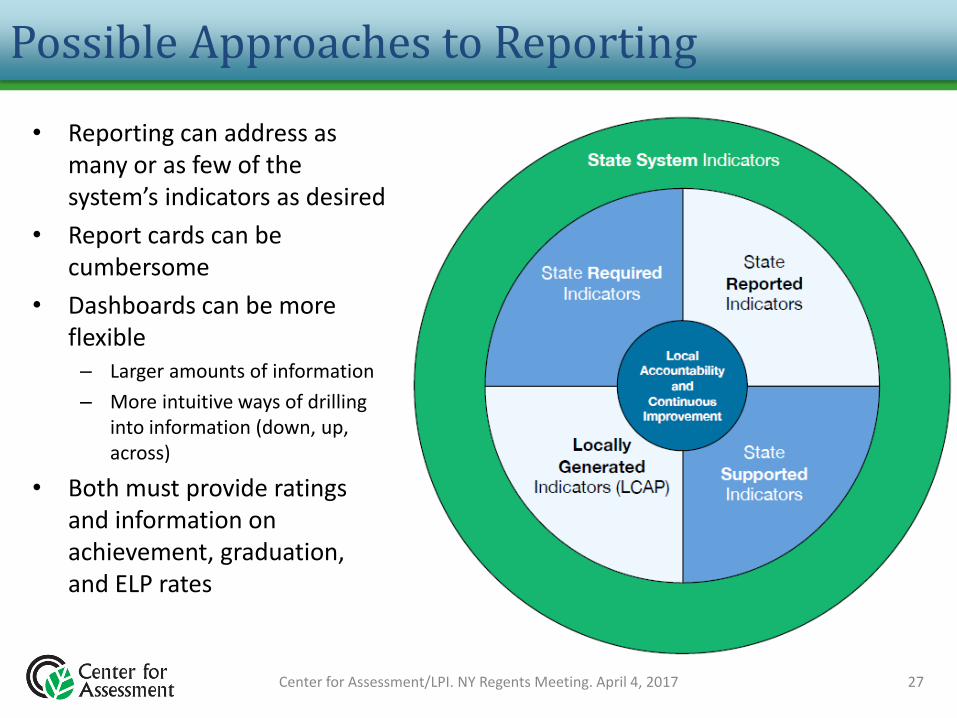
Possible Approaches to Reporting
• Reporting can address as many or as few of the system’s indicators as desired
• Report cards can be cumbersome
• Dashboards can be more flexible– Larger amounts of information
– More intuitive ways of drilling into information (down, up, across)
• Both must provide ratings and information on achievement, graduation, and ELP rates
Center for Assessment/LPI. NY Regents Meeting. April 4, 2017 27
Examples of Reporting Approaches
• Three examples will be presented– Illinois Report Card
– Ohio Report Card (but more like a dashboard)
– Wisconsin Report Card & Dashboard
• Displays will differ in their approach– Zooming in
– Drilling down to make additional comparisons
– Degree of companion reporting for schools
Center for Assessment/LPI. NY Regents Meeting. April 4, 2017 28
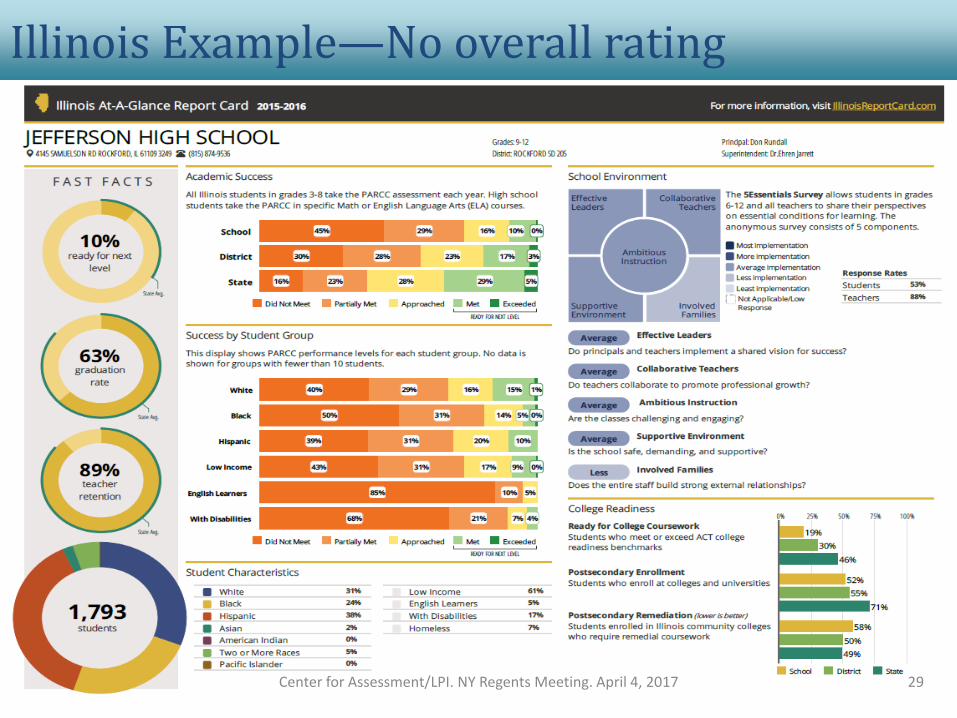
Illinois Example—No overall rating
Center for Assessment/LPI. NY Regents Meeting. April 4, 2017 29

Illinois Example
Center for Assessment/LPI. NY Regents Meeting. April 4, 2017 30
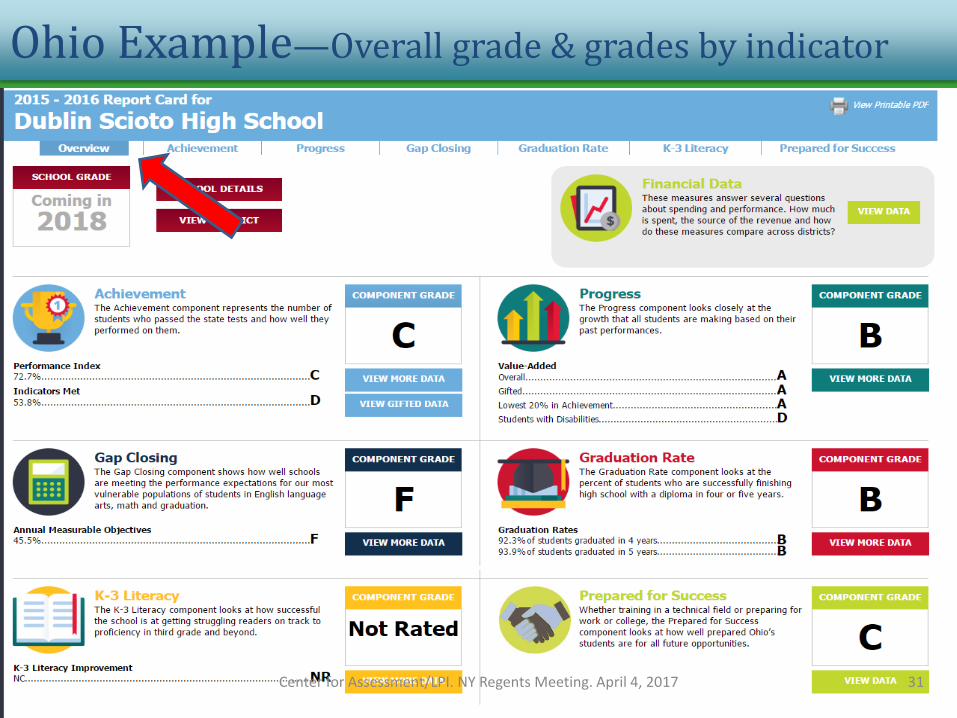
Ohio Example—Overall grade & grades by indicator
Center for Assessment/LPI. NY Regents Meeting. April 4, 2017 31
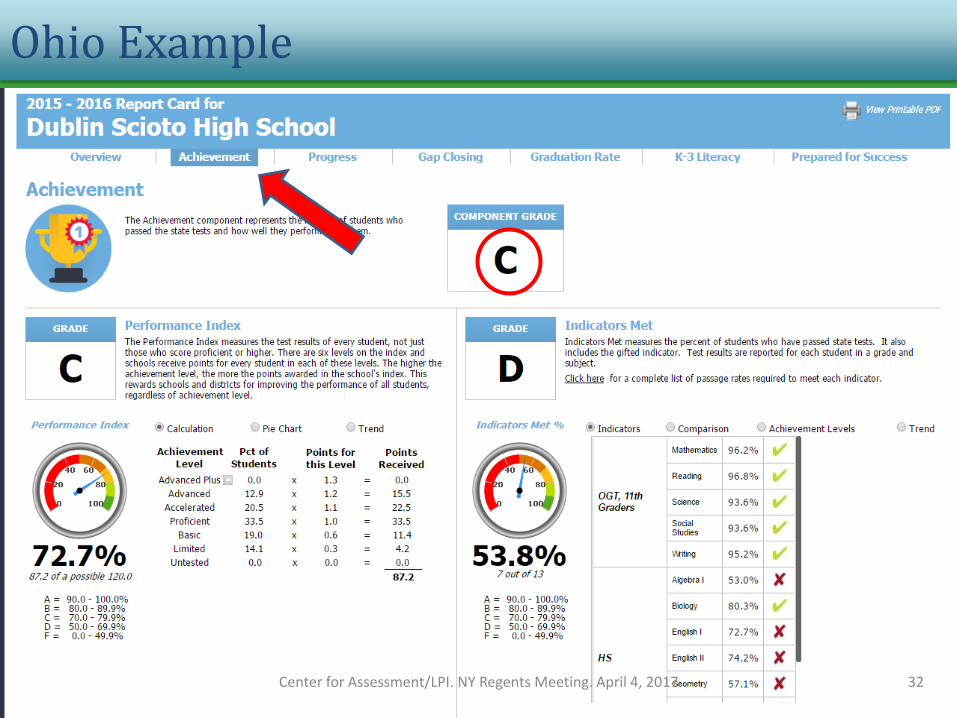
Ohio Example
Center for Assessment/LPI. NY Regents Meeting. April 4, 2017 32
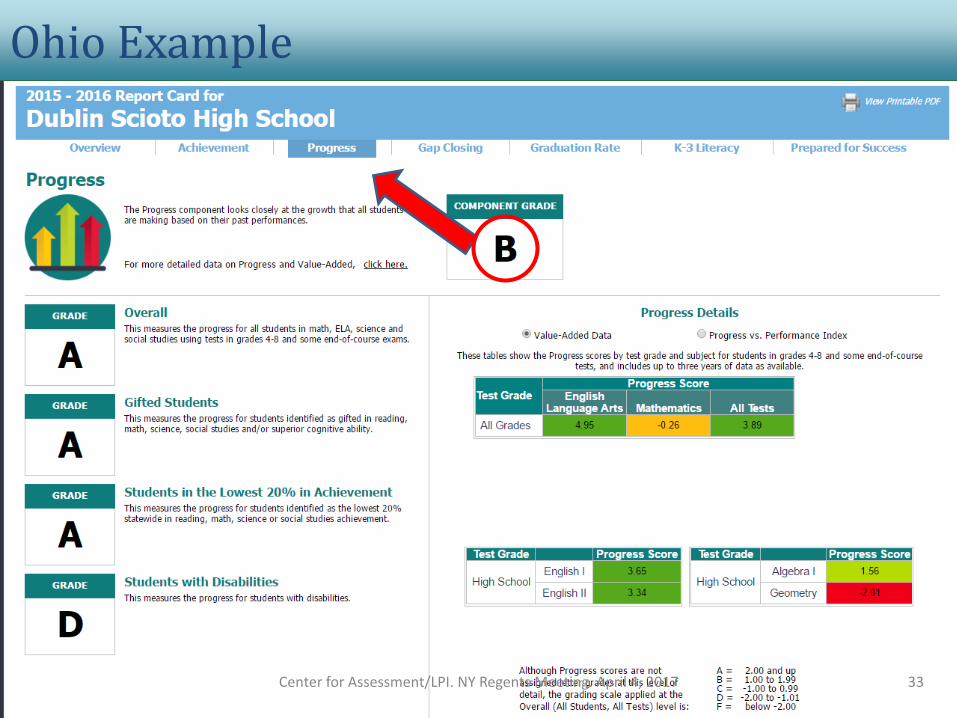
Ohio Example
Center for Assessment/LPI. NY Regents Meeting. April 4, 2017 33
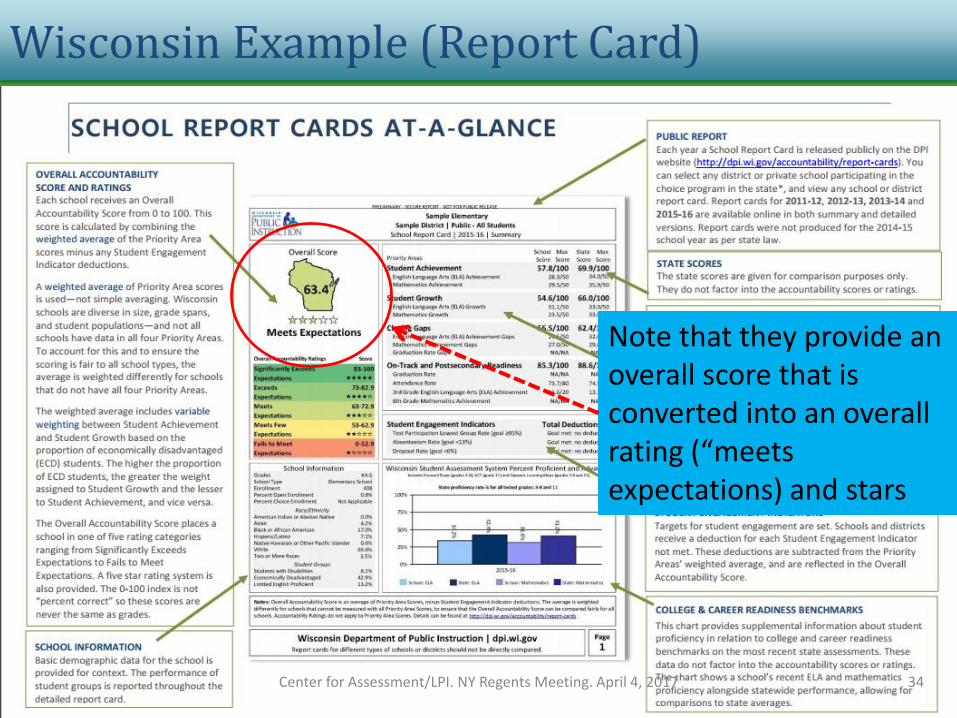
Wisconsin Example (Report Card)
Note that they provide an overall score that is converted into an overall rating (“meets expectations) and stars
Center for Assessment/LPI. NY Regents Meeting. April 4, 2017 34
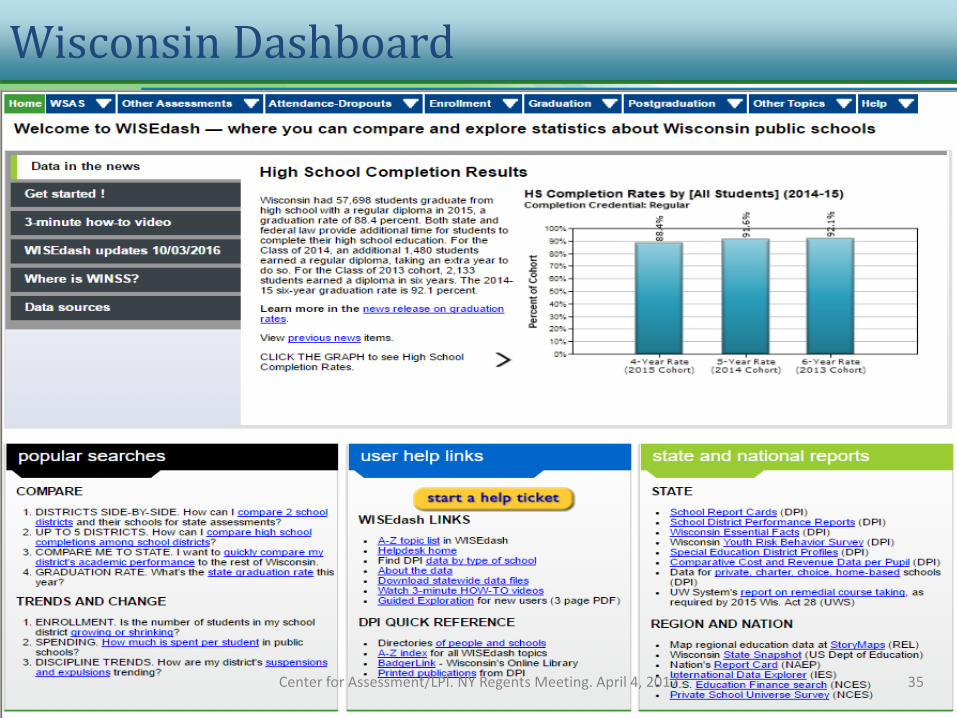
Wisconsin Dashboard
Center for Assessment/LPI. NY Regents Meeting. April 4, 2017 35
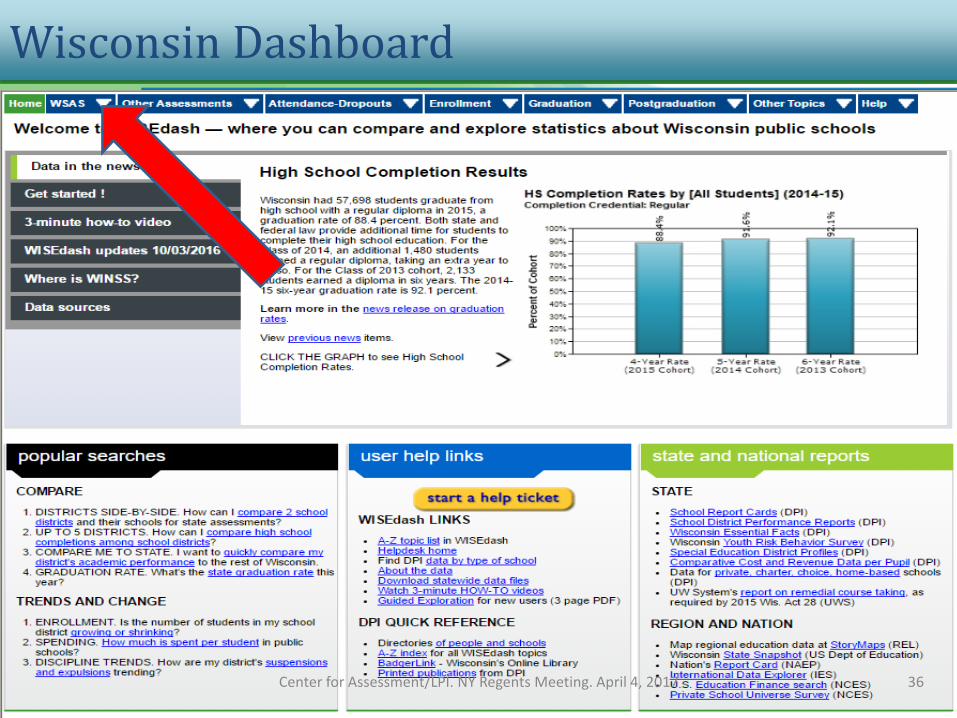
Wisconsin Dashboard
Center for Assessment/LPI. NY Regents Meeting. April 4, 2017 36
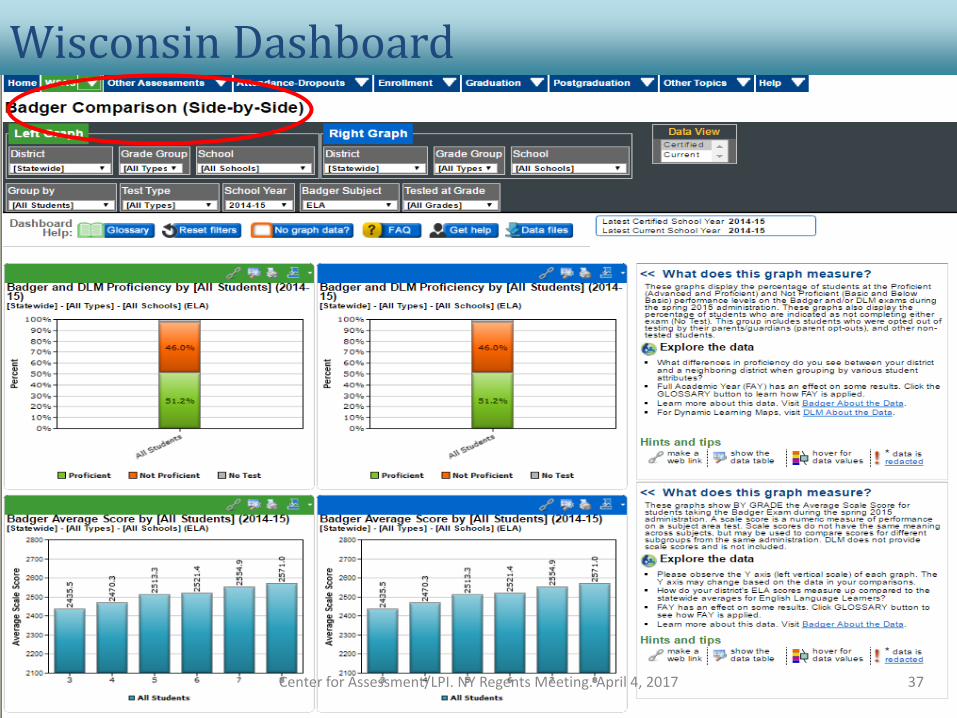
Wisconsin Dashboard
Center for Assessment/LPI. NY Regents Meeting. April 4, 2017 37

Wisconsin Dashboard
Center for Assessment/LPI. NY Regents Meeting. April 4, 2017 38
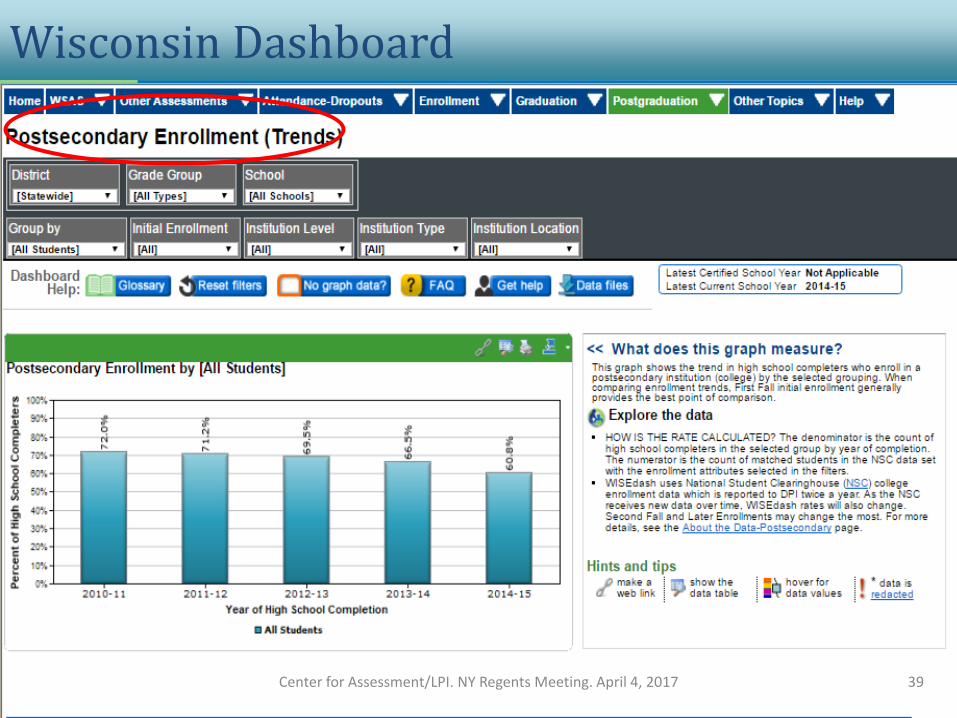
Wisconsin Dashboard
Center for Assessment/LPI. NY Regents Meeting. April 4, 2017 39
How to Help the Public Navigate Data
• What should be the focus and for which stakeholders?
– To provide at-a-glance information specific to ESSA?
– To support a deep dive into a school’s story including non-accountability indicators?
– To help the public make comparisons to…
• Other schools within the district or state?
• Other districts?
• The state as a whole?
Center for Assessment/LPI. NY Regents Meeting. April 4, 2017 40
How to Help the Public Navigate Data
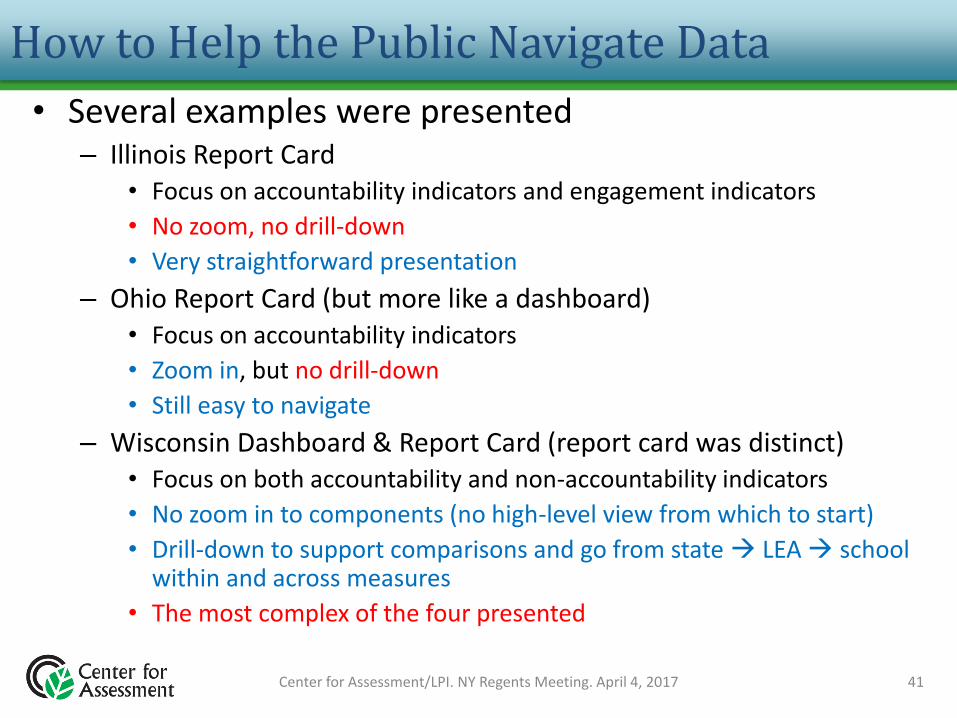
• Several examples were presented– Illinois Report Card
• Focus on accountability indicators and engagement indicators
• No zoom, no drill-down
• Very straightforward presentation
– Ohio Report Card (but more like a dashboard)• Focus on accountability indicators
• Zoom in, but no drill-down
• Still easy to navigate
– Wisconsin Dashboard & Report Card (report card was distinct)• Focus on both accountability and non-accountability indicators
• No zoom in to components (no high-level view from which to start)
• Drill-down to support comparisons and go from state LEA school within and across measures
• The most complex of the four presented
Center for Assessment/LPI. NY Regents Meeting. April 4, 2017 41
After seeing these potential displays…
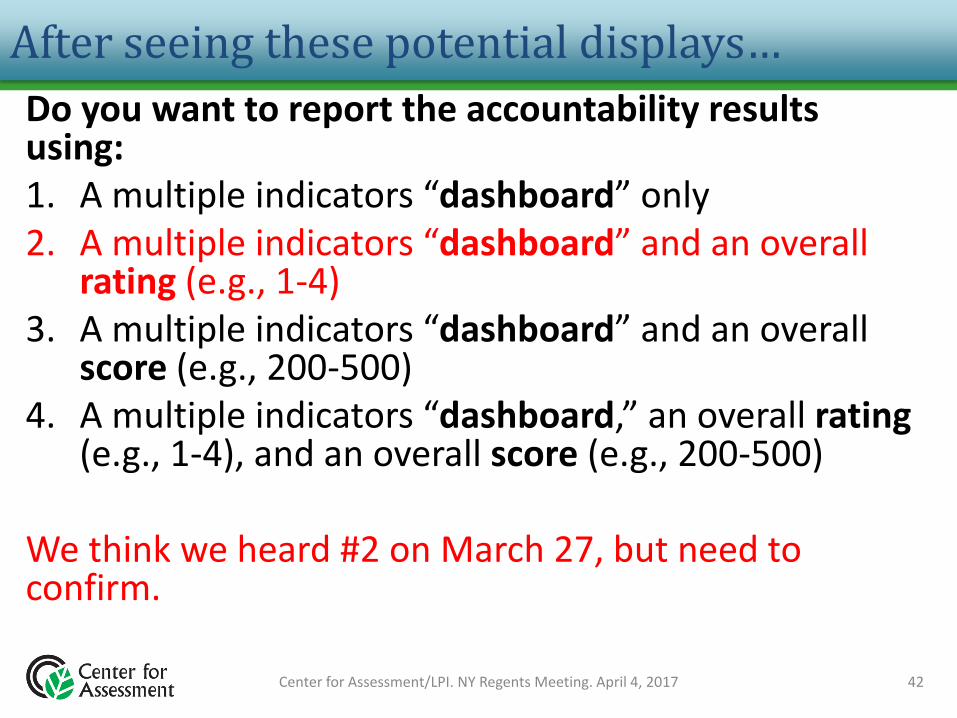
Do you want to report the accountability results using:1. A multiple indicators “dashboard” only2. A multiple indicators “dashboard” and an overall
rating (e.g., 1-4) 3. A multiple indicators “dashboard” and an overall
score (e.g., 200-500)4. A multiple indicators “dashboard,” an overall rating
(e.g., 1-4), and an overall score (e.g., 200-500)
We think we heard #2 on March 27, but need to confirm.
42Center for Assessment/LPI. NY Regents Meeting. April 4, 2017