Embed Size (px)
Citation preview

Basic Materials
December 2014
Putting India on the growth path: Unlocking the mining potential

Copyright © 2014, by McKinsey & Company, Inc.

Putting India on the growth path: Unlocking the mining potential
December 2014
Presented at CII Global Mining Summit, 2014
Basic Materials


5Basic Materials Putting India on the growth path: Unlocking the mining potential
India is well endowed in terms of most minerals and the country’s mining sector has great potential. While demand for commodities has been strong, supply has been constrained. This has resulted in increased import. While India’s demand for mining commodities will increase rapidly, likely constrained growth of the mining sector will continue to increase the demand-supply gap.
To ensure “Make in India” becomes a reality, it is imperative to grow the mining sector. The mining industry can propel the economy by creating employment, meeting the ever-growing demand of
the downstream industries such as manufacturing and infrastructure, and also through increased fiscal contributions.
It was with this view that the Confederation of Indian Industry (CII), with the support of McKinsey & Company decided to bring out a report “Putting India on the growth path: Unlocking the mining potential”. As the knowledge partner for the CII Global Mining Summit, McKinsey has done a detailed analysis of the impact of the mining sector and identified the opportunities and the path forward.
We are thankful to McKinsey & Company for their effort and for bringing an insightful perspective to the summit. We hope that you will find this report informative and useful for designing win-win solutions and taking decisions in shaping the future of the Indian mining sector.
Chandrajit Banerjee Director General Confederation of Indian Industry
Foreword by the organiser
Nik Senapati Chairman, CII National Committee on Mining Confederation of Indian Industry


7Basic Materials Putting India on the growth path: Unlocking the mining potential
Contents
Acknowledgements ................................................................................... 9
Executive Summary ................................................................................. 11
Chapter 1: Economic impact and potential of India’s mining sector .......... 16
Chapter 2: Challenges for India’s mining sector ....................................... 26
Chapter 3: Initiatives to revive India’s mining sector .................................. 38


9Basic Materials Putting India on the growth path: Unlocking the mining potential
On behalf of McKinsey & Company, we would like to thank the Confederation of Indian Industry for the opportunity to produce this report. We collaborated extensively with CII members from the CII National Committee on Mining, industry experts and global mining experts in this effort. The research draws extensively from McKinsey’s Basic Materials Institute proprietary global iron ore, steel, coal models and databases.
The report has been possible through the dedicated effort of the McKinsey team: Ashutosh Satapathy,
Priyank Gupta, and Shumi Jain. We are thankful to the following who helped us with the research: Abhinav Tripathi, Ajay Lala, Alexey Simushkin, Rahul Dubey, Rishi Arora, Saral Chauhan, Sonam Handa, Steven Vercammen, Surjit Das, Vritika Jain, Yunjing Kinzel and Xuan Li. We also thank Ranabir Majumdar and Punita Singh for editorial support, Fatema Nulwala and Natasha Wig for supporting external communication and Nipun Gosain for visual aids support.
We are thankful to Gunajit Kalita and Yashika Singh for their support to the report.
We would like to thank McKinsey’s global basic materials leadership for providing overall direction. We would also like to acknowledge Ashwin Hasyagar, fellow, McKinsey Global Institute in our Bangalore office; and Anu Madgavkar, a senior fellow, McKinsey Global Institute at our Mumbai office for their invaluable inputs.
Rajat Gupta Director McKinsey & Company
Abhijit Kulkarni Associate Principal McKinsey & Company
Acknowledgements


11Basic Materials Putting India on the growth path: Unlocking the mining potential
Executive Summary
The Indian mining sector has been a success story in waiting for decades. Despite enjoying an endowment of the top 5 or 6 reserves globally across commodities such as thermal coal and iron ore, the mining industry has remained relatively small and stagnant. In fact over the last decade, the contribution of mining to India’s GDP has fallen from 1.2 per cent to 1 per cent.
If properly tapped, the mining industry could help propel growth for the country over the next decade. In fact, the performance of mining sector will be an important factor for India to achieve 7 per cent plus GDP growth. The mining industry has the potential to create 6 million additional total jobs by 2025, accounting for 12 per cent of the new non-farm job gap. At the same time, the mining industry could contribute an additional USD 125 billion to India’s output and USD 47 billion to India’s GDP by 2025.
For this to happen, complete ecosystem—centre, state and mining industry should work together to unlock India’s potential in mining.
Mining sector’s growth crucial for India’s growth in the next decade
Mining provides the raw material for a host of basic industries such as steel and power, and is therefore the backbone for the manufacturing and infrastructure sectors.
In 2012, the mining sector accounted for 3 million jobs directly, and induced an additional 8 million jobs. In the business-as-usual scenario (GDP growth of 5.5 per cent), no additional employment will likely be generated by the mining sector, with only productivity increase likely to account for the entire output growth. However, a reform scenario leading to accelerated growth (GDP growth rate of 7.8 per cent) has the potential to create an additional 6 million jobs (direct and induced) over the business-as-usual scenario by 2025. This would be 4 to 5 per cent of the total non-farm jobs needed to absorb India’s demographic demands, and 12 per cent of the gap that is likely to remain after jobs likely to be created in the business-as-usual scenario.1
While demand continues to create the ground for a robust mining sector, it is not supported with
requisite supply. Without accelerated growth in mining, India will have to rely on heavy imports—175 Mt of iron ore import per year (11 per cent of the global seaborne market), 300 Mt of thermal coal import per year (25 per cent of the global seaborne market) and 70 Mt of met coal import per year (22 per cent of the global seaborne market) by 2025. This is bound to put upward pressure on the global pricing of these commodities as well as increase the forex spend on account of thermal coal, coking coal and iron ore to USD 58 billion. This is a staggering 180 per cent of today’s current account deficit.
Mining growth has consequences for downstream industries such as power generation, steel making and aluminium, and therefore on manufacturing (e.g., auto, chemicals, cement) and infrastructure (e.g., road, rail, real estate). For example, a part of the new capacity of aluminium assets in India today remain stranded as bauxite mining has not picked up correspondingly.
The Indian government has launched “Make in India” to expand the contribution of manufacturing. If mining does not keep up with the demand, downstream industries will have to work with
1. According to the McKinsey Global Institute, India needs to create an additional 150 million non-farm jobs by 2025, to significantly reduce poverty, and empower people.
12
imported raw material, thus becoming less competitive. As an example, our analysis indicates that India’s ship building industry will incur an additional cost of about 4 per cent, just on account of having to import metallic raw materials.
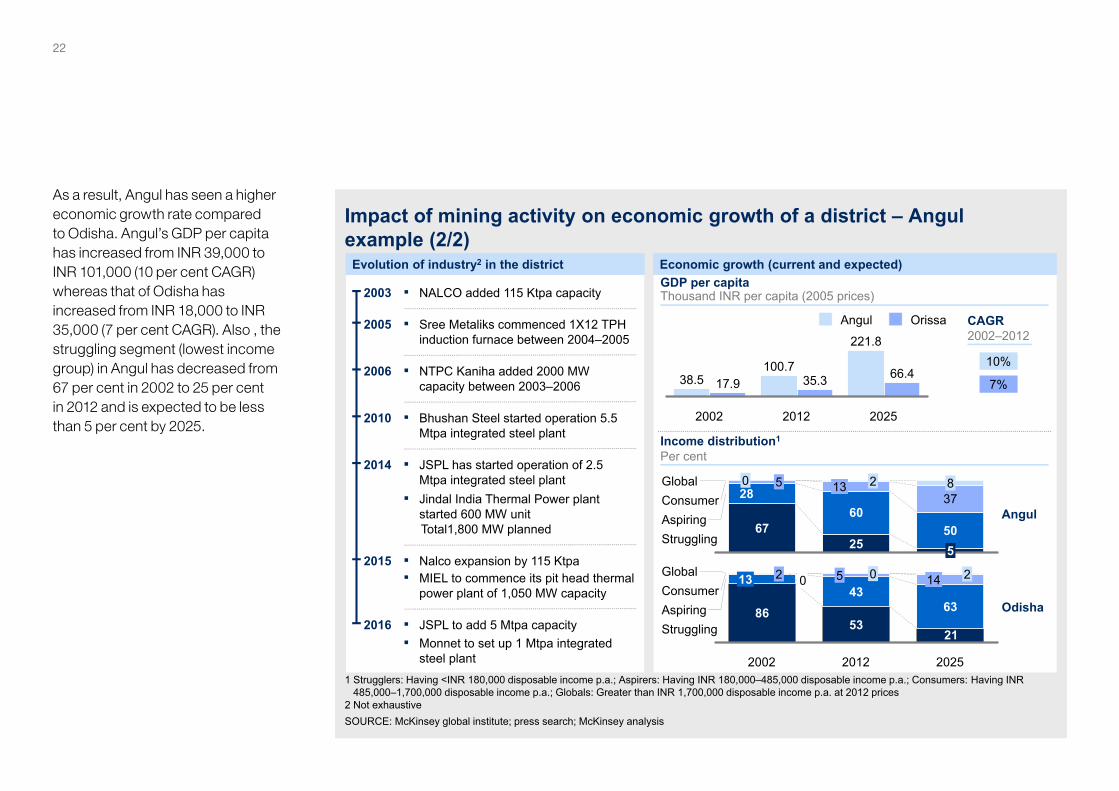
Mining also provides a unique opportunity to propel the growth of India’s mineral-based districts, which are also often India’s most backward districts in its poorest states. Mineral rich districts can create clusters of growth across India, across industry and infrastructure. For example, Angul district in the eastern state of Odisha has seen tremendous growth on the back of coal mining activity (Talcher coal fields). Downstream industries such as power plants, aluminium smelters and steel plants have come up in the area, providing livelihood to the local population. In fact, the poorest of poor segment in Angul has shrunk from 67 per cent in 2002 to 25 per cent in 2012, and is likely to go below 5 per cent by 2025. Angul has outperformed the state of Odisha: the GDP per capita of Angul is INR 101,000 against Odisha’s average of INR 35,000.
If mining grows more rapidly, it could increase its direct and induced contribution to India’s output from USD 50 billion in 2012 to USD 126 billion by 2025 (additional USD 47 billion over business-as-
usual scenario). An improvement in GDP will be of similar magnitude.
The total revenue to the government through mining and downstream sector could increase from USD 18 billion in 2012 to USD 53 billion by 2025 in the accelerated mining growth scenario, which is 30 per cent of today’s revenue receipts. In fact, mining revenues can significantly boost state revenues in mining dominant states such as Goa, Chhattisgarh, Jharkhand and Odisha.
Challenges affecting growth of Indian mining sector
India’s mining sector has traditionally been relatively small and has been growing slower than other major mining jurisdictions such as China, Brazil, Canada, the United States, Chile and Australia. The real value add of India’s mining sector to the GDP is very low at USD 14.4 billion against that of China (USD 150 billion), Australia (USD 38 billion) and Brazil (USD 21 billion). Between 2010 and 2012, India’s mining sector grew at 0.8 per cent compared to 15 per cent for China, 5.3 per cent for the United States, 2.5 per cent for Canada and 2 per cent for Brazil. Also, India is ranked low on the composite mineral and policy potential, with a Fraser rank of 59 amongst
96 mining regions making India less attractive for investments.
Structural reasons for low mining growth in India:
� India lags in baseline geophysical and geochemical data generation, for e.g., only 2 per cent area is covered for gravity and magnetic analysis, only 4 per cent for sediment data and very little seismic data has been collected compared to countries such as Australia where 100 per cent of the area is covered for gravity and magnetic analysis, 91 per cent for sediment data and 100 per cent for seismic data. Also, there has been low focus on exploration in India, with an exploration budget in 2013 of USD 17 per sq. km against USD 51 for Brazil and USD 67 for China.
� India faces unique challenges in land acquisition and executing resettlement and rehabilitation. One of the reasons is that original settlers do not always get long-term jobs and hence do not want to vacate their land. Both public and private mining companies face delays to the tune of several years to start mining on the identified land in India. Despite enabling legislations like the Coal Bearing Areas Act (CBA), it has been difficult even for public sector players to clear land for mining.
13Basic Materials Putting India on the growth path: Unlocking the mining potential
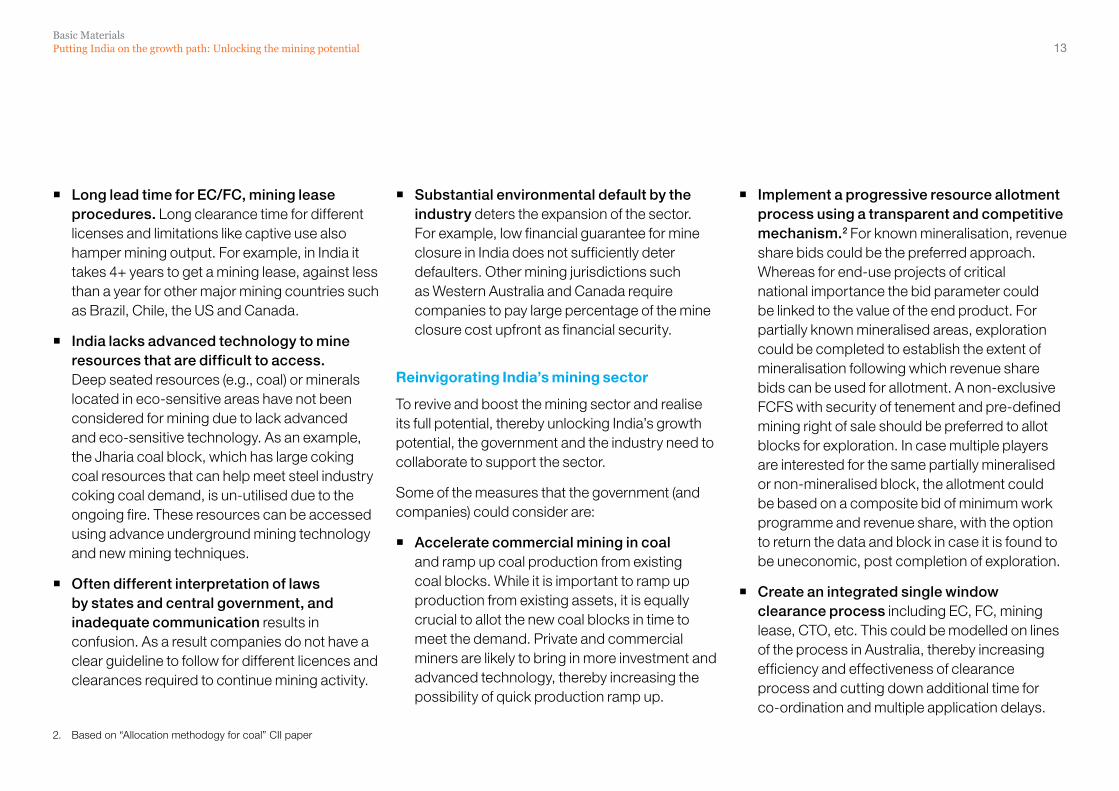
� Long lead time for EC/FC, mining lease procedures. Long clearance time for different licenses and limitations like captive use also hamper mining output. For example, in India it takes 4+ years to get a mining lease, against less than a year for other major mining countries such as Brazil, Chile, the US and Canada.
� India lacks advanced technology to mine resources that are difficult to access. Deep seated resources (e.g., coal) or minerals located in eco-sensitive areas have not been considered for mining due to lack advanced and eco-sensitive technology. As an example, the Jharia coal block, which has large coking coal resources that can help meet steel industry coking coal demand, is un-utilised due to the ongoing fire. These resources can be accessed using advance underground mining technology and new mining techniques.
� Often different interpretation of laws by states and central government, and inadequate communication results in confusion. As a result companies do not have a clear guideline to follow for different licences and clearances required to continue mining activity.
� Substantial environmental default by the industry deters the expansion of the sector. For example, low financial guarantee for mine closure in India does not sufficiently deter defaulters. Other mining jurisdictions such as Western Australia and Canada require companies to pay large percentage of the mine closure cost upfront as financial security.
Reinvigorating India’s mining sector
To revive and boost the mining sector and realise its full potential, thereby unlocking India’s growth potential, the government and the industry need to collaborate to support the sector.
Some of the measures that the government (and companies) could consider are:
� Accelerate commercial mining in coal and ramp up coal production from existing coal blocks. While it is important to ramp up production from existing assets, it is equally crucial to allot the new coal blocks in time to meet the demand. Private and commercial miners are likely to bring in more investment and advanced technology, thereby increasing the possibility of quick production ramp up.
� Implement a progressive resource allotment process using a transparent and competitive mechanism.2 For known mineralisation, revenue share bids could be the preferred approach. Whereas for end-use projects of critical national importance the bid parameter could be linked to the value of the end product. For partially known mineralised areas, exploration could be completed to establish the extent of mineralisation following which revenue share bids can be used for allotment. A non-exclusive FCFS with security of tenement and pre-defined mining right of sale should be preferred to allot blocks for exploration. In case multiple players are interested for the same partially mineralised or non-mineralised block, the allotment could be based on a composite bid of minimum work programme and revenue share, with the option to return the data and block in case it is found to be uneconomic, post completion of exploration.
� Create an integrated single window clearance process including EC, FC, mining lease, CTO, etc. This could be modelled on lines of the process in Australia, thereby increasing efficiency and effectiveness of clearance process and cutting down additional time for co-ordination and multiple application delays.
2. Based on “Allocation methodogy for coal” CII paper

14
The Ministry of Environment & Forests is taking steps to streamline the process but has a long road ahead.
� Consider reviewing the land acquisition act to facilitate faster project execution. Elements of the land acquisition act could be revisited: particularly percentage consent required for land acquisition and procedural steps needed to complete the acquisition. In the process, it is a must to ensure rapid job creation for displaced people and fairness to land owners.
� Develop the necessary logistics infrastructure, including key rail links and coastal shipping on eastern India’s seaboard, to ensure appropriate evacuation and cost-effective mineral transportation. For the steel industry needs of iron ore and coking coal the government could accelerate two dedicated freight corridors (Delhi-Kolkata and Kolkata-Mumbai), while also expanding capacity along high volume routes (Goa-Chennai). Accelerating three mining rail corridors (Tori-Shivpur-Kathuria, Jharsuguda-Barpali and East-West corridor) could help debottleneck coal production at major CIL coal mines. Expanding port capacity at major ports such as Paradip and Vizag will further facilitate sea route transport of coal and
iron ore from the eastern ports of India to other costal demand areas, as is the case in China for coal.
� Attract juniors to significantly ramp up exploration to grow mineral reserves ahead of consumption. India has the same geological strata as that of Africa and Australia and thus is likely to have a similarly large geological potential. It is therefore, crucial to get detailed exploration profiles for India. Exploration needs to be treated as a scientific process driven by corporations and the Geological Survey of India, who should develop baseline data and make it available to attract exploration investment.
� Proactively address the mining skilled labour gap by augmenting capacity in educational institutions and partnering with industry, HRD ministry or the National Skill Development Council. For example, the incremental requirement of mining engineers, geologist, diploma holders and skilled/semi-skilled labour would be 1 to 2 times the work force in 2009.
� Implement a progressive mining legislation and ensure stability in laws and guidelines for the industry; and avoid retrospective changes. Legal language could be framed
clearly to avoid misinterpretation and provisions could be drafted to provide clarifications as and when required. For reinstating investor confidence, the government should ensure that no retrospective changes are made in the policy of allotment, taxation and general administration. The government should also actively intervene and provide the necessary facts that will allow India’s judicial system to dispose of cases quicker, and to interpret the law in a balanced manner.
� Companies need to manage sustainability pro-actively—specifically environment and scientific mining. Mining companies need to understand the economic value of the resource and avoid any wastage of valuable minerals. It is critical to ensure that all the rules from exploration stage to mine closure stage are followed.
� Companies need to invest in new capabilities to ensure the licence to operate, which is becoming more critical than mining operations itself. Companies will have to take accountability for creating a conducive environment for mining —creating social parity, being responsible with the environment and creating jobs. This can potentially be a huge source of competitiveness

15Basic Materials Putting India on the growth path: Unlocking the mining potential
for those that invest in these capabilities. As an example, mining companies will need to consider setting up job creation engines (not necessarily in mining) as a means of obtaining land faster and in a humane manner.
* * *
India is endowed with great mineral wealth. Properly tapped, it can help propel India’s GDP growth, generate additional employment and mitigate fiscal and forex challenges. The industry and the government need to work together to ensure that the industry reaches its high potential.

Chapter 1
Economic impact and potential of India’s mining sector

Basic Materials Putting India on the growth path: Unlocking the mining potential 17
In an accelerated growth scenario, mining could generate an additional 6 million jobs moving many from poverty to empowerment. India will need about 150 million new non-farm jobs by 2025, of which only 98 million are likely to be created in a business—as usual scenario. Direct and consequent mining jobs could address over 10 per cent of the gap relative to the business-as-usual scenario.
Impact on employment by accelerating India’s mining sector
237
98335
387150
237
+52
Non-farm jobs, 2012
Created in BAU scenario by 2025
Total non-farm jobs in BAU scenario in 2025
Required Non-farm jobs, 2025
Required by 20251
Non-farm jobs, 2012
3 35
8 8
12
17
+6
Accelerated growth3
Business as usual2
(BAU)
11
2012
11
Share of non-farm job gap
SOURCE: National Sample Survey Office survey, 68th round; United Nations Population Division; McKinsey global institute analysis
1 Assuming share of farm sector in total employment assumed to fall from 49% to 37%, labour force participation rate assumed to rise by 2.6% points and working-age population grow at 1.4% per annum based on demographic profile
2 Business as usual scenario where lack of decisive reforms would make it unlikely for India to address the gaps in access to social infrastructure. Assuming GDP growth rate of 5.5% and mining growth rate of 3.5% based on historical correlation
3 Accelerated growth scenario where the nation takes steps to stimulate investment, job creation and productivity to dramatically improve delivery of basic services. Assuming GDP growth rate of 7.8% and mining growth rate of 7.3%
DirectIndirectNon-farm job gap
Non-farm jobsMillion jobs
Mining job creationMillion jobs
X
0% 12%Required jobs Jobs in BAU

18
Iron ore
Thermal coal@6000 GCV
Coking coal 2049-29
Supply2Demand1
By 2025, India would account for ~22% of the global seaborne coking coal market
India would import ~300 million tonnes of coal by 2025 which would account for 25% of the global seaborne market then
From being an exporter, India will become a major importer accounting for ~11% of the global seaborne trade in 2025
India’s dependence on imports due to slow mining growth
136+12124
299 -76375
188 -175363
549 -295844
36 -72
Supply2Demand1
108
1 Demand is based on raw material requirement to meet demand for steel, power and cement industry at 7.8% GDP growth rate2 Supply is based on announced projects and expected production ramp up for individual minesSOURCE: McKinsey bottom-up demand model; McKinsey metallurgical coal demand supply model; McKinsey iron ore supply model; McKinsey thermal
coal demand supply model
Supply demand balance in 2012Million tonne
Supply demand balance in 2025Million tonne
If mining output growth is unable to keep pace with India’s demand, demand supply gap will widen. By 2025, India would be a large importer of iron ore, thermal coal and coking coal. It would account for 11 per cent, 25 per cent and 22 per cent of the global seaborne trade of these respective commodities. India’s increasing share in the global seaborne market would put upward pressure on global prices of these respective commodities.

Basic Materials Putting India on the growth path: Unlocking the mining potential 19
By meeting its own demand for mining commodities, India could address its current account deficit substantively. If mining growth continues to be slow, by 2025, India would incur USD 58 billion in forex spend from iron ore, coking coal and thermal coal.
Sluggish mining to impact India’s forex spend for commodity imports
Thermal Coal3
Coking coal3Iron ore2
2025
58
29
13
17
2020
28
15
66
SOURCE: McKinsey bottom-up demand model; McKinsey metallurgical coal demand supply model; McKinsey iron ore supply model; Consensus Economics (10/14); Reserve Bank of India; McKinsey analysis
1 Foreign exchange that would be required to import thermal coal, coking coal and iron ore2 Assumed Australian lump for iron ore import and demand for steel satisfied by domestic production3 Assumed Australia steam coal and coking coal import
FY 14
32
FOREX1
Estimated forex spent for import of iron ore and thermal coal in 2025USD billion
Current account deficit for IndiaUSD billion

20
Effect of mining on downstream industry competitiveness
19
14
13
13
30
11
100 4
14
1
Total cost -104
Other
Labour
Hull outfitting
Main engine
Steel
Machineryoutfitting 20
1 14
151
+4%
1
Steel production costUSD/tonne
Ship building cost: ExampleIndexed
223
47
92
388 58
58
Cost withoutIron ore import
Other
-446
Labour 26
Energy
Raw materials 281
+15%
SOURCE: BMI flat steel cost model; Bureau of Labor Statistics; EIU; McKinsey analysis
1 Model India steel plant assuming import of 50% of the iron ore and coking coal consumption2 Assuming steel players would transfer half of the increased cost to downstream industries
Additional cost due to increased steel prices2Additional cost due to raw material import1
Due to import of iron ore and other raw material, cost of production of steel could increase by 15 per cent. A share of this increase in cost would be transferred to downstream industries resulting in a domino effect. There could be a 4 to 5 per cent increase in cost of downstream industries thus affecting their competitiveness.

Basic Materials Putting India on the growth path: Unlocking the mining potential 21
The Mahanadi coal field has acted as catalyst attracting power, steel and aluminium industries in the district. NALCO, JSPL, Bhushan Steel, NTPC and Monnet have large downstream operations in Angul.
Text
Impact of mining activity on economic growth of a district – Angulexample (1/2)
SOURCE: Press search; McKinsey analysis1 Commercially exploited minerals
NTPC Kaniha (1995)Capacity: 3,000 MW thermal power
Jindal India Thermal Power (2014)Capacity: 600 MW thermal power
JSPL (2014)Capacity: 2.5 Mtpa crude steel
Monnet Ispat & Energy (2015)Capacity: 1 Mtpa crude steel
NALCO (1987) Capacity: 345 Ktpa aluminium
960 MW thermal power
TTPS (1967)Capacity: 460 MW thermal power
Bhushan Steel (2010)Capacity: 5.5 Mtpa crude steel
Talcher Coal Field of Mahanadi Coal LimitedProduction (FY 14): 64 MtReserves: 51 billion tonne
Details about Angul
Large industrial units in Angul
State : Odisha
Population : 1,271,703
Literacy rate : 79%
Minerals1 : Coal, Sand and Quartz
Forest area : 42.62% of the total geograp-hical area
22
2006 ▪ NTPC Kaniha added 2000 MW capacity between 2003–2006
▪ NALCO added 115 Ktpa capacity2003
▪ Sree Metaliks commenced 1X12 TPHinduction furnace between 2004–2005
2005
▪ Bhushan Steel started operation 5.5 Mtpa integrated steel plant
2010
▪ JSPL to add 5 Mtpa capacity2016▪ Monnet to set up 1 Mtpa integrated
steel plant
▪ Nalco expansion by 115 Ktpa2015▪ MIEL to commence its pit head thermal
power plant of 1,050 MW capacity
Angul
Odisha
GDP per capitaThousand INR per capita (2005 prices)
2014
▪ Jindal India Thermal Power plant started 600 MW unit Total1,800 MW planned
▪ JSPL has started operation of 2.5 Mtpa integrated steel plant
Impact of mining activity on economic growth of a district – Angulexample (2/2)
6760
5025
28 37
StrugglingAspiringConsumerGlobal
5
813 250
8653
4363
21
0
StrugglingAspiringConsumerGlobal
2025
14 2
2012
5 0
2002
13 2
17.938.5
2002
35.3100.7
2012
221.8
66.4
2025
SOURCE: McKinsey global institute; press search; McKinsey analysis
OrissaAngul
1 Strugglers: Having <INR 180,000 disposable income p.a.; Aspirers: Having INR 180,000–485,000 disposable income p.a.; Consumers: Having INR485,000–1,700,000 disposable income p.a.; Globals: Greater than INR 1,700,000 disposable income p.a. at 2012 prices
2 Not exhaustive
Income distribution1
Per cent
Economic growth (current and expected)Evolution of industry2 in the district
CAGR2002–2012
10%
7%
As a result, Angul has seen a higher economic growth rate compared to Odisha. Angul’s GDP per capita has increased from INR 39,000 to INR 101,000 (10 per cent CAGR) whereas that of Odisha has increased from INR 18,000 to INR 35,000 (7 per cent CAGR). Also , the struggling segment (lowest income group) in Angul has decreased from 67 per cent in 2002 to 25 per cent in 2012 and is expected to be less than 5 per cent by 2025.

Basic Materials Putting India on the growth path: Unlocking the mining potential 23
By 2025, the output from the mining sector could be 1.5 to 2.5 times of the current levels. In the accelerated growth scenario, an additional USD 47 billion could be generated annually compared to the business-as-usual scenario. The mining sector could contribute USD 50 to 80 billion by 2025 to India’s GDP. In an accelerated growth scenario, it could generate an additional USD 31 billion over the business-as-usual scenario.
Potential contribution of mining sector to India’s output and GDP by 2025
50
76 7947
Accelerated growth2
126
70
56
Business as usual1
44
35
2012
28
22
Mining sector contribution to India’s output USD billion
2025
SOURCE: World input output database; IHS economics data; McKinsey analysis
1 Business as usual scenario where lack of decisive reforms would make it unlikely for India to address the gaps in access to social infrastructure. Assuming GDP growth rate of 5.5% and mining growth rate of 3.5% based on historical correlation
2 Accelerated growth scenario where the nation takes steps to stimulate investment, job creation and productivity to dramatically improve delivery of basic services. Assuming GDP growth rate of 7.8% and mining growth rate of 7.3%
Mining sector contribution to India’s GDP value addUSD billion
5133
4931
Accelerated growth2
82
54
28
Business as usual1
34
17
2012
2211
2025
Direct
Indirect

24
Text
Mining and downstream industry could generate considerable revenues for the government
SOURCE: McKinsey bottom-up demand model; McKinsey analysis
DownstreamMining
53
Accelerated growth3
42
11
Business as usual2
39
31
8
2012
18
144
1 Revenue to government includes royalties, taxes and duty on mining and downstream commodities. Mining sector includes coal, iron ore and lime stone. Downstream includes steel, aluminium and cement. Royalty as a percentage of output is considered same in 2025 as in 2012
2 Business as usual scenario where lack of decisive reforms would make it unlikely for India to address the gaps in access to social infrastructure. Assuming GDP growth rate of 5.5% and mining growth rate of 3.5% based on historical correlation
3 Accelerated growth scenario where the nation takes steps to stimulate investment, job creation and productivity to dramatically improve delivery of basic services. Assuming GDP growth rate of 7.8% and mining growth rate of 7.3%
4 USD/INR exchange rate taken as 60
2025Per cent of current revenue receipt4 22% 30%
Revenue to government1
USD billion
In 2012, the mining and downstream industry generated about USD 18 billion in taxes. It could contribute approximately USD 40 to 50 billion as royalties, taxes and duty by 2025. Mining revenues can significantly boost state revenues in mining dominant states such as Chhattisgarh, Jharkhand, Goa and Odisha.

Basic Materials Putting India on the growth path: Unlocking the mining potential 25
Chapter 2
Challenges for India’s mining sector

Basic Materials Putting India on the growth path: Unlocking the mining potential 27
India’s mining sector contribution to GDP is low compared to major mining countries such as China, the United States, Australia, Brazil and Chile. Further, in recent years India’s mining sector has grown at a much slower rate as compared to other mining economies.
Size and growth of India’s mining sector vs other mining economies
SOURCE: IHS economics; McKinsey analysis1 As defined by IHS economics as C10 coal mining and C13–C14 mining of metals and quarrying (excludes oil, natural gas, and atomic minerals)
Mining sector1 value add, 2012Real USD billion (base year 2005)
12
India 14
Chile
Australia
21Brazil
Canada
19
38
United States 66
China 150
Growth of mining sector1 value add 2010–2012CAGR, per cent
China
United States
14.9
5.3
1.4
2.5
Australia
2.0
Canada
1.2
0.8
Chile
Brazil
India

28
India
Contribution of mining sector to India’s GDP over the last decade
3.31.4
1.81.5
1.01.2
2002 2012
0.50.4
20122002
4.34.2
China
Brazil
Australia
United States
Mining contribution to GDP1 in major mining economies over the last decade…Per cent
…versus that of IndiaPer cent
SOURCE: IHS economics; McKinsey analysis1 As defined by IHS economics as C10 coal mining and C13–C14 mining of metals and quarrying (excludes oil, natural gas, and atomic minerals)
Mining sector contribution to India’s GDP has decreased from 1.2 per cent to 1 per cent in the last decade as mining growth rate was slower than GDP growth rate. In contrast, economies such as China, Brazil, Australia and the United States have increased their contribution led by rapid growth of their mining sector.

Basic Materials Putting India on the growth path: Unlocking the mining potential 29
India currently ranks low on both policy potential index and mineral potential, making it unattractive as a mining investment destination. India is ranked 59 out of 96 mining jurisdictions on composite mineral and policy potential.
010
2030
405060
7080
90100
0 10 20 30 40 50 60 70 80 90 100
Policy potential index1
Index 100 = No.1 in all policy aspects
Mineral resource potential2Index
Western Australia
India
VictoriaWashington
California
NevadaNew Brunswick
Nova Scotia
Alberta Finland
Spain
Quebec
Ireland
Venezuela
Panama
HondurasEcuador
Colombia
Chile
BrazilArgentina
Zambia
Tanzania
PeruRSA
Namibia
Mali
DRC
Burkina faso
Botswana
Composite mineral ranking for India
1 Assessment of the attractiveness of mining policies in the jurisdiction and how attractive their policies are from the point of view of an exploration manager 2 Assessment of the current policy environment (i.e., regulations, land use restriction, taxation, political risk and uncertainty) encourages or discourages exploration3 Nevada is representative of United States4 Western Australia is representative of Australia5 Ontario is representative of Canada6 Assuming current regulation and land use restriction
“Unattractive”
“Sweet spot”
Ranking in composite mineral and policy potential (from 96 mining jurisdiction)
46
49
54
72
77
78
79
China
India
Brazil
Chile
Canada5
Australia2
UnitedStates3 3
70
59
43
14
9
5
Ranking of countries across policy potential index and mineral potential6
Rank
Percentage scorePercentage score
SOURCE: Fraser Survey of Mining Companies 2012/13; McKinsey analysis
30
Opportunities to be tapped at different stages of mining
SOURCE: Ciencia Viva (Introduction to mining); High Power Committee report on GSI; GSI modernisation report; McKinsey analysis
ExplorationGeoscience Development Production Reclamation
Defining extent and value of ore
Opening up of ore deposit for production
Large scale production of ore
Search of ore bodies
Restoration of mining site
Definition
▪ Lack of geophysical and geochemical data
▪ Lack of high precision equipment such as gravimeter and total field magnetometer
▪ Low exploration spend
▪ Few companies have planned exploration in India
▪ Unavailability of high-tech equipment for exploration
▪ Delays in processing mining leases and prospecting leases
▪ Environmental and forest clearance processes are lengthy and time consuming
▪ Lack of advanced technology used for mining
▪ Extraction and processing technology for precious minerals such as gold, diamond and platinum group of metal at very nascent stage
▪ Lack of financial guarantee for mine closure
▪ Progressive rehabilitation not undertaken by companies due to inadequate monitoring
Deficiency
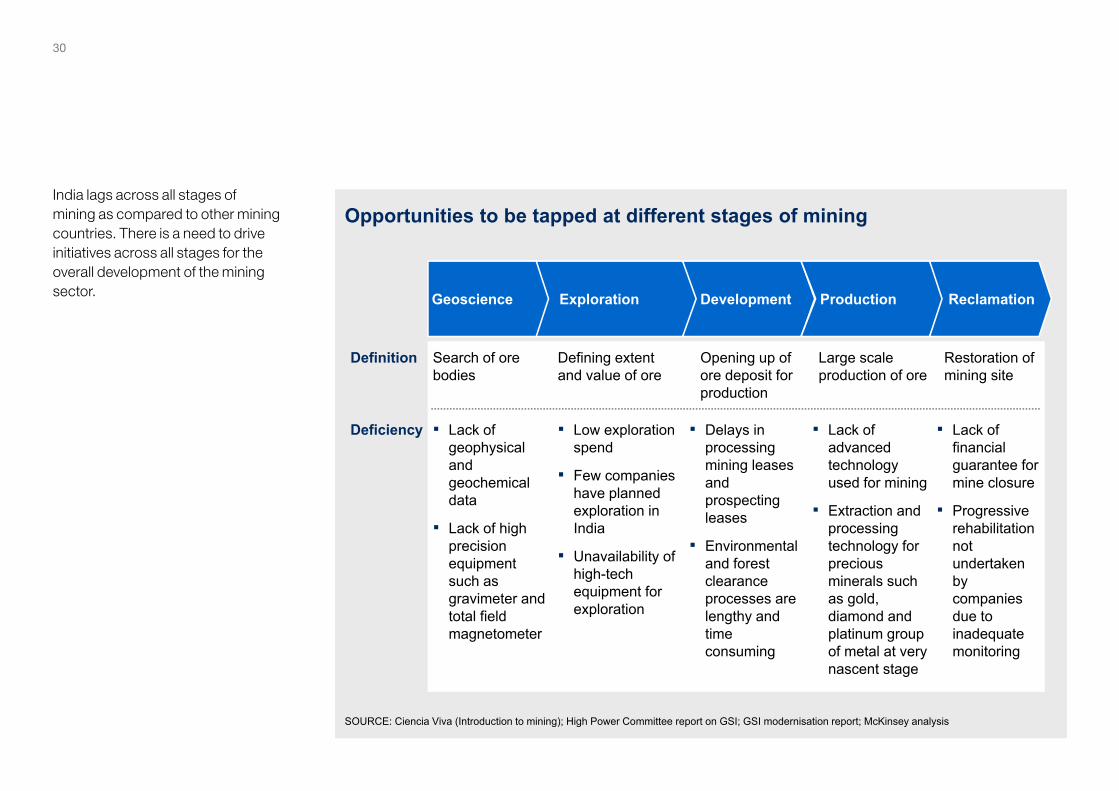
India lags across all stages of mining as compared to other mining countries. There is a need to drive initiatives across all stages for the overall development of the mining sector.

Basic Materials Putting India on the growth path: Unlocking the mining potential 31
Generation of baseline data to promote exploration activity, led by the Geological Survey of India (GSI), is far from being complete. Aeromagnetic survey has covered only 18 per cent of the India’s total area in contrast to 90 per cent of Australia’s total area covered since 1990.
Aeromagnetic mapping comparison for India and Australia
SOURCE: Rio Tinto analysis
Australia Aeromagnetic1 survey since 1990 India Aeromagnetic1 survey since 1990
Country Area (mn km2) Surveys (km2) Coverage (%)
Australia 7.702 6,943,000 90
India 3.273 580,400 18
Data availability
Digital – Available
Hardcopy – Restricted
GSI MultisensorHigh altitude surveysNGRINRSA – 5,000 ft
GSI Multisensor NRSA – 7,000 ft
NRSA – 9,500 ft
BRGM/CGG
Operation hard rock
Flying agency
1 Aeromagnetic survey includes magnetic survey undertaken using low flying helicopter or light aircraft which fly in grid patterns
GEOSCIENCE

32
SOURCE: NSW Mining; web search; interviews
Baseline mapping data comparison between India and Australia
NOT EXHAUSTIVE
Geo-logical1
Geo-physical
Geo-chemical5
India Australia Area Scale Area Scale
Topographic – – 100% N. Australia
1: 250,000,1: 50,000
Mineral Almost all states
1:250,000 –1:5,000,000
100% 1:5,000,000
98% 1:50,000 100%Base 1:500,000
Tectonic 100% 1:7,500,000 100% 1:5,000,000
Magnetic2/ Aeromagnetic3
2%30–40%
1:50,0001:250,000
100% 1:5,000,000
Gravity4 2% 1:50,000 100% 1:5,000,000
Soil sampling/ stream sediment data
4% 1:50,000 91% N.A.
“Seismic data is needed to establish continuing of reserves and is not sufficiently available. We need to hire service companies to do seismic surveys for us”
– Geologists
“A geologist in India is at a significant disadvantage due to lack of data availability as compared to developed countries”
– Geologists
“Geochemical mapping is very useful for rare minerals, gold, diamond and base metals exploration”
– Geologists
1 Geological mapping is the first mineral exploration method undertaken on the ground. It involves visit by a geologist to look at rock outcrops and to observe the location, orientation and characteristics of the rocks or sediments exposed at the surface. The information can be used to prepare a geological map of the exploration area recording the rock types and structures
2 Measures the variations of the earth's magnetic field due to presence of magnetic material3 Aeromagnetic survey includes magnetic survey undertaken using low flying helicopter or light aircraft which fly in grid patterns4 A gravimeter measures the gravity field to determine variation in rock density in the Earth’s crust5 Surveys undertaken to target areas which involves the collection of soil, rock and/or sediments samples
GEOSCIENCEIndia has geological data covering 98 per cent of the country’s total area, at a scale of 1:50,000. However, it lacks geophysical and geochemical data (only 2 to 4 per cent coverage compared to 90 to 100 per cent in Australia). GSI could focus on baseline data generation to encourage exploration activity by both large mining companies and juniors.

Basic Materials Putting India on the growth path: Unlocking the mining potential 33
Traditionally India’s exploration spend has been low compared to other mining economies. India accounts for only 0.4 per cent of the world exploration budget. Further, only 11 companies have planned exploration activity in India. India needs to increase its exploration spend to keep reserve development in line with production.
India’s exploration spend and landscape as compared to global mining economiesExploration budget per square km area, 2013 USD/km2
175167106
192246
ChinaUnited States
CanadaAustraliaChile
1,202
Brazil India
SOURCE: SNL Metals and Mining (Corporate exploration strategy Oct’13); McKinsey analysis
Number of companies with planned exploration
93 115662236566505
6.3 0.434.57.213.313.1
Share of world’s total exploration budget, per cent
EXPLORATION

34
Concerns in environment, forest and mining lease grant in India
Item Key concerns
Mining lease grant3
▪ Limited access to complete and reconciled land records, leads to delay in land identification
▪ Process inefficiency – multiple layers of approval instead of committees, no timelines defined for each step of the process
Environment clearance2
▪ High number of queries raised (poor quality EIA)
▪ Difficulty in scheduling public hearings
▪ Obtaining certificates from multiple government bodies
Forest clearance1
▪ Ambiguity in definition of forest land
▪ Limited access to complete and reconciled land records data
▪ Absence of land banks for compensatory afforestation
▪ Process inefficiencies e.g., large number of queries, sequential approvals, limited monitoring on pending files, etc.
DEVELOPMENT
SOURCE: McKinsey analysis
EC/FC process takes a longer time due to process inefficiencies and ambiguous land records. Additionally, companies need multiple approvals from various state agencies, which are delayed in the absence of defined timelines.

Basic Materials Putting India on the growth path: Unlocking the mining potential 35
At present, it takes five years or more to obtain mining lease/prospecting lease permit in India. This is much longer than the processing time in other mining geographies, for e.g., it takes less than two months in Canada and Australia. Long processing times may discourage applications for new rights. Most countries have been reducing their processing times with a targets of less than 3 months as their processing period.
SOURCE: INGEMMET; Sernageomin; KommerSAt; RenCap; Codelco; press; Peru Energy Ministry.com; SIMCO-UPME, Mining Weekly; Botswana Department of Mines; Government of India Ministry of Mines; Australian Government; BC Ministry of Energy; BC MPR; Journal of Energy and Natural Resources Law
48
12
7
2
1
Russia
India
Chile
Brazil
Australia <2
Canada
India’s mining rights processing time compared to other mining countries
▪ >75% of small licences within 13 days, balance within 20 days
▪ Large mines typically 30 days
▪ Current aim is 12 months, still far from promised months
▪ Introduced fixed timelines for processing of applications
▪ More than 90% greater than 1 year, can take 5+ years▪ Electronic platform launched to speed up process
▪ Reduced from 4 years in 1999 to 60 days▪ Introduced online system for applications
Time to process rightsMonths Unique qualities
DEVELOPMENT

36
Financial guarantee for mine closure across mining jurisdictions
SOURCE: Department of Minerals & Petroleum; Ministry of Natural Resources; IBM
RECLAMATIONMINE CLOSURE
Western AustraliaIndia
Quebec, Canada
Regulations
▪ Mine closure plan made mandatory through a 2003 amendment in MCDR 1988 and MCR 1960
▪ Mine closure made mandatory through amendment in mining act, 1978 and mines safety and inspection regulations, 1995
▪ Mine closure included in Mining Act, 1979
Guidelines/ policy for mine closure
▪ Guidelines are issued by IBM
▪ At least 3 set of comprehensive guidelines available for reference
▪ Guidelines issued by Ministry of Natural Resource
Financial guarantee
▪ For A category mines – INR 25,000/ha
▪ For B category – INR15,000/ha
▪ 25% of the cost of mine closure has to be furnished
▪ 70% of the cost of mine closure has to be furnished
Monitoring and Audit
▪ Monitoring is done by IBM, plan is reviewed every 5 years
▪ Monitoring is done by DMP; plan is reviewed every 3 years
▪ Monitoring is done by mine site rehabilitation depart-ment in Ministry of Natural Resource, plan reviewed every 5 years
Key Issues
▪ Financial guarantee is very low and does not serve as a deterrent to default on commitment made in closure plan
▪ Rigorous and regular checks are not conducted by IBM due to manpower shortage
▪ Progressive rehabilitation not undertaken by companies due to inadequate monitoring
Mine closure is a critical area for sustainable development and needs to be enforced through regulatory measures. Currently, the financial guarantee for mine closure is very low in India and does not sufficiently deter defaulters. Western Australia and Canada require companies to pay a large percentage of the mine closure cost (70 per cent in Western Australia) upfront as financial security.

Basic Materials Putting India on the growth path: Unlocking the mining potential 37

Chapter 3
Initiatives to revive India’s mining sector

Basic Materials Putting India on the growth path: Unlocking the mining potential 39
India has large mineral reserves and the mining sector can play a crucial role in holistic development of the country. For this, both the central and state governments need to make way for the industry to flourish. The industry too should keep in mind the development of all stakeholders. The 10 core initiatives could put the mining sector on an accelerated growth trajectory.
Key initiatives that could be considered to boost the Indian mining sector
SOURCE: McKinsey analysis
1 Accelerate commercial mining in coal and ramp up coal production from existing coal blocks
7 Proactively address the mining skilled labour gap
2 Implement a progressive resource allotment process using a transparent and competitive mechanism
Attract juniors to significantly ramp up exploration activity6
3 Create an integrated single window clearance process
Develop the necessary logistics infrastructure5
10 Companies need to invest in new capabilities to ensure the license to operate
4 Review the land acquisition act to facilitate faster project execution
9 Companies need to manage sustainability pro-actively – specifically environment and scientific mining. Critical to ensure all rules and regulations are followed
8 Implement a progressive mining legislation and ensure stability in laws and guidelines for the industry

40
Commercial mining as a solution to reduce coal supply gap
SOURCE: RMG; China Coal Industry Yearbook; press search; McKinsey analysis
Major operational and fiscal challenges faced due to less competition in the industry
1
Challenges Solutions
▪ India lacks advance technology
▪ Commercial miners may bring in up-to-date technology and expertise in the field of mining
▪ Competition in coal mining may ensure the investment required to boost coal production
▪ A lack of competition inhibits private and foreign investment
▪ Consider development of private rail tracks to connect mines to major railway corridors and also leveraging sea route
▪ Logistical difficulties are a bottleneck in increasing mine production
Competitiveness in coal industry across countries
9India
South Africa 15
Indonesia 18
Russia 67
USA 108
China ~5,000 13% 20%
21% 46%
13% 20%
27% 56%
17% 50%
81% 94%
Production share ofTop producer
Top three producers
The Indian coal industry lacks competitiveness with Coal India accounting for more than 80 per cent of domestic production. Historical coal production growth rate has been ~2 to 3 per cent. The country needs a growth rate of 7 to 8 per cent to meet future demand. Private and commercial miners could bring in more investment and advanced technology, essential for rapid growth of India’s coal mining industry.

Basic Materials Putting India on the growth path: Unlocking the mining potential 41
Most of the mining jurisdictions have adopted first-come first-serve (FCFS) methodology for allotting bulk mineral resources. India’s context is unique and there is a need to adopt some of the global best practices in the long term.
Allotment methodology and transferability for major mining economies
SOURCE: "Allocation methodology for Coal" CII; McKinsey analysis
Exploration rights(Exclusive FCFS/non-exclusive FCFS/action)
Transferability(Automatic/ Conditional
Mining rights(FCFS/auction)
Exclusive FCFS Automatic Auction
Auction Conditional Auction
Exclusive FCFS Automatic FCFS
Non-exclusive FCFS Automatic FCFS
Exclusive FCFS Automatic FCFS
Exclusive FCFS Automatic FCFS
Exclusive FCFSAuction (Coal) Automatic FCFS
Exclusive FCFS(auction if >2 bidders)
Conditional Auction
2
Western United States
China
Quebec, Canada
Western Australia
Brazil
Chile
Queensland, Australia
Russia

42
Recommendations for resource allotment in India
SOURCE: "Allocation methodology for Coal" CII
COAL ILLUSTRATION
Known mineralisation
▪ May use revenue share bid to allot mining leases with the right to sell the coal to multiple players
▪ In case of end-use coal projects of critical national importance, bid parameter could be linked to the value of end product
Unknown mineralisation
▪ For partially explored block, one may carry out exploration to estimate mineral content. After establishing the extent of mineralisation, the allotment process would follow the approach for known mineralisedblocks
▪ Non-exclusive first come first serve (FCFS) with security of tenement and pre-defined right of sale could be the preferred option to allot blocks for exploration
▪ In case of multiple players expressing interest for partially mineralisedor non-mineralised block, allotment could be based on a composite bid of minimum work programme (exploration work undertaken) and revenue share with the option to return the data and block in case it is found to be uneconomic, post completion of exploration
Recommendations
2The country’s natural resources should be alloted with the aim to maximise their value to the population of the country. India needs a differential treatment from other mining jurisdictions because of its unique context – existence of known and partially known mineralised areas and supply demand imbalance. Some of the possible methodology for allotment of resources have been described.

Basic Materials Putting India on the growth path: Unlocking the mining potential 43
In Australia, it takes about one year to get environment and forest approvals for mining activities, much lesser as compared to India. The Department of State Development (DSD) in Australia is responsible for monitoring the clearance process, debottlenecking issues and ensuring timely approvals. India could implement a similar single window clearance process to streamline environmental clearance and forest clearance.
Process and time for environment and forest approvals: Australia example
1 DMP: Department of Mining and Petroleum2 DEC: Department of Environment and Conservation3 DOW: Department of Water; EPA: Environment Protection Agency
Application of mining tenement is approved
Application of mining proposal to DMP1
Miner
Refer to EPA for examination through part IV
DMP1
Does it require EPA approval?
Does it require DEC2, DOW3
approval?
Refer to DEC and DOW for examination
Does it meet DEC, DOW
requirement?
Does it meet EPA requirement?
Does it meet DMP requirement?
No
Yes
Yes
No
Yes
No
Yes
No
Yes
No
Apply for perfor-mance bond to DMP
Miner
Does it meet 'bond' guidelines?
Accept the bondDMP
'Fit' for mining activities
Miner takes it through 'internal' approval process
No
Yes
Pro
vide
app
rova
l for
min
ing
prop
osal
Ret
urne
d to
're
-sub
mit'
bond
app
licat
ion
Refer back to miner for revised proposal
This whole process is monitored by DSD(Department of State Development), whose KPIs are:▪ Monitor timelines at
each stage ▪ Debottleneck any
issues▪ Ensure that
approval comes in the prescribed time
Total time for approval to
come = 1 year
Stat
e au
thor
ities
Environment and forest approval process for mining activities in Australia
3
SOURCE: McKinsey analysis

44
New land act has increased cost and time for land acquisition by many folds
SOURCE: IIFL; McKinsey analysis
2013 land acquisition bill – Key features
▪ Pre-condition for land acquisition: 80% and 70% consent for private companies and public private partnership respectively
▪ Compensation policy: 4x the market value in rural areas and 2x the market value in urban areas
▪ Rehabilitation & resettlement rules: Compensation for families affected by land acquisition
▪ Retrospective clause: Applies to cases where no land acquisition award made and to those land acquired up to 5 years prior
▪ Definition of market value:Guidelines given for market value of acquired land
▪ Lease option: Companies can lease land instead of purchasing it but the decision is that of the state rather than the land owner
Enabler and constraints
Enablers▪ Ensures equity and fair
dealing with farmers▪ Clear guidelines of the
process of acquiring land and rules for compensation package
Constraints▪ Protracted procedures
leading to delays▪ Consent of 80% of affected
families may result in lengthy and complex process
Recommendations
▪ Reconsider pre-condition on percentage consent required for land acquisition
▪ Could simplify the process of land acquisition to facilitate timely project execution
4Land acquisition is a major issue faced by mining companies and the current land act has resulted in increased land costs and lengthier processes. The land acquisition bill should be reviewed at to streamline the land acquisition process without compromising fairness to affected families.

Basic Materials Putting India on the growth path: Unlocking the mining potential 45
India needs to expand its logistics infrastructure for major steel, iron ore and coking coal routes. This includes building two DFC corridors (Kolkata-Mumbai, Delhi-Kolkata), capacity expansion along high-volume routes (e.g., Goa-Chennai) and capacity expansion at major ports to facilitate transport through the sea route.
Logistics infrastructure for major steel, iron ore and coking coal flows need to be expanded
MANIPUR
BHUTAN
BANGLADESH
WEST BENGAL
DURGAPUR
BURNPURBIHAR
BOKARO
NEPAL
JAGDISHPUR
UTTAR PRADESH
MADHYA PRADESH
HIMACHALPRADESH
JAMMU & KASHMIR
DELHI
PUNJAB
RAJASTHAN
JAMSHEDPUR
HaldiaCalcutta
Visakhapatnam
Paradip
VISAKHAPATNAM
Vizianagaram
ORISSA
BHILAIROURKELA
ANDHRA PRADESH
Chennai
MAHARASHTRA
HAZIRA
KARNATAKA
Mumagoa
New MangalorePanambur
DADRA &NAGA HAVELI
Bailadila
Bellary/Hospet
Kudremukh
Donimalai
Dharma
Steel plants
Major iron ore deposit
Major rail route
Port
Major iron ore zone
ARUNACHALPRADESH
ASSAM
Major corridors for steel and iron ore
STEEL EXAMPLE5
SOURCE: McKinsey analysis
MEGHALAYA
HARYANA
TAMIL NADU
GUJARAT
Goa
Mumbai

46
Key infrastructure to be developed across rail, road and sea to facilitate coal and iron ore transport
ARUNACHALPRADESH
ASSAM
BHUTAN
WEST BENGAL
UTTAR PRADESH
HIMACHALPRADESH
HARYANA
DELHI
Visakhapatnam
ORISSA
TAMIL NADU
Chennai
KARNATAKA
Mumagoa
New Mangalore
Panambur
Calcutta
Haldia
Major rail route
Power plantsMajor iron ore deposit
Sea route
Major mining rail corridor for coal
Port
Major coal bearing area
Bailadila
Kudremukh
5
SOURCE: McKinsey analysis
JAMMU & KASHMIR
RAJASTHAN
MANIPUR
MEGHALAYA
BANGLADESH
NEPAL
BIHAR
GUJARAT
ToriShivpur
Kathautia
Jhasuguda
BarpalliParadipDharma
ANDHRAPRADESH
Mumbai
PUNJAB
MAHARASHTRA
MADHYA PRADESH
Bellary/HospetDonimalai
Goa
To debottleneck coal production at major CIL mines, three mine rail corridors (viz. Tori-Shivpur-Kathuria, Jharsuguda-Barpali and East-West corridor) need to constructed. To facilitate coal transport through the sea route to costal demand regions, it is necessary to expand capacity at major sea ports.

Basic Materials Putting India on the growth path: Unlocking the mining potential 47
China has been using the sea route for transporting of coal from supply to demand centres. Similar transport mechanism in India could decrease the cost of transportation and overcome railway capacity constraints.
Domestically fulfilledthrough seabornetransport
Domestically fulfilled through land-basedtransport
1,070
Seaborne Imports
2012
180
220
670
SOURCE: McKinsey thermal coal demand and supply model; China customs; McKinsey analysis
Thermal coal tradeflow, 2012 Million tonne Million tonne
Coastal states’ demand of coal
65
97
67030
27
Global example – China uses shipping at scale to transport coal from supply to demand centres
5
48
Mining labour demand to meet requirement of the mining industry
1 Assuming that total working life of an employee is 32 years, 50% of the workforce will retire after 16 yearsSOURCE: CII Report on Human Capital; web search; McKinsey analysis
2448 56–7680–100
300350–475
150
500–625
600300
Incremental requirement 2025
700–1000
Retirements1
2009–25Current workforce 2009
Totalrequirement 2025
1,000–1250
612
Retirements1
2009–25IncrementalDemand 2009–25
14–19
Currentworkforce2009
Total Requirement2025
20–25
Mining engineers
Mining demand/supply of labour (2009–2025)‘000s
Specialised skills- geologists/geo-physicists
Diploma holders and other statutory certificates holders
Skilled & semi skilled labour
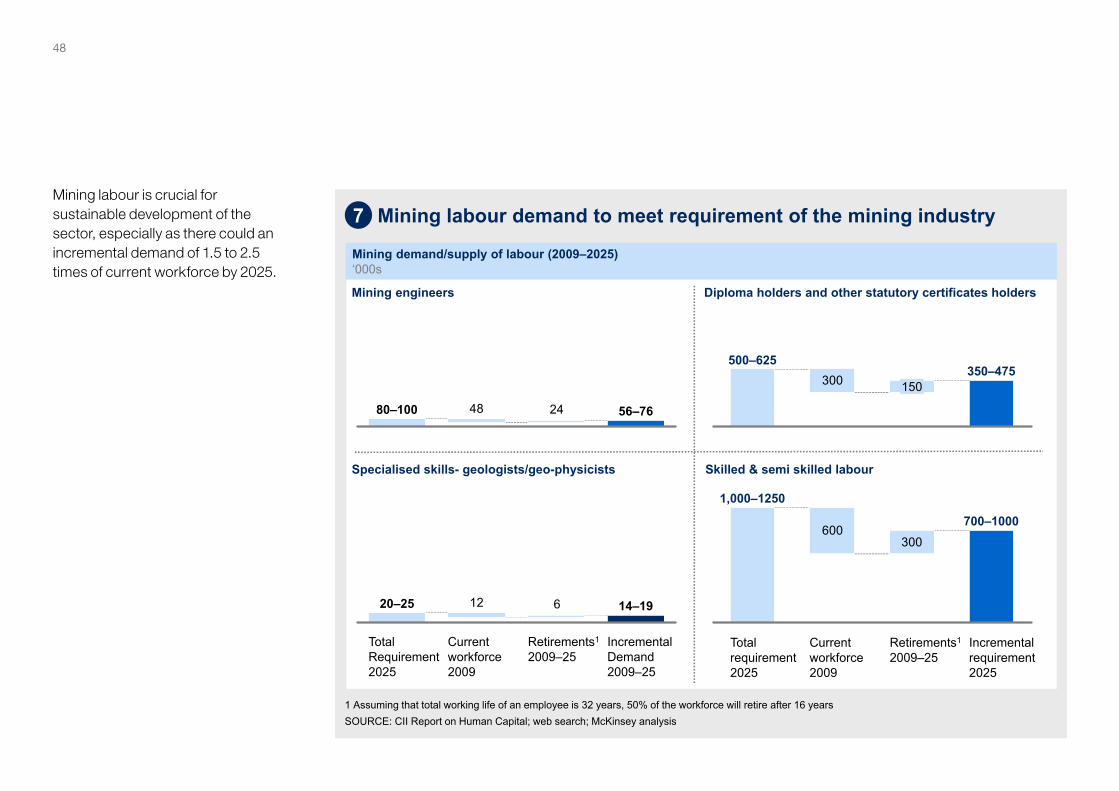
7Mining labour is crucial for sustainable development of the sector, especially as there could an incremental demand of 1.5 to 2.5 times of current workforce by 2025.

Basic Materials Putting India on the growth path: Unlocking the mining potential 49
To bridge the impending shortage of human capital in mining, the Ministry could work with the HRD Ministry to increase the number of seats in mining engineering in relevant institutes over the next 10 to 15 years, including short-term mining-specific courses for delivery through ITIs in the six major mining states. The government could also facilitate private sector participation in skill development for the mining sector by prioritising it in the NSDC charter.
Actions to curb supply gap of mining labour
Mining engineers
▪ Increase the numbers of seats in institutes offering mining engineering like Indian Institute of Technology (IITs), ISM (Indian School of Mines) Dhanbad, National Institute of Technology (NITs), Orissa School of Mines, etc. by 1,200–1,500– Seats to be increased in a staggered manner with 400–500 additional seats by 2015,
800–1,000 seats by 2020 and 1,200–1,500 by 2025▪ Introduce ~2,000–2,500 additional mining engineering seats in 20–25 other IITs and NITs
e.g., NIT Bhopal, NIT Warangal, NIT Jaipur (currently only 3 NIT’s and 2 IIT’s have mining engineering course)– Introduce seats in a phased manner with 700–800 new seats by 2015, 1,400–1,600 by
2020 and 2,000–2,500 by 2025▪ Facilitate tie-ups between top universities in India (ISM, IITs) and major mining companies
in India and abroad to set up centres of excellence in mining engineering
Specialised skills-geologists/ geophysics
▪ Increase the number of seats in ISM, IITs and other major institutes offering geology/geophysics courses by ~150
▪ Tie up with leading universities in Australia offering geology/geophysics courses – Australia National University, University of Melbourne, Curtin University, etc. to revamp curriculum
Diploma holders ▪ Include short-term mining specific courses like – HEMM operators, surveyor, training for
drillers, etc. for delivery through ITIs located in the mining centres▪ Set up ITIs in tier 3 & 4 cities in mining centres of Orissa, Jharkhand and Chhattisgarh
Skilled and semi skilled workforce
▪ Include mining as a priority sector in the NSDC charter to facilitate private participation in skill development for mining sector
7
SOURCE: McKinsey analysis

50
SOURCE: McKinsey economic development assessment tool; McKinsey global institute analysis
External stakeholder management is the key to success of mining companies
Socio-economicDevelop-
ment
12
3
45
Fiscal contribu-
tion
Job creation and skill building
Infra-structure
investment
Social and community
benefits
Environ-mental
preservation
Stakeholders & communication
10
The degree to which the company meets national tax, royalty, and equity obligations in a transparent manner and seeks to prevent corruption
The degree to which the company contributes to local communities through health, education, safety, site rehabilitation, and economic sustainability
The degree to which the company attempts to create broader societal benefits from its infrastructure investment in roads, power, water, and other areas
The degree to which the company contributes to its own workforce development, supply-chain development, resource beneficiation, and labour market “job matching”/vocational education
The degree to which the company understands stakeholder concerns, tracks its impact against those concerns, communicates effectively with stakeholders, and seeks to create an aligned vision
The degree to which the company seeks to minimiseassociated air, land, and water pollution and to reduce waste and preserve biodiversity
Mining companies need to address concerns of all stakeholders to create a conducive environment for the industry to flourish.
Basic Materials Putting India on the growth path: Unlocking the mining potential 51
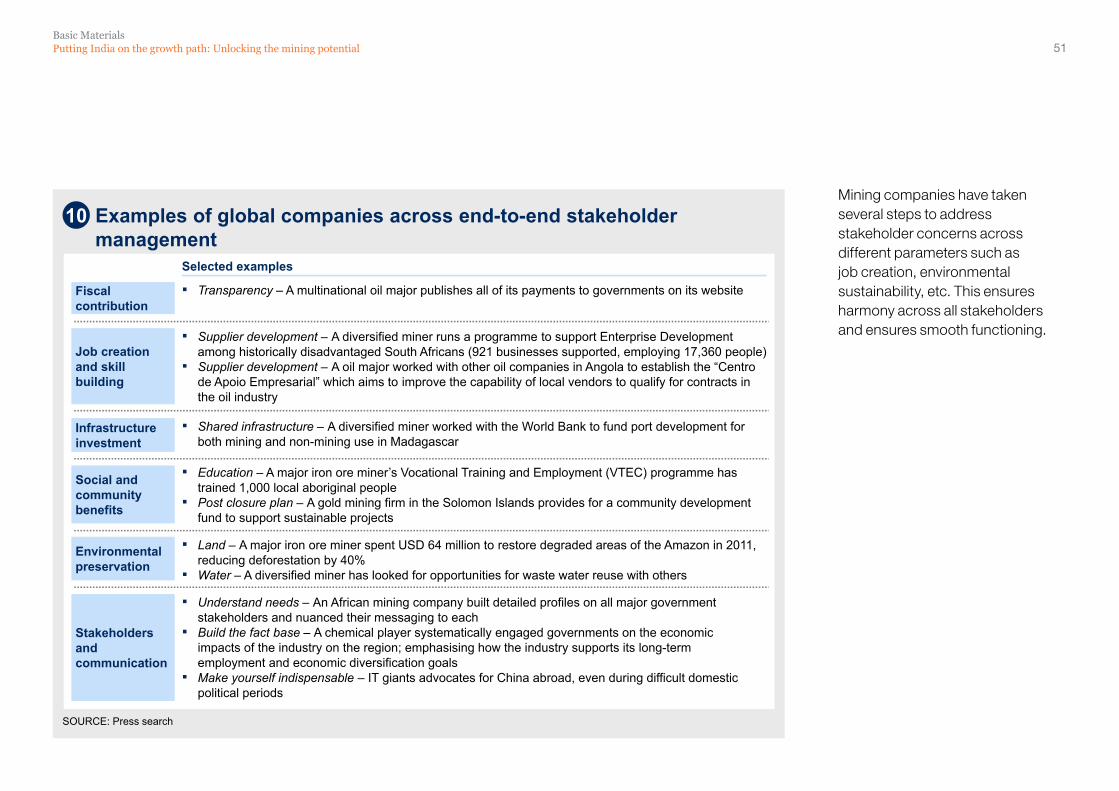
Mining companies have taken several steps to address stakeholder concerns across different parameters such as job creation, environmental sustainability, etc. This ensures harmony across all stakeholders and ensures smooth functioning.
Examples of global companies across end-to-end stakeholder management
Selected examples
Stakeholders and communication
▪ Understand needs – An African mining company built detailed profiles on all major government stakeholders and nuanced their messaging to each
▪ Build the fact base – A chemical player systematically engaged governments on the economic impacts of the industry on the region; emphasising how the industry supports its long-term employment and economic diversification goals
▪ Make yourself indispensable – IT giants advocates for China abroad, even during difficult domestic political periods
Social and community benefits
▪ Education – A major iron ore miner’s Vocational Training and Employment (VTEC) programme has trained 1,000 local aboriginal people
▪ Post closure plan – A gold mining firm in the Solomon Islands provides for a community development fund to support sustainable projects
Environmental preservation
▪ Land – A major iron ore miner spent USD 64 million to restore degraded areas of the Amazon in 2011, reducing deforestation by 40%
▪ Water – A diversified miner has looked for opportunities for waste water reuse with others
Infrastructure investment
▪ Shared infrastructure – A diversified miner worked with the World Bank to fund port development for both mining and non-mining use in Madagascar
Job creation and skill building
▪ Supplier development – A diversified miner runs a programme to support Enterprise Development among historically disadvantaged South Africans (921 businesses supported, employing 17,360 people)
▪ Supplier development – A oil major worked with other oil companies in Angola to establish the “Centro de Apoio Empresarial” which aims to improve the capability of local vendors to qualify for contracts in the oil industry
Fiscal contribution
▪ Transparency – A multinational oil major publishes all of its payments to governments on its website
SOURCE: Press search
10

52
Stakeholder concern and company’s priorities
SOURCE: Survey of 22 mining executives, July 2013; McKinsey global institute analysis
Percentage of answers (n = 22)
0
6
23
24
46
Environmental impact
Social and communityinvestment
Infrastructure investment
Job creation and skill building
Fiscal contribution
13
9
7
41
31
10
“What do governments consider most important?”
“What do you think your company does best?”
Mining companies have to make the effort to understand stakeholder concerns, especially for the local population, and align and prioritise their stakeholder management programmes accordingly. Employment is the most important concern that companies need to address to maintain stakeholder confidence.

Basic Materials Putting India on the growth path: Unlocking the mining potential 53

54
Core leadership of Basic Materials practice in McKinsey India
Shirish Sankhe
Director
Rajat Gupta
Director
Vipul Tuli
Director
Ashish Tuteja
Principal
Suvojoy Sengupta
Principal
Abhijit Kulkarni
Associate Principal
Ankit Gupta
Associate Principal
Karan Jain
Associate Principal
Kunwar Singh
Associate Principal
Navtez Bal
Principal
Anupam Agarwal
Associate Principal


Basic MaterialsDecember 2014 Design by Visual Aids India Copyright © McKinsey & Company www.mckinsey.com