Embed Size (px)
Citation preview
© 2015 The O Alliance Consulting, LLCOther companies, products and service names may be trademarks or service marks of others.
Putting Data to Work to CreateSeamless Circular CommerceUnique Decision Science ToolsMaster Accurate, Personalized Predictions

The O Alliance is a new consulting model that leverages a network of transformational practitioners
with expertise in all of the critical areas that will unlock value and empower a retailer ― digital/technology, operations, change management, marketing and talent. Designed to align a
retailer’s organizational practices with today’s digitally savvy consumer, The O Alliance’s holistic
approach delivers customer focused strategy and solution driven execution that creates a circular
shopping ecosystem.
For more information visit www.theoallianceconsulting.com
About The O Alliance
P. 01The O Alliance: Putting Data to Work to Create Seamless Circular Commerce
Putting Data to Work to Create Seamless Circular Commerce
Unique Decision Science Tools
Master Accurate, Personalized Predictions
How can retailers transform Big Data into uber-relevant o�ers that make a customer’s purchase
activities highly predictable and increasingly profitable? It’s not by focusing on which channel initiated
the shopping journey: Rather, today´s mobile-enabled customers’ unique tastes, influencers, likely
behaviors and other personal and predictable factors ― not their bricks or clicks starting point ― must
be at the heart of all customer-centric retailing.
While many continue to wrestle with managing Big Data, channel integration and how to translate
channel activities into transactions, other more enlightened retailers have advanced to true
customer-centric models. These retailers continually gain knowledge about customers’ preferences
and behaviors; then use decision-science tools, many developed for the financial services, travel and
hospitality industries, to distill Big Data into bite-sized slices, producing accurate retail predictions. Their
customer-centered retail strategy provides clear-cut scientific answers to their once-perplexing
business questions. It produces highly relevant and personalized o�ers that drive customer
relationships, not just transactions ― all critical to transforming the commerce ecosystem to maximize
long-term enterprise value.
Imagine being able to calculate what customers are likely to buy before they even inquire! Or to
recommend products (including size, color, style and season) personalized for a customer’s upcoming
vacation, business trip, favorite music venue or birthday shopping spree. Imagine the ability to draw on
hours-new consumer data ― gathered across myriad customer-facing touch points ― that is
condensed, then dissected to correctly segment, predict, localize, personalize, merchandise, pre-order,
stock, cross-sell, up-sell and much more…..all without human intervention.
P. 02The O Alliance: Putting Data to Work to Create Seamless Circular Commerce
P. 03The O Alliance: Putting Data to Work to Create Seamless Circular Commerce
This is not an omnichannel approach! In fact, it replaces omnichannel. This new approach is about
learning to use “data currency” and condensing massive amounts of data into commerce creators
across the entire retail ecosystem; all with the customer at the core ― versus the channel.
We all know that customers interface with retailers through multiple venues. Only by learning to predict
and anticipate customer preferences can retailers hope to compete at the speed of their more agile
e-commerce competitors.
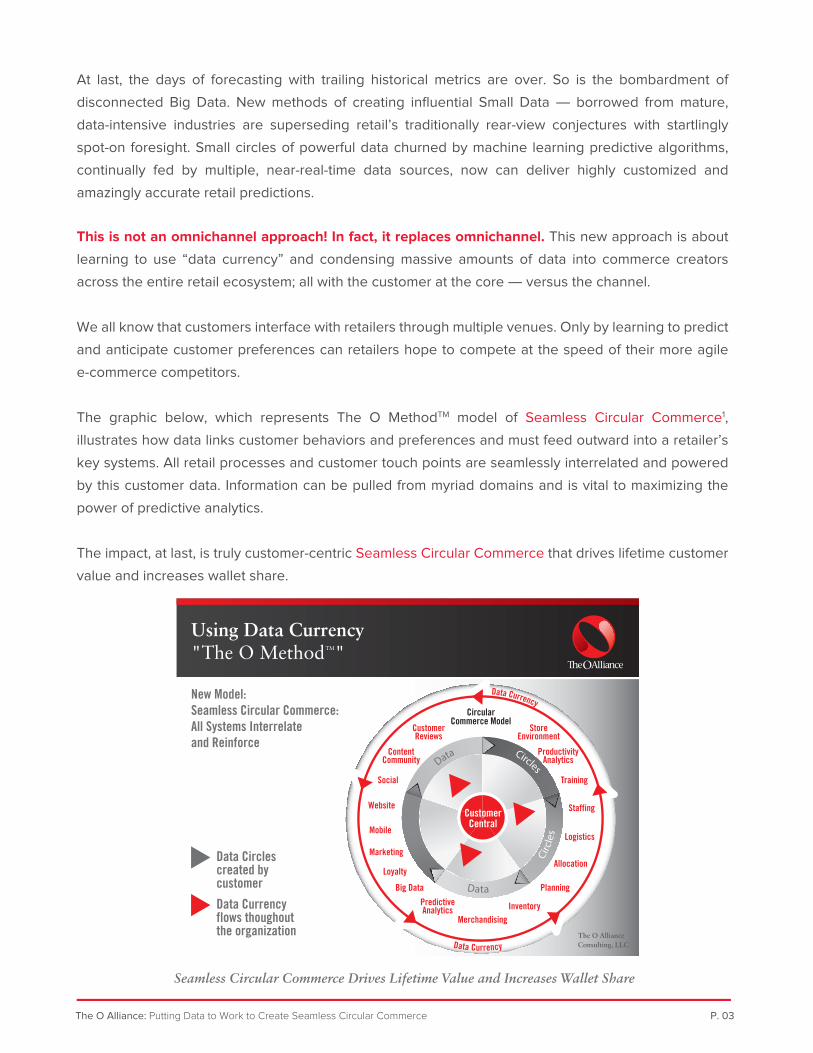
The graphic below, which represents The O MethodTM model of Seamless Circular Commerce1,
illustrates how data links customer behaviors and preferences and must feed outward into a retailer’s
key systems. All retail processes and customer touch points are seamlessly interrelated and powered
by this customer data. Information can be pulled from myriad domains and is vital to maximizing the
power of predictive analytics.
The impact, at last, is truly customer-centric Seamless Circular Commerce that drives lifetime customer
value and increases wallet share.
At last, the days of forecasting with trailing historical metrics are over. So is the bombardment of
disconnected Big Data. New methods of creating influential Small Data ― borrowed from mature,
data-intensive industries are superseding retail’s traditionally rear-view conjectures with startlingly
spot-on foresight. Small circles of powerful data churned by machine learning predictive algorithms,
continually fed by multiple, near-real-time data sources, now can deliver highly customized and
amazingly accurate retail predictions.
Seamless Circular Commerce Drives Lifetime Value and Increases Wallet Share
New Model:Seamless Circular Commerce:All Systems Interrelateand Reinforce
The O AllianceConsulting, LLC
Data Circlescreated by customer
Using Data Currency"The O MethodTM"
Data Currency
Data Currency
CircularCommerce Model
StoreEnvironment
ProductivityAnalytics
Social
Website
Mobile
Loyalty
PredictiveAnalytics Inventory
Planning
Allocation
Staffing
Logistics
Big Data
Merchandising
ContentCommunity
Marketing
Training
CustomerReviews
CustomerCentral
Circles
Data
CirclesData
Data Currencyflows thoughoutthe organization
It seems like science fiction, but it’s not. For years complex analytic models within the data-intensive
financial, hospitality, telecom and travel trades have condensed Big Data into smaller fractions to
accurately deliver consumer predictions and increase profitability.
The fundamental principle of these models is the same across all industries. That is to:
1. Combine massive amounts of timely external data with proprietary internal data
2. Streamline that data into small circles targeted to specific business goals
3. Scientifically improve the outcome of those goals.
Just as Amazon’s remarkable prediction models ― interestingly not derived from the retail arena ―
have cracked the code on predictive data extrapolation, similar science-based analytic engines can do
the same for you. Retailers in other countries already are fast-tracking onto the Autobahn of predictive,
profitable analytics.
Within just weeks, not months, U.S. retailers of any size, in any segment, can consult intuitive visual
dashboards to quickly and precisely answer questions such as:
• How much should I ship from the DC to store to satisfy demand for Product X during
next week’s storm in the North Eastern region?
• Which shirt and color is she buying right now? Which of these items purchased by
others who also bought this shirt and color, is she likely to buy?
• His favorite country music band is coming to town. If we email personalized o�ers for
country clothing and CDs, which o�ers might he accept?
• At what point, will a great deal attract her, regardless of price?
• Which friend does she trust most to recommend movies, restaurants, clothing styles and more?
• What is my peak sales time and how much workforce/inventory is required for that period?
• How much of my sales are a function of my Facebook Fan base, and what actions likely
would increase those sales?
• How is seasonality a�ecting my business?
Resolving questions like these makes a huge di�erence especially for brick-and-mortar retailers, many
still struggling to overcome the challenge of digital shopping.
Futuristic Fantasy? Guess Again!
P. 04The O Alliance: Putting Data to Work to Create Seamless Circular Commerce
“Predictive algorithms will become more and more part of our life, and will probably change our society more than the Internet has…Predictions based on our data trails aims even farther because they enable us to forecast human behavior in a way we never could before.”
Lutz Finger, a Quantum physicist and LinkedIn director
Small Data, especially in predictive analytics, is now making
enormous impact. In fact, small, qualitative data sources “can
provide that next level of insights necessary to take predictive
models to the next level of accuracy and actionability,” stated
William Schmarzo, an information and analytics strategist for
EMC Consulting3. “Leading Big Data organizations are quickly
learning that investing the time and e�ort to capture the
‘Small Data’ about customers, products and operations can
yield even more beneficial and actionable insights.”
Lutz Finger, a Quantum physicist and LinkedIn director,
recently made this prediction4 about data products: “Predictive
algorithms will become more and more part of our life, and will
probably change our society more than the Internet has. The
Internet enabled us to do things faster and more conveniently.
However, predictions based on our data trails aims even
farther because they enable us to forecast human behavior in
a way we never could before.”
Predictive Analytics: Small Data is BIG!
P. 05The O Alliance: Putting Data to Work to Create Seamless Circular Commerce
The Brick and Mortar Imperative
The sheer efficiency of e-commerce continues to create tremendous challenges for the physical store. In the U.S., within just six years, online sales will more than double to an estimated $491.5 billion by 2018, according to eMarketer2. But shopping in the brick-and-mortar segment has remained relatively unchanged, accentuated by underinvestment in training, store information systems and data insights. Furthermore, most specialty brick-and-mortar merchants virtually have no view of the ancillary products their customers are buying ― even as consumers leave footprints all over the data universe.
Today, brick-and-mortar retailers have a huge opportunity to marry the soaring trajectory of external consumer data with proprietary records to predict a customer’s purchase. Retailers need only to grab, condense and scientifically analyze available data to accurately predict measures more likely to close a sale. In addition, this available data can help implement more effective proactive marketing campaigns, personalization, improved merchandising, pricing decisions, promotions and other measures.
Predictive analytics allows a retailer to utilize data to accurately predict what customers want; then take the proactive steps necessary to produce a positive outcome. Today’s technology makes this goal actionable virtually in real-time. Steps can include personalized offers, store-ready inventory, right-pricing, streamlined resource allocation and other predictive retail responses.
The process of making sense of data “should consist of making the data smaller and smaller,”
according to an August 2014 article posted5 by Giselle Abramovich, a senior and strategic editor for
CMO.com. While the answer to a CMO’s specific business problem must be driven out of several
thousand data points, “what the CMO wants is a small answer,” wrote Abramovich. “So Big Data must
get smaller.” Therefore, the article stated, the Big Data movement should “cut down the noise and
make data smaller, so that it is a digestible, small piece of information that can be used.”
Jamie Tedford is founder and CEO of Brand Networks, a provider of data-driven marketing solutions.
“Big Data is reaching the peak of its buzz,” wrote Tedford, in a March 2014 news piece6. “Small Data, in
essence, recognizes the value of fewer, more relevant data points. The value of data shouldn't depend
2.5 EXABYTES OF DATA GENERATED DAILY“Every day our digital lives — whether social networks, mobile activity, the internet or purchase transac-
tions — we generate over 2.5 exabytes of data,” reported Gina Boswell, an EVP for Unilever, in a July 2014 article posted on the Yale School of Management “Insights” website8. “That’s 50 million filing cabinets. Or
a library of MP3s that would take 5 million years to play.”
P. 06The O Alliance: Putting Data to Work to Create Seamless Circular Commerce
Crayon Data9 is a big data company singularly focused on simplifying customer choice.
The company combines an immense repository of consumer taste data with retailers’ transactional
data, then uses sophisticated proprietary algorithms to draw an otherwise unseen view of a customer.
The resulting impact ― already proven in various sectors worldwide ― is a unique prediction of the few
cross-category items customers are most likely to buy. This information can be leveraged in online
advertising or email campaigns and to drive transactions in stores.
“Consumer research has shown that when provided with just four to six recommendations, people are
more likely to make a transactional choice, feel more confident in their decisions and stay happier with
those choices,” stated Srikant Sastri, Co-founder of Crayon Data. “We provide these individualized,
simpler choices using a scientific algorithm that deconstructs taste for every single entity across all
categories, led by a configurator. Capturing genuine taste allows retailers to add novelty and discovery
to personalized recommendations.”
The bottom line? For various Crayon Data customers, business results have included, to date:
• 18% increase in repeat visitors
• 15% increase in margins
Crayon Data Simplifies Customer Choice
on its volume but on its quality and how it is analyzed, interpreted, and put to use. Small Data is about
focusing on real-use cases, collecting only the right type and amount of data, and applying it with
maximum e�ciency and contextual relevance. For marketers, Small Data means specific, bounded data
sets. It may mean working with a smaller sample size…or focusing only on the details that drive your
business. Small Data can help brands personalize, curate, and deliver more of what customers want in
a timely fashion.
These are just some of the experts recognizing the new-found significance of Small Data. But how does
a retailer get to this actionable Small Data currency? Let’s take a closer look at two leading-edge
scientific platforms now o�ering distinctive new approaches to leveraging Small Data for predictive
analytics in the retail industry. Both companies ― Crayon Data and ScoreData ― are among the latest
best-in-class companies to join The O Alliance7 growing network of technology and service a�liates.
Amazingly, Crayon Data’s tools are not only for the CMO or CIO. Now on-floor sales associates can
make a handful of relevant and tailored recommendations simply by scanning any one item that
customers have selected to try on or placed in their shopping carts. No names or historical data points
are required. With a quick scan and cloud-based, scientifically-engineered suggestions, retailers can
fortify the three primary inputs to both transactional and lifetime customer value:
• Conversion
• Average order value
• Repeat visits
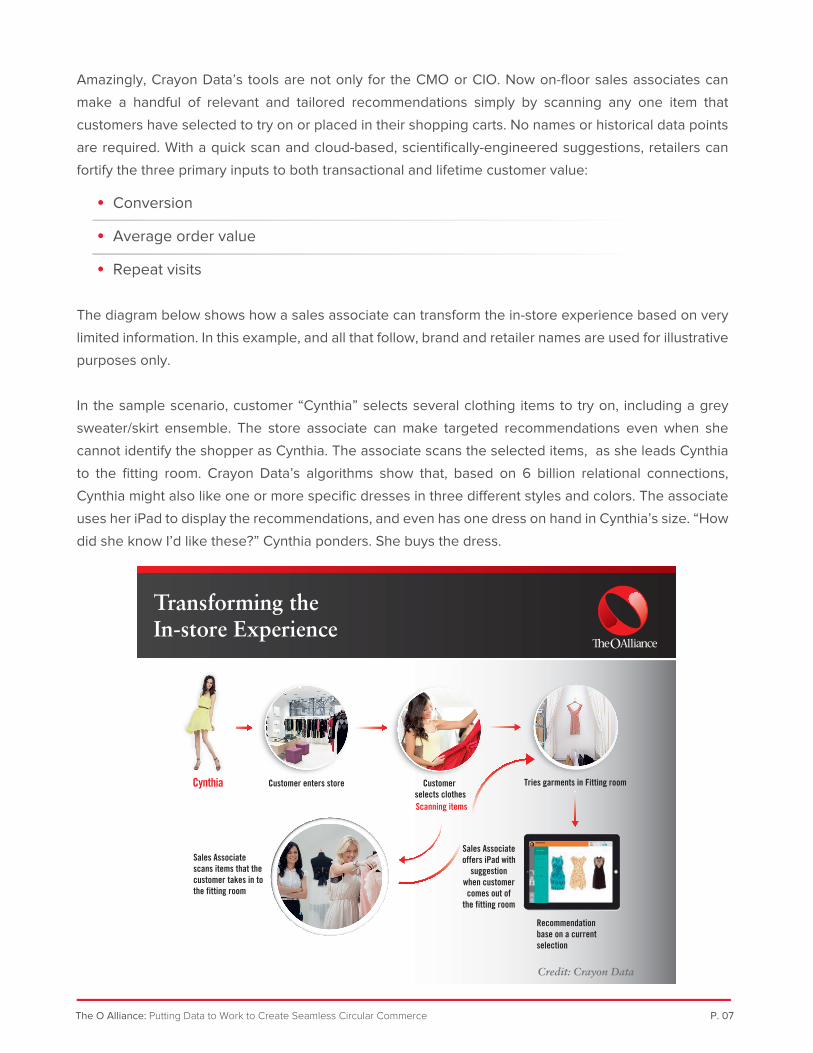
The diagram below shows how a sales associate can transform the in-store experience based on very
limited information. In this example, and all that follow, brand and retailer names are used for illustrative
purposes only.
In the sample scenario, customer “Cynthia” selects several clothing items to try on, including a grey
sweater/skirt ensemble. The store associate can make targeted recommendations even when she
cannot identify the shopper as Cynthia. The associate scans the selected items, as she leads Cynthia
to the fitting room. Crayon Data’s algorithms show that, based on 6 billion relational connections,
Cynthia might also like one or more specific dresses in three di�erent styles and colors. The associate
uses her iPad to display the recommendations, and even has one dress on hand in Cynthia’s size. “How
did she know I’d like these?” Cynthia ponders. She buys the dress.
Crayon Data9 is a big data company singularly focused on simplifying customer choice.
The company combines an immense repository of consumer taste data with retailers’ transactional
data, then uses sophisticated proprietary algorithms to draw an otherwise unseen view of a customer.
The resulting impact ― already proven in various sectors worldwide ― is a unique prediction of the few
cross-category items customers are most likely to buy. This information can be leveraged in online
advertising or email campaigns and to drive transactions in stores.
“Consumer research has shown that when provided with just four to six recommendations, people are
more likely to make a transactional choice, feel more confident in their decisions and stay happier with
those choices,” stated Srikant Sastri, Co-founder of Crayon Data. “We provide these individualized,
simpler choices using a scientific algorithm that deconstructs taste for every single entity across all
categories, led by a configurator. Capturing genuine taste allows retailers to add novelty and discovery
to personalized recommendations.”
The bottom line? For various Crayon Data customers, business results have included, to date:
• 18% increase in repeat visitors
• 15% increase in margins
P. 07The O Alliance: Putting Data to Work to Create Seamless Circular Commerce
Credit: Crayon Data
Amazingly, Crayon Data’s tools are not only for the CMO or CIO. Now on-floor sales associates can
make a handful of relevant and tailored recommendations simply by scanning any one item that
customers have selected to try on or placed in their shopping carts. No names or historical data points
are required. With a quick scan and cloud-based, scientifically-engineered suggestions, retailers can
fortify the three primary inputs to both transactional and lifetime customer value:
• Conversion
• Average order value
• Repeat visits
The diagram below shows how a sales associate can transform the in-store experience based on very
limited information. In this example, and all that follow, brand and retailer names are used for illustrative
purposes only.
In the sample scenario, customer “Cynthia” selects several clothing items to try on, including a grey
sweater/skirt ensemble. The store associate can make targeted recommendations even when she
cannot identify the shopper as Cynthia. The associate scans the selected items, as she leads Cynthia
to the fitting room. Crayon Data’s algorithms show that, based on 6 billion relational connections,
Cynthia might also like one or more specific dresses in three di�erent styles and colors. The associate
uses her iPad to display the recommendations, and even has one dress on hand in Cynthia’s size. “How
did she know I’d like these?” Cynthia ponders. She buys the dress.
Transforming the In-store Experience
Credit: Crayon Data
Cynthia
Sales Associate scans items that the customer takes in to the fitting room
Recommendation base on a current selection
Sales Associate offers iPad with
suggestion when customer comes out of
the fitting room
Customer selects clothesScanning items
Customer enters store Tries garments in Fitting room
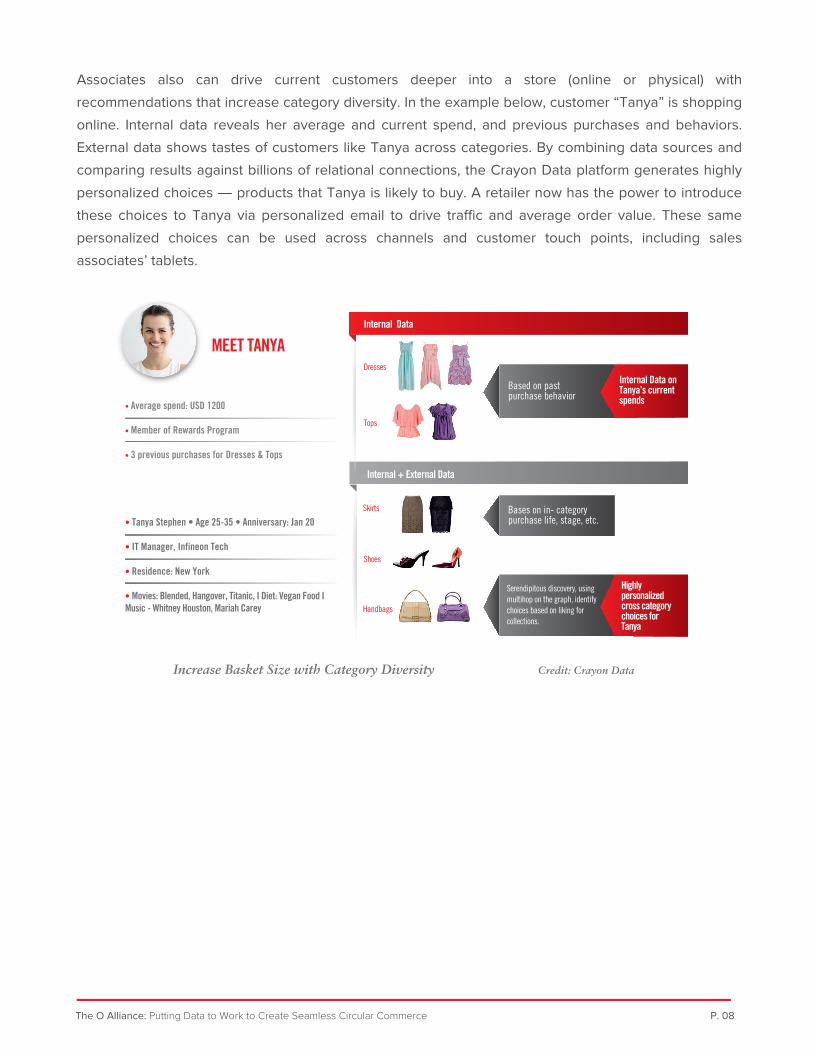
Associates also can drive current customers deeper into a store (online or physical) with
recommendations that increase category diversity. In the example below, customer “Tanya” is shopping
online. Internal data reveals her average and current spend, and previous purchases and behaviors.
External data shows tastes of customers like Tanya across categories. By combining data sources and
comparing results against billions of relational connections, the Crayon Data platform generates highly
personalized choices ― products that Tanya is likely to buy. A retailer now has the power to introduce
these choices to Tanya via personalized email to drive tra�c and average order value. These same
personalized choices can be used across channels and customer touch points, including sales
associates’ tablets.
P. 08The O Alliance: Putting Data to Work to Create Seamless Circular Commerce
Increase Basket Size with Category Diversity Credit: Crayon Data
Based on past purchase behavior
Internal Data on Tanya’s current spends
• Tanya Stephen • Age 25-35 • Anniversary: Jan 20 • IT Manager, Infineon Tech
• Residence: New York
• Movies: Blended, Hangover, Titanic, I Diet: Vegan Food I Music - Whitney Houston, Mariah Carey
• Average spend: USD 1200
• Member of Rewards Program
• 3 previous purchases for Dresses & Tops
MEET TANYA
Internal + External Data
Dresses
Tops
Skirts
Shoes
Handbags
Internal Data
Internal Data on Tanya’s current spends
Bases on in- category purchase life, stage, etc.
Serendipitous discovery, using multihop on the graph, identify choices based on liking for collections.
Highly personalized cross category choices for Tanya
A large retailer sought to improve its personalized o�ers as well as its o�er adoption rate, margins and
customer loyalty. ScoreData’s phased approach started small, by establishing a personalized o�er
generation engine. It then broadened the scope in stages ― to minimize business overhead and maximize
business impact ― by incorporating additional data sources that improved the predictive engine.
Phase One: Included defining and designing predictive consumer segmentation based on customer
profile, demographics and transactional data.
Phase Two: Linked past campaign data, product segmentation based on stickiness (baskets), pricing,
margins, demographics and local availability. It also matched optimal o�er definitions to consumers at
segment levels.
Phase Three: Integrated social media with historical data sources to capture customer preferences
and expectations, determined the influencers and followers; and o�ered incentives to the leaders. This
resulted in further improvement and o�er personalization.
Phase Four: Used third-party data such as credit history and other real-time information. Added loyalty
program data, web o�ers, seasonality data, rewards/gift programs and other available data sources to
further fine-tune personalized o�ers.
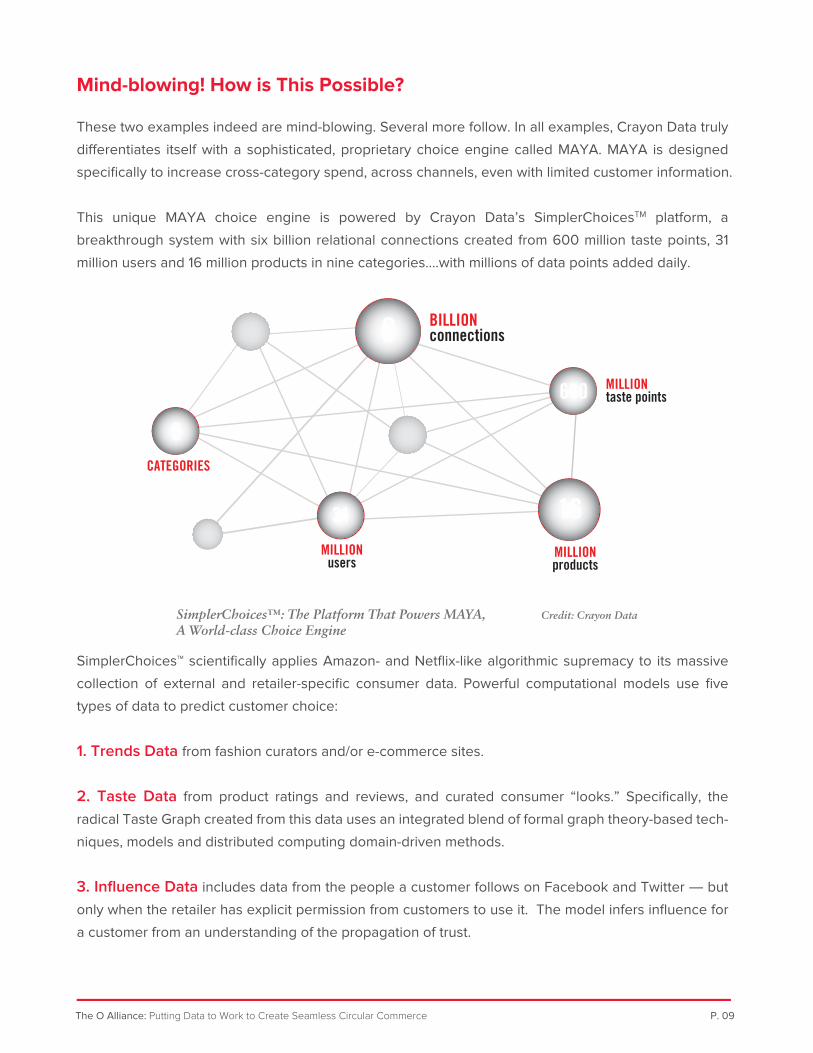
SimplerChoices™: The Platform That Powers MAYA, A World-class Choice Engine
Credit: Crayon Data
P. 09The O Alliance: Putting Data to Work to Create Seamless Circular Commerce
These two examples indeed are mind-blowing. Several more follow. In all examples, Crayon Data truly
di�erentiates itself with a sophisticated, proprietary choice engine called MAYA. MAYA is designed
specifically to increase cross-category spend, across channels, even with limited customer information.
This unique MAYA choice engine is powered by Crayon Data’s SimplerChoicesTM platform, a
breakthrough system with six billion relational connections created from 600 million taste points, 31
million users and 16 million products in nine categories….with millions of data points added daily.
SimplerChoices™ scientifically applies Amazon- and Netflix-like algorithmic supremacy to its massive
collection of external and retailer-specific consumer data. Powerful computational models use five
types of data to predict customer choice:
1. Trends Data from fashion curators and/or e-commerce sites.
2. Taste Data from product ratings and reviews, and curated consumer “looks.” Specifically, the
radical Taste Graph created from this data uses an integrated blend of formal graph theory-based tech-
niques, models and distributed computing domain-driven methods.
3. Influence Data includes data from the people a customer follows on Facebook and Twitter ― but
only when the retailer has explicit permission from customers to use it. The model infers influence for
a customer from an understanding of the propagation of trust.
Mind-blowing! How is This Possible? 4. Context Data helps prioritize choices based on intent. Parameters used include location, time,
weather or click-stream data showing where the customer is shopping in a store.
5. Behavior Data comprises enterprise data such as transactions and profiles from the retailer’s trans-
action logs or loyalty programs. Only anonymized data is used.
Based on these five key data types, the SimplerChoicesTM platform combines the most advanced,
best-in-class technology such as graph mining, a�nity analysis, trust propagation, topic modeling,
collaborative filtering, context discovery and prediction models. It connects the threads of one entity to
another to plot an a�nity between them and weave a taste fabric targeted to a specific customer. The
MAYA Choice Engine then uses a combination of components within SimplerChoicesTM to deliver
hyper-personalized choices to consumers.
Phase Five: Added mobile information (customer and store location) as well as localization filters to the
personalized o�ers. Also added real-time weather updates, tax, regulatory, currency and international
data sets.
A large retailer sought to improve its personalized o�ers as well as its o�er adoption rate, margins and
customer loyalty. ScoreData’s phased approach started small, by establishing a personalized o�er
generation engine. It then broadened the scope in stages ― to minimize business overhead and maximize
business impact ― by incorporating additional data sources that improved the predictive engine.
Phase One: Included defining and designing predictive consumer segmentation based on customer
profile, demographics and transactional data.
Phase Two: Linked past campaign data, product segmentation based on stickiness (baskets), pricing,
margins, demographics and local availability. It also matched optimal o�er definitions to consumers at
segment levels.
Phase Three: Integrated social media with historical data sources to capture customer preferences
and expectations, determined the influencers and followers; and o�ered incentives to the leaders. This
resulted in further improvement and o�er personalization.
Phase Four: Used third-party data such as credit history and other real-time information. Added loyalty
program data, web o�ers, seasonality data, rewards/gift programs and other available data sources to
further fine-tune personalized o�ers.
SimplerChoices™ scientifically applies Amazon- and Netflix-like algorithmic supremacy to its massive
collection of external and retailer-specific consumer data. Powerful computational models use five
types of data to predict customer choice:
1. Trends Data from fashion curators and/or e-commerce sites.
2. Taste Data from product ratings and reviews, and curated consumer “looks.” Specifically, the
radical Taste Graph created from this data uses an integrated blend of formal graph theory-based tech-
niques, models and distributed computing domain-driven methods.
3. Influence Data includes data from the people a customer follows on Facebook and Twitter ― but
only when the retailer has explicit permission from customers to use it. The model infers influence for
a customer from an understanding of the propagation of trust.
P. 10The O Alliance: Putting Data to Work to Create Seamless Circular Commerce
4. Context Data helps prioritize choices based on intent. Parameters used include location, time,
weather or click-stream data showing where the customer is shopping in a store.
5. Behavior Data comprises enterprise data such as transactions and profiles from the retailer’s trans-
action logs or loyalty programs. Only anonymized data is used.
Based on these five key data types, the SimplerChoicesTM platform combines the most advanced,
best-in-class technology such as graph mining, a�nity analysis, trust propagation, topic modeling,
collaborative filtering, context discovery and prediction models. It connects the threads of one entity to
another to plot an a�nity between them and weave a taste fabric targeted to a specific customer. The
MAYA Choice Engine then uses a combination of components within SimplerChoicesTM to deliver
hyper-personalized choices to consumers.
We saw how Crayon Data’s MAYA engine can be used to drive cross-category purchases for Cynthia
and Tanya. To illustrate the specific three steps used by MAYA to generate hyper-personalized
recommendations, let’s follow customers shopping journeys once again. We’ll also look at other
real-life shopping patterns.
Step 1: Create the Taste Graph
The first step to relevant simplification is to create a�nities from online product reviews and
user-posted public information. Preference probability is based on the billions of data point connections
in the SimplerChoices™ platform.
Product reviews: A user on an e-commerce site describes and rates two di�erent Nike shoes, creating an
a�nity between them. On the same site, another user rates Nike leggings and an Asics tee (di�erent
categories and brands), creating a connection between these two products.
User-posted public information: A user on a fashion website posts an image of herself wearing a blue Forever
21 shirt and blue Uniqlo denim-washed skirt, establishing a�nity between these two products from two
di�erent brands and categories. From their internal data, these brands only know what customers buy from
them ― but by deconstructing the attributes of this pairing, Forever 21 now knows that someone buying its blue
denim-washed shirt may also like a blue denim-washed skirt. Vice-versa for Uniqlo.
In all of these examples, while connections between products of brands like Nike, Asics, Forever 21 or Uniqlo
are stored, the identities of the user are not, making SimplerChoicesTM compliant with the most stringent
privacy standards.
Step 2: Link the Taste Graph to Retailer Data
Using sophisticated algorithms, external product data then is linked to the products in a retailer’s
catalog to:
Match identical products: The a�nity externally created between two Nike shoes, for example, is matched to
the same two items in the retailer’s catalog.
A Closer Look at Crayon Data’s MAYA Choice Engine
Phase Five: Added mobile information (customer and store location) as well as localization filters to the
personalized o�ers. Also added real-time weather updates, tax, regulatory, currency and international
data sets.
A large retailer sought to improve its personalized o�ers as well as its o�er adoption rate, margins and
customer loyalty. ScoreData’s phased approach started small, by establishing a personalized o�er
generation engine. It then broadened the scope in stages ― to minimize business overhead and maximize
business impact ― by incorporating additional data sources that improved the predictive engine.
Phase One: Included defining and designing predictive consumer segmentation based on customer
profile, demographics and transactional data.
Phase Two: Linked past campaign data, product segmentation based on stickiness (baskets), pricing,
margins, demographics and local availability. It also matched optimal o�er definitions to consumers at
segment levels.
Phase Three: Integrated social media with historical data sources to capture customer preferences
and expectations, determined the influencers and followers; and o�ered incentives to the leaders. This
resulted in further improvement and o�er personalization.
Phase Four: Used third-party data such as credit history and other real-time information. Added loyalty
program data, web o�ers, seasonality data, rewards/gift programs and other available data sources to
further fine-tune personalized o�ers.
P. 11The O Alliance: Putting Data to Work to Create Seamless Circular Commerce
Match similar products by attributes: A user externally reviews a SoundAsleep air mattress and large OXO
GoodGrips container. Attributes of the mattress (similar price point, twin inflatable bed, blue color and brand) are
systematically matched to a similarly priced blue twin air mattress from AeroBed, now o�ered by Bed, Bed and
Beyond. Based on SimplerChoices™ platform’s billions of connections, Bed, Bed and Beyond can determine the
probability of someone buying the Aerobed air mattress also wanting a large OXO GoodGrips container.
Step 3: Run Scientific Algorithms on the External and Retailer Data
Algorithms applied to external and purchase data add novelty and discovery to personalized choices.
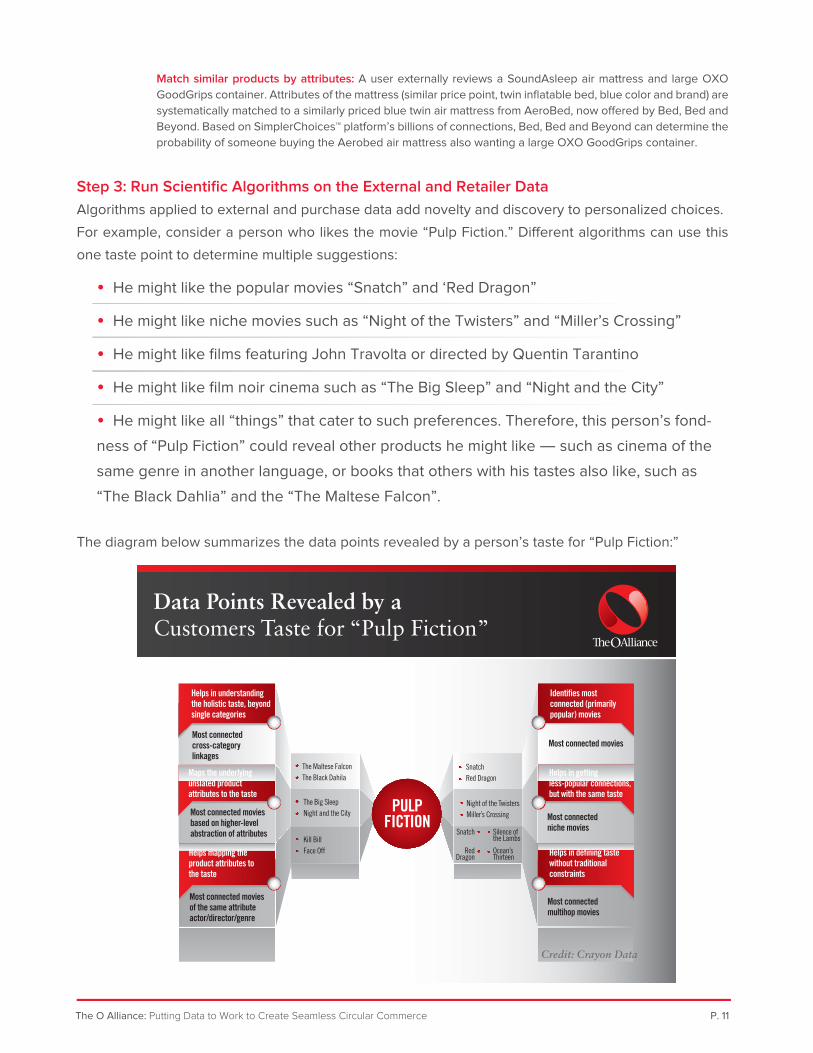
For example, consider a person who likes the movie “Pulp Fiction.” Di�erent algorithms can use this
one taste point to determine multiple suggestions:
• He might like the popular movies “Snatch” and ‘Red Dragon”
• He might like niche movies such as “Night of the Twisters” and “Miller’s Crossing”
• He might like films featuring John Travolta or directed by Quentin Tarantino
• He might like film noir cinema such as “The Big Sleep” and “Night and the City”
• He might like all “things” that cater to such preferences. Therefore, this person’s fond-
ness of “Pulp Fiction” could reveal other products he might like ― such as cinema of the
same genre in another language, or books that others with his tastes also like, such as
“The Black Dahlia” and the “The Maltese Falcon”.
The diagram below summarizes the data points revealed by a person’s taste for “Pulp Fiction:”
Data Points Revealed by aCustomers Taste for “Pulp Fiction”
Most connected cross-category linkages
Most connected movies based on higher-level abstraction of attributes
Most connected movies
Most connected niche movies
Most connected multihop movies
SnatchRed Dragon
Snatch
Red Dragon
Night of the TwistersMiller’s Crossing
Silence of the Lambs
Ocean’s Thirteen
The Big SleepNight and the City
Kill BillFace Off
PULPFICTION
The Maltese FalconThe Black Dahila
Most connected movies of the same attribute actor/director/genre
6 1
5
4
2
3
Phase Five: Added mobile information (customer and store location) as well as localization filters to the
personalized o�ers. Also added real-time weather updates, tax, regulatory, currency and international
data sets.
Credit: Crayon Data
Identifies most connected (primarily popular) movies
Helps in getting less-popular connections, but with the same taste
Helps in defining taste without traditional constraints
Helps in understanding the holistic taste, beyond single categories
Maps the underlying unslated product attributes to the taste
Helps mapping the product attributes to the taste
A large retailer sought to improve its personalized o�ers as well as its o�er adoption rate, margins and
customer loyalty. ScoreData’s phased approach started small, by establishing a personalized o�er
generation engine. It then broadened the scope in stages ― to minimize business overhead and maximize
business impact ― by incorporating additional data sources that improved the predictive engine.
Phase One: Included defining and designing predictive consumer segmentation based on customer
profile, demographics and transactional data.
Phase Two: Linked past campaign data, product segmentation based on stickiness (baskets), pricing,
margins, demographics and local availability. It also matched optimal o�er definitions to consumers at
segment levels.
Phase Three: Integrated social media with historical data sources to capture customer preferences
and expectations, determined the influencers and followers; and o�ered incentives to the leaders. This
resulted in further improvement and o�er personalization.
Phase Four: Used third-party data such as credit history and other real-time information. Added loyalty
program data, web o�ers, seasonality data, rewards/gift programs and other available data sources to
further fine-tune personalized o�ers.
Another leading-edge predictive analytics platform comes
from ScoreData11, a team of decision scientists providing
predictive solutions and services which help retailers drive
significant business improvements across the enterprise.
ScoreData applies core, proprietary predictive technologies
such as digital scoring engines and machine learning systems
that extract and score multi-sourced retail data to accurately
address issues such as:
• Are marketing promotional o�ers increasing the store tra�c?
• Is the email campaign increasing the number of returning visitors?
• How can we improve customer loyalty and reduce churn?
• How does the social media campaign a�ect customers?
• What is our peak sales time and how much workforce/ inventory is required for that period?
• How is seasonality a�ecting the business?
• How can we increase up-sell and cross-sell?
ScoreData customizes its technologies to retailers’ unique business challenges by developing
customized predictive models. Whether a company is data rich or data poor, ScoreData can develop an
e�ective dashboard for enterprise decision makers.
Interestingly, predictive models built for a retailer’s specific business questions can start with a small
amount of data, even as little as an email I.D. and the last transaction completed by a consumer. While
petabytes of data characterize Big Data applications, only megabytes are needed to build and execute a
ScoreData model.
Once the targeted model is built, one of ScoreData’s biggest di�erentiators is the use of runtime engines
that continually learn and adapt to become increasingly intelligent and e�ective, with no manual
intervention. As more customer and market knowledge is made available ― as the software sees new
ScoreData Drives Business Improvements
P. 12The O Alliance: Putting Data to Work to Create Seamless Circular Commerce
As shown in all examples above, by using powerful
algorithms on a combined data set from the retailer and
internet, SimplerChoices™ is proven to give companies an
unparalleled view of their customers ― and the ability to
drive tangible lifts in revenue across channels.
Ignore Connection AnalyticsAt Your Own Peril!
Part of what makes the analysis of connections so powerful is that while virtually every metric typically used for analysis focuses only on facts about each individual entity, the analysis of connections makes it possible to also understand each entity’s relationships to others, posted Bill Franks10, Chief Analytics Officer for Teradata. “The analysis of connections provides distinctive information that has very little overlap with other information typically available.”
Analyzing connections on a large scale is a computationally intensive process; to be effective; it requires a graph analysis engine. “Given that [connection analytics] isn’t widely adopted yet, there is a chance to get a competitive advantage by putting it to use first. Ignore connection analytics at your own peril!”
Phase Five: Added mobile information (customer and store location) as well as localization filters to the
personalized o�ers. Also added real-time weather updates, tax, regulatory, currency and international
data sets.
A large retailer sought to improve its personalized o�ers as well as its o�er adoption rate, margins and
customer loyalty. ScoreData’s phased approach started small, by establishing a personalized o�er
generation engine. It then broadened the scope in stages ― to minimize business overhead and maximize
business impact ― by incorporating additional data sources that improved the predictive engine.
Phase One: Included defining and designing predictive consumer segmentation based on customer
profile, demographics and transactional data.
Phase Two: Linked past campaign data, product segmentation based on stickiness (baskets), pricing,
margins, demographics and local availability. It also matched optimal o�er definitions to consumers at
segment levels.
Phase Three: Integrated social media with historical data sources to capture customer preferences
and expectations, determined the influencers and followers; and o�ered incentives to the leaders. This
resulted in further improvement and o�er personalization.
Phase Four: Used third-party data such as credit history and other real-time information. Added loyalty
program data, web o�ers, seasonality data, rewards/gift programs and other available data sources to
further fine-tune personalized o�ers.
How One Retailer Used ScoreData’s Phased Approach to Personalized O�ers
Based on an integrated and growing repository of this unified customer-centric data, ScoreData applies
data from multiple channels, such as social media, seasonal or environmental data, as well as internal
system data such as internal product baskets, to predict how various consumer segments are likely to
behave. For retailers pursuing specific business improvements, sample results include:
• Targeting customers more e�ectively for marketing campaigns
• Improving response time to market changes
• Increasing channel productivity
• Improving customer service at the store
In addition, retailers now can provide updated and localized product information in a cohesive,
centralized manner, across all customer-facing touch points in their circle of commerce.
Another leading-edge predictive analytics platform comes
from ScoreData11, a team of decision scientists providing
predictive solutions and services which help retailers drive
significant business improvements across the enterprise.
ScoreData applies core, proprietary predictive technologies
such as digital scoring engines and machine learning systems
that extract and score multi-sourced retail data to accurately
address issues such as:
• Are marketing promotional o�ers increasing the store tra�c?
• Is the email campaign increasing the number of returning visitors?
• How can we improve customer loyalty and reduce churn?
• How does the social media campaign a�ect customers?
• What is our peak sales time and how much workforce/ inventory is required for that period?
• How is seasonality a�ecting the business?
• How can we increase up-sell and cross-sell?
ScoreData customizes its technologies to retailers’ unique business challenges by developing
customized predictive models. Whether a company is data rich or data poor, ScoreData can develop an
e�ective dashboard for enterprise decision makers.
Interestingly, predictive models built for a retailer’s specific business questions can start with a small
amount of data, even as little as an email I.D. and the last transaction completed by a consumer. While
petabytes of data characterize Big Data applications, only megabytes are needed to build and execute a
ScoreData model.
Once the targeted model is built, one of ScoreData’s biggest di�erentiators is the use of runtime engines
that continually learn and adapt to become increasingly intelligent and e�ective, with no manual
intervention. As more customer and market knowledge is made available ― as the software sees new
P. 13The O Alliance: Putting Data to Work to Create Seamless Circular Commerce
Phase Five: Added mobile information (customer and store location) as well as localization filters to the
personalized o�ers. Also added real-time weather updates, tax, regulatory, currency and international
data sets.
data from email, store, web, mobile, social and other sources ― updates are sent to the cloud in real-time
and incorporated into the predictive models.
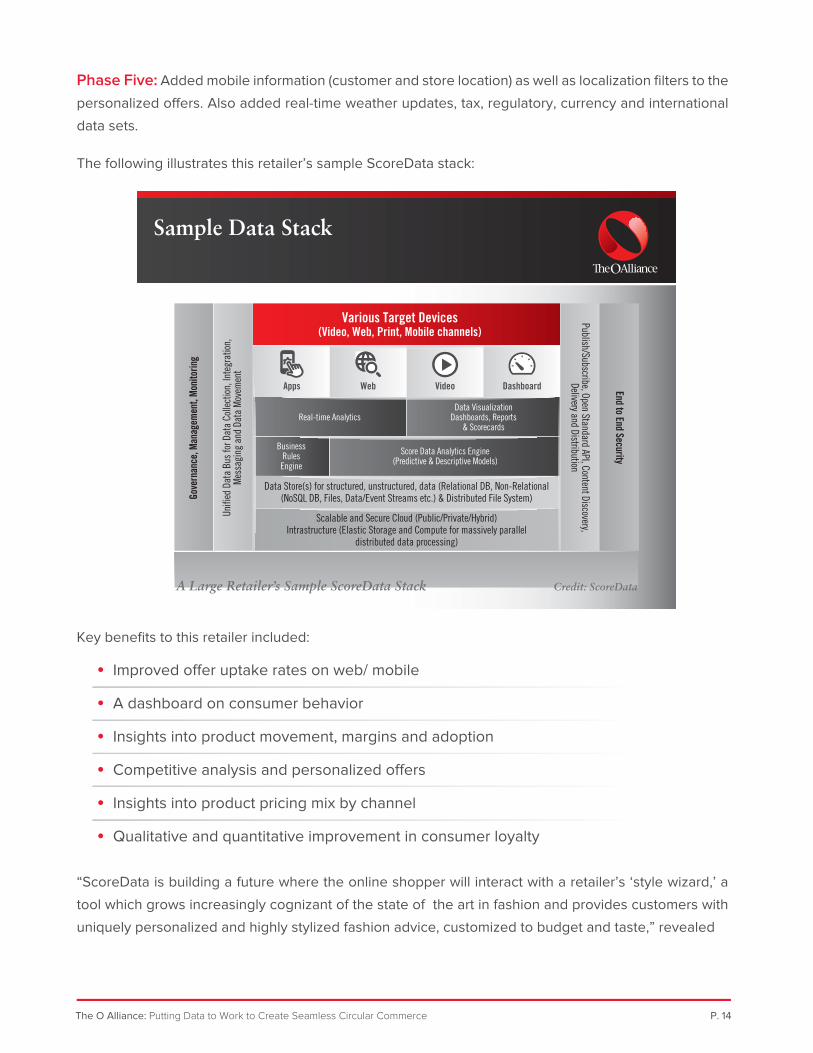
Sample Data Stack
The following illustrates this retailer’s sample ScoreData stack:
Key benefits to this retailer included:
• Improved o�er uptake rates on web/ mobile
• A dashboard on consumer behavior
• Insights into product movement, margins and adoption
• Competitive analysis and personalized o�ers
• Insights into product pricing mix by channel
• Qualitative and quantitative improvement in consumer loyalty
“ScoreData is building a future where the online shopper will interact with a retailer’s ‘style wizard,’ a
tool which grows increasingly cognizant of the state of the art in fashion and provides customers with
uniquely personalized and highly stylized fashion advice, customized to budget and taste,” revealed
A large retailer sought to improve its personalized o�ers as well as its o�er adoption rate, margins and
customer loyalty. ScoreData’s phased approach started small, by establishing a personalized o�er
generation engine. It then broadened the scope in stages ― to minimize business overhead and maximize
business impact ― by incorporating additional data sources that improved the predictive engine.
Phase One: Included defining and designing predictive consumer segmentation based on customer
profile, demographics and transactional data.
Phase Two: Linked past campaign data, product segmentation based on stickiness (baskets), pricing,
margins, demographics and local availability. It also matched optimal o�er definitions to consumers at
segment levels.
Phase Three: Integrated social media with historical data sources to capture customer preferences
and expectations, determined the influencers and followers; and o�ered incentives to the leaders. This
resulted in further improvement and o�er personalization.
Phase Four: Used third-party data such as credit history and other real-time information. Added loyalty
program data, web o�ers, seasonality data, rewards/gift programs and other available data sources to
further fine-tune personalized o�ers.
P. 14The O Alliance: Putting Data to Work to Create Seamless Circular Commerce
Various Target Devices(Video, Web, Print, Mobile channels)
Real-time Analytics
BusinessRulesEngine
Score Data Analytics Engine(Predictive & Descriptive Models)
Data VisualizationDashboards, Reports
& Scorecards
Web Video Dashboard End to End Security
Publish/Subscribe, Open Standard API, Content Discovery,Delivery and Distribution
Unifi
ed D
ata
Bus
for D
ata
Colle
ctio
n, In
tegr
atio
n,M
essa
ging
and
Dat
a M
ovem
ent
Gove
rnan
ce, M
anag
emen
t, M
onito
ring
Apps
Scalable and Secure Cloud (Public/Private/Hybrid)Intrastructure (Elastic Storage and Compute for massively parallel
distributed data processing)
Data Store(s) for structured, unstructured, data (Relational DB, Non-Relational(NoSQL DB, Files, Data/Event Streams etc.) & Distributed File System)
A Large Retailer’s Sample ScoreData Stack Credit: ScoreData
Phase Five: Added mobile information (customer and store location) as well as localization filters to the
personalized o�ers. Also added real-time weather updates, tax, regulatory, currency and international
data sets.
Retailers can learn from best-of-class companies with similar business cases. In the non-retail example
following, the same ScoreData digital scoring engine has proven, powerful algorithms for retailers,
including maintaining customer connectivity and creating greater opportunities for loyalty and credit
card reactivation.
One of the world’s largest non-retail companies wanted to replace its existing prediction system with a
better quality product to arrest increasing consumer and business churn. ScoreData was selected for
this project and produced a revealing propensity scorecard, based on proprietary predictive analytics
power, which delivered the benefits bulleted below.
A two-fold problem description was created for this customer: 1) early identification of subscribers most
likely to churn, and 2) identification of important factors driving the churn.
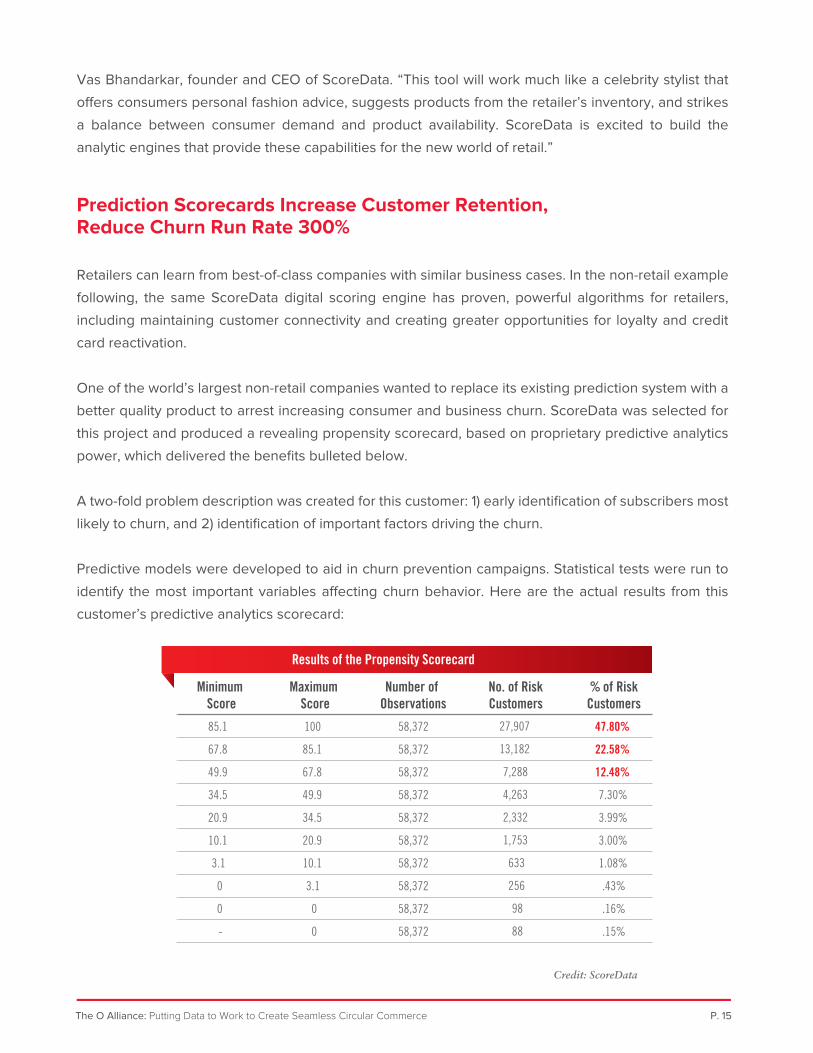
Predictive models were developed to aid in churn prevention campaigns. Statistical tests were run to
identify the most important variables a�ecting churn behavior. Here are the actual results from this
customer’s predictive analytics scorecard:
Prediction Scorecards Increase Customer Retention, Reduce Churn Run Rate 300%
A large retailer sought to improve its personalized o�ers as well as its o�er adoption rate, margins and
customer loyalty. ScoreData’s phased approach started small, by establishing a personalized o�er
generation engine. It then broadened the scope in stages ― to minimize business overhead and maximize
business impact ― by incorporating additional data sources that improved the predictive engine.
Phase One: Included defining and designing predictive consumer segmentation based on customer
profile, demographics and transactional data.
Phase Two: Linked past campaign data, product segmentation based on stickiness (baskets), pricing,
margins, demographics and local availability. It also matched optimal o�er definitions to consumers at
segment levels.
Phase Three: Integrated social media with historical data sources to capture customer preferences
and expectations, determined the influencers and followers; and o�ered incentives to the leaders. This
resulted in further improvement and o�er personalization.
Phase Four: Used third-party data such as credit history and other real-time information. Added loyalty
program data, web o�ers, seasonality data, rewards/gift programs and other available data sources to
further fine-tune personalized o�ers.
P. 15The O Alliance: Putting Data to Work to Create Seamless Circular Commerce
Minimum Score
85.1
67.8
49.9
34.5
20.9
10.1
3.1
0
0
-
Maximum Score
100
85.1
67.8
49.9
34.5
20.9
10.1
3.1
0
0
Number of Observations
58,372
58,372
58,372
58,372
58,372
58,372
58,372
58,372
58,372
58,372
No. of RiskCustomers
27,907
13,182
7,288
4,263
2,332
1,753
633
256
98
88
% of RiskCustomers
47.80%
22.58%
12.48%
7.30%
3.99%
3.00%
1.08%
.43%
.16%
.15%
Results of the Propensity Scorecard
Credit: ScoreData
Phase Five: Added mobile information (customer and store location) as well as localization filters to the
personalized o�ers. Also added real-time weather updates, tax, regulatory, currency and international
data sets.
Vas Bhandarkar, founder and CEO of ScoreData. “This tool will work much like a celebrity stylist that
o�ers consumers personal fashion advice, suggests products from the retailer’s inventory, and strikes
a balance between consumer demand and product availability. ScoreData is excited to build the
analytic engines that provide these capabilities for the new world of retail.”
A large, global UK-based online retailer sought to build a reliable model to complement or take over its
traditional in-house approach to product forecasting, which was primarily driven by gut instinct.
ScoreData developed a multi-variable time series forecasting model for all of the product categories.
Data sources included sales and inventory, among other business data and input. The model
uncovered patterns caused by seasonal variations, lead times, minimum quantities, re-order quantities,
extraordinary usage (special orders) and more.
Forecasted sales were overlaid with existing inventory to get order recommendations at warehouse levels.
Benefits and impact included:
• Forecasted sales within accuracy levels of 90%+
• Cut inventory costs by 25%
• Increased fulfillment levels by 10%
• Improved customer service levels
• Improved cash flow
Successful Sales Forecast Model for Online Retail Giant
A global online retailer, who delivered all marketing through Facebook, wanted to link its Facebook Fan
growth to sales trends. The company sought to understand how its marketing e�orts actually translated into
sales, evaluate ROI and customer loyalty.
ScoreData developed several non-linear models predicting sales as a function of Fan growth. It also
developed a tool which, given sales targets as input, would provide the Fan growth needed in the coming
weeks to achieve the targets.
Promotional Response Model Improves Social Marketing E�orts
A large retailer sought to improve its personalized o�ers as well as its o�er adoption rate, margins and
customer loyalty. ScoreData’s phased approach started small, by establishing a personalized o�er
generation engine. It then broadened the scope in stages ― to minimize business overhead and maximize
business impact ― by incorporating additional data sources that improved the predictive engine.
Phase One: Included defining and designing predictive consumer segmentation based on customer
profile, demographics and transactional data.
Phase Two: Linked past campaign data, product segmentation based on stickiness (baskets), pricing,
margins, demographics and local availability. It also matched optimal o�er definitions to consumers at
segment levels.
Phase Three: Integrated social media with historical data sources to capture customer preferences
and expectations, determined the influencers and followers; and o�ered incentives to the leaders. This
resulted in further improvement and o�er personalization.
Phase Four: Used third-party data such as credit history and other real-time information. Added loyalty
program data, web o�ers, seasonality data, rewards/gift programs and other available data sources to
further fine-tune personalized o�ers.
P. 16The O Alliance: Putting Data to Work to Create Seamless Circular Commerce
For this large company, resulting benefits and impact included:
• Reducing churn rate by 300%
• 90% churn captured the top 20% "risky" population 15 days in advance
• Superior churn propensity scores
• Greater opportunity for loyalty/credit card reactivation
• Increased loyalty
Phase Five: Added mobile information (customer and store location) as well as localization filters to the
personalized o�ers. Also added real-time weather updates, tax, regulatory, currency and international
data sets.
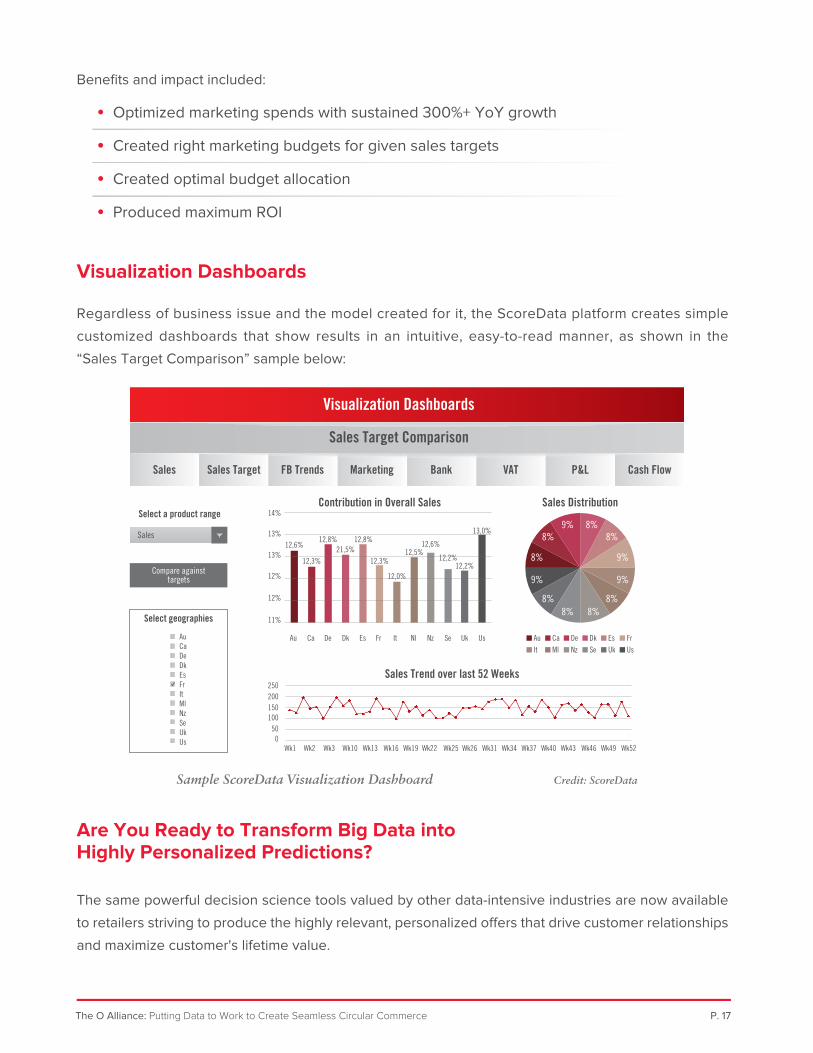
Sample ScoreData Visualization Dashboard Credit: ScoreData
The same powerful decision science tools valued by other data-intensive industries are now available
to retailers striving to produce the highly relevant, personalized o�ers that drive customer relationships
and maximize customer's lifetime value.
Are You Ready to Transform Big Data into Highly Personalized Predictions?
Regardless of business issue and the model created for it, the ScoreData platform creates simple
customized dashboards that show results in an intuitive, easy-to-read manner, as shown in the
“Sales Target Comparison” sample below:
Visualization Dashboards
A large retailer sought to improve its personalized o�ers as well as its o�er adoption rate, margins and
customer loyalty. ScoreData’s phased approach started small, by establishing a personalized o�er
generation engine. It then broadened the scope in stages ― to minimize business overhead and maximize
business impact ― by incorporating additional data sources that improved the predictive engine.
Phase One: Included defining and designing predictive consumer segmentation based on customer
profile, demographics and transactional data.
Phase Two: Linked past campaign data, product segmentation based on stickiness (baskets), pricing,
margins, demographics and local availability. It also matched optimal o�er definitions to consumers at
segment levels.
Phase Three: Integrated social media with historical data sources to capture customer preferences
and expectations, determined the influencers and followers; and o�ered incentives to the leaders. This
resulted in further improvement and o�er personalization.
Phase Four: Used third-party data such as credit history and other real-time information. Added loyalty
program data, web o�ers, seasonality data, rewards/gift programs and other available data sources to
further fine-tune personalized o�ers.
P. 17The O Alliance: Putting Data to Work to Create Seamless Circular Commerce
Benefits and impact included:
• Optimized marketing spends with sustained 300%+ YoY growth
• Created right marketing budgets for given sales targets
• Created optimal budget allocation
• Produced maximum ROI
Sales Target Comparison
Visualization Dashboards
Sales Sales Target FB Trends Marketing Bank VAT P&L Cash Flow
8% 9%
9% 9%
8%9% 8%
8% 8%
8%
8% 8%
Sales DistributionContribution in Overall Sales
Au Ca De Dk Es Fr
It Ml Nz Se Uk Us
Au
12,6%
14%
13%
13%
12%
12%
11%
12,3%
12,8%21,5%
12,8%
12,3%
12,0%
12,5%12,6%
12,2%12,2%
13,0%
Ca De Dk Es Fr It Nl Nz Se Uk Us
Sales Trend over last 52 Weeks
Wk1 Wk2 Wk3 Wk10 Wk13 Wk16 Wk19 Wk22 Wk25 Wk26 Wk31 Wk34 Wk37 Wk40 Wk43 Wk46 Wk49 Wk52
250200150100
500
Select a product range
Sales
Compare againsttargets
Select geographies
AuCaDeDkEsFrItMlNzSeUkUs
Phase Five: Added mobile information (customer and store location) as well as localization filters to the
personalized o�ers. Also added real-time weather updates, tax, regulatory, currency and international
data sets.
Predictive analytics dismantle overwhelming Big Data to help retailers transform the commerce
ecosystem. Today’s predictive analytic tools are quick to install without the large capital expenditures
and information technology investments of the past. They integrate easily with customer facing touch
points to deliver the personalization expected by customers. These powerful tools pull data slices from
myriad system and domains ― not only with bricks or clicks, putting customers’ unique behaviors and
preferences firmly at their core. And best-of-class providers make the tools simple for the user.
The O Alliance was created to assist retail clients in transforming their organizations into Seamless
Circular Commerce ecosystems. The O Alliance is a transformational retail consultancy, founded by
Andrea Weiss, a pioneer in creating seamless customer experiences.
To achieve the reality of Seamless Circular Commerce, The O Alliance utilizes its trademarked system,
called “The O MethodTM,” to replace retail’s outmoded omnichannel strategies.
The O Alliance is uniquely positioned to meet today's industry challenges: the company combines
“hands-on” consulting practitioners with a membership network of vetted a�liates, services and technology
companies with expertise in all areas critical to unlocking value. The O Alliance’s problem-solving network
participants enable a retailer to compete more profitably in today’s new retail paradigm. Why keep looking
for point-to-point solutions, when you can create Seamless Circular Commerce?
Crayon Data and ScoreData are the newest a�liates to join The O Alliance network!
The O Alliance serves as:
• Advisors to the Board of Directors;
• Partners with the C-suite;
• Agents of Change; and
• Hands-on implementation teammates that help execute the fine points of Seamless
Circular Commerce.
A large retailer sought to improve its personalized o�ers as well as its o�er adoption rate, margins and
customer loyalty. ScoreData’s phased approach started small, by establishing a personalized o�er
generation engine. It then broadened the scope in stages ― to minimize business overhead and maximize
business impact ― by incorporating additional data sources that improved the predictive engine.
Phase One: Included defining and designing predictive consumer segmentation based on customer
profile, demographics and transactional data.
Phase Two: Linked past campaign data, product segmentation based on stickiness (baskets), pricing,
margins, demographics and local availability. It also matched optimal o�er definitions to consumers at
segment levels.
Phase Three: Integrated social media with historical data sources to capture customer preferences
and expectations, determined the influencers and followers; and o�ered incentives to the leaders. This
resulted in further improvement and o�er personalization.
Phase Four: Used third-party data such as credit history and other real-time information. Added loyalty
program data, web o�ers, seasonality data, rewards/gift programs and other available data sources to
further fine-tune personalized o�ers.
P. 18The O Alliance: Putting Data to Work to Create Seamless Circular Commerce
www.theoallianceconsulting.com
Creating Circular Commerce
For more information, please contact us at:
The O Alliance
16 W. 23rd Street
New York, NY 10010
352-233-4454
Phase Five: Added mobile information (customer and store location) as well as localization filters to the
personalized o�ers. Also added real-time weather updates, tax, regulatory, currency and international
data sets.

For more information, please contact us at:
The O Alliance
16 W. 23rd Street
New York, NY 10010
352-233-4454
Footnotes:
1 Seamless Circular Commerce: http://theoallianceconsulting.com/6-steps-creating-seamless-circular-commerce/
2 eMarketer Article: http://www.emarketer.com/Article/Total-US-Retail-Sales-Top-3645-Trillion-2013-Outpace-GDP-Growth/1010756
3 EMC Consulting Blog: https://infocus.emc.com/william_schmarzo/world-big-data-small-data-rules/
4 Statement by Lutz Finger: https://www.linkedin.com/pulse/20140918134031-6074593-our-future-free-will-vs-predictions-with-data?trk=prof-post
5 CMO.com Article:http://www.cmo.com/articles/2014/8/5/CWTK_small_data.html
6 Statement by Jamie Tedford: http://www.marketingprofs.com/opinions/2014/24512/small-data-can-help-businesses-be-more-human
7 The O Alliance: http://theoallianceconsulting.com/
8 Yale School of Management “Insights” Article: http://insights.som.yale.edu/insights/how-can-you-get-most-out-big-data
9 Crayon Data: http://www.crayondata.com/
10 Statement by Bill Franks: http://smartdatacollective.com/billfranks/281711/miss-right-connections-your-own-peril
11 ScoreData: http://www.scoredata.com/
www.theoallianceconsulting.com
© 2015 The O Alliance Consulting, LLCOther companies, products and service names may be trademarks or service marks of others.
Creating Circular Commerce