Embed Size (px)
DESCRIPTION
Putting California’s Rim Fire in context. 8/28/2013. Largest wildfires in California since 1932. 7 of the 10 biggest fires have occurred in past decade. Structures / lives lost. 2,820 / 14. 0 / 0. 1 / 0. 0 / 0. 1,650 / 2. 0 / 2. Still burning. 111 / 0. 0 / 0. 382 / 5. 58 / 0. - PowerPoint PPT Presentation
Citation preview
Putting California’s Rim Fire in context
04/19/2023
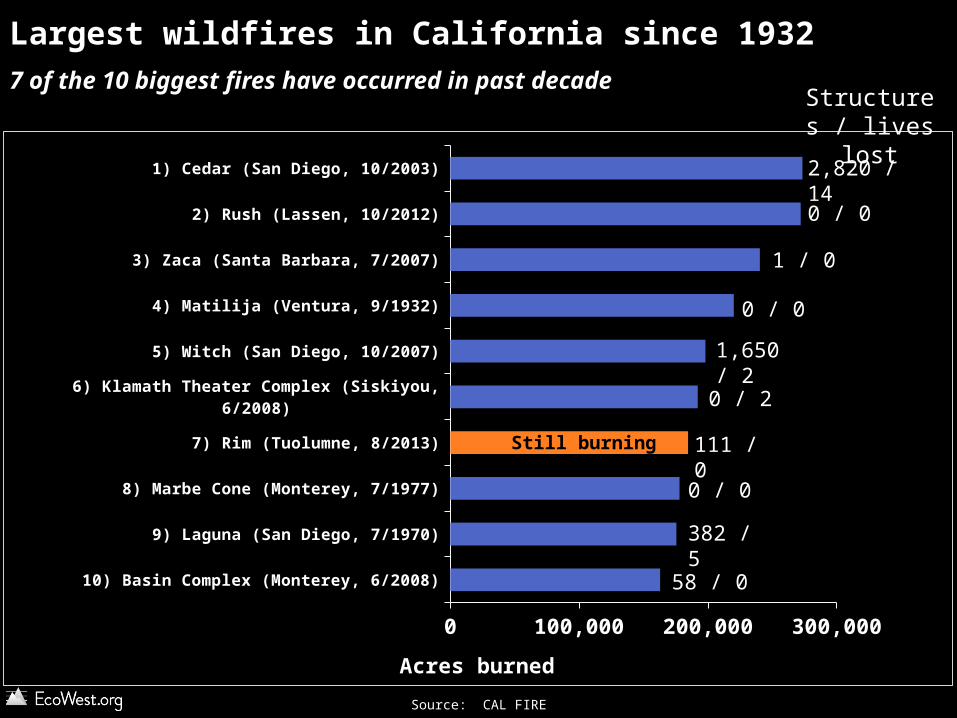
Largest wildfires in California since 1932
10) Basin Complex (Monterey, 6/2008)
9) Laguna (San Diego, 7/1970)
8) Marbe Cone (Monterey, 7/1977)
7) Rim (Tuolumne, 8/2013)
6) Klamath Theater Complex (Siskiyou, 6/2008)
5) Witch (San Diego, 10/2007)
4) Matilija (Ventura, 9/1932)
3) Zaca (Santa Barbara, 7/2007)
2) Rush (Lassen, 10/2012)
1) Cedar (San Diego, 10/2003)
0 100,000 200,000 300,000
Acres burned
7 of the 10 biggest fires have occurred in past decadeStructures / lives lost
2,820 / 14
0 / 0
1 / 0
0 / 0
1,650 / 2
0 / 2
111 / 0
0 / 0
382 / 5
58 / 0
Still burning
Source: CAL FIRE
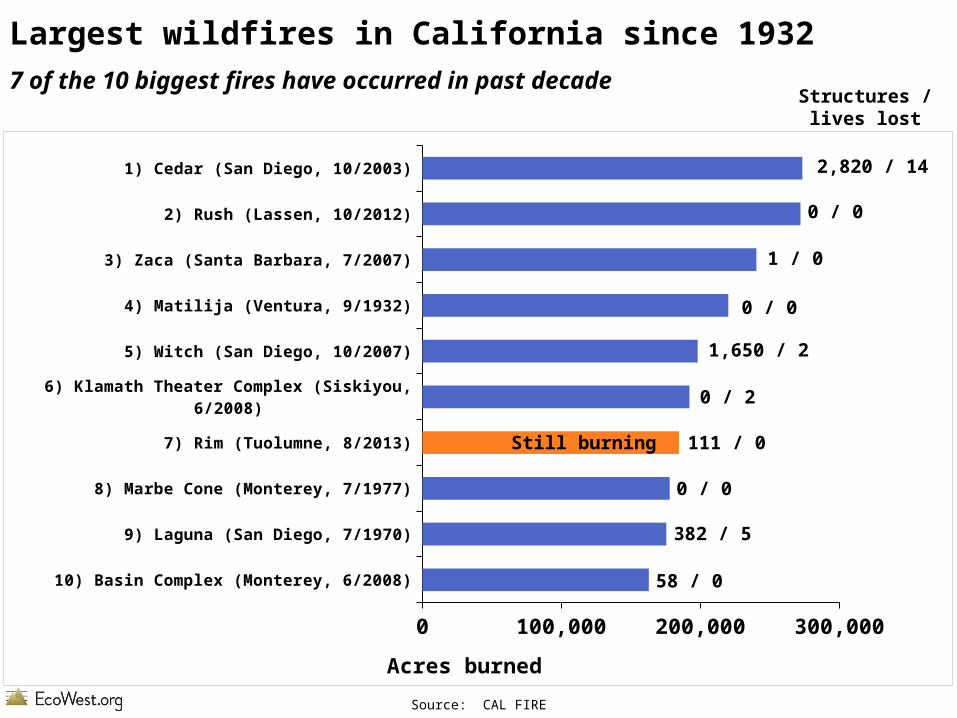
Largest wildfires in California since 1932
10) Basin Complex (Monterey, 6/2008)
9) Laguna (San Diego, 7/1970)
8) Marbe Cone (Monterey, 7/1977)
7) Rim (Tuolumne, 8/2013)
6) Klamath Theater Complex (Siskiyou, 6/2008)
5) Witch (San Diego, 10/2007)
4) Matilija (Ventura, 9/1932)
3) Zaca (Santa Barbara, 7/2007)
2) Rush (Lassen, 10/2012)
1) Cedar (San Diego, 10/2003)
0 100,000 200,000 300,000
Acres burned
7 of the 10 biggest fires have occurred in past decadeStructures /
lives lost
2,820 / 14
0 / 0
1 / 0
0 / 0
1,650 / 2
0 / 2
111 / 0
0 / 0
382 / 5
58 / 0
Still burning
Source: CAL FIRE
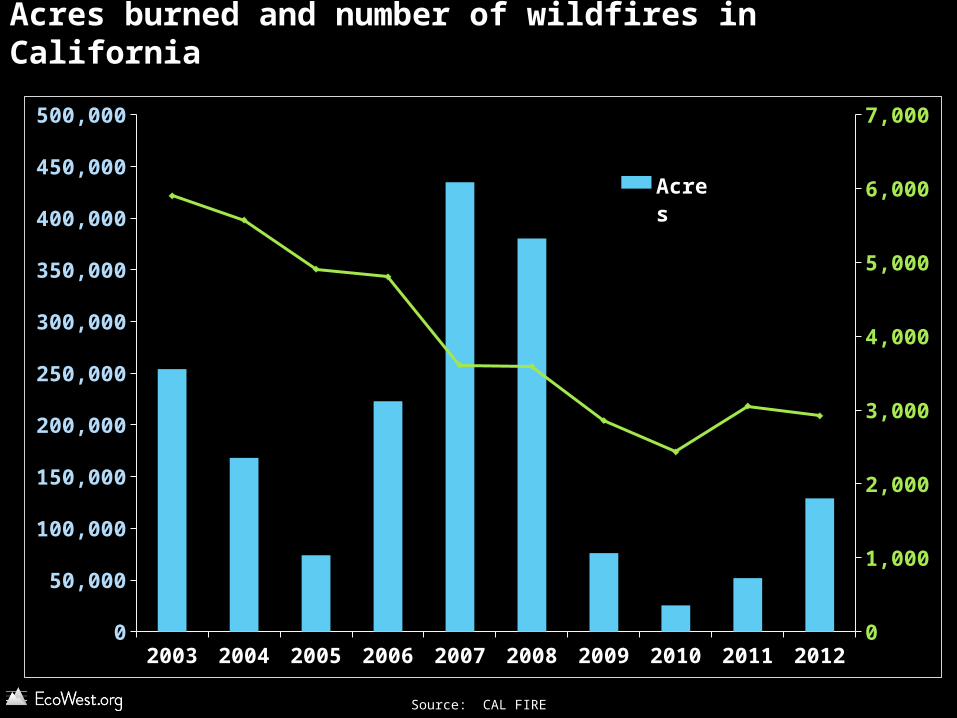
Acres burned and number of wildfires in California
2003 2004 2005 2006 2007 2008 2009 2010 2011 20120
50,000
100,000
150,000
200,000
250,000
300,000
350,000
400,000
450,000
500,000
0
1,000
2,000
3,000
4,000
5,000
6,000
7,000
Acres
Source: CAL FIRE
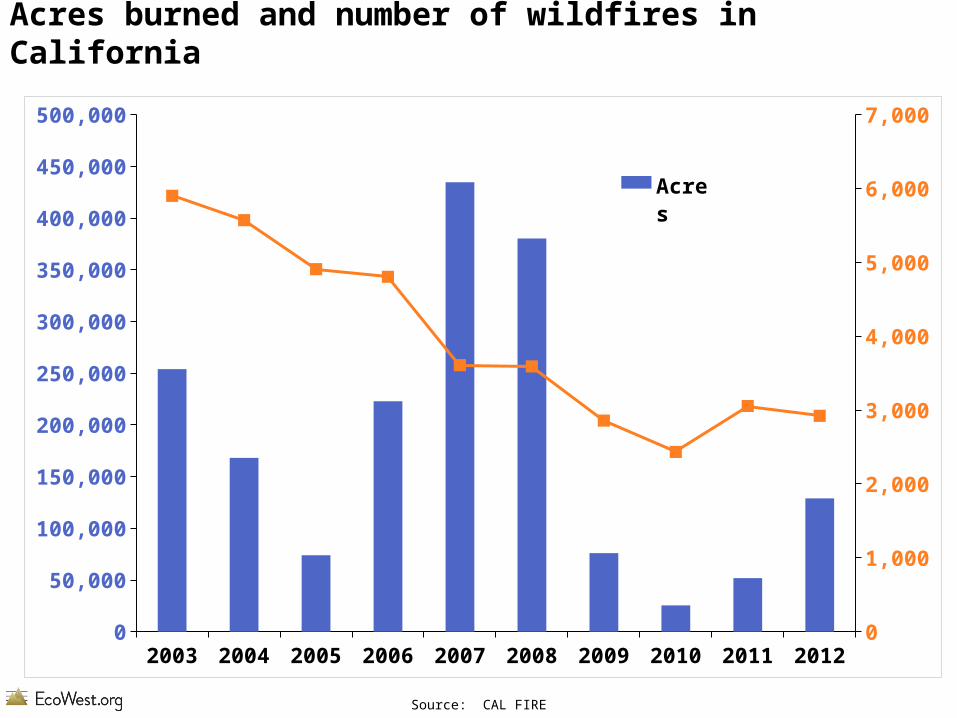
Acres burned and number of wildfires in California
2003 2004 2005 2006 2007 2008 2009 2010 2011 20120
50,000
100,000
150,000
200,000
250,000
300,000
350,000
400,000
450,000
500,000
0
1,000
2,000
3,000
4,000
5,000
6,000
7,000
Acres
Source: CAL FIRE
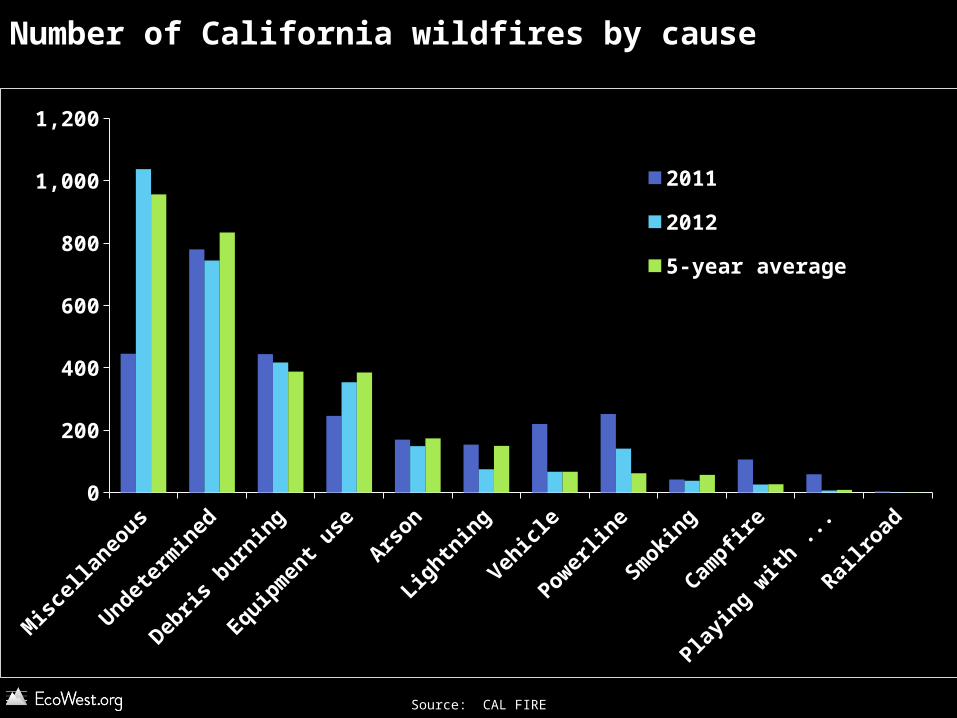
Number of California wildfires by cause
Misce
llane
ous
Und
eter
min
ed
Deb
ris bu
rnin
g
Equip
men
t use
Arson
Ligh
tnin
g
Vehic
le
Power
line
Smok
ing
Campfi
re
Playing
with
fire
Railroa
d0
200
400
600
800
1,000
1,200
2011
2012
5-year average
Source: CAL FIRE
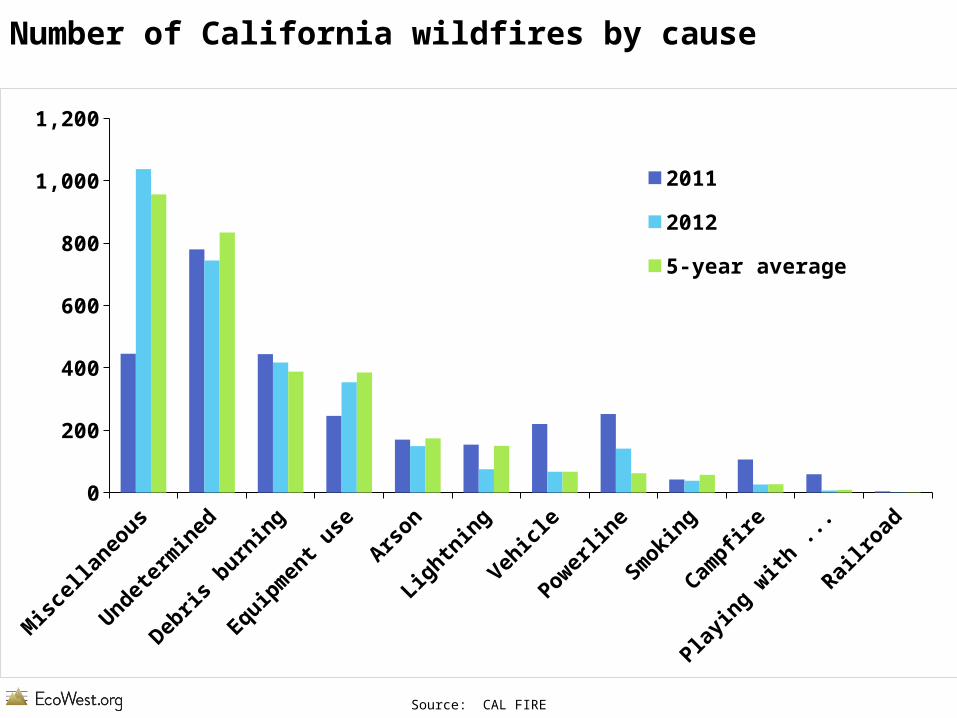
Number of California wildfires by cause
Misce
llane
ous
Und
eter
min
ed
Deb
ris bu
rnin
g
Equip
men
t use
Arson
Ligh
tnin
g
Vehic
le
Power
line
Smok
ing
Campfi
re
Playing
with
fire
Railroa
d0
200
400
600
800
1,000
1,200
2011
2012
5-year average
Source: CAL FIRE
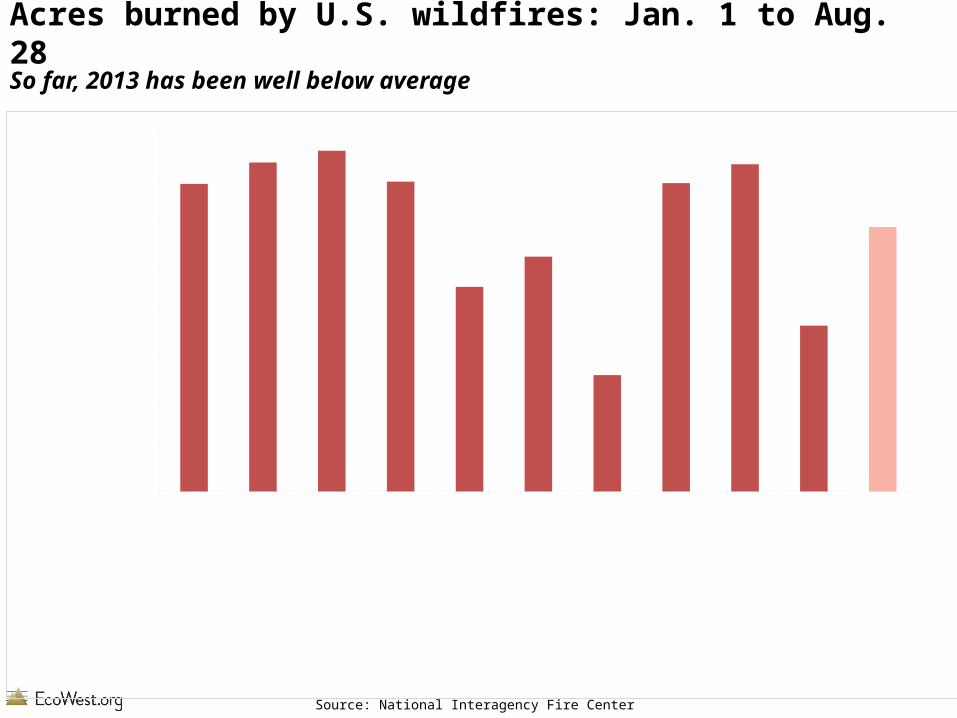
Acres burned by U.S. wildfires: Jan. 1 to Aug. 28
Source: National Interagency Fire Center
2004
2005
2006
2007
2008
2009
2010
2011
2012
2013
2004
-201
2 av
e...
0
1,000,000
2,000,000
3,000,000
4,000,000
5,000,000
6,000,000
7,000,000
8,000,000
Millions
So far, 2013 has been well below average
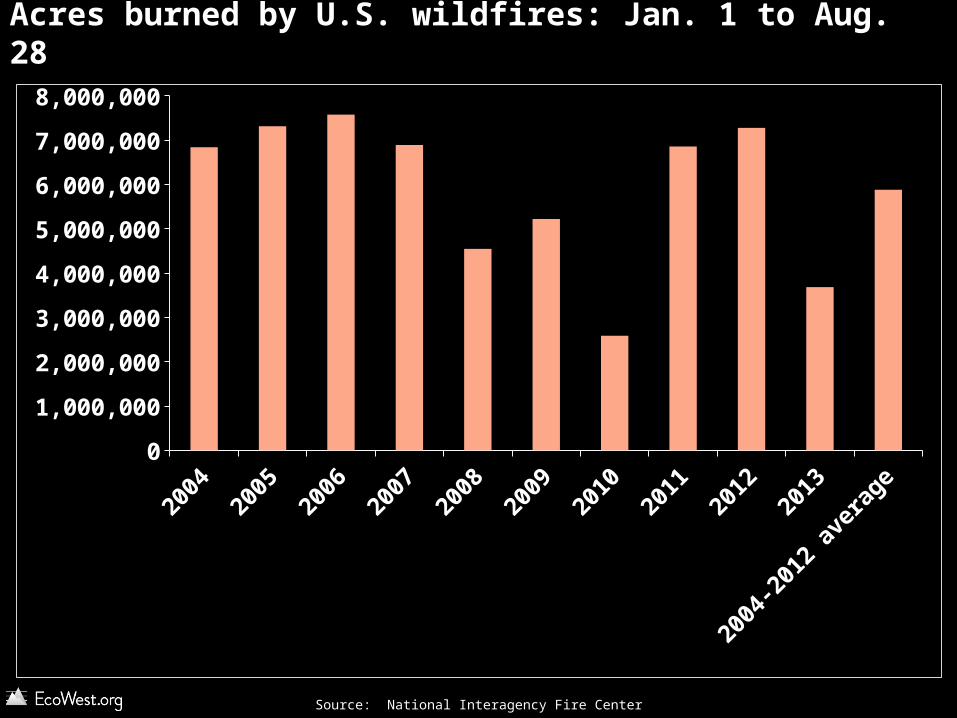
Acres burned by U.S. wildfires: Jan. 1 to Aug. 28
Source: National Interagency Fire Center
2004
2005
2006
2007
2008
2009
2010
2011
2012
2013
2004
-201
2 av
erag
e0
1,000,000
2,000,000
3,000,000
4,000,000
5,000,000
6,000,000
7,000,000
8,000,000
ecowest.org
Download more slides and other resources