Embed Size (px)
Citation preview

ETUI-REHS RESEARCH DEPARTmEnT
Putting a number on job quality?Constructing a European Job Quality Index
Janine Leschke and Andrew Watt, with Mairéad Finn
WP 2008.03

Putting a number on job quality? Constructing a European Job Quality Index
Janine Leschke and Andrew Watt, with Mairéad Finn
WP 2008.03
European Trade Union Institute
for Research, Education and Health and Safety (ETUI-REHS)
Brussels, 2008 © Publisher: ETUI-REHS aisbl, Brussels All rights reserved Print: ETUI-REHS Printshop, Brussels
D/2008/10.574/10
ISSN 1994-4446 (print version)
ISSN 1994-4454 (pdf version) The ETUI-REHS is financially supported by the European Community. The European Community is not responsible for any use made of the information contained in this publication.
WP 2008.03 3
Contents
1. Introduction ............................................................................................................................................................................................................................................ 5
2. Overview of existing work in the field ............................................................................................................................................................ 5
3. The European Job Quality Index ............................................................................................................................................................................. 7
4. Constructing the JQI ............................................................................................................................................................................................................. 14
5. Conclusion .......................................................................................................................................................................................................................................... 16
Appendix I: Calculating gender-disaggregated wages .................................................................................................................. 17
Appendix II: Coding of variables, response categories and treatment of missing variables ................ 18
Appendix III: The sensitivity of the results to changes in the weightings ......................................................... 20
Discussion and Working Papers ................................................................................................................................................................................... 24


WP 2008.03 5
1. Introduction
The stated goal of the European Union’s Lisbon Strategy, launched in 2000, was to create ‘more and better jobs’ in Europe. Although lagging behind the targets set – an employment rate of 70%, 60% and 50% for total employment, women and elderly workers respectively by 2010 – some progress has been achieved in bringing more Europeans into paid employment. Moreover, unemployment has come down to levels not seen in many countries since the 1980s.
But what about the goal of ‘better jobs’? This has been part of the European employment policy agenda since the Belgian presidency of 2001, and, most recently, under the German EU presidency in January 2007 agreement was reached on a set of policy principles covering ‘good work’. However, there is a widespread perception that many of the new jobs being created are ‘bad jobs’. Increasingly workers are being asked, or forced, to work longer and/or more ‘unsocial’ hours, and to accept fixed-term and other ‘precarious’ contracts. Employers are widely seen as being more short-term in orientation, cutting back on investing in training the workforce, offering limited career trajectories and employee benefits and being less open to engage with collective forms of worker interest representation. Is it the case, then, that ‘more jobs’ has been at the cost of ‘better jobs’? Is there a conflict of goals at work? To answer such questions it is necessary to go beyond anecdotal evidence and reference to individual aspects, such as part-time or fixed-term work. What is needed is an indicator of job quality that is comprehensive, comparable, European in scope and timely.
The ETUI-REHS research department seeks to contribute to this aim by creating a European Job Quality Index. By compiling indicators and creating an index, we hope to assess in a more encompassing way the nature of job quality in Europe. The aim of producing an annual quantitative index of job quality in Europe is to permit a tracking of shifts over time and a comparison between countries at any given time. The JQI should permit an evaluation of the changing labour market that goes beyond the unemployment and employment rates that are the standard indicators dominating the policy debate.
2. Overview of existing work in the field
As part of the Decent Work Agenda, the ILO has sought to conceptualise aspects of job quality with its Key Indicators of the Labour Market. This brings together twenty characteristics related to employment (status, sector, hours), lack of work, characteristics of jobseekers, education, wages and compensation costs, labour productivity and the working poor. These indicators are relatively broad, and go rather beyond job quality with a strong focus on developing countries.
The European Foundation for the Improvement of Living and Working Conditions (hereafter Eurofound) has developed very detailed indicators to measure job quality in its European Working Conditions Survey (EWCS), a survey we will draw on for the Good Jobs Index. However, it is only conducted every five years; Tangian (2007) analyses the 2005 EWCS to produce a quality index for Europe. Furthermore, in 2004-2005 the Eurofound (2006a, 2006b) conducted the Establishment Survey on Working Time and Work-Life Balance. However, it exclusively focuses on job quality issues relating to working time arrangements in companies. Eurofound regularly reports on quality of work and employment in Europe and single countries. The reports are based on different
Janine Leschke and Andrew Watt, with Mairéad Finn
6 WP 2008.03
data sources, among them the European Labour Force Survey (LFS), the European Community Household Panel (ECHP), relevant specific data collections provided by Eurostat and the European Working Conditions Survey.1
Within the context of the European Employment Strategy, the Employment Committee has drawn up an extensive list of indicators to monitor member states’ adherence to the European Employment Strategy (EES).2 Most of these indicators refer to the performance of the employment system (e.g. regional unemployment differentials) as a whole and particularly to the welfare and labour market policy institutions and measures (e.g. activation measures). Despite the professed focus on ‘better jobs’ in the EES, there is little attempt systematically to evaluate the quality of jobs themselves.3
In its 2001 report ‘Employment in Europe’, the European Commission (2001) used ECHP data to compare self-reported satisfaction with earnings, job security, working time, working hours, work content, work control, working conditions and work related health. It also used objective measures of job security, work conditions, training possibilities and career prospects, and productivity and pay. This report was comparative in nature and detailed, but was a one-off survey.
A ‘Good Jobs Index’ to enable comparisons between countries and over time has been developed by the Global Policy Network.4 It is currently in the testing stage. Variables included are wage differentials between men and women, the unemployment gap between men and women, and between young and adult workers, real wages, the official unemployment rate, the underemployment rate, the percentage of workers with temporary contracts, workers covered by social security, the collective negotiation rate, the unionisation rate, and the number of ratified ILO agreements. This conceptualisation includes also ‘macro’ labour market indicators and those more relevant to a global context such as ILO conventions. A number of relevant indicators available for Europe are excluded, not being available for less developed countries.
Brisbois (2003) researches job quality in Canada, the US and several European countries in a comprehensive way including information on health and well-being, skills development, work-life balance issues and employment security. There is no comparison over time, and indeed Brisbois recommends this for future research.
Of course there are many studies of individual countries. Howell and Diallo (2007) propose for the USA indicators to measure important dimensions of job quality including the low wage share and involuntary part time. This approach is potentially comparative and would permit regular assessment but is very limited in terms of indicators used. Lower-Basch (2007) identifies wages and earnings, benefits, job security, advancement opportunities, work schedule, health and safety, and worker voice as aspects of job
1 For the most recent reports refer to http://www.fr.eurofound.europa.eu/working/studies/tn0612036s/index.htm. 2 Available from: http://ec.europa.eu/employment_social/employment_strategy/pdf/list_indicators_2007_en.pdf. 3 For an analysis and critical review of the monitoring and analytical indicators underpinning the employment
guidelines, see Peña-Casas 2007. 4 See http://www.gpn.org/research/gji/GJI_Proposal.pdf.

Putting a number on job quality? – Constructing a European Job Quality Index
WP 2008.03 7
quality to be researched. This framework is set in the American context and so does not address comparative issues. Furthermore, no attempt is made to compile the indicators in order to arrive at an overall index of job quality. Two recent research reports provide detailed year by year analysis of job quality in Canada and Flanders in Belgium, respectively. Both studies provide broad and detailed conceptualisations of job quality, strongly supported by suitable data (Eurofound 2007, Lowe 2007), with comparisons available over time. The German Trade Union Confederation (DGB 2007) has embarked on a detailed survey of German workers regarding job quality. Such studies have the advantage of offering great detail, but are restricted to single countries/regions, with no between-country comparison.
The ETUI-REHS European Job Quality Index seeks to fill a gap in this literature by providing an indicator that enables comparison both over time and between European countries, using a broad but focused conceptualisation of job quality that can be up-dated at regular intervals.
3. The European Job Quality Index
3.1. Coverage and periodicity
The ETUI-REHS Job Quality Index will be calculated annually for each of the member countries of the European Union together with a European JQI for the EU-27 as a whole. The first JQI will be for 2007 and based largely on 2006 data or the most recently available statistics in early 2008. For the EU15 countries a baseline index, using slightly different indicators, will be calculated for the year 2000 – the first year of the Lisbon process – in order to be able to assess trends over time. For the EU-27 countries data is unfortunately too patchy to do so. A separate JQI will be produced for men, women and the total for each country, enabling conclusions to be drawn about gender differences in various countries and possible converging or diverging trends between men and women.
3.2. Sub-indices
Job quality is a multifaceted phenomenon. To reflect this, the European JQI is compiled on the basis of six sub-indices that capture different aspects of job quality. The following sub-indices have been defined: wages, non-standard forms of employment, work-life balance and working time, working conditions and job security, access to training and career advancement, and collective interest representation and participation.
The choice of these sub-indices reflects a number of considerations. All these themes are issues that – either self-evidently or on the basis of attitude surveys – affect workers’ perception of whether or not they hold a ‘good job’. On the other hand the choice of indices is restricted. Firstly, issues relating to the social insurance and welfare systems have not been included. The focus is on the employment relationship itself. This is, however, a possible extension for future work. Secondly, data limitations necessarily curtailed the choice of sub-indices. Data issues are discussed more in detail in the next section. For each of these sub-indices, a number of indicators were selected and combined: this is discussed below.

Janine Leschke and Andrew Watt, with Mairéad Finn
8 WP 2008.03
Most of the data used can be considered as ‘objective’: official measures of average salaries, proportion of part-time contracts etc. A number of indicators are based on ‘subjective’ assessments of respondents to questions about their working conditions, for instance questions relating to stress at work. However, we opted not to include overall subjective measures of job satisfaction, as in a sense this measure could be seen as a substitute for the JQI as a whole, but would exclude many objective factors, and the only comparable survey of job satisfaction is only conducted every five years (Eurofound).
3.3. Data availability
Because we need an index that covers the EU-27 countries, is comparable over time and allows yearly updates, the choice of data and indicators is restricted. Data provided by Eurostat – especially the European Labour Force Survey (LFS)5 – fulfil all three requirements. They cover all the EU countries, provide yearly data for most indicators, are issued on a timely basis and the results are harmonised thus, in principle, ensuring comparability between countries. Furthermore, the data are disaggregated by gender. For some indicators there are gaps in the most recent data for a number of countries, in these cases the values of the previous year will be used. Appendix II provides details of codings and the procedures used to deal with missing variables.
While Eurostat provides data for indicators such as non-standard forms of employment, life-long learning and accidents at work, it does not cover topics such as the question if working hours fit with family or social commitments or how the intensity of work and possibilities for career advancement are judged by workers. In this respect, the European Working Conditions Survey (EWCS)6 is more suitable. The downside of this data is that it is only issued every five years and that some questions are not held constant in successive surveys. The survey was conducted in 2000, the year that will be used as reference/basis year for the EU15 job quality index, and the latest data available is for 2005. The EWCS also allows separate analysis for men and women.
Information on voluntary part-time employment used to be available in the LFS data but this is no longer the case. We therefore use the Community Statistics on Income and Living Conditions (EU-SILC) for this indicator.
Wages are not adequately covered for the purposes of this index either by the LFS or the EWCS: data are missing for many countries or the frequency is not high enough. The
5 The LFS is a representative household sample survey that is carried out at a quarterly basis in the 27
member states of the European Union (and some other countries). The LFS is a rotating random sample survey of persons in private households aged 15 years or older. The quarterly sampling rates vary between 0.2% and 3.3% in each country. Harmonisation is achieved through the use of common principles of questionnaire construction, common definitions of main variables and reply categories, the use of common classifications and the central processing of the data by Eurostat (for more information refer to http://epp.eurostat.cec.eu.int/ and European Commission 2003).
6 The EWCS is carried out every five years by the European Foundation for the Improvement of Living and Working Conditions. The first survey took place in 1990/1991. In 2001/02 it was extended to cover the ten new member states as well as Bulgaria, Romania and Turkey. The surveys provide an overview of the state of working conditions throughout Europe, and indicate the extent and type of changes affecting the workforce and the quality of work (for more information refer to http://www.eurofound. europa.eu/ewco/surveys/index.htm).
Putting a number on job quality? – Constructing a European Job Quality Index
WP 2008.03 9
JQI uses the AMECO database of the European Commission, DG Ecfin (see more detailed discussion below). 7
For the issues of collective interest representation we rely on a specific database (ICTWSS) drawn up by Jelle Visser, University of Amsterdam, to which he has kindly given us access; some small gaps are filled based on an ETUI research department analysis (Keune 2006).
Combining these main data sources enables a greater breadth of indicators to be used, while permitting annual updating of the index even if some of the indicators only change every five years. One problem is that even within one survey the content, and sometimes also the wording of questions and the response categories change over time. Due to this fact we had to omit some of the job quality components that we initially planned to include and, for future updates, we can never be sure that all of the variables that we are using for the initial year 2006 will be available in the same form in future survey years. For the EU15 JQI a number of indicators had to be excluded because they are not available for 2000. On the other hand, we were able to take account of the important issue of health and safety at the workplace for the EU15 (included as part of sub-index 4), for which data are not available for the EU27.
3.4. Selection of indicators
The following paragraphs will explain the composition and rationale of the six different fields that are thought to be important to assess job quality. Every field of job quality is made up of at least two8 and a maximum of four indicators (some of which are themselves composites) (see Table 1). Where appropriate, i.e. where the indicators measure ‘bad jobs’, they are inverted.
Wages are arguably the most important field in regard to job quality. They not only influence people’s current income situation, and thus their scope to obtain material goods and also the extent to which they can participate in society. They also have longer-term influences in that social security benefits and pensions are usually at least to some extent based on former wages. What is important for the worker’s welfare is the purchasing power of the wage earned. Unfortunately data limitations and problems of cross-country and over-time comparison made certain compromises inevitable.9 The indicator is based on the AMECO series nominal compensation per employee (NCE), which is readily available, timely and comparable. The figures are expressed in current-
7 Information on gross monthly earnings for employees is also included in the Community Statistics on
Income and Living Conditions (EU-SILC). The EU-SILC data have the advantage that monthly earnings are available for men and women and not only as an aggregate total as is the case in AMECO. On the other hand, the EU-SILC data due to their complexity are not available as timely as the LFS data and at the moment a number of countries do not provide gross but only net figures on monthly earnings (for more information refer to http://epunet.essex.ac.uk/EU-SILC_UDB.pdf).
8 In the case of the EU15 JQI, only one indicator is available for skills and career development. 9 The ILO’s KILM database has real wages disaggregated by gender, for instance, but only for the
manufacturing sector – of increasingly limited relevance in EU countries – and subject to substantial caveats about cross-country comparability. The EWCS includes questions on wages that are very detailed, but such information is only available every five years. The ELFS also has detailed questions, but data coverage is very patchy. The Eurostat Structure of Earnings survey also suffers from gaps in the data and is not available annually.

Janine Leschke and Andrew Watt, with Mairéad Finn
10 WP 2008.03
year PPS (purchasing power standard), which takes account of the differences in purchasing power between countries. Because the consumption basket and relative prices are constantly changing, it is methodologically difficult to compare figures simultaneously across space and time. The nominal PPS figures can be deflated with a price index, to take account of the erosion of worker’s spending power by inflation of the prices of goods and services, but this procedure is sensitive to the base year chosen. Nevertheless this procedure was adopted – deflation using the consumer price index for the country in question – as otherwise the fact of real wage convergence in Europe would be excluded from the time comparison aspect of the JQI, while being an important part of the cross-country comparison. A number of drawbacks of the NCE indicator should be noted. Firstly it includes employer and employee social insurance contributions, and so does not measure direct purchasing power. This is acceptable, for present purposes, however, because the contributions constitute a ‘social wage’ that, in the form of benefits and pensions, contributes to workers’ welfare. Secondly the figures are only available ‘per employee’ and thus are influenced by changes in working time (for instance they may be reduced by the inclusion of greater numbers of part-timers). Thirdly they are not available by gender. The size of the gender pay gap (in hourly wages, available from Eurostat) is used to calculate an approximation to male and female wages.10 The resulting indicator is not entirely satisfactory, but is, we believe, the best available proxy for this important variable given the demands of the data that result from the way the JQI is constructed.
In addition to average spending power from wages, it is desirable to adjust for equity and distributional concerns. The same average figure should be ‘worth’ less, in our normative assessment, if it is associated with greater wage inequality, and particularly a greater incidence of relative poverty of those in work. We seek to capture this by including an indicator of the share of working poor in the employed population, defined as those individuals who are classified as employed and whose household equivalised disposable income is below 60% of national median equivalised income (Eurostat). This measure is focused only on people in work and to this extent picks up this aspect of job quality. However, the indicator takes into account the household size, and as such is sensitive to composition effects. The household income measure includes the impact of taxes, social insurance contributions and benefits. While this clearly extends beyond a narrow definition of ‘job quality’ it does allow for differences in welfare systems that impact on the distribution of actual disposable income by worker-households. Overall, this is not an ideal measure but to our knowledge is the best available.
Non-standard forms of employment have long been on the European and national policy agendas, partly in the belief that they increase the employment opportunities of groups such as the unemployed, women and low qualified. Previous research has shown that non-standard forms of employment are problematic in job quality terms, however, especially when they are exercised involuntarily (Scheele 2002, Eurofound 2003, Leschke 2007). They are often connected with less job security, disadvantages in social security benefit coverage and lower access to fringe benefits and further training. It is therefore important to take account of the incidence of such forms of employment in the
10 Male wages equal total wages divided by the sum of the employment share of men and that of women
times 1 minus the gender pay gap. We multiply the male wage by 1 minus the gender pay gap to get the female wage. For details see appendix I.

Putting a number on job quality? – Constructing a European Job Quality Index
WP 2008.03 11
job quality index. This sub-index is made up of two indicators: temporary employment and part-time employment as shares of total employment. Both are adjusted for the reason that this form of employment is exercised: only workers that state as the reason that they could not find, respectively, a permanent or a full-time job are taken into account. Thus only non-standard employment that is clearly exercised involuntarily is considered. Both indicators are calculated from Eurostat LFS data.
The third job quality field is working time and work-life balance. It is made up of four indicators: excessive working hours and atypical working hours (available in the LFS), voluntary part-time employment (available in the EU-SILC), and the share of workers that agree that their working hours fit family or social commitments (available in the EWCS). Atypical working hours (a composite indicator of the proportion of workers on shift work, Saturday work, Sunday work, night work and evening work, of which a simple average is taken) as well as excessive working hours (the share of workers who usually work more than 48 hours a week) are known to have negative effects on work-life balance and deleterious health effects (Eurofound 2006a). Voluntary part-time employment (defined as all part-time workers that declare that their reason for working less than 30 hours is that they do not want to work more hours), on the other hand, is included in this sub-index, as surveys suggest that those who work part time voluntarily are satisfied with their work-life balance (European Commission 2001: 68). This indicator will be supplemented by the share of workers that state that their working hours fit family or social commitments, an indicator that directly measures work-life balance, although with the disadvantage that it is only available every five years.
Another important field to assess job quality is working conditions and job security. Four indicators that try to capture the situation in the industrial as well as in the services sector are used for this field: work intensity, work autonomy, physical work factors and the reported likelihood of job loss within the next six months. All four indicators are available in the EWCS, the first three are simple averages of a number of components, the fourth is a stand-alone indicator. Intensity of work is made up of information on the proportion of workers ‘working at a very high speed’, ‘working to tight deadlines’ and ‘not having enough time to get the job done’. Work autonomy comprises information on the proportion that can ‘choose or change the order of tasks, the methods of work and the speed of work’. Physical work factors include information on the exposure to vibrations, noise, high and low temperature, smoke, fumes, powder, dust, vapors, radiation, tobacco smoke and infectious materials; furthermore, it includes information on handling chemical substances, tiring or painful positions, lifting or moving people, carrying or moving heavy loads, standing or walking, and repetitive hand or arm movements. Unfortunately, the necessary reliance on the EWCS for all the indicators in this field means that this sub-index will only change every five years.
For the EU15 JQI a reduced number of indicators had to be used for physical work factors, as not all were available or measured in the same way in 2000. On the other hand it was possible to incorporate the important question of health and safety at the workplace. We use the standardised incidence rate of accidents at work available in the European Statistics on Accidents at Work provided by Eurostat. It can only be used for the EU15 calculations, because for the new member states absolute figures are not available, but only rates of change. More detailed information on other aspects of health

Janine Leschke and Andrew Watt, with Mairéad Finn
12 WP 2008.03
and safety at work – occupational diseases, preventive measures etc. – would be a useful addition to the JQI, but comparative and timely data is not available.
The fifth field that is taken into account is skills and career development, which captures the extent to which workers have the opportunity to develop their skills during working life and are thus able to enjoy progressive career development, rather than being stuck in dead-end jobs. A problem in regard to this indicator is that the extent of skills development at the workplace will vary depending on the extent and formalisation of initial education, and this differs between European countries. There is no indicator readily available to account for this problem. In order to at least in part allow for different training needs varying by initial education, the first indicator is restricted to adults and captures the share of those in the working population who have participated in education/training over the four weeks prior to the survey. This information is available in the Eurostat data. The second indicator is taken from the EWCS and captures the average share of people that state that their job offers good prospects for career advancement. Only the first indicator is available for the EU15 JQI.
The last field that is taken into account is collective interest representation and voice. A sense of ‘voice’ by workers is known to be conducive to job satisfaction, however it is difficult to operationalise. It would be preferable to incorporate a number of indicators summarising collective interest representation at the workplace, but there is not even comparative information over time on the presence of a staff association or works council at the workplace. This sub-index will therefore be made up of three indicators that, even when taken together, only go a certain way towards capturing collective interest representation. From the ICTWSS database11 we take the proportion of workers whose pay and conditions are covered by collective bargaining. Such coverage is beneficial for a sense of collective voice on the part of workers, and has been shown to correlate positively with a range of desirable outcomes from the point of view of workers (ILO 2004). Membership of a trade union offers workers protection against arbitrary behaviour on the part of employers and is more generally an indicator of the collective force of working people.12 We use the union density figures from the ICTWSS database. Some missings are filled with reference to an ETUI-REHS study (Keune 2006). Lastly, as a more subjective, but also more direct measure, we include the share of workers that report that they are consulted about changes in work organisation, according to the EWCS (not available in 2000 and so excluded for the EU15 JQI).
Table 1 gives an overview of the indicators in each sub-index that will make up the job quality index, their source and the respective weighting (discussed below). Some of the indicators are coded inversely in the original data source, i.e. higher numbers indicate worse job quality; to take account of this we subtract them from one hundred, as they are all expressed in percentages. For detailed information on the coding of the different indicators refer to appendix II.
11 Currently still unpublished. The data were kindly made available by Prof. Jelle Visser. 12 At the same time union membership is subject to many national-specific, institutional and cultural factors,
and is thus a poor measure in a cross-country comparison. The case of France, with very low union density, but a high mobilisation capacity and also alternative avenues of workplace representation is well known. Unfortunately comparative data on such representation forms are not available.

Putting a number on job quality? – Constructing a European Job Quality Index
WP 2008.03 13
Table 1: Sub-indices and their indicators in the EU27 JQI
Sub-indices Indicators Data source Weighting
Nominal compensation per employee in PPS deflated using CPI; gender figures estimated using gender pay gap
AMECO/ Eurostat
70 Wages
In-work poverty (those individuals who are classified as employed whose household equivalised disposable income is below 60% of the national median equivalised income)
Eurostat 30
Temporary employment as % of total number of employees*% of temps indicating that main reason was that they could not find permanent job
Eurostat, LFS 50 Non-standard forms of employment
Part-time employment as % of total number of em-ployees*% of part-timers indicating that main reason was that they couldn’t find full-time job
Eurostat, LFS 50
Share of employees working more than 48 hours a week
Eurostat, LFS, customized tables
25
Average of % of workers on shift work; Saturday work; Sunday work; night work; evening work
Eurostat, LFS 25
Voluntary part-time work (the share of people working less than 30 hours who state as reason that they do not want to work more hours)
EU-SILC 25
Working time and work-life balance
“Working hours fit in with family/social commitment”
EWCS 25
‘Work intensity’ (working at a very high speed, working to tight deadlines and not having enough time to get the job done)
EWCS 25
‘Work autonomy’ (can choose/change order of tasks, methods of work, speed of work)
EWCS 25
‘Physical work factors’ (vibrations, noise, high/low temperature, breathing in smoke, fumes, powder, dust, vapours such as solvents and thinners, handling chemical substances, radiation, tobacco smoke from other people, infectious materials, tiring or painful positions, lifting or moving people, carrying or moving heavy loads, standing or walking, repetitive hand or arm movements)
EWCS 25
Working conditions and job security
“I might lose my job in the next six months” EWCS 25

Janine Leschke and Andrew Watt, with Mairéad Finn
14 WP 2008.03
Sub-indices Indicators Data source Weighting
% of population (25-64 years) participating in education/training over four week prior to survey
Eurostat, LFS
60 Skills and career development
‘My job offers good prospects for career advancement’
EWCS 40
Collective bargaining coverage ICTWSS database; supplemented by national reports/expert opinions
40
Trade union density ICTWSS database; supplemented by national reports/expert opinions
30
Collective interest representation
Consulted about changes in work organisation EWCS 30
4. Constructing the JQI
This approach to constructing the European JQI, based on sub-indices and a range of individual indicators has the major advantage of enabling us to take an encompassing view of this multi-dimensional phenomenon. On this basis it can also be determined to what extent countries cumulate ‘good’ or ‘bad’ job quality characteristics or, in contrast, offset good or bad elements along one dimension with opposite characteristics in another. At the same time this approach raises a number of methodological problems in arriving at a single JQI.
4.1. Aggregating indicators – normalisation
The first problem is that the different types of data associated with the various indicators cannot simply be added to each other or otherwise combined. This is true with respect both to calculating a national JQI and also to comparisons between countries. For example, the proportion of workers on temporary contracts (measured in %) cannot simply be added to absolute pay levels (in euros). Even with indicators that are superficially of the same form (e.g. expressed in % of the workforce) problems can arise if the cross-country variation in one indicator is much greater than in another: simple addition then effectively swamps the second indicator with less variance, although small variations in it may be considered important for assessing job quality.
For this reason the data for each indicator have to be normalised. This is done by setting a maximum value and a minimum value for each indicator. These minima/maxima are expressed in the relevant unit (euros, percentage points). The minimum value is then subtracted from the maximum value and also from the value for the country in question. The latter is then divided by the former, giving a figure that ranges between zero and one for each indicator. Expressed mathematically the formula for indicator i and country a is: (valueia-mini)/(maxi-mini)
Putting a number on job quality? – Constructing a European Job Quality Index
WP 2008.03 15
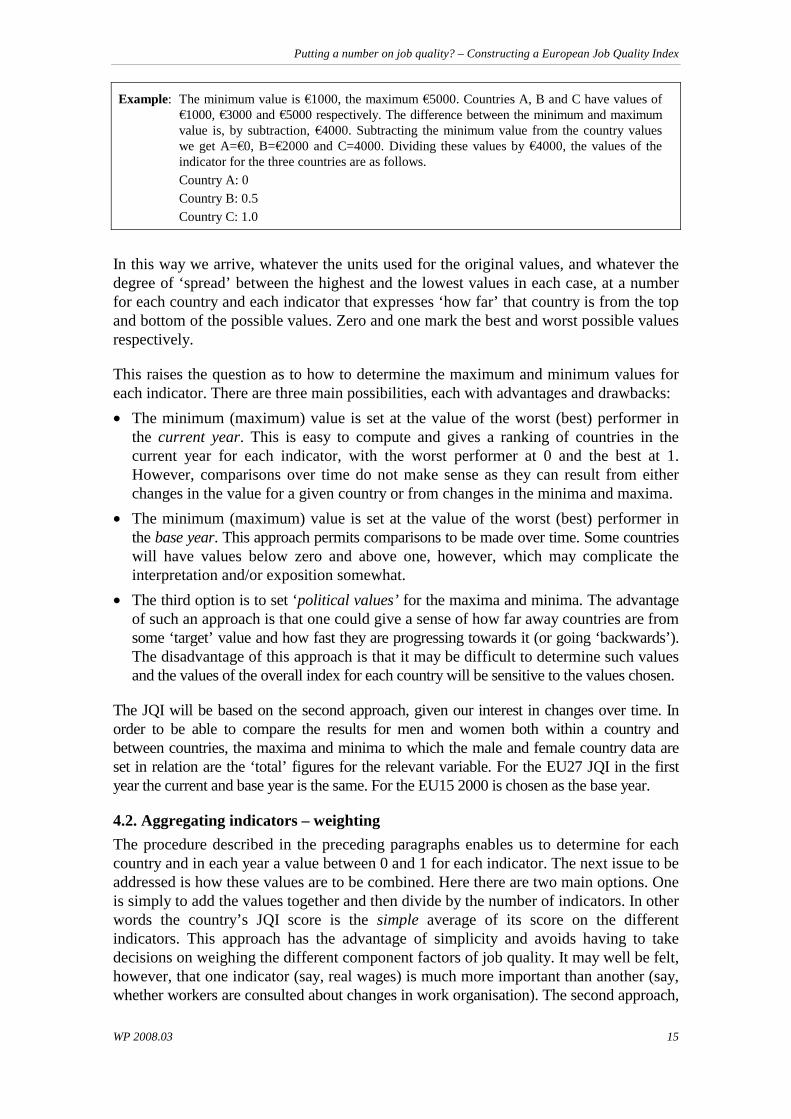
Example: The minimum value is €1000, the maximum €5000. Countries A, B and C have values of €1000, €3000 and €5000 respectively. The difference between the minimum and maximum value is, by subtraction, €4000. Subtracting the minimum value from the country values we get A=€0, B=€2000 and C=4000. Dividing these values by €4000, the values of the indicator for the three countries are as follows.
Country A: 0 Country B: 0.5 Country C: 1.0
In this way we arrive, whatever the units used for the original values, and whatever the degree of ‘spread’ between the highest and the lowest values in each case, at a number for each country and each indicator that expresses ‘how far’ that country is from the top and bottom of the possible values. Zero and one mark the best and worst possible values respectively.
This raises the question as to how to determine the maximum and minimum values for each indicator. There are three main possibilities, each with advantages and drawbacks:
• The minimum (maximum) value is set at the value of the worst (best) performer in the current year. This is easy to compute and gives a ranking of countries in the current year for each indicator, with the worst performer at 0 and the best at 1. However, comparisons over time do not make sense as they can result from either changes in the value for a given country or from changes in the minima and maxima.
• The minimum (maximum) value is set at the value of the worst (best) performer in the base year. This approach permits comparisons to be made over time. Some countries will have values below zero and above one, however, which may complicate the interpretation and/or exposition somewhat.
• The third option is to set ‘political values’ for the maxima and minima. The advantage of such an approach is that one could give a sense of how far away countries are from some ‘target’ value and how fast they are progressing towards it (or going ‘backwards’). The disadvantage of this approach is that it may be difficult to determine such values and the values of the overall index for each country will be sensitive to the values chosen.
The JQI will be based on the second approach, given our interest in changes over time. In order to be able to compare the results for men and women both within a country and between countries, the maxima and minima to which the male and female country data are set in relation are the ‘total’ figures for the relevant variable. For the EU27 JQI in the first year the current and base year is the same. For the EU15 2000 is chosen as the base year.
4.2. Aggregating indicators – weighting
The procedure described in the preceding paragraphs enables us to determine for each country and in each year a value between 0 and 1 for each indicator. The next issue to be addressed is how these values are to be combined. Here there are two main options. One is simply to add the values together and then divide by the number of indicators. In other words the country’s JQI score is the simple average of its score on the different indicators. This approach has the advantage of simplicity and avoids having to take decisions on weighing the different component factors of job quality. It may well be felt, however, that one indicator (say, real wages) is much more important than another (say, whether workers are consulted about changes in work organisation). The second approach,
Janine Leschke and Andrew Watt, with Mairéad Finn
16 WP 2008.03
therefore, is to weigh the indicators in accordance with the perceived differences in relative importance. The JQI is then the weighted average of the scores on the different indicators. The problem with this approach is that we have to put a very precise percentage figure, in a subjective assessment, on the relative importance of indictors that are very different in nature. Many people may agree on whether one indicator is more important than another – although depending on the pair of indicators chosen, even this might not be the case – but they are unlikely to agree by how much their relative importance differs. Thus weighting indicators introduces a strong subjective, not to say arbitrary, element into the indicator.
To address these issues the following ‘mixed’ approach has been adopted. No attempt is made to weigh the six different sub-indices of the JQI. Thus no view is taken on the relative importance of, say, ‘working conditions and job security’ and ‘skills and career development’. Effectively then, the sub-indices are calculated separately and exist side by side. Countries can be compared on the basis of these sub-indices as well as on the JQI overall. A country’s JQI is the sum of its scores on these sub-indices divided by six (the number of sub-indices).
At the same time, the contributions of the two, three or four different indicators to each sub-index are weighted. For instance it is proposed to weight the two components of the first sub-index (‘real wages’ and ‘in-work poverty’) 0.7 and 0.3 respectively. (Obviously the weightings have to sum to one.) This introduces an element of subjectivity, but one that appears manageable because it is the relative importance of a limited number of indicators contributing to one particular aspect of job quality (and thus likely to be rather similar in nature). The sensitivity of the overall results to changes in these subjective weights has been checked for four sub-indices (wages, non-standard employment, skills and career development and collective interest representation), where weighting changes might have been expected to influence the results. Appendix III details the results. It emerges that plausible moderate shifts in these weightings do not lead to fundamentally different rankings for the sub-indices in question. Indeed the overall and the gender rankings proved remarkably stable. Moreover, no systematic pattern of advantage or disadvantage – such as a ‘bias’ against new member states or ‘liberal’ economies – seemed to emerge across the sub-indices, suggesting that a country may well gain on one sub-index what it loses on another as a result of a weighting decision.
5. Conclusion
The ETUI-REHS Job Quality Index is intended as an important and ongoing contribution to the debate about ‘more and better jobs’ in Europe. This note has detailed a number of important data restrictions and caveats that need to be placed when interpreting the results. However, the added-value of having a comparative, regularly updated index along a number of dimensions for all the European countries make this seem worthwhile.
The required data for 2007 have been collected and processed. Currently, the first index for the EU27 is being calculated, enabling us to make robustness checks and identify problems. The comparative index 2000-2005/7 for the EU15 has been calculated and initial results published as part of the ELNEP report on the euro area economy; see www.elnep.org/. Full results will soon be made available to the research community.

Putting a number on job quality? – Constructing a European Job Quality Index
WP 2008.03 17
Appendix I: Calculating gender-disaggregated wages
How to calculate the male wage (WM) and female wage (WF) from the total wage (WT), the male and female employment shares (a and b, where a+b=1) and the gender pay gap expressed as a decimal (g).
WT = aWM + bWF total wages are a weighted average of male and female wages, and so
WM = (WT-bWF)/a and
WF = (WT-aWM)/b
g = (WM-WF)/WM the gender pay gap (expressed as a decimal) equals the difference between the male and female wage divided by the male wage
So we can express female in terms of male wages as
WF = WM – gWM or
WF = WM (1– g) female wages equal males wages times one minus the gender pay gap
Replacing female wages with this expression in the first equation we can express male wages in terms of total wages, the two employment shares and the gender pay gap as follows:
WT = aWM + b*WM*(1-g)
WT = WM*[a+b*(1-g)] so
WM = WT/[a+b*(1-g)]
In words: male wages are total wages divided by the sum of the employment share of men and that of women times 1 minus the gender pay gap.
Using the above equation for female wages we multiply the male wage by 1-g to get the female wage.
An example:
If total wages are €30 000 and men and women make up 60 and 40% of employment respectively, and the gender pay gap is reported as 15%, then the male wage is
€30 000/(0.6+0.4*(1-0.15))
€30 000/(0.6+0.4*0.85)
€30 000/0.94
= €31 915
If we multiply this by 1-g=0.85 we get for the female wage
WF = €27 128
We can check the result
WT = 0.6*€31 915 + 0.4*€27 128
= €19 149 + €10 851
= € 30 000

Janine Leschke and Andrew Watt, with Mairéad Finn
18 WP 2008.03
Appendix II: Coding of variables, response categories and treatment of missing variables,
EU27 JQI
Wages
− Nominal compensation per employee in PPS (AMECO).
− In Work Poverty: ‘In Work at Risk of Poverty Rates by Age and Gender’ (Eurostat, defined as 60% of median income). Inverted.
Non-Standard Forms of Employment − Main reason for temporary employment: Could not find a permanent job. Multiplied by
temporary employees as % of total number of employees. Inverted.
− Main reason for part-time employment: Could not find a permanent job. Multiplied by part time employees as % of total number of employees. Inverted.
Work Life Balance and Working Time − Working hours fit family and social commitments: responses ‘well’ and ‘very well’. (out of
total of four categories- very well/ well/ not very well/ not at all well).
− Anti-Social working hours: % recorded working sat/sun/nights/evenings/shift work. Inverted.
− Excess hours: LFS data recoded into those working 0-48 hours and 49+ hours. Recorded those working 0-48 hours as % of total.
− Main reason for part-time employment: Did not want a full time job. Multiplied by part time employees as % of total number of employees.
Working Conditions and Job Security − Work intensity: High speed and tight deadlines: response categories were all of the time/
almost all of the time/ around ¾’s of the time/ around half of the time/ around ¼ of the time/ almost never/ never. Recorded %’s who answered ‘around half of the time’ and below’, to give non-work intensity.
Enough time to get the job done: responses were ‘almost always’ ‘often’ ‘sometimes’ ‘rarely’ ‘almost never’. Recorded %’s of those who answered ‘almost always’ and ‘often’.
− Physical Stress: 15 variables (EWCS q10a--> q10j, q11a --> q11e), all with same response categories: all the time/ almost all the time/ around ¾ of the time/ around half the time/ around ¼ of the time/ almost never/ never. %’s recorded were ‘¼ of the time’, ‘almost never’ and ‘never’.
− Work Autonomy: Choose or change order of tasks/ methods of work/ speed of work (q24a --> q24c), responses are yes or no. %’s who answered ‘yes’ were recorded.
Take break when wish (q25f), response categories were ‘almost always’ ‘often’ ‘sometimes’ ‘rarely’ ‘almost never’. Recorded %’s who answered ‘almost always’ and ‘often’.
− Worried about losing your job: Response categories were strongly agree/ agree/ neither agree nor disagree/ disagree/ strongly disagree. %’s recorded for those who ‘strongly disagree’ and ‘disagree’.

Putting a number on job quality? – Constructing a European Job Quality Index
WP 2008.03 19
Skills and Career Development − % of population aged 25-64 participating in education and training over 4 weeks prior to survey.
− Good prospects for career advancement: Response categories were strongly agree/ agree/ neither agree nor disagree/ disagree/ strongly disagree. %’s recorded for those who ‘strongly agree’ and ‘agree’.
Collective Interest Representation − Consulted about changes in work organisation over the last year: response categories were
yes/no. Recorded %’s who answered ‘yes’.
Missings Filled in 2006
(T = total, M = male, F = female)
Wages: − In Work Poverty:
− Bulgaria and Romania: average figure for EU-10.
− EU-27 calculated using weights from Eurostat
Non-Standard Forms of Employment: − Temporary Employment:
− Estonia T2005 used, with M/F calculated from 2004 proportions.
− Malta: T2006 available only. M/F calculated using 2005 proportions
− Part-time Employment
− Ireland: 2004 data used.
− Estonia/Luxembourg/Malta/Slovakia: No M2006 data. Calculated from T/F using weighted average of M and F employment.
− EU aggregates calculated using Eurostat country weights.
Work Life Balance and Working Time: − Anti-Social Working Hours: Evening work n/a for Portugal. The total for Portugal is
calculated as the average of the four variables available
− Voluntary Part Time Work:
− Malta, Bulgaria and Romania: EU10 average.
− EU-27 calculated using weights from Eurostat.
Collective Interest Representation − Collective Bargaining Coverage and Trade Union Density:
A number of missings from ICTWSS were filled in using Keune (2006).
No figures for M/F available: figures for T were used for both genders.
EU aggregates calculated using Eurostat country weights.

Janine Leschke and Andrew Watt, with Mairéad Finn
20 WP 2008.03
Appendix III: The sensitivity of the results to changes in the weightings
In four sub-indices experiments were conducted to test the sensitivity of preliminary calculations of the country rankings to plausible changes in the weightings accorded to the different indicators. The results are presented below. Such experimental changes were not made to the two sub-indices (working conditions, work-life balance) involving a 25/25/25/25 weighting. It is hard to imagine plausible reasons for adjusting these weightings, as the different indicators are rather similar in nature.
Wages and wage equality
The suggested weighting was 70/30 for wages (at purchasing power parity) and in-work poverty. This seemed plausible, giving the prime weight to average purchasing power and then a smaller weight to equality and specifically the (inverse of) the in-work poverty rate. Changing the weight to 80/20, decreases the value of the correction for inequality and tends to reward wealthier and less equal countries. However the changes in rankings are very limited. The top six countries are the same (with Germany and Luxembourg changing places, as are the bottom nine countries (with two pairs of countries swapping places). Only the UK and Greece experience a significant improvement in ranking (three places), whereas the Czech Republic falls back four positions. Increasing the weighting on inequality slightly (to 33.3) has very little effect on the rankings compared with the 70/30 split. The picture is similar for the gender-specific rankings. This suggests that the weighting chosen, while ultimately only justifiable in a normative way, seems defensible; limited changes, at least, have only a marginal impact on the rankings. While a completely different weighting (e.g. a reversal to 30/70) would produce major differences, it seems hard to justify such a choice, implying as it does a much greater attention to within-country than to between-country inequality, which does not square well with the idea of a comparative European index.
Non-standard employment
The involuntary part-time and temporary employment weightings were set at 50/50. In the absence of strong reasons for the contrary, the ‘default option’ would seem to be to give these two features an equal weighting. For the ‘total’ rankings, shifting the weighting in either direction (60/40 or 40/60) produces only minor changes. The top six countries are the same (with minor re-ordering), dominated by new member states (and Luxembourg) in any case. The degree of reordering at the bottom is somewhat greater. But only Slovenia moves more than two positions (four downwards) if temporary work is weighted higher than part-time work. Perhaps at first sight surprisingly, given the known relevance of gender differences for non-standard work, the same is also true of the gender rankings. Indeed if anything the rankings for men and for women were more stable in the face of weighting shifts. This suggests that the incidence of both types of non-standard contract on an involuntary basis is similar (or at least is ranked in a similar way) across the countries for both men and women.

Putting a number on job quality? – Constructing a European Job Quality Index
WP 2008.03 21
Skills and career development
This sub-index was split 60/40, favouring (objective) figures on life-long learning to (subjective) data on prospects for career advancement (which are also only available every five years). The rankings were extremely insensitive to a shift to a balanced 50/50 weighting. The top and bottom countries are virtually identical. Only Greece is significantly affected (losing four places). The same is true of a (larger) shift in the other direction (75/25). Apart from a fall of three places for Luxembourg, there are no significant shifts. The findings also apply to the gender rankings. It seems that the two rather different indicators are closely correlated.
Collective interest representation
In perhaps the most difficult ex ante weighting case, it was decided to put weights of 30/40/30 on (self-reported) consultation, collective bargaining coverage and union density respectively. Although a very important area, good indicators for workers’ ‘voice’ at the workplace are hard to come by. The weightings chosen undoubtedly have a degree of arbitrariness. The weighting chosen was preferred ex ante over the simpler, even 33/33/33 split, as union density is often considered – for example by the OECD in the context of analyses of labour market institutions – to be less informative than bargaining coverage. Emphasising bargaining coverage more at the expense of the two other indicators (25/50/25) made very little difference: the top eight countries are the same (with one country pair changing positions). Even lower down the rankings, changes were limited to two places in all but a couple of cases. Surprisingly, even for France, well known for its extremely low density and yet high bargaining coverage, the change ‘only’ led to an improvement of four positions (and a rise in value of just under 0.1). If, instead, the ‘consultation’ measure is privileged (35/40/25), few significant changes in rankings ensue. In this sub-index gender-disaggregated figures were not available.
Conclusion
The results of these sensitivity analyses are encouraging. The weightings chosen ex ante were to some degree arbitrary, although plausible arguments could be made for them. It emerges that (equally) plausible moderate shifts in these weightings do not lead to fundamentally different rankings for the sub-indices in question. Indeed the overall rankings proved remarkably stable. Moreover, no systematic pattern of advantage or disadvantage – such as a ‘bias’ against new member states or ‘liberal’ economies – seemed to emerge across the sub-indices, suggesting that a country may well gain on one sub-index what it loses on another as a result of a weighting decision.

Janine Leschke and Andrew Watt, with Mairéad Finn
22 WP 2008.03
References
Berg, J. and Cazes, S. (2007) “The Doing Business Indicators: Measurement Issues and Political Implications”, Economic and Labour Market Paper, Geneva: ILO. http://www.ilo.org/public/english/employment/download/elm/elm07-6.pdf
Brisbois, R (2003) “How Canada Stacks Up: The Quality of Work - An International Perspective”, Research Paper, Canadian Policy Research Networks: http://www.cprn.com/documents/25597_en.pdf
DGB (2007) DGB-Index Gute Arbeit 2007 – Der Report: http://www.dgb-index-gute-arbeit.de/
European Commission (2001) “Employment in Europe”, Luxembourg: http://ec.europa.eu/employment_social/employment_analysis/eie/2001_en.pdf
European Commission (2003) "The European Union labour force survey: Methods and definitions - 2001", Office for Official Publications of the European Communities, Luxembourg.
European Commission (15. June 2006) "EU-SILC user database description (draft)", Luxembourg: http://epunet.essex.ac.uk/EU-SILC_UDB.pdf
Eurofound (1995, 2000, 2001, 2005) “European Working Conditions Survey”, Dublin: European Foundation for the Improvement of Living and Working Conditions: http://www.eurofound.europa.eu/ewco/surveys/index.htm
Eurofound “Quality of Work and Employment in Europe”, Dublin: The European Foundation for the Improvement of Living and Working Conditions: http://www.fr.eurofound.europa.eu/working/studies/tn0612036s/index.htm
Eurofound (2003) "Flexibility and social protection: Reconciling flexible employment patterns over the active life cycle with security for individuals", Dublin: European Foundation for the Improvement of Living and Working Conditions.
Eurofound (2006a) “Working time and work-life balance in European companies: Establishment Survey on Working Time 2004-2005”, Dublin: European Foundation for the Improvement of Living and Working Conditions: http://www.eurofound.europa.eu/pubdocs/2006/27/en/1/ef0627en.pdf Eurofound (2006b) “Working time and work–life balance: a policy dilemma? Background paper”, Dublin: The European Foundation for the Improvement of Living and Working Conditions : http://www.eurofound.europa.eu/pubdocs/2006/96/en/1/ef0696en.pdf Eurofound (2007) The Flemish Workability Monitor: A Broad Focus on Quality of Work, Dublin: The European Foundation for the Improvement of Living and Working Conditions.
Eurostat, Data Navigation Tree: http://epp.eurostat.cec.eu.int/
Howell, D. (2005) Beyond Unemployment: Measuring Labour Market Performance Across Countries, Challenge 48 (1), 5-28.

Putting a number on job quality? – Constructing a European Job Quality Index
WP 2008.03 23
Howell, D. and Diallo, M. (2007) “Charting US Economic Performance with Alternative Labour Market Indicators: The Importance of Accounting for Job Quality”, SCEPA Working Paper 2007: http://www.newschool.edu/cepa/publications/workingpapers/SCEPA %20Working%20Paper%202007-6.pdf
ILO (2004) Economic Security for a Better World, Geneva: ILO.
Keune, M. (2006) Collective Bargaining Systems in Europe: A Schematic Overview, Brussels: ETUI-REHS. http://www.etui-rehs.org/education/Resources/Collective-Bargaining-a-Schematic-Overview
Leschke, J. (2007) “To what extent are temporary work and part-time work cushioned by different forms of security?”, in: H. Jørgensen / P. Madsen (eds.): Flexicurity and Beyond: Finding a new agenda for the European Social Model, DJØF Publishing, Copenhagen, 561-601.
Lowe, G. (2007) “21st Century Job Quality: Achieving What Canadians Want”, Ottawa: Canadian Policy Research Networks.
Lower-Basch, E. (2007) “Opportunity at Work: Improving Job Quality”, Policy Paper: Centre for Law and Social Policy. Opportunity at Work Series.
OECD (2004), "Employment Protection Regulation and Labour Market Performance". OECD Employment Outlook, OECD Paris, pp. 61-125.
Peña-Casas, Ramón (2007) ”Quality of Work and Employment in EU Policy Arena: Conceptual Frameworks and Monitoring Indicators”, Paper for the RECWOWE Network, manuscript: Brussels: Observatoire social européen.
Scheele, A. (2002) "Non-permanent employment, quality of work and industrial relations", European industrial relations observatory on-line (eironline).
Tangian, Andranik (2007) Is flexible work precarious? A study based on the 4th European survey of working conditions 2005, WSI Discussion paper, no. 153, Düsseldorf.

24 WP 2008.03
Discussion and Working Papers Marton Kovacs How do trade unions interact with the European Parliament WP 2008.02
Maarten Keune EU enlargement and social standards: exporting the European Social Model? WP 2008.01
Reiner Hoffmann and Otto Jacobi Bridging gaps – Strengthening Social Europe WP 2007.04 (E-D)
Béla Galgóczi, Maarten Keune and Andrew Watt Relocation: Challenges for European trade unions WP 2007.03
Thomas Blanke and Jürgen Hoffmann Towards a European Social Model Preconditions, difficulties and prospects of a European social policy WP 2007.02
Maarten Keune and Maria Jepsen Not balanced and hardly new: the European Commission’s quest for flexicurity WP 2007.01
Pragma Consulting Acquis Communautaire related to pensions DP 2005.02
Béla Galgóczi, Maarten Keune and Andrew Watt Relocation: Challenges for European trade unions DP 2005.01
Mariachiara Esposito and David Mum Pension funds in the European debate and within the multilevel decision-making of the European Union DWP 2004.02.02
Malene Nordestgaard and Judith Kirton-Darling Corporate Social Responsibility within the European sectoral social dialogue DWP 2004.01.01
Jürgen Hoffmann Co-ordinated continental European market economies under pressure from globa-lisation DWP 2004.02.01
WP 2008.03 25
Marcus Kahmann Changes in national trade union structures – Organisational restructuring by mergers in Central and Eastern Europe, Germany, the U.K., and Australia DWP 2003.02.02
Marcus Kahmann Trade unions and the growth of the information economy DWP 2003.02.01
Marcus Kahmann Trade unions and migrant workers: Examples from the United States, South Africa and Spain DWP 2002.02.03
Marcus Kahmann Trade unions and young people – Challenges of the changing age composition of unions DWP 2002.02.02
Anne Dufresne and Emmanuel Mermet Trends in the coordination of collective bargaining in Europe DWP 2002.01.02 (E-F)
Stefan Clauwaert International / transnational primary and secondary collective action DWP 2002.01.01 (E-F-D)
Jan Kunz Labour mobility and EU enlargement – a review of current trends and debates DWP 2002.02.01 (E)
Thorsten Schulten A European solidaristic wage policy? Conceptual reflections on a Europeanisation of trade union wage policy DWP 2001.01.01 (E)
Céline Lafoucrière Selected extracts from NAPs for employment 2000 and preliminary overview DWP 2000.02.02 (E)
Winfried Heidemann Lifelong learning and employability – is the European model of vocational training in crisis? DWP 2000.02.01 (E)
These publications can be downloaded free of charge from our website. Please visit: www.etui-rehs.org/research/publications