Embed Size (px)
Citation preview
Rockingham Central Elementary School
Safe Routes to School Travel Plan
Rockingham Central Elementary School
Safe Routes to School Travel Plan
May 2012
Mission Statement:
The Rockingham Central Elementary School (“school”) will provide education and training opportunities in order to develop students’ skills for safely walking and bicycling to and from school. The school will strive to encourage children to adopt lifestyle habits and transportation choices that promote wellness in their lives, school and community. Vehicle access, parking areas and bike/pedestrian facilities will be designed to provide a safe, welcoming and aesthetically pleasing environment for staff, parents, students and visitors.
1. Stakeholders- SRTS Team
The 2011/2012 stakeholder representatives are: Peter Lawry, Physical Educator Bruce Downer, School Principal Wendy Harty, 4th Grade Teacher Pam Murray, School Nurse Ellen Howard, Town Planning Staff Everett Hammond, Town Public Works Ron Lake, Chief of Police School PTO Members
2. Existing Conditions
As of June 2012, Central Elementary School is a Gold-level Partner with the Vermont Safe Routes to School Resource Center. This Partnership level is acquired by schools who have a comprehensive Safe Routes to School programs, blending all 5 E’s Education, Encouragement, Engineering, Evaluation, and Enforcement to create a sustainable culture of walking and biking to school. Attachment 1 provides the requirements fulfilled by CES to gain this Partnership level.
Student Locations During the 2011-2012 SRTS program year, 189 children in grades K-4 attended the School as shown below. This number fluctuated as high as 211 throughout the year.
Kindergarten 38 3rd grade 34 1st grade 37 4th grade 47 2nd grade 33
The School primarily serves the incorporated village of Bellows Falls and a few areas outside the village near Rt. 121, Rt. 5 and Rt. 103. A very small number of students typically come from the Saxtons River area each year. Figure 1 shows the household locations of students attending the school at the beginning of the 2009/2010 school year. Approximately 90% of the students were located within the village boundary. Of
these 180 students, approximately 80 were residing within ¼ mile of school, 75 were within ¼ - ½ mile, and 25 were between ½ and 1 mile from school. Thus, as a percentage of the entire student body, a figure of 155 out of 203, or about 75% would typically be within the commonly accepted suitable walking distance of one- half mile from school. Figure 2 shows the locations of 2009/2010 student households within the different distances from the school. Walkability Audit
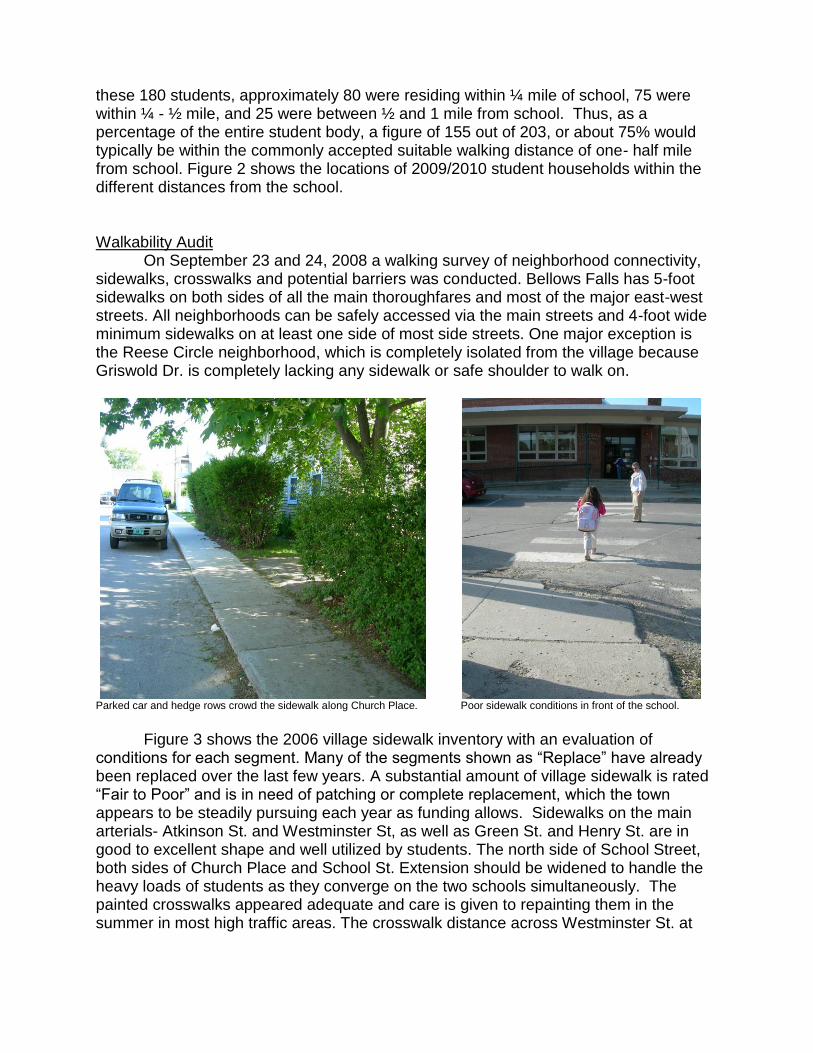
On September 23 and 24, 2008 a walking survey of neighborhood connectivity, sidewalks, crosswalks and potential barriers was conducted. Bellows Falls has 5-foot sidewalks on both sides of all the main thoroughfares and most of the major east-west streets. All neighborhoods can be safely accessed via the main streets and 4-foot wide minimum sidewalks on at least one side of most side streets. One major exception is the Reese Circle neighborhood, which is completely isolated from the village because Griswold Dr. is completely lacking any sidewalk or safe shoulder to walk on.
Parked car and hedge rows crowd the sidewalk along Church Place. Poor sidewalk conditions in front of the school.
Figure 3 shows the 2006 village sidewalk inventory with an evaluation of
conditions for each segment. Many of the segments shown as “Replace” have already been replaced over the last few years. A substantial amount of village sidewalk is rated “Fair to Poor” and is in need of patching or complete replacement, which the town appears to be steadily pursuing each year as funding allows. Sidewalks on the main arterials- Atkinson St. and Westminster St, as well as Green St. and Henry St. are in good to excellent shape and well utilized by students. The north side of School Street, both sides of Church Place and School St. Extension should be widened to handle the heavy loads of students as they converge on the two schools simultaneously. The painted crosswalks appeared adequate and care is given to repainting them in the summer in most high traffic areas. The crosswalk distance across Westminster St. at
the traffic light is quite long and the activated pedestrian signal barely affords enough time for smaller children to make it completely across the intersection.
3. Traffic Studies (to be updated in 2012/2013 school year)
In collaboration with the Windham Regional Commission (WRC), traffic studies were performed along School St. Extension (SSE) in September, 2008 and June 2009. Since traffic is one-way only on Church Place and SSE, and speeding wasn’t perceived to be a problem there, only number of vehicles per hour were collected. The counter was placed on SSE at approximately 150 feet west of Atkinson Street near the School/ Parks Place property line. Data was collected for eight days from Tuesday PM to the following Wednesday AM. The data show a dramatic peak in vehicle numbers during the morning drop-off (7:30-8:30am) and afternoon pick-up (2:30-3:30pm) times compared with the other parts of the day. (Figure 4 shows a sampling of the data.) The morning peak was typically much higher (20-30 additional cars) than the afternoon peak, indicating more students being dropped off and walking or taking the bus home. An ordinary day will have 60-80 cars in the morning and 30-50 in the afternoon. It was raining on Friday, September 26 and the table indicates there were 91 cars counted between 7:00- 8:00am! Traffic congestion combined with students being let out in many different areas and crossing the road at different locations is obviously a problem.
Both the elementary and middle school have voiced concerns about speeding on Atkinson Street. In 2003, a speed study was done by WRC in the area. Although, there are certainly local observations of speeding cars, the study showed that the average overall speed was close to the posted limit- 25 mph. Overall, 75% of the traffic studied was going between 25-35 mph, 20% were under the speed limit and just 5% were over 35 mph- most at night or on the weekend. The number of cars traveling along main routes like Atkinson and Westminster Streets during peak commute times is a serious concern though- it can range between 200-300 cars in one hour. The close proximity of two schools on the same schedules and commute routes amplifies the impacts of local traffic on this area. If the two schools staggered their schedules slightly it might alleviate some of this congestion- both on the roads and on the sidewalks.
4. Student In-Class Travel Mode Surveys
Using the Safe Routes to School “Student Arrival and Departure Tally Sheet”, classroom teachers asked students to show hands on how they travelled to school and how they would get home. Tallies were conducted in September 2008, June 2009, and May 2012. The results are shown in Attachment 2.
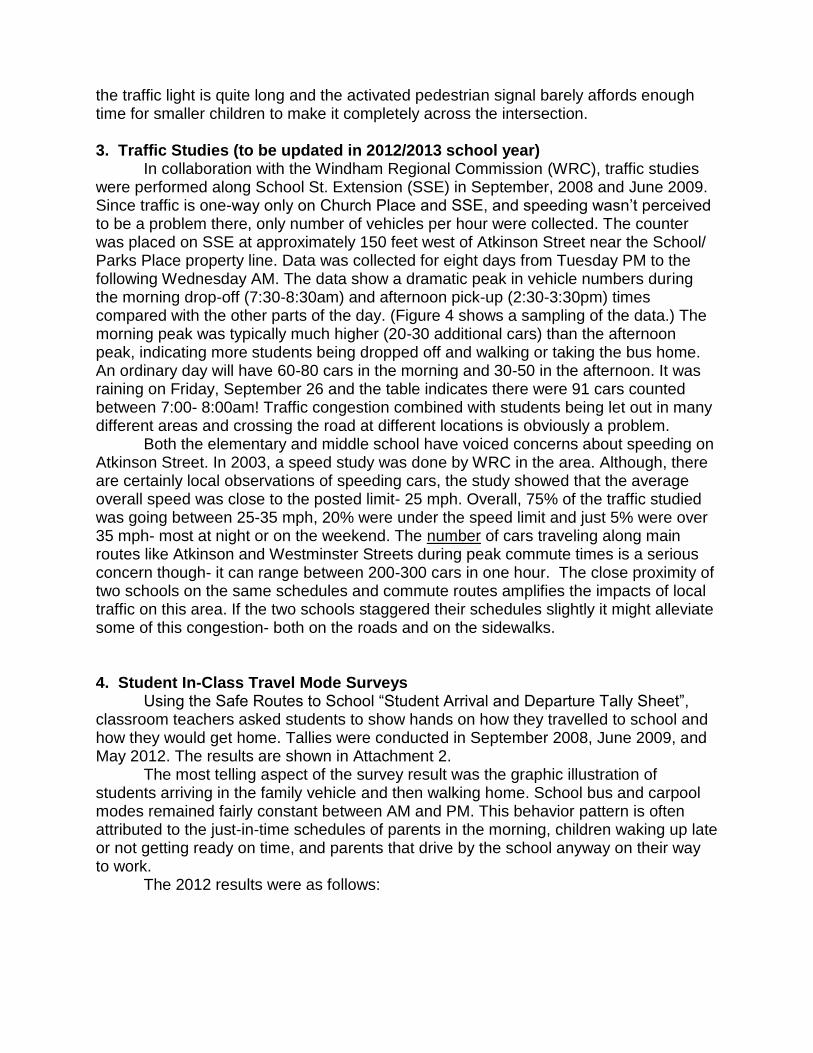
The most telling aspect of the survey result was the graphic illustration of students arriving in the family vehicle and then walking home. School bus and carpool modes remained fairly constant between AM and PM. This behavior pattern is often attributed to the just-in-time schedules of parents in the morning, children waking up late or not getting ready on time, and parents that drive by the school anyway on their way to work.
The 2012 results were as follows:
5. Parent Surveys about Travel Choices
In September 2008, the SRTS Parent Survey was handed out at the PTO meeting and distributed to all other parent/ guardians with the take-home school newsletter on October 1. A total of seventy-eight parents returned the survey by October 17.
70% of the respondents were from parents who lived within a ½-mile of the school within the village and thus had good pedestrian access. Of these respondents, only about half of them said their children walked to school on most days. Several interesting aspects of the Summary Report include:
- More students within a mile of school walked home than walked to school, which indicates that distance was not the deciding factor (except perhaps as a function of time, ie. potentially being late to school) - The proportion of walking students decreases with distance from the school and the proportion of vehicle use increases -79% of respondents say that their child has asked to walk or bike to school, though only 41%-51% actually do walk or bike to school In order, the issues which parents [of children who do not currently walk/bike to
school felt most strongly about in making their decision to not allow their child to walk or bike to school] were having adults to walk/ bike with (59%), weather (49%), safety of intersections (43%) and convenience of driving (43%). The 4th grade was the most popular choice for allowing the child to start walking to school. A good number of the parents made the comment that they would be interested in carpooling if they were familiar with the driver and someone organized it.
In May 2012, the SRTS Parent Survey was sent home to parents with a letter detailing the SRTS program and the purpose of the survey. A total of thirty-three parents returned the survey.
79% of the respondents were from parents who lived within a ½-mile of the school within the village and thus had good pedestrian access. Of these respondents, less than 40% said their children walked or biked to school on most days. Several interesting aspects of the Summary Report include:
- Walking drops off dramatically for students who live greater than ¼ mile from school - Students living ¼- ½ mile from school overwhelming arrive by car and then depart by bus -81% of respondents say that their child has asked to walk or bike to school, though only 38% actually do walk or bike to school
In order, the issues which parents [of children who do not currently walk/bike to school felt most strongly about in making their decision to not allow their child to walk or bike to school] were presence of violence or crime (70%), speed along traffic route (60%), safety of intersections (50%) and distance (45%). The 4th grade was the most popular choice for allowing the child to start walking to school. A good number of the parents made the comment that they would be interested in carpooling if they were familiar with the driver and someone organized it.
The Parent Survey Results is included as Attachment 3.
6. Staff Presentation
In Spring 2012, the Safe Routes to School champion presented to the school staff about Safe Routes to School and the goals of the data collection. He explained how the program will help the current walk to school efforts and encourage more students to walk and bike to school. 7. Walk to School Days
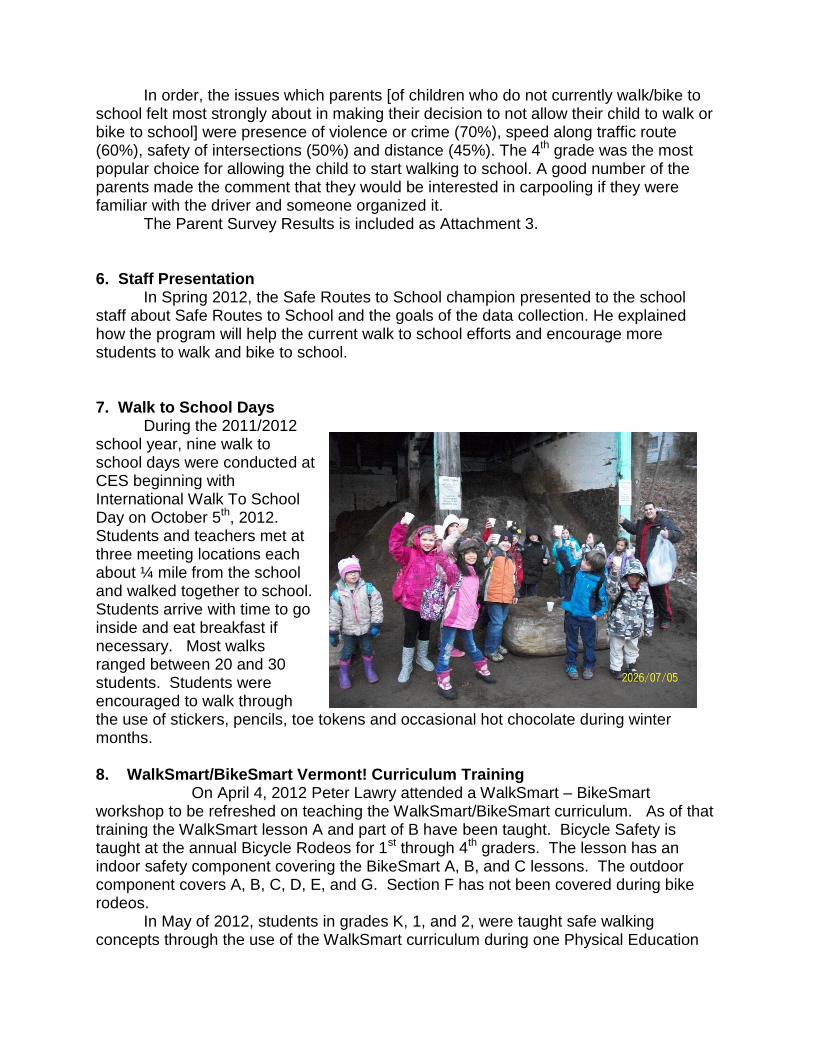
During the 2011/2012 school year, nine walk to school days were conducted at CES beginning with International Walk To School Day on October 5th, 2012. Students and teachers met at three meeting locations each about ¼ mile from the school and walked together to school. Students arrive with time to go inside and eat breakfast if necessary. Most walks ranged between 20 and 30 students. Students were encouraged to walk through the use of stickers, pencils, toe tokens and occasional hot chocolate during winter months. 8. WalkSmart/BikeSmart Vermont! Curriculum Training
On April 4, 2012 Peter Lawry attended a WalkSmart – BikeSmart workshop to be refreshed on teaching the WalkSmart/BikeSmart curriculum. As of that training the WalkSmart lesson A and part of B have been taught. Bicycle Safety is taught at the annual Bicycle Rodeos for 1st through 4th graders. The lesson has an indoor safety component covering the BikeSmart A, B, and C lessons. The outdoor component covers A, B, C, D, E, and G. Section F has not been covered during bike rodeos.
In May of 2012, students in grades K, 1, and 2, were taught safe walking concepts through the use of the WalkSmart curriculum during one Physical Education
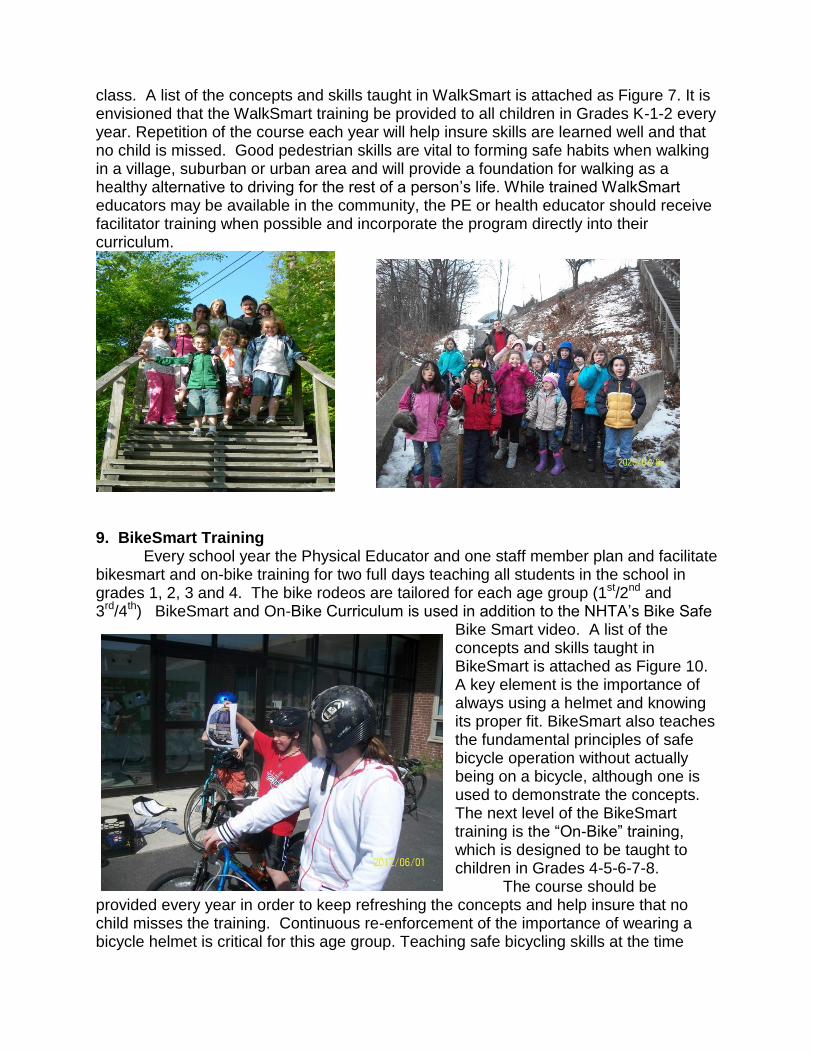
class. A list of the concepts and skills taught in WalkSmart is attached as Figure 7. It is envisioned that the WalkSmart training be provided to all children in Grades K-1-2 every year. Repetition of the course each year will help insure skills are learned well and that no child is missed. Good pedestrian skills are vital to forming safe habits when walking in a village, suburban or urban area and will provide a foundation for walking as a healthy alternative to driving for the rest of a person’s life. While trained WalkSmart educators may be available in the community, the PE or health educator should receive facilitator training when possible and incorporate the program directly into their curriculum.
9. BikeSmart Training
Every school year the Physical Educator and one staff member plan and facilitate bikesmart and on-bike training for two full days teaching all students in the school in grades 1, 2, 3 and 4. The bike rodeos are tailored for each age group (1st/2nd and 3rd/4th) BikeSmart and On-Bike Curriculum is used in addition to the NHTA’s Bike Safe
Bike Smart video. A list of the concepts and skills taught in BikeSmart is attached as Figure 10. A key element is the importance of always using a helmet and knowing its proper fit. BikeSmart also teaches the fundamental principles of safe bicycle operation without actually being on a bicycle, although one is used to demonstrate the concepts. The next level of the BikeSmart training is the “On-Bike” training, which is designed to be taught to children in Grades 4-5-6-7-8.
The course should be provided every year in order to keep refreshing the concepts and help insure that no child misses the training. Continuous re-enforcement of the importance of wearing a bicycle helmet is critical for this age group. Teaching safe bicycling skills at the time
when many children are learning to ride provides a solid foundation for enjoying it as recreation and as a healthy alternative to driving. Bike helmets are available at a reduced cost through Vermont Safe Kids (www.safekids.org). Orders may be placed through the Vermont Agency of Transportation. An order from is attached (Figure 11).
10. Bicycle Rodeo
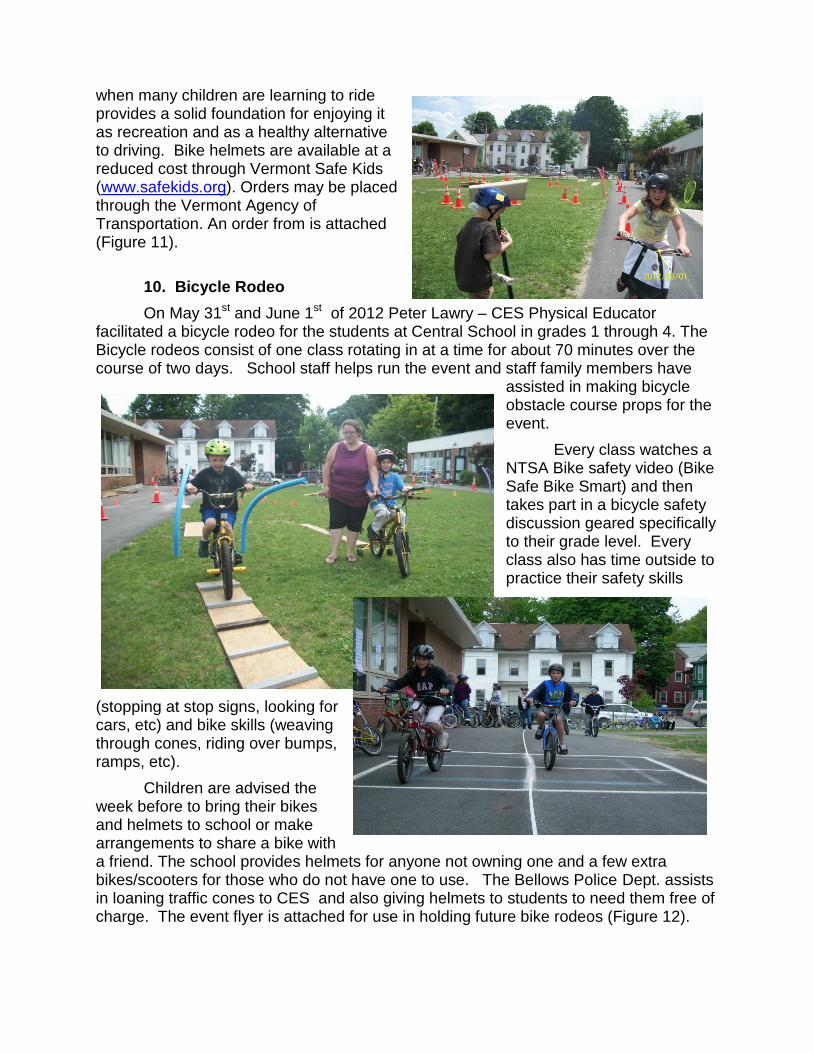
On May 31st and June 1st of 2012 Peter Lawry – CES Physical Educator facilitated a bicycle rodeo for the students at Central School in grades 1 through 4. The Bicycle rodeos consist of one class rotating in at a time for about 70 minutes over the course of two days. School staff helps run the event and staff family members have
assisted in making bicycle obstacle course props for the event.
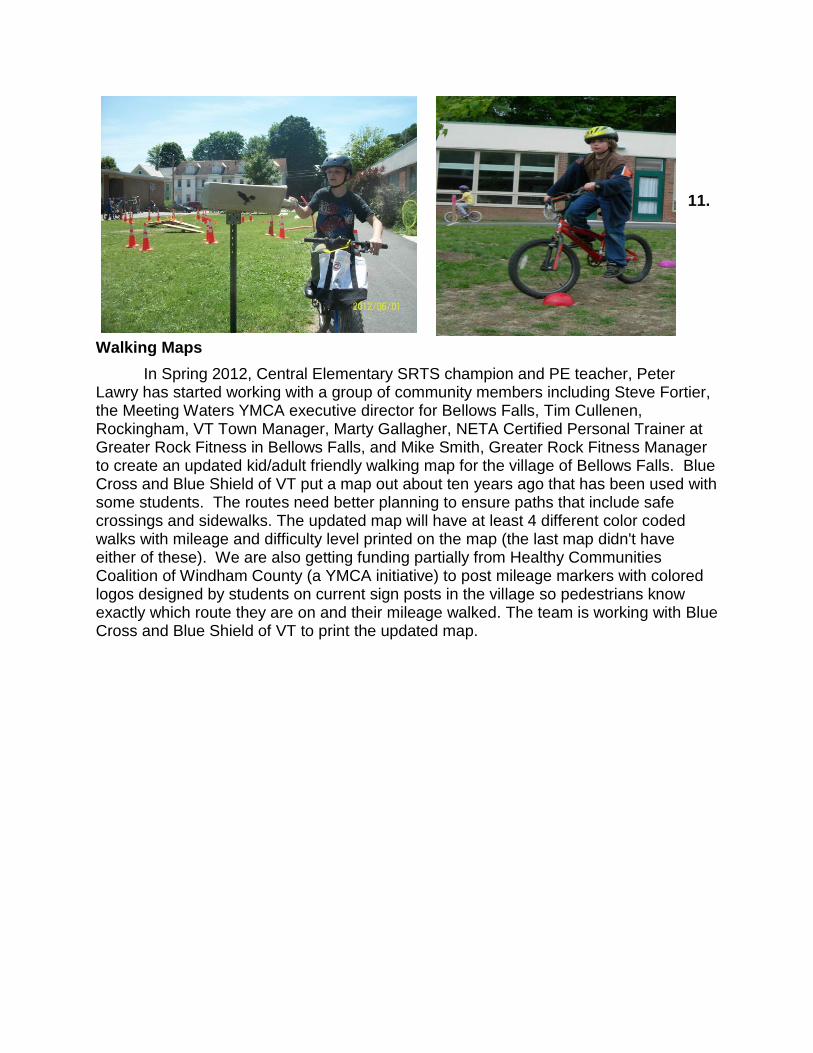
Every class watches a NTSA Bike safety video (Bike Safe Bike Smart) and then takes part in a bicycle safety discussion geared specifically to their grade level. Every class also has time outside to practice their safety skills
(stopping at stop signs, looking for cars, etc) and bike skills (weaving through cones, riding over bumps, ramps, etc).
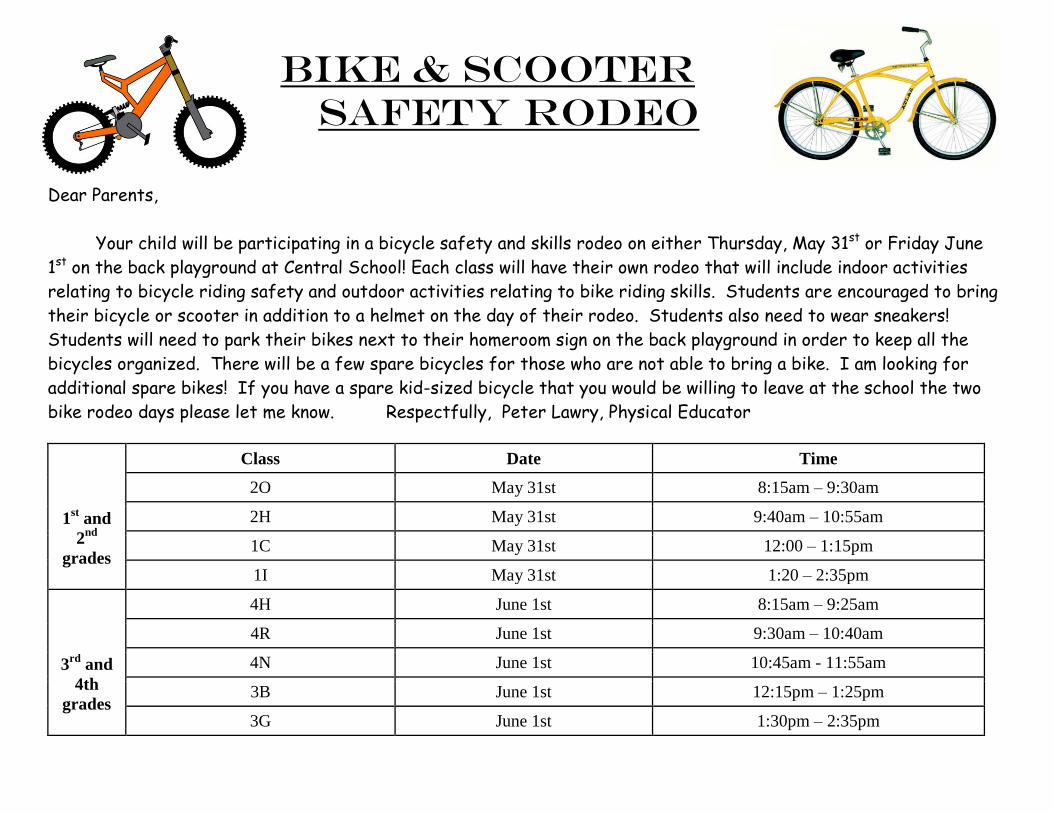
Children are advised the week before to bring their bikes and helmets to school or make arrangements to share a bike with a friend. The school provides helmets for anyone not owning one and a few extra bikes/scooters for those who do not have one to use. The Bellows Police Dept. assists in loaning traffic cones to CES and also giving helmets to students to need them free of charge. The event flyer is attached for use in holding future bike rodeos (Figure 12).
11.
Walking Maps
In Spring 2012, Central Elementary SRTS champion and PE teacher, Peter Lawry has started working with a group of community members including Steve Fortier, the Meeting Waters YMCA executive director for Bellows Falls, Tim Cullenen, Rockingham, VT Town Manager, Marty Gallagher, NETA Certified Personal Trainer at Greater Rock Fitness in Bellows Falls, and Mike Smith, Greater Rock Fitness Manager to create an updated kid/adult friendly walking map for the village of Bellows Falls. Blue Cross and Blue Shield of VT put a map out about ten years ago that has been used with some students. The routes need better planning to ensure paths that include safe crossings and sidewalks. The updated map will have at least 4 different color coded walks with mileage and difficulty level printed on the map (the last map didn't have either of these). We are also getting funding partially from Healthy Communities Coalition of Windham County (a YMCA initiative) to post mileage markers with colored logos designed by students on current sign posts in the village so pedestrians know exactly which route they are on and their mileage walked. The team is working with Blue Cross and Blue Shield of VT to print the updated map.
Rockingham Central Elementary School Safe Routes to School Travel Plan
May 2012
Attachments
1. Central Elementary School Partner Progress Report (June 2012)
2. Student Travel Summary Report (Sept., 2008) Student Travel Summary Report (June, 2009) Student Travel Summary Report (May, 2012)
3. Parent Survey Summary Report (January, 2009) Parent Survey Summary Report (May 2012)
4. Bike Rodeo and Scooter Safety Day Flyer (May 2012)

Bike & Scooter
Safety Rodeo
Dear Parents,
Your child will be participating in a bicycle safety and skills rodeo on either Thursday, May 31st or Friday June
1st on the back playground at Central School! Each class will have their own rodeo that will include indoor activities
relating to bicycle riding safety and outdoor activities relating to bike riding skills. Students are encouraged to bring
their bicycle or scooter in addition to a helmet on the day of their rodeo. Students also need to wear sneakers!
Students will need to park their bikes next to their homeroom sign on the back playground in order to keep all the
bicycles organized. There will be a few spare bicycles for those who are not able to bring a bike. I am looking for
additional spare bikes! If you have a spare kid-sized bicycle that you would be willing to leave at the school the two
bike rodeo days please let me know. Respectfully, Peter Lawry, Physical Educator
1st and
2nd
grades
Class Date Time
2O May 31st 8:15am – 9:30am
2H May 31st 9:40am – 10:55am
1C May 31st 12:00 – 1:15pm
1I May 31st 1:20 – 2:35pm
3rd
and
4th
grades
4H June 1st 8:15am – 9:25am
4R June 1st 9:30am – 10:40am
4N June 1st 10:45am - 11:55am
3B June 1st 12:15pm – 1:25pm
3G June 1st 1:30pm – 2:35pm


![STUDENT [PARENT] HANDBOOK Handbook 2017-2018.pdfSTUDENT AND PARENT HANDBOOK For the LANCASTER CENTRAL ELEMENTARY SCHOOL Welcome to Lancaster Central Elementary School. All the members](https://img.pdfslide.us/doc/110x75/5e2a5408f7734c394e4ad9dd/student-parent-handbook-2017-2018pdf-student-and-parent-handbook-for-the-lancaster.jpg)