Embed Size (px)
Citation preview
Full Terms & Conditions of access and use can be found athttps://www.tandfonline.com/action/journalInformation?journalCode=kvir20
Virulence
ISSN: (Print) (Online) Journal homepage: https://www.tandfonline.com/loi/kvir20
Putative determinants of virulence inMelissococcus plutonius, the bacterial agentcausing European foulbrood in honey bees
Daniela Grossar , Verena Kilchenmann , Eva Forsgren , Jean-DanielCharrière , Laurent Gauthier , Michel Chapuisat & Vincent Dietemann
To cite this article: Daniela Grossar , Verena Kilchenmann , Eva Forsgren , Jean-DanielCharrière , Laurent Gauthier , Michel Chapuisat & Vincent Dietemann (2020) Putative determinantsof virulence in Melissococcus�plutonius, the bacterial agent causing European foulbrood in honeybees, Virulence, 11:1, 554-567, DOI: 10.1080/21505594.2020.1768338
To link to this article: https://doi.org/10.1080/21505594.2020.1768338
© 2020 The Author(s). Published by InformaUK Limited, trading as Taylor & FrancisGroup.
View supplementary material
Published online: 26 May 2020. Submit your article to this journal
Article views: 763 View related articles
View Crossmark data Citing articles: 1 View citing articles
RESEARCH PAPER
Putative determinants of virulence in Melissococcus plutonius, the bacterialagent causing European foulbrood in honey beesDaniela Grossar a,b, Verena Kilchenmannb, Eva Forsgren c, Jean-Daniel Charrière b, Laurent Gauthierb,Michel Chapuisat a*, and Vincent Dietemann a,b*
aDepartment of Ecology and Evolution, Biophore, UNIL-Sorge, University of Lausanne, Lausanne, Switzerland; bAgroscope, Swiss BeeResearch Centre, Bern, Switzerland; cDepartment of Ecology, Swedish University of Agricultural Sciences SLU, Uppsala, Sweden
ABSTRACTMelissococcus plutonius is a bacterial pathogen that causes epidemic outbreaks of Europeanfoulbrood (EFB) in honey bee populations. The pathogenicity of a bacterium depends on itsvirulence, and understanding the mechanisms influencing virulence may allow for improveddisease control and containment. Using a standardized in vitro assay, we demonstrate thatvirulence varies greatly among sixteen M. plutonius isolates from five European countries.Additionally, we explore the causes of this variation. In this study, virulence was independent ofthe multilocus sequence type of the tested pathogen, and was not affected by experimental co-infection with Paenibacillus alvei, a bacterium often associated with EFB outbreaks. Virulencein vitro was correlated with the growth dynamics of M. plutonius isolates in artificial medium,and with the presence of a plasmid carrying a gene coding for the putative toxin melissotoxinA. Our results suggest that some M. plutonius strains showed an increased virulence due to theacquisition of a toxin-carrying mobile genetic element. We discuss whether strains with increasedvirulence play a role in recent EFB outbreaks.
ARTICLE HISTORYReceived 25 January 2018Revised 28 April 2020Accepted 30 April 2020
KEYWORDSEuropean foulbrood; EFB;Melissococcus plutonius;virulence; melissotoxin A;honey bee; Apis mellifera
Introduction
The Western honey bee (Apis mellifera L.) is an insectof major worldwide ecological and economic impor-tance. Honey bees produce honey and wax and polli-nate many economically important crops[1]. The recentloss of managed honey bee colonies in several regionsof the world threatens the ecological services providedby this pollinator [2–5]. Consequently, honey beehealth has become a major concern not only for scien-tists, but also for the public and policy-makers [6–8].Current research indicates that pathogens are a majorcause of colony losses. Honey bee pathogens includeviruses [9], protozoa [10], fungi [11], parasitic mites[12] and bacteria [7,9,13,14]. One of the most detri-mental bacterial diseases affecting honey bees isEuropean foulbrood (EFB). EFB is reported worldwide[15] and has emerged as an infectious disease since themid-eighties in the United Kingdom, since the year2000 in Switzerland and since 2010 in Norway[13,14,16,17]. High numbers of clinical cases have alsobeen reported from Finland, France, Greece, Holland,
Czechia and Italy [18–20], making EFB an economic-ally important veterinary disease [18,21].
The pathogenic agent of EFB, Melissococcus pluto-nius (Lactobacillales, Enterococcaceae) [22], enters theintestinal tract of honey bee larvae through contami-nated food provided by adult bees [23]. Once ingested,M. plutonius rapidly multiplies in the mid-gut lumen,possibly depriving the host of nutrients [24]. Diseasedlarvae typically change from white to a yellowish color,become flaccid and die 4–5 days after infection [23,25].The massive loss of brood resulting from severe infec-tion weakens the colony and can lead to its col-lapse [25].
To date, only broad-spectrum antibiotics such asoxytetracycline are available to treat EFB-affected colo-nies. Due to the risk of antibiotic resistance develop-ment [26,27] and an accumulation of residue in honey,the use of antibiotics is not a sustainable method tocontrol EFB and is banned in some countries. In theabsence of efficient treatment and given the severity ofEFB outbreaks, 79 countries worldwide have classified
CONTACT Daniela Grossar [email protected]; [email protected] Department of Ecology and Evolution, Biophore, UNIL-Sorge, University of Lausanne, Lausanne 1015, Switzerland
*These authors contributed equallyThe authors have no potential conflicts of interest to disclose.
Supplemental data for this article can be accessed here.
VIRULENCE2020, VOL. 11, NO. 1, 554–567https://doi.org/10.1080/21505594.2020.1768338
© 2020 The Author(s). Published by Informa UK Limited, trading as Taylor & Francis Group.This is an Open Access article distributed under the terms of the Creative Commons Attribution License (http://creativecommons.org/licenses/by/4.0/), which permits unrestricteduse, distribution, and reproduction in any medium, provided the original work is properly cited.
EFB as a notifiable disease (World Animal HealthInformation Database, OIE [28]). In 22 of these coun-tries, veterinary authorities destroy symptomatic colo-nies and monitor neighboring apiaries to avoid thefurther spread of the pathogen, which is costly andtime-consuming. This situation calls for new controlstrategies, but their development is constrained by thelimited knowledge of the pathogenesis of EFB [23].
Virulence is central to pathogenesis. A better knowl-edge of the mechanisms that determine this trait couldcontribute to the design of improved control methods.Indeed, virulence factors are promising targets for specificdrugs or management measures [29]. Such measuresinclude curing honey bee colonies hosting less virulentpathogens and restricting the use of destructive controlmethods to treat infections caused by more virulentpathogens [30]. An assessment of the extent and causesof virulence variation in strains ofM. plutonius may thusprove useful in controlling EFB more efficient and moresustainable to improve honey bee health.
Early reports [31,32] suggested that M. plutoniusisolates were genotypically and phenotypically homo-geneous. As a result, variation in virulence was notexpected. The discovery of genetic differences betweenisolates [33–40] has challenged this view. Differences invirulence have indeed been documented withinM. plutonius, with strains defined as atypical by Araiet al.,2012 [34], killing a higher proportion of hosts ina shorter time period than typical strains. Differences invirulence also occur between typical strains, dependingon experimental conditions [41,42]. However, no viru-lence factor has yet been clearly identified.
Several factors are likely to influence the virulence ofpathogens. One is the impact of secondary agents [43].In the case of EFB, saprophytic species such asPaenibacillus alvei, Enterococcus faecalis, Brevibacilluslaterosporus or Achromobacter eurydice cause secondarybacterial infections that might increase damage to larvae[23,44]. However, their influence in EFB is debated[42,45–47]. Another potential cause of variation in viru-lence is the growth dynamics of the bacterial pathogen.Bacterial strains that multiply rapidly and reach highdensities can cause more damage to the host [48,49].Other major factors influencing virulence include theproduction of biologically active compounds, such asadhesins improving attachment to host cells, enzymesdegrading host tissues, or toxins disturbing the physio-logical processes of the host [50–55].
Experiments aimed at quantifying the virulence ofM. plutonius and identifying factors that influence viru-lence have been hampered by the complex social envir-onment of the honey bee colony that affects the spread
and growth of the bacteria [56,57], and by the legalobligation to destroy colonies showing disease symp-toms [14]. These constraints can be overcome byexperimentally infecting honey bee larvae rearedin vitro. In the past, such assays were consideredimpossible due to M. plutonius loss of infectivity duringbacterial sub-cultivation [46,56,58]. More recently, sev-eral studies using the in vitro larval rearing method [59]have circumvented this problem [34,41,42,47,60–62],making standardized quantification of virulence possi-ble without any sanitary risk to the colonies in the field.
In this study, we reared honey bee larvae in vitro andinfected them with M. plutonius to investigate the causesand extent of variation in virulence. We screened17 M. plutonius isolates collected from five Europeancountries for genetic differences and measured their viru-lence over the entire developmental period of workerbrood. We examined whether virulence was associatedwith M. plutonius multilocus sequence type (MLST), co-infection with P. alvei, differences in growth dynamics ina culture medium and presence of a putative toxin-codinggene [39]. We discuss whether M. plutonius strains withhigh virulence play a role in recent EFB outbreaks andwhether they could be targets for more sustainable controlmeasures of the disease.
Results
Virulence of M. plutonius strains
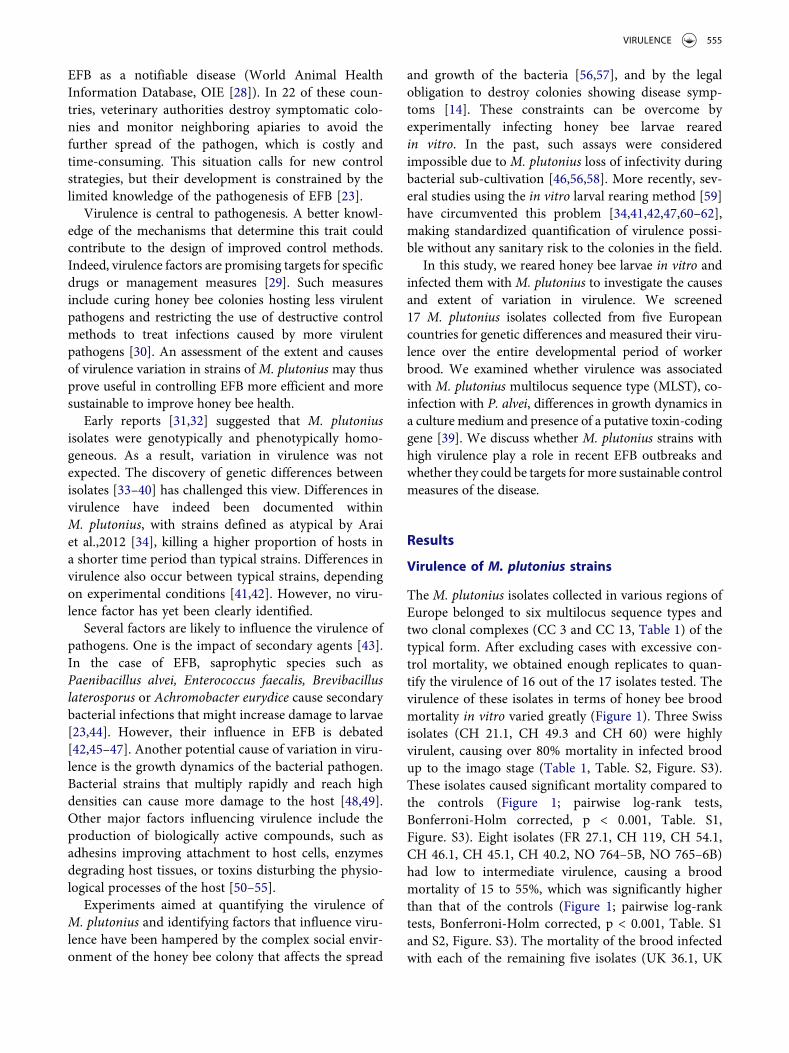
The M. plutonius isolates collected in various regions ofEurope belonged to six multilocus sequence types andtwo clonal complexes (CC 3 and CC 13, Table 1) of thetypical form. After excluding cases with excessive con-trol mortality, we obtained enough replicates to quan-tify the virulence of 16 out of the 17 isolates tested. Thevirulence of these isolates in terms of honey bee broodmortality in vitro varied greatly (Figure 1). Three Swissisolates (CH 21.1, CH 49.3 and CH 60) were highlyvirulent, causing over 80% mortality in infected broodup to the imago stage (Table 1, Table. S2, Figure. S3).These isolates caused significant mortality compared tothe controls (Figure 1; pairwise log-rank tests,Bonferroni-Holm corrected, p < 0.001, Table. S1,Figure. S3). Eight isolates (FR 27.1, CH 119, CH 54.1,CH 46.1, CH 45.1, CH 40.2, NO 764–5B, NO 765–6B)had low to intermediate virulence, causing a broodmortality of 15 to 55%, which was significantly higherthan that of the controls (Figure 1; pairwise log-ranktests, Bonferroni-Holm corrected, p < 0.001, Table. S1and S2, Figure. S3). The mortality of the brood infectedwith each of the remaining five isolates (UK 36.1, UK
VIRULENCE 555
Figure 1. Survival of in vitro reared honey bee brood infected with 16 M. plutonius isolates (isolate code indicated in each panel).Grey, blue and red curves correspond to avirulent, low to intermediate and high virulence isolates, respectively. The black curve
556 D. GROSSAR ET AL.
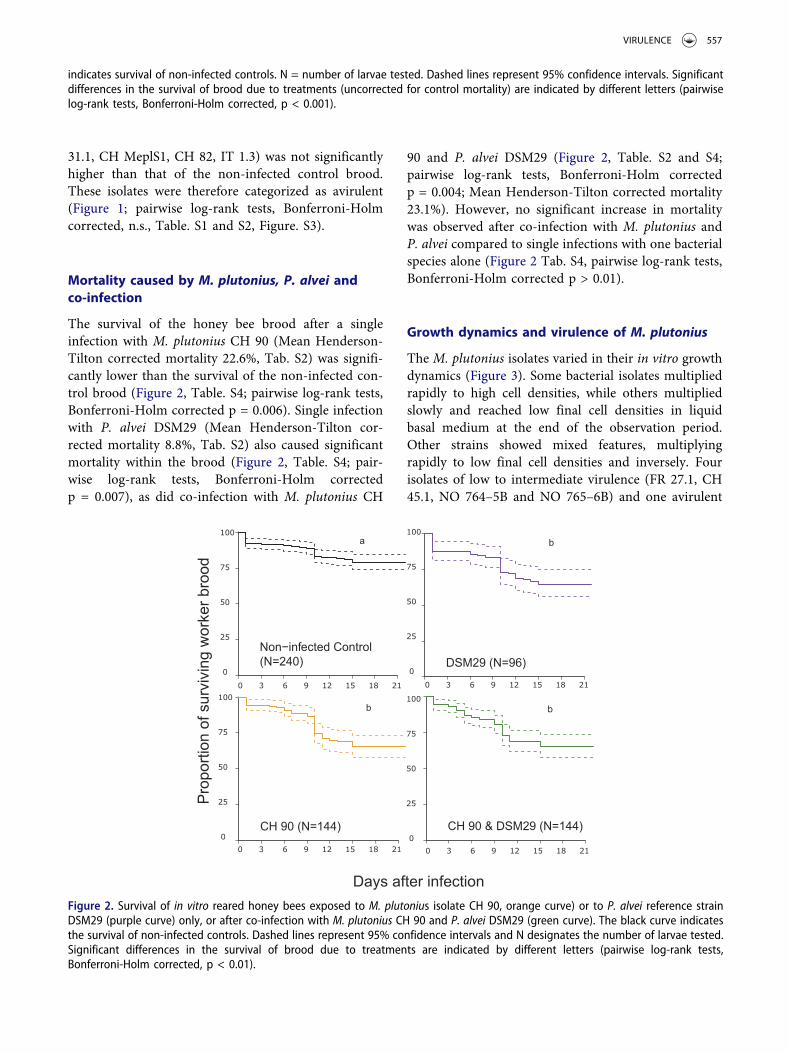
31.1, CH MeplS1, CH 82, IT 1.3) was not significantlyhigher than that of the non-infected control brood.These isolates were therefore categorized as avirulent(Figure 1; pairwise log-rank tests, Bonferroni-Holmcorrected, n.s., Table. S1 and S2, Figure. S3).
Mortality caused by M. plutonius, P. alvei andco-infection
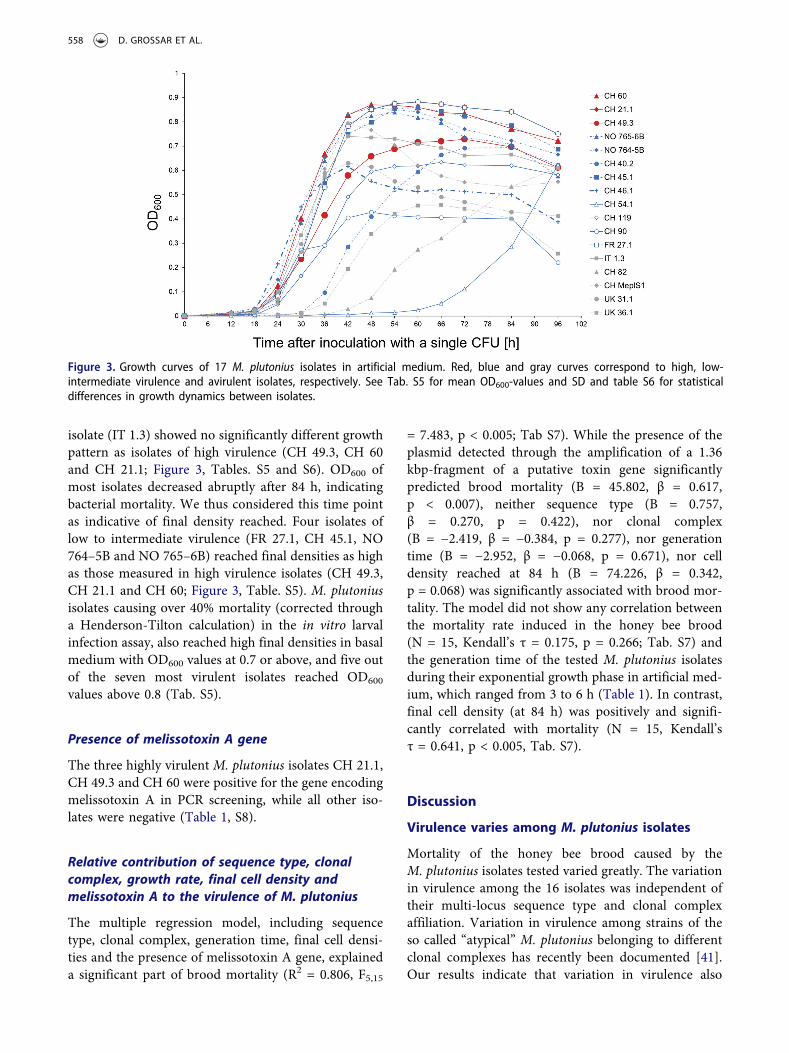
The survival of the honey bee brood after a singleinfection with M. plutonius CH 90 (Mean Henderson-Tilton corrected mortality 22.6%, Tab. S2) was signifi-cantly lower than the survival of the non-infected con-trol brood (Figure 2, Table. S4; pairwise log-rank tests,Bonferroni-Holm corrected p = 0.006). Single infectionwith P. alvei DSM29 (Mean Henderson-Tilton cor-rected mortality 8.8%, Tab. S2) also caused significantmortality within the brood (Figure 2, Table. S4; pair-wise log-rank tests, Bonferroni-Holm correctedp = 0.007), as did co-infection with M. plutonius CH
90 and P. alvei DSM29 (Figure 2, Table. S2 and S4;pairwise log-rank tests, Bonferroni-Holm correctedp = 0.004; Mean Henderson-Tilton corrected mortality23.1%). However, no significant increase in mortalitywas observed after co-infection with M. plutonius andP. alvei compared to single infections with one bacterialspecies alone (Figure 2 Tab. S4, pairwise log-rank tests,Bonferroni-Holm corrected p > 0.01).
Growth dynamics and virulence of M. plutonius
The M. plutonius isolates varied in their in vitro growthdynamics (Figure 3). Some bacterial isolates multipliedrapidly to high cell densities, while others multipliedslowly and reached low final cell densities in liquidbasal medium at the end of the observation period.Other strains showed mixed features, multiplyingrapidly to low final cell densities and inversely. Fourisolates of low to intermediate virulence (FR 27.1, CH45.1, NO 764–5B and NO 765–6B) and one avirulent
indicates survival of non-infected controls. N = number of larvae tested. Dashed lines represent 95% confidence intervals. Significantdifferences in the survival of brood due to treatments (uncorrected for control mortality) are indicated by different letters (pairwiselog-rank tests, Bonferroni-Holm corrected, p < 0.001).
Figure 2. Survival of in vitro reared honey bees exposed to M. plutonius isolate CH 90, orange curve) or to P. alvei reference strainDSM29 (purple curve) only, or after co-infection with M. plutonius CH 90 and P. alvei DSM29 (green curve). The black curve indicatesthe survival of non-infected controls. Dashed lines represent 95% confidence intervals and N designates the number of larvae tested.Significant differences in the survival of brood due to treatments are indicated by different letters (pairwise log-rank tests,Bonferroni-Holm corrected, p < 0.01).
VIRULENCE 557
isolate (IT 1.3) showed no significantly different growthpattern as isolates of high virulence (CH 49.3, CH 60and CH 21.1; Figure 3, Tables. S5 and S6). OD600 ofmost isolates decreased abruptly after 84 h, indicatingbacterial mortality. We thus considered this time pointas indicative of final density reached. Four isolates oflow to intermediate virulence (FR 27.1, CH 45.1, NO764–5B and NO 765–6B) reached final densities as highas those measured in high virulence isolates (CH 49.3,CH 21.1 and CH 60; Figure 3, Table. S5). M. plutoniusisolates causing over 40% mortality (corrected througha Henderson-Tilton calculation) in the in vitro larvalinfection assay, also reached high final densities in basalmedium with OD600 values at 0.7 or above, and five outof the seven most virulent isolates reached OD600
values above 0.8 (Tab. S5).
Presence of melissotoxin A gene
The three highly virulent M. plutonius isolates CH 21.1,CH 49.3 and CH 60 were positive for the gene encodingmelissotoxin A in PCR screening, while all other iso-lates were negative (Table 1, S8).
Relative contribution of sequence type, clonalcomplex, growth rate, final cell density andmelissotoxin A to the virulence of M. plutonius
The multiple regression model, including sequencetype, clonal complex, generation time, final cell densi-ties and the presence of melissotoxin A gene, explaineda significant part of brood mortality (R2 = 0.806, F5,15
= 7.483, p < 0.005; Tab S7). While the presence of theplasmid detected through the amplification of a 1.36kbp-fragment of a putative toxin gene significantlypredicted brood mortality (B = 45.802, β = 0.617,p < 0.007), neither sequence type (B = 0.757,β = 0.270, p = 0.422), nor clonal complex(B = −2.419, β = −0.384, p = 0.277), nor generationtime (B = −2.952, β = −0.068, p = 0.671), nor celldensity reached at 84 h (B = 74.226, β = 0.342,p = 0.068) was significantly associated with brood mor-tality. The model did not show any correlation betweenthe mortality rate induced in the honey bee brood(N = 15, Kendall’s τ = 0.175, p = 0.266; Tab. S7) andthe generation time of the tested M. plutonius isolatesduring their exponential growth phase in artificial med-ium, which ranged from 3 to 6 h (Table 1). In contrast,final cell density (at 84 h) was positively and signifi-cantly correlated with mortality (N = 15, Kendall’sτ = 0.641, p < 0.005, Tab. S7).
Discussion
Virulence varies among M. plutonius isolates
Mortality of the honey bee brood caused by theM. plutonius isolates tested varied greatly. The variationin virulence among the 16 isolates was independent oftheir multi-locus sequence type and clonal complexaffiliation. Variation in virulence among strains of theso called “atypical” M. plutonius belonging to differentclonal complexes has recently been documented [41].Our results indicate that variation in virulence also
Figure 3. Growth curves of 17 M. plutonius isolates in artificial medium. Red, blue and gray curves correspond to high, low-intermediate virulence and avirulent isolates, respectively. See Tab. S5 for mean OD600-values and SD and table S6 for statisticaldifferences in growth dynamics between isolates.
558 D. GROSSAR ET AL.
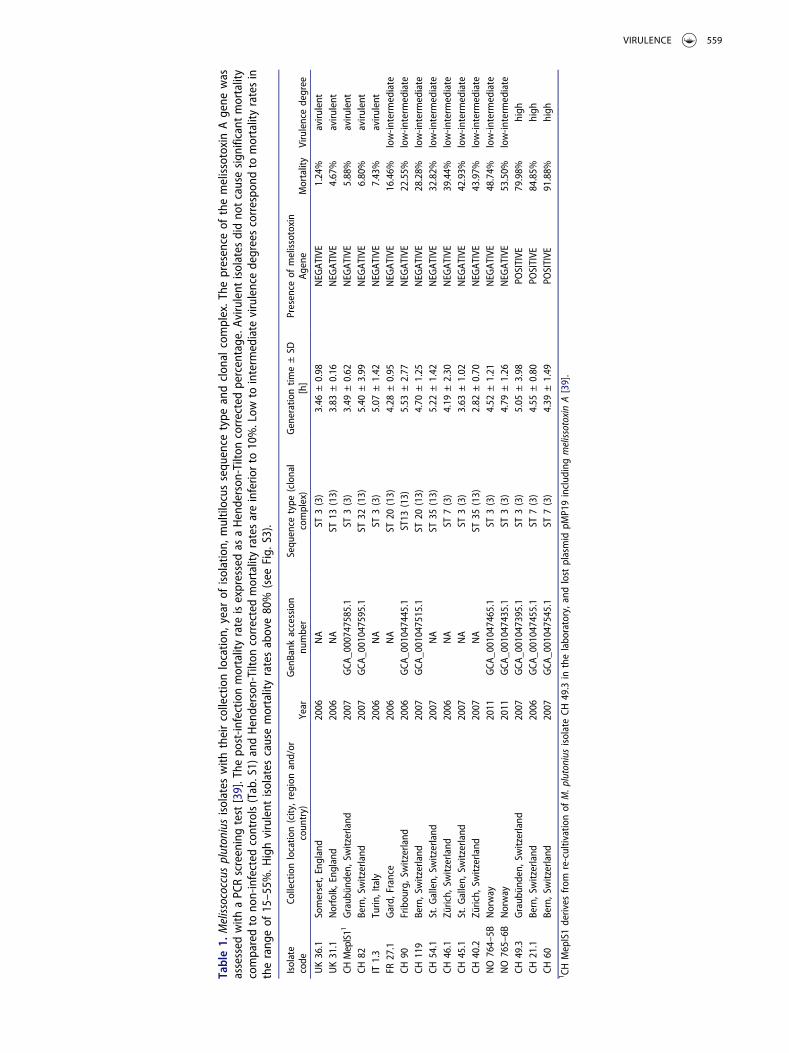
Table1.
Melissococcusplutoniusisolates
with
theircollectionlocatio
n,year
ofisolation,
multilocus
sequ
ence
type
andclon
alcomplex.The
presence
ofthemelissotoxinAgene
was
assessed
with
aPC
Rscreeningtest[39].The
post-in
fectionmortalityrate
isexpressedas
aHenderson
-Tilton
correctedpercentage.A
virulent
isolates
didno
tcausesign
ificant
mortality
comparedto
non-infected
controls(Tab.S1)
andHenderson
-Tilton
correctedmortalityratesareinferio
rto
10%.Low
tointerm
ediate
virulencedegreescorrespo
ndto
mortalityratesin
therang
eof
15–55%
.Highvirulent
isolates
causemortalityratesabove80%
(see
Fig.
S3).
Isolate
code
Collectionlocatio
n(city,regionand/or
coun
try)
Year
GenBank
accession
number
Sequ
ence
type
(clonal
complex)
Generationtim
e±SD
[h]
Presence
ofmelissotoxin
Agene
Mortality
Virulencedegree
UK36.1
Somerset,England
2006
NA
ST3(3)
3.46
±0.98
NEG
ATIVE
1.24%
aviru
lent
UK31.1
Norfolk,Eng
land
2006
NA
ST13
(13)
3.83
±0.16
NEG
ATIVE
4.67%
aviru
lent
CHMeplS11
Graub
ünden,
Switzerland
2007
GCA
_000747585.1
ST3(3)
3.49
±0.62
NEG
ATIVE
5.88%
aviru
lent
CH82
Bern,Switzerland
2007
GCA
_001047595.1
ST32
(13)
5.40
±3.99
NEG
ATIVE
6.80%
aviru
lent
IT1.3
Turin
,Italy
2006
NA
ST3(3)
5.07
±1.42
NEG
ATIVE
7.43%
aviru
lent
FR27.1
Gard,
France
2006
NA
ST20
(13)
4.28
±0.95
NEG
ATIVE
16.46%
low-in
term
ediate
CH90
Fribou
rg,Switzerland
2006
GCA
_001047445.1
ST13
(13)
5.53
±2.77
NEG
ATIVE
22.55%
low-in
term
ediate
CH119
Bern,Switzerland
2007
GCA
_001047515.1
ST20
(13)
4.70
±1.25
NEG
ATIVE
28.28%
low-in
term
ediate
CH54.1
St.G
allen,
Switzerland
2007
NA
ST35
(13)
5.22
±1.42
NEG
ATIVE
32.82%
low-in
term
ediate
CH46.1
Zürich,
Switzerland
2006
NA
ST7(3)
4.19
±2.30
NEG
ATIVE
39.44%
low-in
term
ediate
CH45.1
St.G
allen,
Switzerland
2007
NA
ST3(3)
3.63
±1.02
NEG
ATIVE
42.93%
low-in
term
ediate
CH40.2
Zürich,
Switzerland
2007
NA
ST35
(13)
2.82
±0.70
NEG
ATIVE
43.97%
low-in
term
ediate
NO764–5B
Norway
2011
GCA
_001047465.1
ST3(3)
4.52
±1.21
NEG
ATIVE
48.74%
low-in
term
ediate
NO765–6B
Norway
2011
GCA
_001047435.1
ST3(3)
4.79
±1.26
NEG
ATIVE
53.50%
low-in
term
ediate
CH49.3
Graub
ünden,
Switzerland
2007
GCA
_001047395.1
ST3(3)
5.05
±3.98
POSITIVE
79.98%
high
CH21.1
Bern,Switzerland
2006
GCA
_001047455.1
ST7(3)
4.55
±0.80
POSITIVE
84.85%
high
CH60
Bern,Switzerland
2007
GCA
_001047545.1
ST7(3)
4.39
±1.49
POSITIVE
91.88%
high
1 CHMeplS1derives
from
re-cultivationof
M.p
lutonius
isolateCH
49.3
inthelabo
ratory,and
lost
plasmid
pMP19includ
ingmelissotoxin
A[39].
VIRULENCE 559
occurs in clonal complexes belonging to the “typical”strains of M. plutonius as observed in [42]. Mortalityrates also varied among replicates of in vitro infectiontests using the same M. plutonius isolate, but larvae ofdifferent colonies. This is in line with the results fromtwo recent studies [41,42] and may be due to variationin host susceptibility. Although all but one isolate (CHMeplS1) tested in this study came from honey beecolonies with explicit symptoms of an acute EFB infec-tion, four isolates (UK 36.1, UK 31.1, CH 82 and IT1.3) did not cause elevated larval mortality in vitro, andwere therefore ranked as avirulent. It is possible thatthis discrepancy is a methodological artifact due to theloss of the plasmid carrying the putative virulence fac-tor during cultivation on artificial media. Although thetested isolates were subjected to the same laboratoryprocedures, random loss of the plasmid cannot beexcluded. Alternatively, negative effects on the develop-ment or physiology of the larvae not detected in ourassay could have triggered increased removal by adulthygienic workers, generating the typical spotty broodpattern in EFB-diseased colonies. It is also possible thatbacterial isolates less virulent at individual level arehighly virulent at colony level, and vice versa, as washypothesized for Paenibacillus larvae [63]. Larvaeinfected with low virulence isolates might be removedslower than larvae affected by high virulence isolates.A low removal rate could facilitate the production andspread of the pathogenic bacteria within the colony. Itis highly likely that the in vivo virulence of M. plutoniusat colony level is modulated by the effect of the socialimmunity of the colony [64], as proposed for P. larvae[63,65] and be different from virulence quantifiedin vitro.
No evidence that co-infection with P. alveiincreases mortality
Our results indicate that the presence of the secondaryagent P. alvei is not required to induce brood mortality.We observed high larval mortality after single infectionwith some of the M. plutonius isolates, in line withformer studies [34,41,42,62]. To our knowledge, this isthe first report on single infections with P. alvei in anin vitro infection assay. In this study, single infectionwith P. alvei strain DSM29 caused significant mortalityto the honey bee brood. In contrast, co-infection withM. plutonius did not increase brood mortality beyondthe effect of single infections with the testedM. plutonius isolate (CH 90). These results are similarto those of Lewkowski and Erler, 2018 [42], but differfrom those of Giersch et al., 2010 [47], probablybecause of methodological differences (e.g., different
infection time, higher concentration of P. alvei usedin their study). To better understand the role of sec-ondary agents, other bacteria associated with EFBshould be tested singly and in co-infections witha larger set of M. plutonius isolates in vitro [42] aswell as in vivo in honey bee colonies.
Relationship between M. plutonius growthdynamics and virulence
The growth dynamics of M. plutonius isolates in theculture medium were highly variable. The bacterialgeneration time in the artificial medium did not predictmortality in the honey bee brood. The final bacterialdensity may play a more important role in determiningpathogenicity (sensu [66]) than the generation time. Allisolates defined as being of intermediate or high viru-lence reached high final densities in the culture med-ium, and isolates with lower final densities caused lowmortality. This pattern obtained in vitro suggests thatstrains must reach a damage threshold to induce highmortality. Although the growth dynamics ofM. plutonius isolates in culture medium as observedin this study may be different from that in honey beelarvae, the hypothesis that a high bacterial load isa prerequisite for high virulence is supported by theoccurrence of a positive correlation between bacterialnumbers and virulence in vivo [41,62]. However, somelow virulence isolates reached high final densities in theculture medium at 84 h, suggesting that factors otherthan the number of M. plutonius bacteria are involvedin causing high mortality in honey bee brood.
Role of melissotoxin A in virulence
The melissotoxin A gene was restricted to three highlyvirulent Swiss isolates (CH 21.1, CH 49.3 and CH 60)and the presence of this gene was a significant predictorof honey bee brood mortality (Tab. S5). In our experi-ment, the bacterial isolate CH MeplS1 was avirulent.This isolate originated from a bacterial culture of thehighly virulent isolate CH 49.3 and lost plasmid pMP19(19.4 kbp; GenBank: JSBA01000009.1) after repeatedsub-cultivation [39]. Plasmid pMP19 encodes melisso-toxin A (GenBank: KMT29105) and another putativevirulence factor, the extracellular matrix-binding pro-tein [39]. While the additional loss of genome-encodedvirulence factors in CH Mepl S1 cannot be excluded,the simultaneous loss of pMP19 and virulence suggestsa causal link.
A further piece of evidence for the possible implica-tion of the melissotoxin A gene in virulence is that it isexpressed by M. plutonius during infection in vivo
560 D. GROSSAR ET AL.
[39,62]. This gene shares a high sequence similaritywith the epsilon toxins of the ETX/MTX2 family(pfam03318 of Clostridium perfringens, 33% aminoacid sequence identity [39] and of Bacillus pumiluswith 48% sequence identity, 90% coverage and anExpect (E)-value of 7e-73, NCBI query; https://www.ncbi.nlm.nih.gov/). Epsilon toxins change the cell per-meability for ions by forming large membrane pores,causing cell death and edema in animal models [67]. Itwas recently suggested that a protein of the ETX/MT2family is an important virulence factor in two subtypesof P. larvae, the causative pathogen of American foul-brood [68]. It is thus plausible that melissotoxinA increases the virulence of M. plutonius by corruptingthe cells of the larva’s digestive tract.
The melissotoxin A gene is situated on plasmidpMP19 [39]. Plasmids can easily be exchanged betweenindividual bacterial cells within and between species[69]. The plasmid pMP19 found in certainM. plutonius strains, including atypical isolates fromJapan [40,62], may originate from other bacterial inva-ders co-existing with M. plutonius in the intestinal tractof honey bee larvae. The fact that the toxin gene islocated on a mobile genetic element can explain theabsence of association between brood mortality and thesequence type or clonal complex of the isolates used inthis study.
The conventional explanation for the negative effectof M. plutonius is a competition for nutrients in the gut[25]. Although not mutually exclusive, our finding thata toxin-carrying mobile genetic element could conferhigh pathogenicity to certain M. plutonius isolates sug-gests a direct detrimental effect on gut cells. This modeof action is in line with the findings of McKee et al.,2004 [46] and with evidence that M. plutonius stillcaused high larval mortality in in vitro experimentswhere food was given in excess [34,41,42,46,47,60–62].
Further experiments will be needed to demonstratethe direct role of melissotoxin A in the pathogenicity ofM. plutonius. Such experiments include producinggenetically modified strains of M. plutonius, for exam-ple by removing plasmid pMP19 from highly virulentstrains, knocking-out melissotoxin A gene on pMP19(pMP19Δmelissotoxin A gene), transforming wildtypepMP19 and pMP19Δmelissotoxin A gene into low viru-lent isolates of M. plutonius, as well as producing theputative toxin in the laboratory. The impact of mutantstrains or the synthesized toxin on honey bee larvaecould then be directly tested in vitro. Curing pMP19from Japanese M. plutonius isolates belonging to CC 3resulted in a loss of virulence [62], supporting ourhypothesis for the role of the melissotoxin A gene.However, transformation experiments aimed at
introducing the plasmid back in the cured isolates didnot result in recuperation of virulence [62]. A reducedgrowth of these isolates due to the transformation pro-tocol was provided as an explanation [62], in line withour suggestion that rapid multiplication is also requiredto produce highly virulent phenotypes. The role of theputative virulence gene on pMP19 could not be con-firmed in a Japanese isolate of CC 13 [62]. A reducedgrowth of this isolate could also explain its low viru-lence despite the gene’s presence.
Is the recent emergence of EFB due to highlyvirulent strains?
The question then arises as to whether the recent emer-gence of EFB is linked to the occurrence of bacterialstrains of particularly high virulence at the colony level.Virulence trade-off models predict that the virulence ofa pathogen is inversely correlated to its transmission,because excessive virulence causes early host death,hindering the spread of the pathogen amongst thepopulation [70–73]. However, human-induced changesin the rate of horizontal transmission may have alteredthe adaptive compromise between virulence and trans-mission in M. plutonius [17,74,75]. Increased contactbetween honey bee colonies due to human manage-ment may allow for the spread of highly virulent strainsunable to spread to new hosts under more naturalsettings.
More extensive field screening of the prevalence ofdifferent M. plutonius sequence types and of the plas-mid carrying the melissotoxin A gene will reveal ifhighly virulent strains of M. plutonius arose by acquir-ing this toxin-carrying mobile genetic element. Thiswill also contribute to a better understanding of theorigin of recent epidemic outbreaks of EFB. If a linkbetween virulence and disease outbreaks in the field canbe established, strain-specific, virulence-based controlmethods can be promising avenues to better control thespread of EFB [29,30]. The melissotoxin A gene couldprovide a putative marker for such specific controlmethods.
Conclusion
Infection with M. plutonius alone caused Europeanfoulbrood symptoms in honey bee brood rearedin vitro. Bee mortality varied substantially among 16investigated M. plutonius isolates, independently oftheir sequence type. Mortality did not increase whenlarvae were infected with the potential secondary agentP. alvei in combination with a M. plutonius isolate oflow to intermediate virulence. Variation in the
VIRULENCE 561
virulence of M. plutonius isolates was not significantlylinked to growth dynamics. A high final density in theculture medium was reached by highly virulent isolates,but was not sufficient to explain the high mortalitycaused by these M. plutonius isolates. High virulencewas associated with the presence of a plasmid carryingthe putative toxin melissotoxin A, suggesting that thismobile genetic element is a major factor in the viru-lence of M. plutonius. These new insights into thepathogenicity of a poorly understood, but importanthoney bee disease may serve as a basis for the develop-ment of more sustainable control methods.
Experimental Procedures
Origin and culture of M. plutonius isolates
Diseased larvae were collected from European foul-brood (EFB) outbreaks in several European regions(Table 1) and sent to our laboratory for the purposeof M. plutonius isolation. The only exception was theNorwegian samples, which were processed elsewhere.Melissococcus plutonius was isolated from smears ofdiseased larvae on basal medium. The medium con-tained 1% yeast extract, 1% glucose, 1% saccharose,0.04% L-cysteine and 0.1 M KH2PO4 in distilledwater, with a pH adjusted to 6.7 with 5 M KOH. Themedium was solidified with 18 g agar/liter and auto-claved at 121°C for 18 min [58,76]. After incubation forfour days at 36°C under anaerobic conditions (GENboxanaer, bioMérieux), individual bacterial colonies iden-tified as M. plutonius based on colony morphologywere picked from the Petri dishes and inoculated ina liquid basal medium or on plates. The plates wereincubated anaerobically for another four days at 36°C.Isolate stock solutions were supplemented with 15%glycerol and stored at −80°C until further use.
PCR identification of M. plutonius and detection ofthe gene encoding melissotoxin A
Isolates were confirmed as M. plutonius by PCR asdescribed by Govan et al., 1998 [74]. The strains werefurther identified as either “typical” or “atypical” fol-lowing the protocol described in Arai et al., 2014 [77].The multi-locus sequence type and clonal complex ofeach isolate were assessed as described in Haynes et al.,2013 [36]. We screened for the presence of melissotoxinA gene (GenBank: KMT29105) [39] using specific pri-mers (tox_MEPL_for: 5ʹ-GCTCAAGCAGCAACTTTTACG-3ʹ and tox_MEPL_rev: 5ʹ-TTCCCCTGGTATTACTTGTAGATG-3ʹ; fragment size approx. 1.36kbp) in a conventional PCR reaction using KAPA2 G
Fast DNA Polymerase (KAPA Biosystems). DNA wasextracted with the NucleoSpin Tissue kit fromMacherey-Nagel according to the manufacturer’sinstructions, the DNA-concentration was measuredwith NanoDrop® ND-1000 spectrophotometer(NanoDrop, Thermo Fischer Scientific, USA) andeach DNA-extract diluted to 5 ng DNA per µl. Eachreaction in the PCR consisted of 2 µl template DNA-extract, 13 µl KAPA2 G fast ready mix (2x), 1 µl for-ward primer (10 µM), 1 µl reverse primer (10 µM), and8 µl water added to a total reaction volume of 25 µl.The PCR started with an initial denaturation step at 95°C for 3 min, followed by 40 cycles of denaturation at95°C for 15 s, annealing at 58°C for 15 s and DNAextension at 72°C for 20 s, and a final extension step at72°C for 2 min (TProfessional Basic Thermocycler,Biometra). PCR products were visualized under UVlight after staining the 1.5% agarose gel with GelRed™(Biotium).
Infection assays of honey bee larvae rearedin vitro
Honey bee brood originating from healthy, queenrightcolonies was used in the infection assays. Same agedlarvae were obtained by confining queens to emptycombs for the purpose of egg-laying, using excludercages. After 36 hours, the queens were removed fromthe cages for three days, until first instar larvae hatched.First instar larvae were grafted individually in plasticqueen starter cells (Nicoplast™) that had been sterilizedin 70% ethanol for 30min. The plastic cells were placed inthe cells of 48-well tissue culture plates, on top of a pieceof wet dental roll imbibed with 15.5% glycerol in 0.4%methyl benzethonium chloride to prevent unwantedmicroorganism growth. The larvae were reared in vitro,according to standard methods [59]. In brief, the cultureplates were placed in a hermetic desiccator containinga dish filled with saturated K2SO4 solution, which ensureda relative humidity of 95% needed to prevent dehydrationof larvae. The desiccator containing the larvae was placedinto an incubator at 34.5°C for the first six days of larvaldevelopment. At day 7, when the larvae defecate and startto pupate, the plates were moved into a desiccator con-taining a dish filledwith saturatedNaCl solution to ensurean optimal relative humidity of 75%. The larvae were feddaily with pre-warmed diet (34.5°C), according to thefollowing feeding program: on the day of grafting, larvaewere provided with 10 µl of diet A (1.2 g glucose, 1.2 gfructose, 0.2 g yeast extract and 8.4 g pure water, filtersterilized (0.2 µm) and mixed with 10 g pure royal jelly).On day 3, larvae were fed 20 µl of diet B (1.5 g glucose,1.5 g fructose, 0.3 g yeast extract and 8 g pure water, filter
562 D. GROSSAR ET AL.
sterilized (0.2 µm) and mixed with 10 g pure royal jelly).On days 4, 5 and 6, larvae were fed with 30, 40 and 50 µl ofdiet C, respectively. Diet C consisted of 1.8 g glucose, 1.8 gfructose, 0.4 g yeast extract and 7.45 g pure water, filtersterilized (0.2 µm) and mixed with 10 g pure royal jelly[59,78]. The royal jelly was obtained from healthy colo-nies and stored at −20°C.
For in vitro infection experiments, M. plutoniusisolates were cultivated in a liquid basal medium at36°C under anaerobic conditions for four days. Inorder to standardize the number of bacteria adminis-tered in the infection assays, we determined the con-centration of viable bacterial cells using colonyforming units (CFUs) counting. The CFUs froma serial dilution spread on basal medium agar plateswere counted after four days of incubation at 36°Cunder anaerobic conditions [76]. During this timeand before administration, bacterial cultures werestored at 4°C.
Paenibacillus alvei type strain DSM29 was obtainedfrom the German Culture Collection (DSMZ,Braunschweig, Germany) and cultivated on casein-peptone agar plates under aerobic conditions at 30°Cfor three weeks, until spores formed. Spores were har-vested from agar plates by scraping them off the plateand suspending them in saline (0.9% NaCl in distilledwater). The spores were washed once with saline,diluted in saline and heat treated for 5 minutes at 90°C. The total P. alvei spore concentration was deter-mined via 10-fold dilutions plated on casein-peptoneagar plates and CFU counting [79]. Spore suspensionswere stored at 4°C.
Infection with M. plutonius was induced by admin-istering a droplet of 10 µl diet A spiked with 107 CFUml−1 of the respective M. plutonius isolate(1:9 M. plutonius inoculum-diet mix) on day 1, withintwo hours of grafting. Hence, each larva was fed 105
CFU of M. plutonius. Larvae were infected with P. alveion day 1 by receiving 10 µl of diet A spiked with 105
spores of P. alvei per ml of saline (i.e. 103 P. alvei sporesper larva). Co-infections were performed by feeding10 µl diet A spiked with a mix of 105 P. alvei DSM29spores ml−1 and 107 CFU ml−1 of M. plutonius isolateCH 90. This isolate was selected for co-infection assaysfor its relatively low virulence, which facilitates thedetection of a putative increased mortality due toP. alvei. Non-infected control larvae received 10 µl ofdiet A mixed with sterile saline. We administereda lower number of P. alvei spores per larva (103) thanin other studies (6 x 10⁴; [42,47]). This lower dose iscloser to the one eliciting American foulbrood symp-toms in infections by the congeneric bacteria P. larvae(20 spores/larva; [80]), and comparable to the number
of P. alvei spores larvae were exposed to in a recentstudy (8.3 x 10³; [42]).
Honey bee larvae were subjected to single infectionswith M. plutonius, single infections with P. alvei and co-infections with M. plutonius and P. alvei. We monitoredbrood survival and compared brood mortality caused bythe isolates, alone or in combination. The status of eachlarva (dead or alive) was recorded every 24 h by observingit under a microscope. Larvae or pupae without signs ofrespiration or reaction to mechanical stimulus wererecorded as dead and removed from the plates [78]. Incontrast to other studies [34,41,42,46,47], we monitoredbrood survival until completion of development (i.e. untilimaginal stage) to take into account the whole brooddevelopmental period to assess its mortality. For eachstrain or combination of strains, 2–6 replicates were per-formed, each with 24–84 larvae produced by 2–8 queens(Tab. S2).
Growth dynamics of M. plutonius isolates
For each M. plutonius isolate used in the infectionsassays (17 isolates), ten replicates (two runs with fivereplicates each) of 20 ml liquid basal medium wereinoculated with a single M. plutonius colony pre-cultured on an agar plate for three days and incubatedunder anaerobic conditions at 36°C. Bacterial growthwas monitored by measuring optical density at 600 nm(OD600) with a spectrophotometer (DR/2000, HACH),every 6 h until 96 h past inoculation [81]. OD600 wasaveraged over the ten replicates. Based on this data, wecalculated the generation time and compared thegrowth dynamics of the isolates (see below).
Statistics
Survival differences in honey bee brood after experi-mental infection with M. plutonius or P. alvei, or witha combination of M. plutonius and P. alvei, were illu-strated with Kaplan-Meier survival curves with 95%confidence intervals [82]. Differences in survivalbetween hosts infected by various isolates, and betweenthe latter and uninfected controls were tested usingpairwise log-rank tests (Mantel-Haenszel test [83])and adopting a significance level α of 0.05, correctedby a Bonferroni-Holm procedure for multiple compar-isons [84]. We calculated the Henderson-Tilton cor-rected mortality rate of individuals dead until day 21of development, when the imago stage is reached, asfollows: mortality ratio = 1- ((number of live test beesafter treatment * number of live control bees aftertreatment-1) * (number of live control bees before treat-ment * number of live bees before treatment-1)) [85],
VIRULENCE 563

and state the resulting mortality rate caused by eachtested M. plutonius isolate in Table 1.
We used the R package growthrates [86] to computethe growth constant k for each isolate, by fitting segmentsof linear models to the log-transformed OD600 valuesduring the exponential growth phase [81]. The generationtime (g) of each isolate was then calculated [87] as g = ln(2)/k. As recommended by Hall et al., 2013 [81], weverified the fit to the exponential phase generated by thealgorithm implemented in Petzoldt, 2016 [86]. For isolateCH 54.1, the algorithm did not identify the exponentialphase correctly, due to a long and irregular lag phase. Weobtained a corrected dataset by excluding the first sixpoints for this isolate well ahead of the exponentialphase, which led to correct fitting. The overall correlationbetween growth rate andmortality, as well as the results ofthe regression model, were similar between the correcteddataset, the original dataset, and after excluding this iso-late from the dataset (Tab. S7). We chose to presentconservative results of the regression model, based onthe dataset excluding CH 54.1.
Generation time only considers the exponentialphase of the bacterial growth cycle. To analyze thegrowth dynamics over the entire experiment (96 h),we used permutation tests with 100,000 iterations toconduct pairwise comparisons between growth curves[88,89]. These statistical analyses were done in R (RFoundation for Statistical Computing, Vienna, Austria)with the statmod package [90].
A multiple regression analysis [91] was conducted toexamine the relationship between the Henderson-Tilton corrected mortality and the potential virulencefactors multi-locus sequence type, clonal complex, gen-eration time, final density (density reached at 84 h) andpresence of melissotoxin A gene. For this model, weused SPSS Statistics, version 21 (IBM Corp.).
Acknowledgments
Alexandra Roetschi is acknowledged for assistance in thelaboratory, Rolf Kuhn and Benoît Droz for support withbeekeeping, Swiss bee inspectors for providing samples andfive anonymous reviewers for constructive suggestions.
Disclosure statement
No potential conflict of interest was reported by the authors.
Funding
This research was funded by the Swiss Federal Food Safetyand Veterinary Office, grant number 1.12.15, the Universityof Lausanne and Agroscope.
ORCID
Daniela Grossar http://orcid.org/0000-0003-2073-7053Eva Forsgren http://orcid.org/0000-0002-8244-7265Jean-Daniel Charrière http://orcid.org/0000-0003-3732-4917Michel Chapuisat http://orcid.org/0000-0001-7207-199XVincent Dietemann http://orcid.org/0000-0002-0791-9939[1] Klein A-M, Vaissiere BE, Cane JH, et al. Importance of
pollinators in changing landscapes for world crops.Proc Roy Soc Lond B Biol Sci. 2007;274(1608):303–313.
[2] Ellis JD, Evans JD, Pettis J. Colony losses, managedcolony population decline, and colony collapse disor-der in the United States. J Apicult Res. 2010;49(1):134–136.
[3] Neumann P, Carreck NL. Honey bee colony losses.J Apicult Res. 2010;49(1):1–6.
[4] Potts SG, Biesmeijer JC, Kremen C, et al. Global polli-nator declines: trends, impacts and drivers. TrendsEcol Evol. 2010;25(6):345–353.
[5] Gray A, Brodschneider R, Adjlane N, et al. Loss rates ofhoney bee colonies during winter 2017/18 in 36 coun-tries participating in the COLOSS survey, includingeffects of forage sources. J Apicult Res. 2019;58(4):479–485.
[6] Moritz RFA, De Miranda J, Fries I, et al. Researchstrategies to improve honeybee health in Europe.Apidologie. 2010;41:227–242.
[7] Evans JD, Schwarz RS. Bees brought to their knees:microbes affecting honey bee health. Trends Microbiol.2011;19(12):614–620.
[8] Smith KM, Loh EH, Rostal MK, et al. Pathogens, pests,and economics: drivers of honey bee colony declinesand losses. EcoHealth. 2013;10(4):434–445.
[9] Genersch E. Honey bee pathology: current threats tohoney bees and beekeeping. Appl MicrobiolBiotechnol. 2010;87(1):87–97.
[10] Morimoto T, Kojima Y, Yoshiyama M, et al. Moleculardetection of protozoan parasites infecting Apis melli-fera colonies in Japan. Env Microbiol Rep. 2013;5(1):74–77.
[11] Higes M, Martín-Hernández R, Botías C, et al. How nat-ural infection by Nosema ceranae causes honeybee colonycollapse. Environ Microbiol. 2008;10(10):2659–2669.
[12] Dietemann V, Pflugfelder J, Anderson D, et al. Varroadestructor: research avenues towards sustainablecontrol. J Apicult Res. 2012;51(1):125–132.
[13] Wilkins S, Brown MA, Cuthbertson AG. The incidenceof honey bee pests and diseases in England and Wales.Pest Manag Sci. 2007;63(11):1062–1068.
[14] Roetschi A, Berthoud H, Kuhn R, et al. Infection ratebased on quantitative real-time PCR of Melissococcusplutonius, the causal agent of European foulbrood, inhoneybee colonies before and after apiary sanitation.Apidologie. 2008;39(3):362–371.
[15] Ellis JD, Munn PA. The worldwide health status ofhoney bees. Bee World. 2005;86(4):88–101.
[16] Dahle B, Sorum H, Weidman E. European foulbroodin Norway: how to deal with a major outbreak after 30years absence. COLOSS workshop: the future of brooddisease research - guidelines, methods and develop-ment. Denmark.: Copenhagen; 2011.
564 D. GROSSAR ET AL.
[17] Von Büren RS, Oehen B, Kuhn NJ, et al. High-resolution maps of Swiss apiaries and their applicabilityto study spatial distribution of bacterial honey beebrood diseases. PeerJ. 2019;7:e6393.
[18] Dahle B, Wilkins S, Charrière J-D. European foulbrood(EFB) and American foulbrood (AFB) - distribution,status and control and management strategies through-out Europe. Murcia, Spain: EURBEE; 2014.
[19] Hendrikx P, Saussac M, Meziani F, et al. Résabeilles:résultats de deux campagnes de surveillanceprogrammée de la mortalité des abeilles en France[Résabeilles: results of two monitoring campaigns onthe mortality of bees in France]. Bull Epid Santé AnimAlim. 2015;70:19–23.
[20] Erban T, Ledvinka O, Kamler M, et al. Bacterial commu-nity associated with worker honeybees (Apis mellifera)affected by European foulbrood. PeerJ. 2017;5:e3816.
[21] Grangier V, Belloy L, Charrière J-D, et al. Real-timePCR as a decision aid in the control of Europeanfoulbrood. J Apicult Res. 2015;54:366–372.
[22] White G. The cause of European foulbrood. USDepartment of Agriculture Bureau of Entomology;1912.circular no. 157.
[23] Forsgren E. European foulbrood in honey bees.J Invertebr Pathol. 2010;103:S5–S9.
[24] Bailey L. Melissococcus pluton, the cause of Europeanfoulbrood of honey bees (Apis spp.). J Appl Microbiol.1983;55:65–69.
[25] Bailey L, Ball BV. Honey bee pathology. London:Academic Press; 1991.
[26] Miyagi T, Peng CYS, Chuang RY, et al. Verification ofoxytetracycline-resistant American foulbrood pathogenPaenibacillus larvae in the United States. J InvertebrPathol. 2000;75(1):95–96.
[27] Waite R, Jackson S, Thompson H. Preliminary investi-gations into possible resistance to oxytetracycline inMelissococcus plutonius, a pathogen of honeybeelarvae. Lett Appl Microbiol. 2003;36(1):20–24.
[28] World Organisation for Animal Health (OIE). Worldanimal health information database (WAHISInterface) – version 1. [accessed date 2017 Dec 09;based on data for 2015]. https://www.oie.int/wahis_2/public/wahid.php/Wahidhome/Home.
[29] Vale PF, McNally L, Doeschl-Wilson A, et al. Beyondkilling: can we find new ways to manage infection?Evol Med Public Health. 2016;2016(1):148–157.
[30] Abadi ATB, Kusters JG. Management of Helicobacterpylori infections. BMC Gastroenterol. 2016;16(1):94.
[31] Bailey L, Gibbs AJ. Cultural characters of Streptococcuspluton and its differentiation from associatedenterococci. Microbiology. 1962;28:385–391.
[32] Djordjevic SP, Smith LA, Forbes WA, et al.Geographically diverse Australian isolates ofMelissococcus pluton exhibit minimal genotypic diver-sity by restriction endonuclease analysis. FEMSMicrobiol Lett. 1999;173(2):311–318.
[33] Okumura K, Arai R, Okura M, et al. Complete genomesequence of Melissococcus plutonius ATCC 35311.J Bacteriol. 2011;193(15):4029–4030. .
[34] Arai R, Tominaga K, Wu M, et al. Diversity ofMelissococcus plutonius from honeybee larvae inJapan and experimental reproduction of European
foulbrood with cultured atypical isolates. PLoS One.2012;7(3):e33708. .
[35] Okumura K, Arai R, Okura M, et al. Complete genomesequence of Melissococcus plutonius DAT561, a strainthat shows an unusual growth profile and is represen-tative of an endemic cluster in Japan. J Bacteriol.2012;194(11):3014. .
[36] Haynes E, Helgason T, Young JPW, et al. A typingscheme for the honeybee pathogen Melissococcus plu-tonius allows detection of disease transmission eventsand a study of the distribution of variants. EnvironMicrobiol Rep. 2013;5(4):525–529.
[37] Budge GE, Shirley MDF, Jones B, et al. Molecularepidemiology and population structure of the honeybee brood pathogen Melissococcus plutonius. Isme J.2014;8(8):1588–1597.
[38] Takamatsu D, Morinishi K, Arai R, et al. Typing ofMelissococcus plutonius isolated from European andJapanese honeybees suggests spread of sequence typesacross borders and between different Apis species. VetMicrobiol. 2014;171(1–2):221–226.
[39] Djukic M, Erler S, Leimbach A, et al. Comparativegenomics and description of putative virulence factorsof Melissococcus plutonius, the causative agent ofEuropean foulbrood disease in honey bees. Genes(Basel). 2018;9(8):419.
[40] Okumura K, Takamatsu D, Okura M. Complete gen-ome sequence of Melissococcus plutonius DAT561,a strain that shows an unusual growth profile, obtainedby PacBio sequencing. Genome Announc. 2018;6(23):e00431–18.
[41] Nakamura K, Yamazaki Y, Shiraishi A, et al. Virulencedifferences among Melissococcus plutonius strains withdifferent genetic backgrounds in Apis mellifera larvaeunder an improved experimental condition. Sci Rep.2016;6(1).
[42] Lewkowski O, Erler S. Virulence of Melissococcus plu-tonius and secondary invaders associated withEuropean foulbrood disease of the honey bee.MicrobiologyOpen. 2018;8:e00649.
[43] Blaser MJ, Cohn DL. Opportunistic infections inpatients with AIDS: clues to the epidemiology ofAIDS and the relative virulence of pathogens. RevInfect Dis. 1986;8(1):21–30.
[44] Erler S, Lewkowski O, Poehlein A, et al. The curiouscase of Achromobacter eurydice, a Gram-variable pleo-morphic bacterium associated with European foul-brood disease in honeybees. Microb Ecol. 2018;75(1):1–6.
[45] Bailey L. European foul brood: a disease of the larvalhoneybee (Apis mellifera L.) caused by a combinationof Streptococcus pluton (Bacillus pluton white) andbacterium eurydice white. Nature. 1957;180(4596):1214–1215.
[46] McKee BA, Goodman RD, Hornitzky MA. The trans-mission of European foulbrood (Melissococcus pluto-nius) to artificially reared honey bee larvae (Apismellifera). J Apicult Res. 2004;43(3):93–100.
[47] Giersch T, Barchia I, Hornitzky M. Can fatty acids andoxytetracycline protect artificially raised larvae fromdeveloping European foulbrood? Apidologie. 2010;41(2):151–159.
VIRULENCE 565
[48] North RJ, Izzo AA. Mycobacterial virulence. Virulentstrains of Mycobacteria tuberculosis have faster in vivodoubling times and are better equipped to resistgrowth-inhibiting functions of macrophages in the pre-sence and absence of specific immunity. J Exp Med.1993;177(6):1723–1733.
[49] Zhang M, Gong J, Lin Y, et al. Growth of virulent andavirulent Mycobacterium tuberculosis strains in humanmacrophages. Infect Immun. 1998;66(2):794–799.
[50] Finlay BB, Falkow S. Common themes in microbialpathogenicity revisited. Microbiol Mol Biol Rev.1997;61(2):136–169.
[51] Wu H-J, Wang AH, Jennings MP. Discovery of viru-lence factors of pathogenic bacteria. Curr Opin ChemBiol. 2008;12(1):93–101.
[52] Antúnez K, Anido M, Arredondo D, et al. Paenibacilluslarvae enolase as a virulence factor in honeybee larvaeinfection. Vet Microbiol. 2011;147(1–2):83–89.
[53] Fünfhaus A, Poppinga L, Genersch E. Identificationand characterization of two novel toxins expressed bythe lethal honey bee pathogen Paenibacillus larvae, thecausative agent of American foulbrood. EnvironMicrobiol. 2013;15(11):2951–2965.
[54] Garcia-Gonzalez E, Poppinga L, Fünfhaus A, et al.Paenibacillus larvae chitin-degrading protein PlCBP49is a key virulence factor in American Foulbrood ofhoney bees. PLoS Pathog. 2014;10(7):e1004284.
[55] Krska D, Ravulapalli R, Fieldhouse RJ, et al. C3larvintoxin, an ADP-ribosyltransferase from Paenibacilluslarvae. J Biol Chem. 2015;290(3):1639–1653.
[56] Bailey L. The pathogenicity for honey-bee larvae ofmicroorganisms associated with European foulbrood.J Invertebr Pathol. 1963;5:198–205.
[57] Evans JD, Spivak M. Socialized medicine: individualand communal disease barriers in honey bees.J Invertebr Pathol. 2010;103:S62–S72.
[58] Bailey L. The isolation and cultural characteristics ofStreptococcus pluton and further observations onBacterium eurydice. Microbiology. 1957;17:39–48.
[59] Aupinel P, Fortini D, Dufour H, et al. Improvement ofartificial feeding in a standard in vitro method forrearing Apis mellifera larvae. Bull Insect. 2005;58:107.
[60] Vasquez A, Forsgren E, Fries I, et al. Symbionts asmajor modulators of insect health: lactic acid bacteriaand honeybees. PLoS One. 2012;7(3):e33188.
[61] Wu M, Sugimura Y, Iwata K, et al. Inhibitory effect of gutbacteria from the Japanese honey bee,Apis cerana japonica,against Melissococcus plutonius, the causal agent ofEuropean foulbrood disease. J Insect Sci. 2014;14.
[62] Nakamura K, Okumura K, Harada M, et al. Differentimpacts of pMP19 on the virulence of Melissococcusplutonius strains with different genetic backgrounds.Env Microbiol. 2020.
[63] Genersch E, Ashiralieva A, Fries I. Strain-andgenotype-specific differences in virulence of Paenibacilluslarvae subsp. larvae, a bacterial pathogen causingAmerican foulbrood disease in honeybees. Appl EnvironMicrobiol. 2005;71:7551–7555.
[64] Cremer S, Pull CD, Fürst MA. Social immunity: emer-gence and evolution of colony-level disease protection.Annu Rev Entomol. 2018;63(1):105–123.
[65] Spivak M, Reuter GS. Resistance to American foulbrooddisease by honey bee colonies Apis mellifera bred forhygienic behavior. Apidologie. 2001;32:555–565.
[66] Casadevall A, Pirofski L-A, Fischetti VA. Host-pathogen interactions: redefining the basic conceptsof virulence and pathogenicity. Infect Immun.1999;67(8):3703–3713.
[67] Petit L, Maier E, Gibert M, et al. Clostridium perfrin-gens Epsilon toxin induces a rapid change of cell mem-brane permeability to ions and forms channels inartificial lipid bilayers. J Biol Chem. 2001;276(19):15736–15740.
[68] Erban T, Zitek J, Bodrinova M, et al. Comprehensiveproteomic analysis of exoproteins expressed by ERIC I, II,III and IV Paenibacillus larvae genotypes reveals a widerange of virulence factors. Virulence. 2019;10(1):363–375.
[69] Frost LS, Leplae RSummers AO, et al. Mobile genetic975elements: the agents of open source evolution. NatRevMicrobiol. 2005;3(9):722–732.
[70] Anderson RM, May RM. Coevolution of hosts andparasites. Parasitology. 1982;85(2):411–426.
[71] Ewald PW. Host-parasite relations, vectors, and theevolution of disease severity. Annu Rev EcolSystemat. 1983;14(1):465–485.
[72] Ebert D, Bull JJ. Evolution in health and disease. In:Stearns SC, Koella JC, eds. Evolution in health anddisease: Oxford University Press; 2008. p. 153–167.
[73] Alizon S, Hurford A, Mideo N, et al. Virulence evolutionand the trade-off hypothesis: history, current state of affairsand the future. J Evol Biol. 2009;22(2):245–259.
[74] Govan V, Brözel V, Allsopp M, et al. A PCR detectionmethod for rapid identification of Melissococcus plutonin honeybee larvae. Appl Environ Microbiol. 1998;64(5):1983–1985.
[75] Fries I, Camazine S. Implications of horizontal andvertical pathogen transmission for honey beeepidemiology. Apidologie. 2001;32(3):199–214.
[76] Forsgren E, Budge GE, Charrière J-D, et al. Standardmethods for European foulbrood research. J ApicultRes. 2013;52(1):1–14.
[77] Arai R, Miyoshi-Akiyama T, Okumura K, et al.Development of duplex PCR assay for detectionand differentiation of typical and atypicalMelissococcus plutonius strains. J Vet Med Sci.2014;76(4):491–498.
[78] Crailsheim K, Brodschneider R, Aupinel P, et al.Standard methods for artificial rearing of Apis melliferalarvae. J Apicult Res. 2013;52(1):1–16.
[79] Human H, Brodschneider R, Dietemann V, et al.Miscellaneous standard methods for Apis melliferaresearch. J Apicult Res. 2013;52(4):1–53.
[80] López JH, Schuehly W, Crailsheim K, et al. Trans-generational immune priming in honeybees. Proc RoySoc Lond B Biol Sci. 2014;281(1785):20140454.
[81] Hall BG, Acar H, Nandipati A, et al. Growth ratesmade easy. Mol Biol Evol. 2013;31(1):232–238.
[82] Kaplan EL, Meier P. Nonparametric estimation fromincomplete observations. J Am Stat Assoc. 1958;53(282):457–481.
[83] Therneau T. A package for survival analysis in S.R Package Version. 2015;2.37-7:2014.
566 D. GROSSAR ET AL.

[84] Holm S. A simple sequentially rejective multiple testprocedure. Scand J Stat. 1979;6(2):65–70.
[85] Medrzycki P, Giffard H, Aupinel P, et al. Standardmethods for toxicology research in Apis mellifera.J Apicult Res. 2013;52(4):1–60.
[86] Petzoldt T. Growthrates: estimate growth rates fromexperimental data. R Package. 2016.
[87] Madigan MT, Martinko JM, Parker J. Brock biology ofmicroorganisms.Upper Saddle River, NJ: Prentice hall; 1997.
[88] Elso CM, Roberts LJ, Smyth GK, et al. Leishmaniasis hostresponse loci (lmr1–3)modify disease severity through a Th1/Th2-independent pathway. Gene Immun. 2004;5(2):93–100.
[89] Baldwin T, Sakthianandeswaren A, Curtis JM, et al.Wound healing response is a major contributor tothe severity of cutaneous leishmaniasis in the earmodel of infection. Parasite Immunol. 2007;29(10):501–513.
[90] Smyth G, Hu Y, Dunn P, et al. Statmod: statisticalModeling. R package version 1.4. 21. Available from:http://cran/.r-project.org/package=statmod, 2015.
[91] McClelland EE, Bernhardt P, Casadevall A. Estimatingthe relative contributions of virulence factors forpathogenic microbes. Infect Immun. 2006;74(3):1500–1504.
VIRULENCE 567


![Perinatal Group B Streptococcal Infections: Virulence Factors, … · 2020-03-13 · are attributable to GBS [12–14]. The bacterial and host determinants that promote GBS vaginal](https://img.pdfslide.us/doc/110x75/5f7bfe66bbb7fb6ade5d7409/perinatal-group-b-streptococcal-infections-virulence-factors-2020-03-13-are.jpg)