Embed Size (px)
Citation preview
Pushback for Overlay Networks: Protecting against Malicious Insiders?
Angelos Stavrou1, Michael E. Locasto2, and Angelos D. Keromytis3
1 Computer Science Department, George Mason University2 Institute for Security Technology Studies, Dartmount College
3 Computer Science Department, Columbia University
Abstract. Peer-to-Peer (P2P) overlay networks are a flexible way of creating decentralized services. Althoughresilient to external Denial of Service attacks, overlay networks can be rendered inoperable by simple floodingattacks generated from insider nodes.In this paper, we study detection and containment mechanisms against insider Denial of Service (DoS) attacks foroverlay networks. To counter such attacks, we introduce novel mechanisms for protecting overlay networks thatexhibit well defined properties due to their structure against non-conforming (abnormal) behavior of participatingnodes. We use a lightweight distributed detection mechanism that exploits inherent structural invariants of DHTs toferret out anomalous flow behavior.We evaluate our mechanism’s ability to detect attackers using our prototype implementation on web traces fromIRCache served by a DHT network. Our results show that our system can detect a simple attacker whose attacktraffic deviates by as little as 5% from average traffic. We also demonstrate the resiliency of our mechanism againstcoordinated distributed flooding attacks that involve up to 15% of overlay nodes. In addition, we verify that ourdetection algorithms work well, producing a low false positive rate (< 2%) when used in a system that servesnormal web traffic.
1 Introduction
Peer-to-Peer (P2P) overlay networks are a powerful and flexible way of creating decentralized routing services forvarious applications, including content distribution and multimedia streaming [11, 13, 3, 20], network storage [7, 18,9], resilience [2], packet delivery using rendezvous-based communications [19] and denial of service (DoS) protection[12]. A large number of overlay networks, such as CHORD [6], CAN [16], PASTRY [17] and TAPESTRY [8], arestructured; that is, they use Distributed Hash Tables (DHTs) to perform directed routing. The use of DHTs imposes aninherent structure which dictates a well-defined and bounded set of neighbors in each P2P node. These neighbors areused by the P2P node to communicate all of its requests and replies. In addition, requests arriving from neighbors areappropriately forwarded to other neighbors until they are routed to the right overlay node. In a healthy overlay network,we expect that the load generated or forwarded by a node is, on the average, statistically similar (but not identical)to the traffic generated by any other overlay node; that is, we do not expect that the traffic will start be deviating toomuch from the average traffic generated by other nodes in the system. This is even more true for overlay networks thatprovide a service where clients do not actively participate in the overlay, such as I3 [19], Oceanstore [9], SOS [12] andothers.
In this paper, we investigate methods to identify the traffic anomalies that can arise from deliberate attacks. Ourdetection algorithms do not depend on object popularity. Instead, we base them on measures of aggregate packetflows. Doing so enables us to avoid exorbitant storage and processing costs and maintain scalability in terms of thenumber of overlay participants. Although other researchers have used statistical methods to detect and examine ag-gregate flows [5, 14], we are the first to consider the use of such methods in an overlay network setting that takes intoconsideration the neighbor-structure of P2P systems.
In general, we can protect an overlay network that has the following properties:
– The neighbors of each overlay participant are known for a window of time– We can determine (within bounds) the fraction of requests we expect to receive from each neighbor
? This work was supported by the National Science Foundation under NSF grant CNS-07-14277. Any opinions, findings, con-clusions, or recommendations expressed in this material are those of the authors and do not necessarily reflect the views of theNational Science Foundation.
The above properties hold for almost all DHT-based Overlays (CAN is an exception) and even some randomizedones where the set of neighbors is of fixed size and the search requests have a predefined maximum length. Althoughwe do not address misrouting directly as in [4], we do not allow mis-forwarding or neighbor spoofing: every node has afixed list of known authenticated neighbors using pair-wise symmetric keys. Only these neighbors are allowed to routepackets through the node and only to valid destinations according to the structure of the overlay. All other traffic isdropped, making objects reachable only by nodes that follow proper routing. By exposing traffic anomalies, our workprevents nodes from dropping or injecting requests, thereby encouraging nodes to conform to “normal” forwardingbehavior with respect to the rest of the flow aggregate.
1.1 Pushback-like protocol
Pushback [10] is a router-based mechanism for defending against DDoS attacks. In a Pushback-enabled routing sys-tem, a router cognizant of the bandwidth limitations of downstream nodes may adopt a more proactive forwardingstrategy. Instead of sending packets down a congested link (where they would be lost) or dropping such packets itself(which does not address the root of the problem: too much inbound traffic), the router would instruct (some of) its up-stream routers not to forward certain packets. Heuristics are employed to identify the flows, or “aggregates” (packetshaving some common property, such as the same destination IP address and TCP port), responsible for the downstreamcongestion. The router examines its incoming (with respect to those flows) links, and the fraction of upstream routersresponsible for most of the incoming packets belonging to the aberrant flow are asked to rate limit that flow. Theserouters, in turn, recursively apply this mechanism.
Pushback, as proposed [10], works best when malicious traffic is anisotropically distributed around the Internet, sothat some routers might rate limit traffic more severely than others. It also requires some level of trust between routers,an expectation that turns out to be somewhat unrealistic when crossing administrative boundaries (e.g., an ISP’s borderor peering routers). The Pushback system also assumes that the participating routers would not misbehave in theirexecution of the Pushback mechanism and protocol.
There are two fundamental differences between that original setup and an overlay network: in the latter, the nodesthemselves are both the originators of traffic and overlay “routers”, and we have to assume that some of them will becompromised. Furthermore, not only can a compromised overlay node flood the network with traffic but it can alsodrop traffic meant to be routed to another destination via one of its neighbors.
Thus, in an overlay network, we have two types of misbehaving flows: flooding flows and packet drops. For ex-cessive flows we first rate limit the offending aggregate flow and notify the upstream overlay neighbor of the problem,expecting him to rate limit the offending flow. For packet drops, we contact our neighbors’ neighbors asking themto give us the counts for the aggregate flows in question, until we find a conflicting count indicating the node thatdrops the packets or lies about its aggregate packet count. By recursive and distributed application, this pushback-likeprotocol allows us to isolate the attacking nodes, quenching at the same time the effects of the attack. Of course, if oursystem has a lot of attackers collaborating with each other to both not comply but also to falsify their aggregate rates,pushback itself can be exploited by the attackers to generate additional traffic to the overlay network. On the otherhand, even if the attackers are a significant portion of the network, if they are not coordinated they can be identifiedand isolated by the rest of the overlay nodes. An important assumption is that neighboring nodes cannot fake theiridentities, that is, they cannot pretend to be another node in the overlay. There are many mechanims that we can usedepending on the underlying network and operating system cryptographic facilities available to the nodes. For ex-ample, if the underlying network is the public Internet, we can set up pairwise-authenticated encrypted tunnels usingIPsec, GRE, or some other encapsulation protocol used to identify the origin of the traffic.
1.2 Our Approach
We test our implementation using traffic from actual web server caches [1] to drive the detection process. To thatend, we extract the source of the request and the requested object and use their hash values to map them into sourcesand objects in our system. This way we test the performance our system under normal traffic tuning the necessaryparameters to limit false positives. Our results show that:
1. We can efficiently detect and mark excessive flows even when up to 25% of the system’s nodes have been com-promised.
2. Our algoritms require O(log2(N)) of memory per node, where N is the overlay nodes.
3. The proposed pushback-like protocol remains effective even when up to 15% of the overlay nodes attempt acoordinated attack
Our work is the first that attempts to detect, identify and isolate DOS flooding attacks initiated from inside anOverlay Network. The novelty of our approach lies in the exploitation of the properties inherent in these P2P systemswith inference-based techniques.
2 Flow Model Description
This Section presents the notation we use to describe what we consider a “structured” P2P system, formally definesour notion of an attack, and provides a description of invariants that structured P2P systems exhibit.
2.1 Structured P2P Systems
A structured P2P system maps a set of keys Kids to a set of nodes of size N and provides a distributed routing algorithmamong these nodes. When a node n wishes to forward a message to the node holding key k, each P2P node on theroute forwards the packet to the next P2P node along the path.
A flow, (s, k), consists of the set of search requests sent from node s to the key k ∈ Kids. Let λS ,K be the rateof packet transmissions from nodes in S to keys in K, and let λK
avg =λS ,K
|S | , i.e., it is the average rate at which a nodetransmits requests toward keys in K. Objects stored in the P2P system may have different popularity, i.e., that in generalλk1
avg , λk2avg for k1 , k2.
Initially, we also assume that for a fixed object k, the popularity of this object is similar among the participantsof the P2P network: λS ,k = λk
avg for all S, k. We expect that as |S | grows, if the nodes that comprise S are chosen atrandom, then λS ,k will quickly approach λk
avg.
2.2 DoS Attackers & Attack Intensity
We consider DoS attacks targeted toward a specific key or set of keys. Such an attack could be mounted to block accessto data associated with a particular key. A node that is the origin point of excessive packets toward key k is said to bean attacker of key k.
In a healthy P2P network, the rate of a flow λS ,k from a fairly large, randomly selected group of nodes S towarda set of keys K should closely approximate the popularity of that object λK
avg. We say that a flow aggregate (S ,K) ismisbehaving if λs,K > (δ + 1) · λK
avg = λKmax for some δ > 0, where δ represents a lower bound on the proportional
increase that a flow can transmit relative to the average rate before the flow is labeled as misbehaving. The previousnotion can be extended to a set of nodes S as λS ,K > |S | · (δ + 1) · λK
avg = |S | · λKmax. Note that for a set of nodes,
the maximum rate allowed before we declare the aggregate flow as misbehaving depends on the size of the set. Theselection of δ is a measure of the tolerance that we allow between different nodes (or groups of nodes) in the P2Psystem before declaring that a flow is misbehaving. If we assume a totally homogeneous system, then δ = 0 — i.e., nodeviations from the average rate (popularity) are allowed. Larger values allow more tolerance, but also give an attackermore freedom to deviate from the average rate and avoid detection. Typically, we select δ = 0.1 which means that wedetect flows that send ten percent more than the average rate of a set of keys K.
We define β to be the proportion by which one attacker increases its traffic toward k above λkavg such that the
attacker transmits packets toward key k at a rate of (β + 1) · λkavg. If Na is the number of attacking nodes, the total
amount of excessive search requests injected into the system by the attackers is β ·Na ·λkavg. The rate of search requests
λattc, the target node experiences under attack is:
λattc =Na
N· (β + 1) · λk
avg +(N − Na)
N· λk
avg
Let f = Na/N be the fraction of nodes compromised; we define the attack intensity, or gain due to the attack, DA, tobe the increase in the popularity of the target key k caused by the attackers’ excessive search requests:
DA =λk
attc
λkavg
For example, if DA = 2, the node that stores the object under attack has to serve twice as many search requests forthat object. For the attackers’ queries to be harmful to the target node that stores the keys being attacked, DA must belarge. If an attacker only controls a limited number of nodes, their only choice is to increase β. A large β and small fmeans that there will be a relatively small number of attack flows, and that these attack flows will inject significantlymore traffic toward k. Our methods to detect misbehaving nodes will utilize the following measure:
– Fixed-Key Variable-Source (FKVS):
α(c,K, S 1, S 2) =λc
S 1,K
λcS 2,K
The FKVS measure compares the rates of two sets of sources for a particular set of keys. In a healthy P2P system,for appropriately sized (large) sets S 1 and S 2, if c lies on the paths from all S 1 and S 2 to the nodes storing keys K, weshould have that α(c,K, S 1, S 2) = |S 1|/|S 2|.
3 Statistical Bounds of Flows
We now present methods that use the previously introduced metrics to identify misbehaving flow aggregates and markpackets that belong to these aggregates. The total number of possible flows in a P2P system is N · |Kids|. Thus, trackingeach individual flow would require O(N · |Kids|) memory. Even if we fully distributed the tracking load amongst allparticipating nodes, O(|Kids|) memory would be needed to collectively track all flows.
To avoid utilizing such a potentially huge amount of memory per node, we track a set of aggregate flows whosesize is O(log(N)) by taking advantage of the fact that the number of flows in each of the incoming and outgoingneighbors is O(log(N)). We require that each node c consider as a separate aggregate all flows that arrive via thesame incoming neighbor and exit via the same outgoing neighbor. Hence, there are O(log2(N)) aggregates to consider.By numbering the neighbor nodes in Inc and in Outc, we can identify the flow aggregate that enters through the i-thneighbor and departs through the j-th neighbor as fi, j, where i = 0 implies the flow originates at c and j = 0 impliesthe flow terminates at c. Aggregate fi, j is assigned a counter, Ci, j. When a packet arrives, we increment the counter thatcorresponds to the aggregate flow to which the packet belongs.
3.1 Comparison of Aggregate Flows
Our detection algorithm compares each flow’s counter Ci, j to the counter for all the aggregate of flows that exit to thesame outgoing neighbor. We wish to determine the likelihood that, in a healthy P2P system, Ci, j can have the valueobserved, under the assumption that C j is made up mainly of healthy flows. More formally, let Xi, j and X j respectivelybe random variables that equal the value of these counters in healthy P2P system, and determine P(Xi, j ≥ Ci, j|X j = C j).(Note that Ci, j and C j represent actual observed values in the real system, whereas Xi, j and X j are values that occur ina trial on top of a healthy P2P system.) The larger this probability, the more confidence we have that flows enteringthrough neighbor i and exiting out of neighbor j are healthy. We define ε to be our level of confidence of the test. IfP(Xi, j ≥ Ci, j|X j = C j) < ε, then (according to this test) there is a probability < ε that fi, j is healthy. By comparing thisvalue to the observed values of the counters, we can determine, within a certain confidence level, whether one flow’srate is higher with respect to the all the other flows’ rate.
In the previous calculations, we don’t need to assume anything about the flows’ distribution. While any slightdeviation from the normal transmission rate could be flagged as a violation, we allow a small degree of variability.Hence, we apply our “slack” factor, δ, and say that flow fi, j is misbehaving when the actual ratio of observed rates islarger than (1 + δ)α(c,K, S i, S ′i ) for the second test. Setting δ to 0 leaves no slack. If fi, j sends at a rate even slightlyabove its supposed rate in a healthy P2P system, the central limit theorem tells us that eventually, fi, j will be flaggedas unhealthy. Setting δ to larger values allows for additional slack.
4 Application to a DHT System
A Chord peer to peer system consists of a set nodes of size N that try to serve objects that are hashed and storedin nodes using an m bit hash function. The key identifiers Kids are placed in circular order, creating a ring of lengthK = ‖Kids‖ = 2m. To simplify the notation, all math in the remainder of this section is performed modulo K. Each
node is assigned an identifier (id) from the key space, thus creating a node ring. Since we have a circular placement,we have for each node c a successor node and a predecessor node. Each node is assigned a set of keys, meaning thatthe node either stores or knows the location of all the objects in its local database that hash to its value.
4.1 Chord Invariants and Tests
Proposition 1 Let i1 > i2. If the set of flows (S i2 ,K) that pass through c is non-empty, then:
α(c,K, S i1 , S i2 ) = 2i1−i2 .
Proof. In the Appendix
Proposition 2 If the set of flows (S ,K) that pass through c is non-empty, where S = ∪ jS j, then:
α(c,K, S i1 , S ) =1
2log(N)−i1 − 1
Proof. The proof follows the form of Proposition 1, noting that there are∑log(N)−i1
j=0 2i1− j sources from S to K that enterc (through any finger).
5 Experimental Results
5.1 Web Trace-driven Simulations
To test our implementation, we used web traces obtained from IRCache repository [1] to drive our simulated envi-ronment. As we will soon present, our experiments show that under non-attacking conditions our system does notgenerate excessive false positives (less than 2% false positives).
Our first goal was to verify the effectiveness of our detection algorithm and to evaluate its performance. To thatend, we use an implementation of the Chord peer to peer network in a series of simulations. In all of our experiments,some of the participating peer to peer nodes assume the role of the “attacker”. The “attackers” select a key at randomfrom the set of allowed keys and generate a disproportionate number of search requests towards that key. The node thatstores the key under attack is the target. The goal of the attackers is to flood the target with search requests, cripplingits ability to respond. In general, the attackers are allowed to select multiple targets simultaneously. However, if weassume that attackers have abundant but nonetheless limited resources, aiming at multiple targets will only lower theiraggregate attack ability. Indeed, the attackers will have to split their attack requests between the different targets,reducing their attack intensity. We formally defined attack intensity as the increase in the search request traffic towardsthe target key caused by the attackers’ excessive search requests. For example, an attack intensity of DA = 2 meansthat the node that stores the key under attack has to serve twice as many search requests for that object as it wouldnormally have.
We use the notion of attack intensity to formally quantify the attack ability of the compromised nodes. Where ourtest is working perfectly, marking only excessive search requests, only a fraction β
β+1 of packets in the attacking flowshould be marked. We determine our performance by measuring our ability to detect the attack as close to the attackeras possible. Also, we want to mark the malicious search requests as many times as possible along the path from theattacker to the target object. All of these metrics are dependent both on the attack intensity and the relative attacker’sdistance from attacked key.
Another goal of our experiments was to identify the limits of our detection algorithm. Our attack detection methodidentifies aggregate groups containing attackers by marking packets from these groups as “excessive” whenever ourestimates predict that the groups are transmitting at too high a rate. Since we operate at the granularity of groups, weintroduce a false positive error for the non-attacking individual flows which happen to be grouped with “excessive”ones. As we show, this error is relatively small because the vast majority of the requests from a malicious aggregateflow belong to the attacker. Moreover, the attack requests get marked multiple times along the path from the attackerto the target. Another potential source of error can arise due to the use of statistical inference. Of course, this error canbecome arbitrarily small by selecting a higher confidence interval. In our simulations we used a 0.999% confidenceinterval.
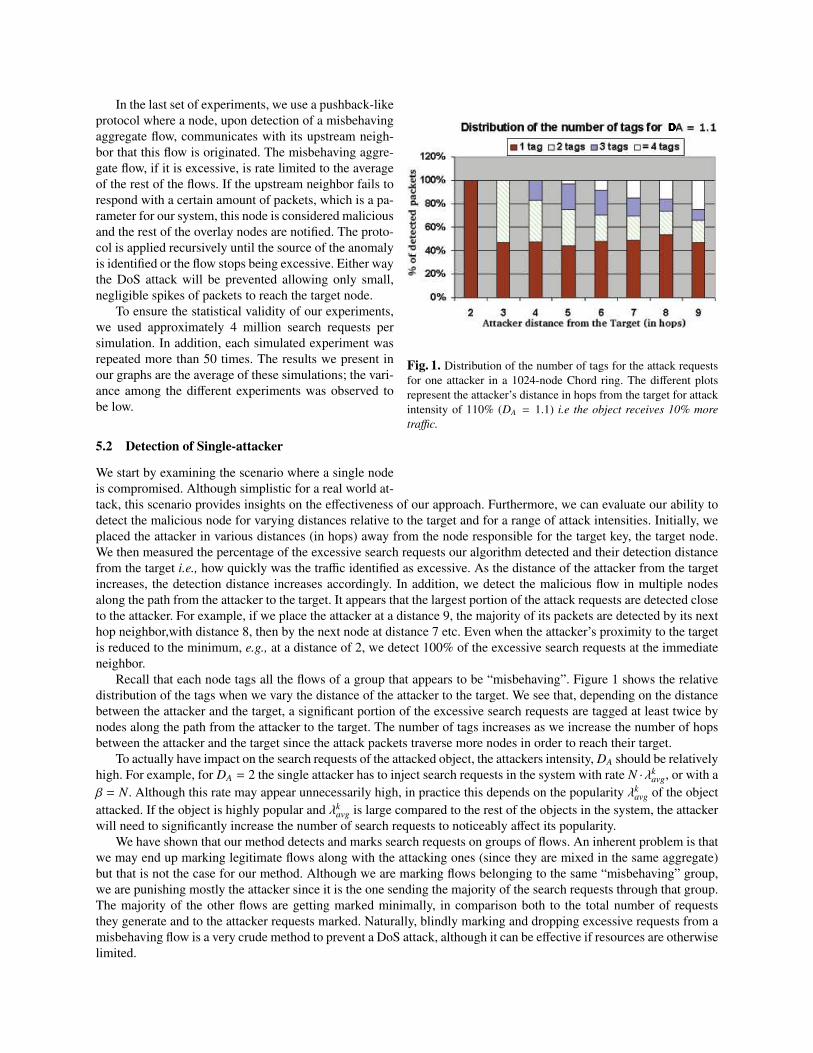
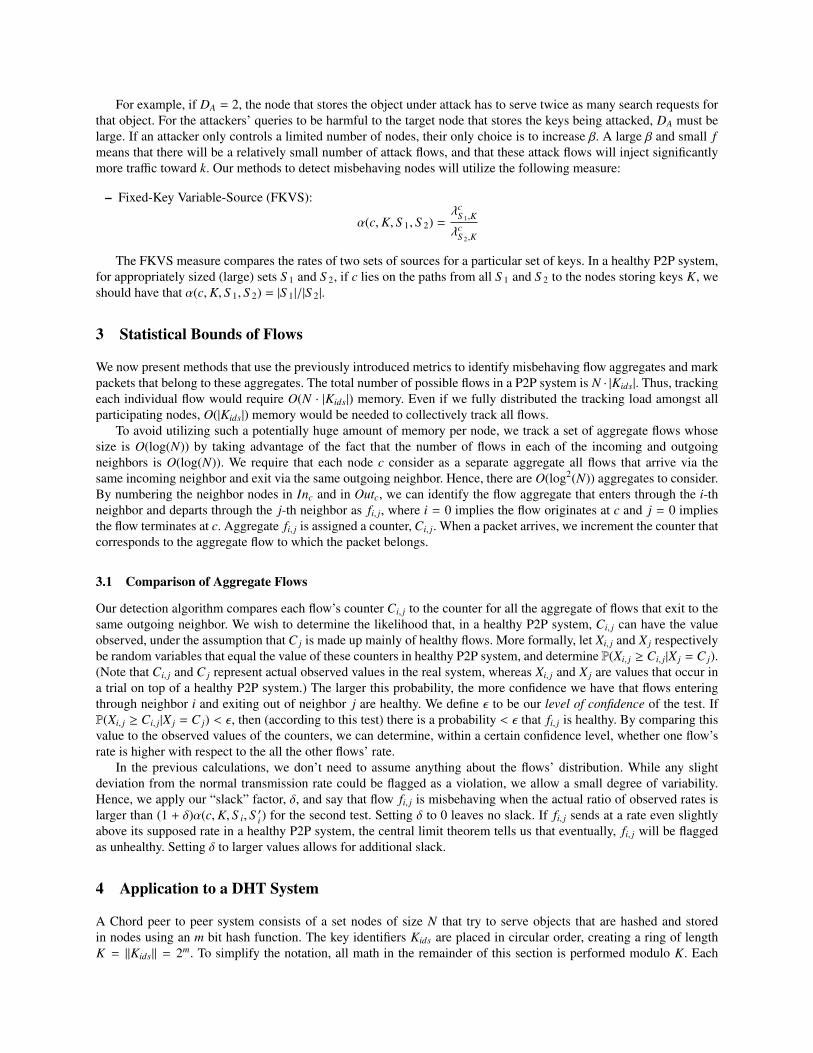
Fig. 1. Distribution of the number of tags for the attack requestsfor one attacker in a 1024-node Chord ring. The different plotsrepresent the attacker’s distance in hops from the target for attackintensity of 110% (DA = 1.1) i.e the object receives 10% moretraffic.
In the last set of experiments, we use a pushback-likeprotocol where a node, upon detection of a misbehavingaggregate flow, communicates with its upstream neigh-bor that this flow is originated. The misbehaving aggre-gate flow, if it is excessive, is rate limited to the averageof the rest of the flows. If the upstream neighbor fails torespond with a certain amount of packets, which is a pa-rameter for our system, this node is considered maliciousand the rest of the overlay nodes are notified. The proto-col is applied recursively until the source of the anomalyis identified or the flow stops being excessive. Either waythe DoS attack will be prevented allowing only small,negligible spikes of packets to reach the target node.
To ensure the statistical validity of our experiments,we used approximately 4 million search requests persimulation. In addition, each simulated experiment wasrepeated more than 50 times. The results we present inour graphs are the average of these simulations; the vari-ance among the different experiments was observed tobe low.
5.2 Detection of Single-attacker
We start by examining the scenario where a single nodeis compromised. Although simplistic for a real world at-tack, this scenario provides insights on the effectiveness of our approach. Furthermore, we can evaluate our ability todetect the malicious node for varying distances relative to the target and for a range of attack intensities. Initially, weplaced the attacker in various distances (in hops) away from the node responsible for the target key, the target node.We then measured the percentage of the excessive search requests our algorithm detected and their detection distancefrom the target i.e., how quickly was the traffic identified as excessive. As the distance of the attacker from the targetincreases, the detection distance increases accordingly. In addition, we detect the malicious flow in multiple nodesalong the path from the attacker to the target. It appears that the largest portion of the attack requests are detected closeto the attacker. For example, if we place the attacker at a distance 9, the majority of its packets are detected by its nexthop neighbor,with distance 8, then by the next node at distance 7 etc. Even when the attacker’s proximity to the targetis reduced to the minimum, e.g., at a distance of 2, we detect 100% of the excessive search requests at the immediateneighbor.
Recall that each node tags all the flows of a group that appears to be “misbehaving”. Figure 1 shows the relativedistribution of the tags when we vary the distance of the attacker to the target. We see that, depending on the distancebetween the attacker and the target, a significant portion of the excessive search requests are tagged at least twice bynodes along the path from the attacker to the target. The number of tags increases as we increase the number of hopsbetween the attacker and the target since the attack packets traverse more nodes in order to reach their target.
To actually have impact on the search requests of the attacked object, the attackers intensity, DA should be relativelyhigh. For example, for DA = 2 the single attacker has to inject search requests in the system with rate N ·λk
avg, or with aβ = N. Although this rate may appear unnecessarily high, in practice this depends on the popularity λk
avg of the objectattacked. If the object is highly popular and λk
avg is large compared to the rest of the objects in the system, the attackerwill need to significantly increase the number of search requests to noticeably affect its popularity.
We have shown that our method detects and marks search requests on groups of flows. An inherent problem is thatwe may end up marking legitimate flows along with the attacking ones (since they are mixed in the same aggregate)but that is not the case for our method. Although we are marking flows belonging to the same “misbehaving” group,we are punishing mostly the attacker since it is the one sending the majority of the search requests through that group.The majority of the other flows are getting marked minimally, in comparison both to the total number of requeststhey generate and to the attacker requests marked. Naturally, blindly marking and dropping excessive requests from amisbehaving flow is a very crude method to prevent a DoS attack, although it can be effective if resources are otherwiselimited.
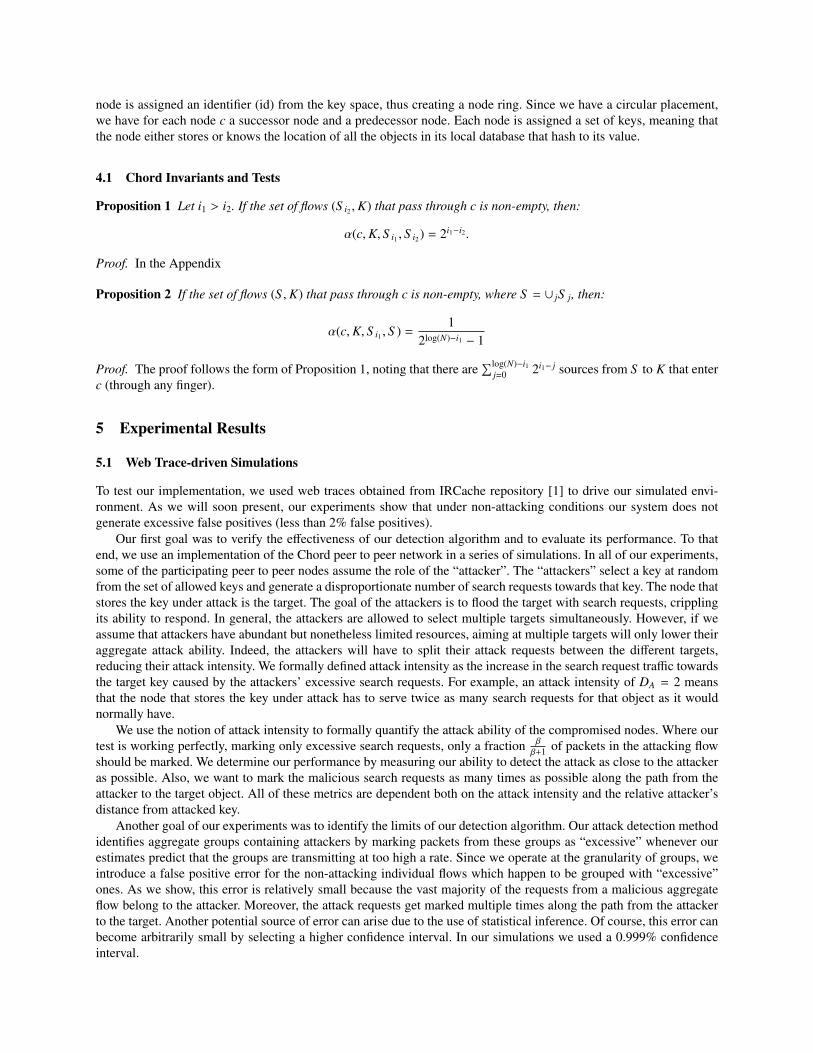
Fig. 3. Distribution of the number of tags for the detected at-tack packets for a 1024-node Chord ring with randomly selectedattacker-target placement. Each value on the X axis correspondsto exponentially increasing attack intensity (DA). The results av-eraged over 100 experiments for each attack intensity value.
Fig. 4. Percentage of attack packets detected when we varyboth the attack intensity DA and the fraction of nodes com-promised for a 4096-node Chord ring. Each line representsdifferent attack intensity values. We can see that as we in-crease the attack intensity we can detect more percentage ofthe attackers’ request even when the attack is very distributed.
Fig. 2. Attack packets detected for one attacker randomly placedin a 1024-node Chord ring. The different bars correspond to in-creasing values of attack intensity DA. The results presented arethe average of multiple experiments (100 per bar).
Through our experiments we wanted to ensure thatthere is no attacker placement inside the Chord ring thatour algorithm fails to detect. We are now in position topresent more realistic results from simulations in whichwe have one attacker randomly placed in a Chord ring ofsize 1024 (see Figure 2). We observe that even for verylow attack intensities values, DA = 1.025, a mere 2.5%increase in the load of the end server, we can detect morethan 40% of the attack packets. It is easy to see that forattack intensity values larger than 0.05 our method de-tects a significant portion of the excessive requests. Asthe intensity of the attack diminishes, our detection re-sults become weaker. This is something we expected,since our algorithm detects excessive requests based onmeasurements done on groups of flows where small vari-ations in the intensity of one flow does not have signif-icant impact on the aggregate flow. For some values ofattack intensity, especially for DA = 0.25, we have anover-marking of the attacker search requests which fadesout when the attack intensity becomes more significant.This is due to the group detection nature of our algo-rithm and the fact that aggregate groups of flows containboth legitimate and excessive flows originating from theattacker.
The number of tags for the attack packets is an increasing function of both the average attacker distance and ofthe attack intensity as shown in Figure 3. The average attacker distance seems to play a more prevalent role. Thismeans that as the average distance between the attacker and the target increases, so does our ability to tag the attackeron multiple locations along the attacker-target path. Thus our system works better as we increase the number ofparticipants in the DHT system, since the average distance between two nodes in the system increases. The detectionbehavior of our algorithm for attack intensities that are higher than DA = 11 is similar to those measured for DA = 11and we omit them from our figures.
5.3 Detection of Multiple Attackers
We now study the behavior of our detection algorithm using a Chord ring where we vary both the fraction of nodescompromised and the attack intensity. Figure 4 presents the results for a 4096-node Chord ring with multiple attackers.It is clearly shown that there is a correlation between the excessive search requests detected and the attack intensity.Our results show that as the attack becomes more severe, our ability to detect excessive search requests increases; evenwhen 40% percent of our nodes are compromised we are able to detect around 50% of the excess requests.
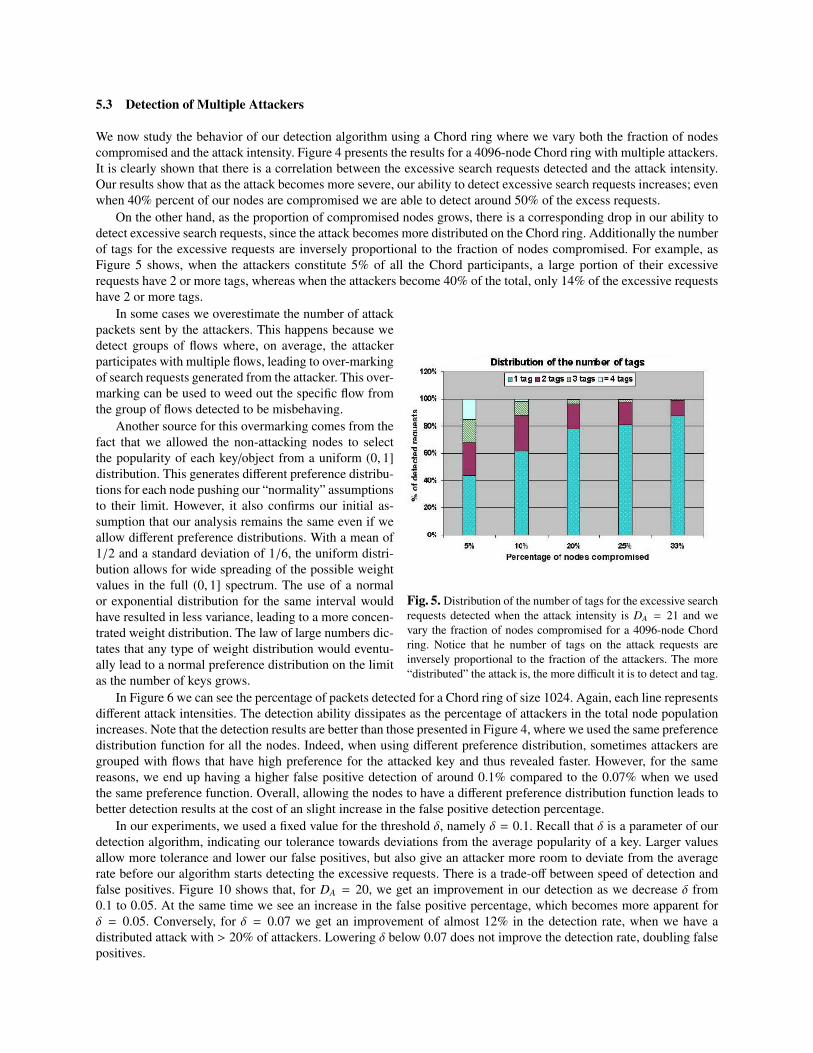
On the other hand, as the proportion of compromised nodes grows, there is a corresponding drop in our ability todetect excessive search requests, since the attack becomes more distributed on the Chord ring. Additionally the numberof tags for the excessive requests are inversely proportional to the fraction of nodes compromised. For example, asFigure 5 shows, when the attackers constitute 5% of all the Chord participants, a large portion of their excessiverequests have 2 or more tags, whereas when the attackers become 40% of the total, only 14% of the excessive requestshave 2 or more tags.
Fig. 5. Distribution of the number of tags for the excessive searchrequests detected when the attack intensity is DA = 21 and wevary the fraction of nodes compromised for a 4096-node Chordring. Notice that he number of tags on the attack requests areinversely proportional to the fraction of the attackers. The more“distributed” the attack is, the more difficult it is to detect and tag.
In some cases we overestimate the number of attackpackets sent by the attackers. This happens because wedetect groups of flows where, on average, the attackerparticipates with multiple flows, leading to over-markingof search requests generated from the attacker. This over-marking can be used to weed out the specific flow fromthe group of flows detected to be misbehaving.
Another source for this overmarking comes from thefact that we allowed the non-attacking nodes to selectthe popularity of each key/object from a uniform (0, 1]distribution. This generates different preference distribu-tions for each node pushing our “normality” assumptionsto their limit. However, it also confirms our initial as-sumption that our analysis remains the same even if weallow different preference distributions. With a mean of1/2 and a standard deviation of 1/6, the uniform distri-bution allows for wide spreading of the possible weightvalues in the full (0, 1] spectrum. The use of a normalor exponential distribution for the same interval wouldhave resulted in less variance, leading to a more concen-trated weight distribution. The law of large numbers dic-tates that any type of weight distribution would eventu-ally lead to a normal preference distribution on the limitas the number of keys grows.
In Figure 6 we can see the percentage of packets detected for a Chord ring of size 1024. Again, each line representsdifferent attack intensities. The detection ability dissipates as the percentage of attackers in the total node populationincreases. Note that the detection results are better than those presented in Figure 4, where we used the same preferencedistribution function for all the nodes. Indeed, when using different preference distribution, sometimes attackers aregrouped with flows that have high preference for the attacked key and thus revealed faster. However, for the samereasons, we end up having a higher false positive detection of around 0.1% compared to the 0.07% when we usedthe same preference function. Overall, allowing the nodes to have a different preference distribution function leads tobetter detection results at the cost of an slight increase in the false positive detection percentage.
In our experiments, we used a fixed value for the threshold δ, namely δ = 0.1. Recall that δ is a parameter of ourdetection algorithm, indicating our tolerance towards deviations from the average popularity of a key. Larger valuesallow more tolerance and lower our false positives, but also give an attacker more room to deviate from the averagerate before our algorithm starts detecting the excessive requests. There is a trade-off between speed of detection andfalse positives. Figure 10 shows that, for DA = 20, we get an improvement in our detection as we decrease δ from0.1 to 0.05. At the same time we see an increase in the false positive percentage, which becomes more apparent forδ = 0.05. Conversely, for δ = 0.07 we get an improvement of almost 12% in the detection rate, when we have adistributed attack with > 20% of attackers. Lowering δ below 0.07 does not improve the detection rate, doubling falsepositives.
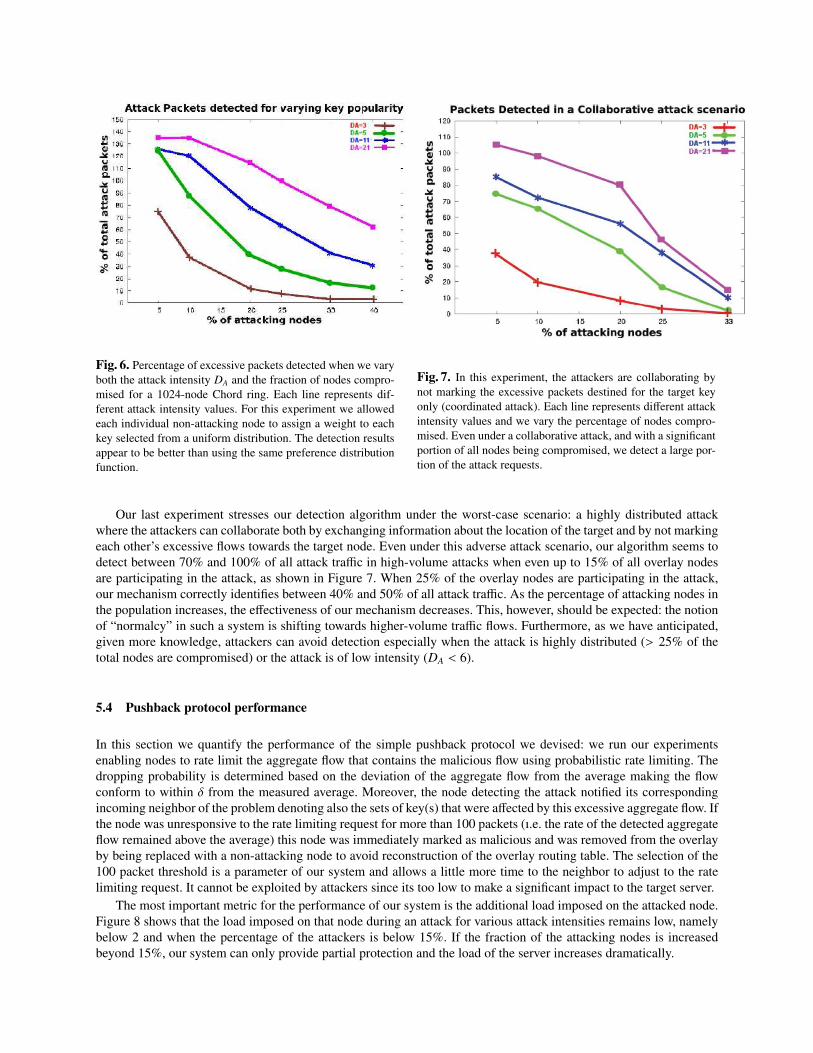
Fig. 6. Percentage of excessive packets detected when we varyboth the attack intensity DA and the fraction of nodes compro-mised for a 1024-node Chord ring. Each line represents dif-ferent attack intensity values. For this experiment we allowedeach individual non-attacking node to assign a weight to eachkey selected from a uniform distribution. The detection resultsappear to be better than using the same preference distributionfunction.
Fig. 7. In this experiment, the attackers are collaborating bynot marking the excessive packets destined for the target keyonly (coordinated attack). Each line represents different attackintensity values and we vary the percentage of nodes compro-mised. Even under a collaborative attack, and with a significantportion of all nodes being compromised, we detect a large por-tion of the attack requests.
Our last experiment stresses our detection algorithm under the worst-case scenario: a highly distributed attackwhere the attackers can collaborate both by exchanging information about the location of the target and by not markingeach other’s excessive flows towards the target node. Even under this adverse attack scenario, our algorithm seems todetect between 70% and 100% of all attack traffic in high-volume attacks when even up to 15% of all overlay nodesare participating in the attack, as shown in Figure 7. When 25% of the overlay nodes are participating in the attack,our mechanism correctly identifies between 40% and 50% of all attack traffic. As the percentage of attacking nodes inthe population increases, the effectiveness of our mechanism decreases. This, however, should be expected: the notionof “normalcy” in such a system is shifting towards higher-volume traffic flows. Furthermore, as we have anticipated,given more knowledge, attackers can avoid detection especially when the attack is highly distributed (> 25% of thetotal nodes are compromised) or the attack is of low intensity (DA < 6).
5.4 Pushback protocol performance
In this section we quantify the performance of the simple pushback protocol we devised: we run our experimentsenabling nodes to rate limit the aggregate flow that contains the malicious flow using probabilistic rate limiting. Thedropping probability is determined based on the deviation of the aggregate flow from the average making the flowconform to within δ from the measured average. Moreover, the node detecting the attack notified its correspondingincoming neighbor of the problem denoting also the sets of key(s) that were affected by this excessive aggregate flow. Ifthe node was unresponsive to the rate limiting request for more than 100 packets (ı.e. the rate of the detected aggregateflow remained above the average) this node was immediately marked as malicious and was removed from the overlayby being replaced with a non-attacking node to avoid reconstruction of the overlay routing table. The selection of the100 packet threshold is a parameter of our system and allows a little more time to the neighbor to adjust to the ratelimiting request. It cannot be exploited by attackers since its too low to make a significant impact to the target server.
The most important metric for the performance of our system is the additional load imposed on the attacked node.Figure 8 shows that the load imposed on that node during an attack for various attack intensities remains low, namelybelow 2 and when the percentage of the attackers is below 15%. If the fraction of the attacking nodes is increasedbeyond 15%, our system can only provide partial protection and the load of the server increases dramatically.
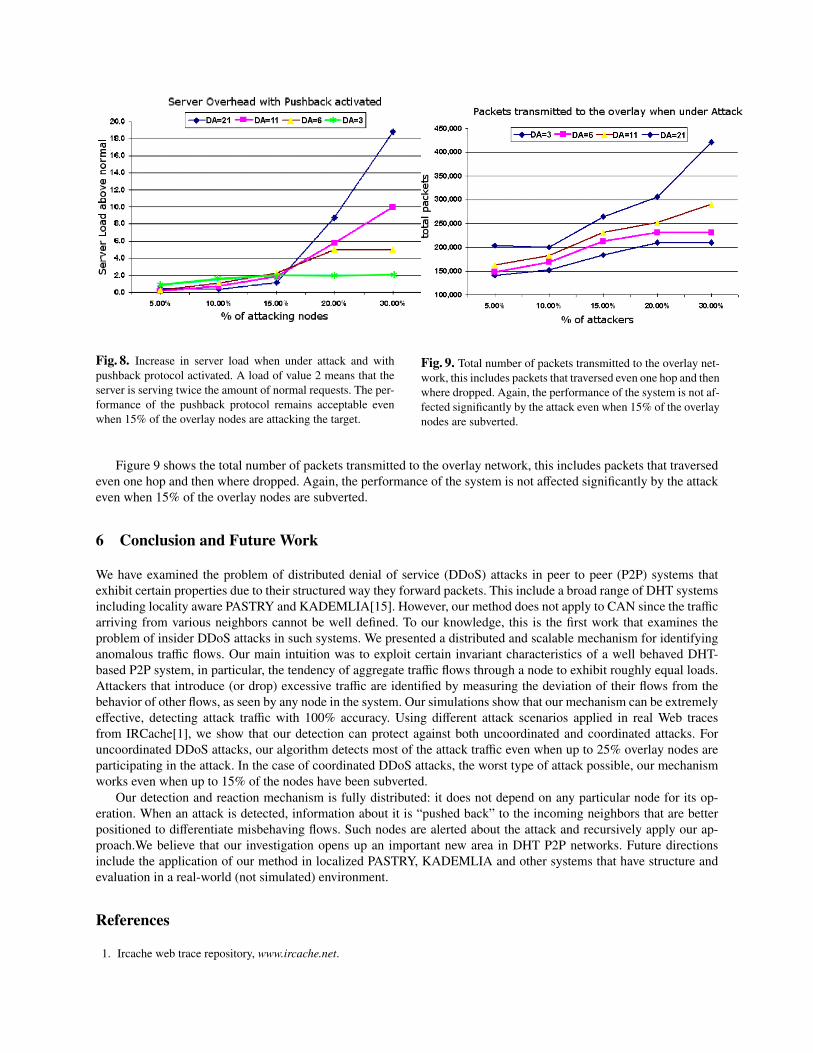
Fig. 8. Increase in server load when under attack and withpushback protocol activated. A load of value 2 means that theserver is serving twice the amount of normal requests. The per-formance of the pushback protocol remains acceptable evenwhen 15% of the overlay nodes are attacking the target.
Fig. 9. Total number of packets transmitted to the overlay net-work, this includes packets that traversed even one hop and thenwhere dropped. Again, the performance of the system is not af-fected significantly by the attack even when 15% of the overlaynodes are subverted.
Figure 9 shows the total number of packets transmitted to the overlay network, this includes packets that traversedeven one hop and then where dropped. Again, the performance of the system is not affected significantly by the attackeven when 15% of the overlay nodes are subverted.
6 Conclusion and Future Work
We have examined the problem of distributed denial of service (DDoS) attacks in peer to peer (P2P) systems thatexhibit certain properties due to their structured way they forward packets. This include a broad range of DHT systemsincluding locality aware PASTRY and KADEMLIA[15]. However, our method does not apply to CAN since the trafficarriving from various neighbors cannot be well defined. To our knowledge, this is the first work that examines theproblem of insider DDoS attacks in such systems. We presented a distributed and scalable mechanism for identifyinganomalous traffic flows. Our main intuition was to exploit certain invariant characteristics of a well behaved DHT-based P2P system, in particular, the tendency of aggregate traffic flows through a node to exhibit roughly equal loads.Attackers that introduce (or drop) excessive traffic are identified by measuring the deviation of their flows from thebehavior of other flows, as seen by any node in the system. Our simulations show that our mechanism can be extremelyeffective, detecting attack traffic with 100% accuracy. Using different attack scenarios applied in real Web tracesfrom IRCache[1], we show that our detection can protect against both uncoordinated and coordinated attacks. Foruncoordinated DDoS attacks, our algorithm detects most of the attack traffic even when up to 25% overlay nodes areparticipating in the attack. In the case of coordinated DDoS attacks, the worst type of attack possible, our mechanismworks even when up to 15% of the nodes have been subverted.
Our detection and reaction mechanism is fully distributed: it does not depend on any particular node for its op-eration. When an attack is detected, information about it is “pushed back” to the incoming neighbors that are betterpositioned to differentiate misbehaving flows. Such nodes are alerted about the attack and recursively apply our ap-proach.We believe that our investigation opens up an important new area in DHT P2P networks. Future directionsinclude the application of our method in localized PASTRY, KADEMLIA and other systems that have structure andevaluation in a real-world (not simulated) environment.
References
1. Ircache web trace repository, www.ircache.net.

2. D. Andersen, H. Balakrishnan, M. Kaashoek, and R. Morris. Resilient Overlay Networks. In SOSP, October 2001.3. S. Banerjee, C. Kommareddy, K. Kar, B. Bhattacharjee, and S. Khuller. Construction of an efficient overlay multicast infras-
tructure for real-time applications. In INFOCOM, April 2003.4. M. Castro, P. Drushel, A. Ganesh, A. Rowstron, and D. Wallach. Secure routing for structured peer-to-peer overlay networks.
In OSDI, 2002.5. R. H. K. Chen-Nee Chuah, Lakshminarayanan Subramanian. DCAP: Detecting Misbehaving Flows via Collaborative Aggre-
gate Policing. 33(5), October 2003.6. F. Dabek, F. Kaashoek, R. Morris, D. Karger, and I. Stoica. Wide-area cooperative storage with cfs. In SOSP, October 2001.7. F. Dabek, M. F. Kaashoek, D. Karger, R. Morris, and I. Stoica. Wide-area cooperative storage with CFS. In SOSP, October
2001.8. B. Y. Z. et al. Tapestry: A Global-scale Overlay for Rapid Service Deployment. IEEE Journal on Selected Areas in Communi-
cations, Special Issue on Service Overlay Networks, January 2004.9. J. K. et. al. OceanStore: An Architecture for Global-scale Persistent Storage. In ASPLOS, November 2000.
10. J. Ioannidis and S. M. Bellovin. Implementing Pushback: Router-Based Defense Against DDoS Attacks. In Proceedings ofthe Network and Distributed System Security Symposium (NDSS), February 2002.
11. J. Jannotti, D. K. Gifford, K. L. Johnson, M. F. Kaashoek, and J. W. O’Toole, Jr. Overcast: Reliable multicasting with anoverlay network. In OSDI, pages 197–212, October 2000.
12. A. D. Keromytis, V. Misra, and D. Rubenstein. SOS: Secure Overlay Services. In SIGCOMM, pages 61–72, August 2002.13. Z. Li and P. Mohapatra. QRON: QoS-aware routing in overlay networks. IEEE Journal on Selected Areas in Communications,
Special Issue on Service Overlay Networks, January 2004.14. A. Matrawy, P. C. van Oorschot, and A. Somayaji. Mitigating Network Denial-of-Service Through Diversity-Based Traffic
Management. In Proceedings of the 3rd International Conference on Applied Cryptography and Network Security (ACNS),pages 104–121, June 2005.
15. P. Maymounkov and D. Mazieres. Kademlia: A peer-to-peer information system based on the xor metric. In Proceedings ofIPTPS02, Cambridge, USA, March, 2002.
16. S. Ratnasamy, P. Francis, M. Handley, R. Karp, and S. Shenker. A Scalable Content-Addressable Network. In SIGCOMM,August 2001.
17. A. Rowstron and P. Druschel. Pastry: Scalable, Decentralized Object Location, and Routing for Large-Scale Peer-to-PeerSystems. Lecture Notes in Computer Science, 2218:329–350, 2001.
18. A. I. T. Rowstron and P. Druschel. Storage Management and Caching in PAST, A Large-scale, Persistent Peer-to-peer StorageUtility. In SOSP, pages 188–201, October 2001.
19. I. Stoica, D. Adkins, S. Zhuang, S. Shenker, and S. Surana. Internet indirection infrastructure. IEEE/ACM Trans. Netw.,12(2):205–218, 2004.
20. D. A. Tran, K. Hua, and T. Do. A peer-to-peer architecture for media streaming. IEEE Journal on Selected Areas in Commu-nications, Special Issue on Service Overlay Networks, January 2004.
A Appendix
A.1 Chord Invariants and Tests
Proposition 3 Let i1 > i2. If the set of flows (S i2 ,K) that pass through c is non-empty, then:
α(c,K, S i1 , S i2 ) = 2i1−i2 .
Proof. Assume the set of flows (S i2 ,K) that pass through c is non-empty. For each key k ∈ K, let us count the numberof sources whose transmissions would pass through node c, entering node c via the i2-th finger of node c− 2i2 en-routeto key k. Recall that the Chord forwarding protocol requires that a transmission be forwarded on the finger that takesthe transmission as far as possible in the clockwise direction without passing the destination. Since the i2-th fingertravels a distance of 2i2 around the ring, all transmissions prior to reaching node c must traverse a distance greater than2i2 , and the sequence of fingers taken after reaching c to then reach k is unique.
Consider a sequence of ` bits, b1b2 · · · b`, where ` = log(N) − i2, and consider the node s that is at distance∑`j=1 b j2 j+i2 from c in the counter-clockwise direction. Then, for node s to reach k, it will first traverse a series of
nodes where it exits through the j + i2-th outgoing finger of some node along the path when and only when b j = 1.After taking this series of fingers, the transmission will end up at node c by taking the i2-th finger of node c − 2i2
en-route to its final destination of k.Each of the 2` possible bit sequences produces a unique node s. Hence, there are 2` such nodes whose transmissions
to k first traverse a path that proceeds through c − 2i2 and takes its i2-th finger to reach c en-route to k. Furthermore,
since the only way a transmission can originate at a source s and reach k by taking the i2-th finger of c − 2i2 is topreviously take a strictly decreasing sequence of fingers, this set of 2` nodes is unique.
It follows that there are 2log(N)−i2 sources that can reach key k by transiting through the i2-th finger of c − 2i2 , andthere are 2log(N)−i1 sources that can reach k by transiting through the i1-th finger of c − 2i1 , so there are 2i2−i1 times asmany sources entering the i1-th finger of c to reach k as there are entering c through its i2-th incoming finger to reachk.
Since we assume that all sources have (approximately) the same interest in key k, and since this ratio remains fixedirrespective of the final distance of key k from c, the Lemma holds.
A.2 Evaluation Results
Fig. 10. The left graph shows the increase in the detection rate as we decrease our tolerance threshold from δ = 0.1 to δ = 0.05.The right graph shows the impact of this increase in the false positive percentage: lowering δ below 0.07 offers little benefit to thedetection rate while doubling false positives.


![Protecting our way of life | EPA · Natural Resources: Quality-Sensitive Aquifer Management Areas Overlay [rp] - Auckland Isthmus Volcanic Designations Designations: Airspace Restriction](https://img.pdfslide.us/doc/110x75/60657b13701fc6570811464a/protecting-our-way-of-life-epa-natural-resources-quality-sensitive-aquifer-management.jpg)