Embed Size (px)
Citation preview

1
WDNR - Using Snap-Plus to Quantify Phosphorus Trading Credits (10-23-2018)
Purpose The purpose of this document is to provide technical assistance for using the “P Trade” report in
SnapPlus to quantify Phosphorus Trading Credits. This document does not detail data needs for Snap-
Plus or how to use the Snap-Plus tool. It is recommended that individuals interested in using the Snap-
Plus tool review the Snap-Plus user manual, available at http://snapplus.wisc.edu/users-manual , and
attend a Snap-Plus training session to gain additional information about data needs and using this tool.
This document also refers to DNR’s WQ Trading Program - http://dnr.wisconsin.gov. DNR also has a
“Water Quality Trading How-To Manual”, or “How-To Manual”, which provides more comprehensive
guidance regarding trading. This resource is available for download at
http://dnr.wi.gov/topic/SurfaceWater/WaterQualityTrading.html.
Background on SnapPlus SnapPlus (Soil Nutrient Application Planner) is a widely used software program to prepare NRCS 590
standard compliant nutrient management plans. The program helps farmers make the best use of their
on-farm nutrients allowing informed and justified commercial fertilizer purchases. Two critical features
of this program related to water quality is its ability to generate, by field, a phosphorus index (PI) value
and capability to calculate soil erosion, based on the revised universal soil loss equation (RUSLE2). By
calculating potential soil and phosphorus runoff losses on a field-by-field basis while assisting in the
economic planning of manure and fertilizer applications, Snap-Plus provides Wisconsin farmers with a
tool for protecting soil and water quality. Snap-Plus is supported by UW-Madison Department of Soil
Science, DATCP, NRCS, UW-Extension, and DNR, and is available for download at
http://snapplus.wisc.edu/.
SnapPlus was recently augmented to quantify phosphorus reductions for trading and adaptive
management projects. SnapPlus, which has been calibrated using edge of field monitoring, is the
preferred tool for trading and adaptive management because it can quantify the amount of phosphorus
delivered from a farm field to the nearest surface water both with and without management practices
installed. Management practices that can be quantified include whole field management, cover crops,
conservation easements, and nutrient management and supporting practices, among other things.
A critical assumption of SnapPlus phosphorus loss calculations is that farm fields do not have ongoing
gullies or concentrated flow channel erosion. If fields have gullies or concentrated flow erosional
features, the P Trade report phosphorus loss calculation is underestimated and, accordingly, DNR may
not accept P Trade reports that contain these fields.
SnapPlus also does not account for tile drains and associated phosphorus loss to surface waters from
them. With that said, SnapPlus can still be used for tile drained fields; however, the uncertainty factor
for a tile drained field will need to be increased to account for the additional uncertainty associated with
the tile drainage. In addition, DNR’s guidance for Implementing Water Quality Trading and its “How-To
Manual” for Water Quality Trading prohibit application of manure, biosolid or industrial waste on tile
Page | 2
drained fields as a condition for receiving the corresponding uncertainty factor for either whole field or
nutrient management practices.
Data Inputs The P Trade Report is designed to aggregate data in SnapPlus to quantify the annual amount of
phosphorus that is delivered to the nearest receiving water from specific farm fields under different
management practices. For water quality trades that rely upon cropping practices, all fields owned and
operated by the farm should be included in the farm SnapPlus database. For water quality trades that
rely upon structural practices, only the fields with structural practices should be included in the farm
SnapPlus database. Figure 1 provides examples of structural and cropping practices.
Figure 1 – Examples of Structural and Cropping Practices
Structural Practices Cropping Practices
Riparian Buffers + Conservation Easements Nutrient Management
Riparian Filter Strip + Field Border Tillage + Residue Management
Grassed Waterway Cover Crops + Crop Rotation (e.g., increase perennial crops) Wetland Restoration Contour Farming + Contour Strips Sediment Control Basin Edge of Field Filter Strip Heavy Use Area Protection Manure Applications – timing, rates, amounts, methods, and
manure types Prescribed Grazing Conversion to Prairie
When using cropping practices for water quality trade include all fields owned or rented by farm to
demonstrate existing phosphorus losses are not ‘shifted’ to other fields ensuring an overall net
reduction in phosphorus load. If a farm’s fields are located in multiple watersheds, a farm database for
the fields within each watershed in question should be created.
Once the farm database has been created to reflect structural or cropping practices, it is important to
verify that all field information is included in the “Fields” tab, particularly the predominant soil type
information. The P Trade Report uses the predominant soil type (i.e., the largest soil unit within the
field) to quantify the phosphorus loss in lieu of the critical soil type used for calculation of the Wisconsin
P-Index. Other tabs in SnapPlus, including “Soil Tests” and “Nutrients”, should be filled out the same as
they would be when using SnapPlus to calculate a P-Index value.
Predominant soil type information is available from:
• Wisconsin 590 Interactive maps - http://www.manureadvisorysystem.wi.gov/app/interactive
• Web Soil Survey - http://websoilsurvey.sc.egov.usda.gov/App/HomePage.htm
A minimum of two years of historical data are needed in order to generate the P Trade Report. Historic
nutrient management plans and soil test values can be used to create the historic record and identify
current rotations and management practices for all fields in the farm database. Although a two-year
historic record is required for the P Trade Report, it is recommended the historic data for the full crop
rotation be used whenever available. If nutrient management plans are used in water quality trading,

Page | 3
they need to be updated after each crop year to reflect real, rather than planned, management. If
historic nutrient management plans are not available:
• Interview County LCD staff to gather additional information and help determine what
reasonable assumptions for fields included in the P Trade report
• Use County average cropping yield information. NOTE: Using county yield data with caution; it
may over or under-estimate field P losses based upon management
• Soil test all fields (routine agricultural soil test included soil test P and organic matter %) and
apply the current data to the historical record
Running the P Trade Report Once the historic record/cropping practices have been entered into SnapPlus database, run the P Trade
report, absent the new practices that will be installed to reduce phosphorus. This report provides field
specific annual phosphorus losses from the farm and will serve as the “baseline” for future comparisons.
Table 1 is an example “baseline” P Trade Report generated from SnapPlus.
Table 1 - Baseline P Trade Report Current cropland practices
Farm Field Acres PTP 2014
PTP 2015
PTP 2016
PTP 2017
PTP 2018
PTP 2019
PTP 2020
Farm A 80 1 21.0 50 18 18 14 35 175 170
Farm A 80 2 10.0 13 12 7 33 58 59 19
Farm A 80 3 12.0 10 7 5 36 59 66 19
Farm A 80 4 20.0 23 131 89 31 22 18 14
Farm A 80 6 12.0 13 9 7 45 99 78 23
Farm A HOME 1 22.0 158 41 20 19 14 34 168
Farm A HOME 2 12.0 19 68 67 25 16 13 10
Farm A HOME 3 10.0 49 6 26 35 8 6 4
Farm A HOME 4 9.0 9 43 147 161 44 17 16
Farm A HOME 5 7.0 20 66 75 23 13 13 10
Farm A MART 1 2.0 9 3 3 3 2 3 11
Farm A MART 2 23.0 15 18 14 22 44 80 20
Farm A MART 3 4.0 1 1 1 1 1 1 1
Farm A PASTURE East
3.0 45 46 46 47 47 48 48
Farm A PASTURE West
13.0 16 14 16 21 21 21 21
Farm A TILLIES 1 13.0 215 51 16 15 10 39 183
Farm A TILLIES 2 11.0 5 18 66 94 21 10 9
Farm A TILLIES 3 10.0 81 16 13 14 5 14 76
Farm A TILLIES 4 16.0 16 15 17 36 114 141 33
Farm A TILLIES 5 11.0 17 86 92 18 11 8 5
Farm A TILLIES 6 10.0 5 3 13 48 82 16 7
Total 251 788 671 757 741 726 859 867
PTP = Potentially Tradeable Phosphorus
Next, make a copy of the database, rename it to indicate it will include management changes, and open

Page | 4
the copied database in SnapPlus. Modify the Cropping inputs for each field to reflect management practices that will be installed or used as part of the water quality trade for the trade contract years. Run the P Trade report again to create a “reduction” report. Table 2 is an example “reduction” P Trade Report generated from SnapPlus. P reduction practices are planned for installation beginning in year 2016. Years P reduction practices installed Table 2 - Reduction P Trade Report
Farm Field Acres PTP 2014
PTP 2015
PTP 2016
PTP 2017
PTP 2018
PTP 2019
PTP 2020
Farm A 80 1 21.0 50 18 18 14 24 154 145
Farm A 80 2 10.0 13 12 7 31 71 57 19
Farm A 80 3 12.0 10 7 5 33 87 64 20
Farm A 80 4 20.0 23 131 89 31 22 18 14
Farm A 80 6 12.0 13 9 7 42 106 76 23
Farm A HOME 1 22.0 158 41 20 19 14 24 148
Farm A HOME 2 12.0 19 68 61 24 12 12 10
Farm A HOME 3 10.0 49 6 25 34 4 4 3
Farm A HOME 4 9.0 9 43 129 139 42 17 16
Farm A HOME 5 7.0 20 66 69 23 13 13 10
Farm A MART 1 2.0 3 2 2 2 2 2 5
Farm A MART 2 23.0 13 14 12 16 27 54 14
Farm A MART 3 4.0 1 1 1 1 1 1 1
Farm A PASTURE East
3.0 45 46 26 23 23 23 23
Farm A PASTURE West
13.0 16 17 21 21 21 22 22
Farm A TILLIES 1 13.0 215 51 16 15 10 24 151
Farm A TILLIES 2 11.0 5 18 60 82 20 10 9
Farm A TILLIES 3 10.0 81 16 13 14 5 9 65
Farm A TILLIES 4 16.0 16 15 17 26 90 122 31
Farm A TILLIES 5 11.0 17 86 84 18 11 8 5
Farm A TILLIES 6 10.0 5 3 9 40 71 15 7
Total 251 780 669 691 649 679 729 741
PTP = Potentially Tradeable Phosphorus
In order to determine the total phosphorus reduction for each year, subtract the total phosphorus load
calculated in the “reduction” report from the total phosphorus load calculated in the “baseline” report
for each field.
Snap Plus allows users to create reports using Adobe pdf, MS excel spreadsheet or other applications.
Using MS excel to create P Trade Reports can help make a field specific comparison between baseline
and reduction loads to calculate the resulting P savings. Table 3 provides a comparison example using
SnapPlus MS excel spreadsheet:

Page | 5
Years P reduction practices installed
Table 3 - Comparison of Baseline and Reduction Reports
Farm Field Acres PTP 2014
PTP 2015
PTP 2016
PTP 2017
PTP 2018
PTP 2019
PTP 2020
Farm A 80 1 21.0 Baseline 50 18 18 14 35 175 170
Farm A 80 1 21.0 Reduction 50 18 18 14 24 154 145
Farm A 80 1 21.0 Savings 0 0 0 0 11 21 25
Farm A 80 2 21.0 Baseline 13 12 7 33 58 59 19
Farm A 80 2 21.0 Reduction 13 12 7 31 71 57 19
Farm A 80 2 21.0 Savings 0 0 0 0 -23 2 0
Farm A 80 3 12.0 Baseline 10 7 5 36 59 66 19
Farm A 80 3 12.0 Reduction 10 7 5 33 87 64 20
Farm A 80 3 12.0 Savings 0 0 0 3 -28 2 -1
Farm A TILLIES 1 13.0 Baseline 215 51 16 15 10 39 183
Farm A TILLIES 1 13.0 Reduction 215 51 16 15 10 24 151
Farm A TILLIES 1 13.0 Savings 0 0 0 0 0 15 32
Farm A TILLIES 2 11.0 Baseline 5 18 66 94 21 10 9
Farm A TILLIES 2 11.0 Reduction 5 18 60 82 20 10 9
Farm A TILLIES 2 11.0 Savings 0 0 6 12 1 0 0
Farm A TILLIES 3 10.0 Baseline 81 16 13 14 5 14 76
Farm A TILLIES 3 10.0 Reduction 81 16 13 14 5 9 65
Farm A TILLIES 3 10.0 Savings 0 0 0 0 0 5 10
Farm A TILLIES 4 16.0 Baseline 16 15 17 36 114 141 33
Farm A TILLIES 4 16.0 Reduction 16 15 17 26 90 122 31
Farm A TILLIES 4 16.0 Savings 0 0 0 10 24 19 2
Farm A TILLIES 5 11.0 Baseline 17 86 92 18 11 8 5
Farm A TILLIES 5 11.0 Reduction 17 86 84 18 11 8 5
Farm A TILLIES 5 11.0 Savings 0 0 8 0 0 0 0
Farm A TILLIES 6 10.0 Baseline 5 3 13 48 82 16 7
Farm A TILLIES 6 10.0 Reduction 5 3 9 40 71 15 7
Farm A TILLIES 6 10.0 Savings 0 0 4 8 11 1 0
PTP = Potentially Tradeable Phosphorus
Different Timelines for P Trade Reports Practices to reduce P loads may be installed and maintained on agricultural fields as part of a Water Quality Trading proposal prior to the compliance date or reissuance of a permit with phosphorus effluent limits. If this occurs, the SnapPlus databases and P Trade reports may have different years from each other. Tables 4 and 5, the baseline report and reduction report, are set-up to reflect different timelines and Table 6 provides an example comparison calculation to determine the resulting load reduction.

Page | 6
Years with current practices Table 4 - Baseline Report
Farm Field Acres PTP 2010
PTP 2011
PTP 2012
PTP 2013
PTP 2014
PTP 2015
Farm X 1 21.0 28 30 28 31 33 35
Farm X 2 10.0 12 15 15 15 17 17
Farm X 3 12.0 10 8 10 9 11 8
Farm X 4 20.0 32 32 32 31 33 37
Total 63 82 85 85 86 94 97
PTP = Potentially Tradeable Phosphorus Years P reduction practices installed
Table 5 - Reduction Report
Farm Field Acres PTP 2016
PTP 2017
PTP 2018
PTP 2019
PTP 2020
PTP 2021
Farm X 1 21.0 16 6 8 16 10 13
Farm X 2 10.0 10 7 7 10 7 7
Farm X 3 12.0 5 6 7 9 10 8
Farm X 4 20.0 13 14 11 13 9 11
Total 63 44 33 33 48 36 39
PTP = Potentially Tradeable Phosphorus
As before, complete a field specific comparison between baseline (table 4) and reduction loads (table 5)
to calculate the resulting P savings. Table 6 provides an example of this comparison:
Table 6 - Comparison Example Farm Field Acres PTP PTP PTP PTP PTP PTP
Farm X 1 21.0 Baseline 2010-2015 28 30 28 31 33 35
Reduction 2016-2021 16 6 8 16 10 13
Savings 12 24 20 15 23 22
Farm X 2 10.0 Baseline 2010-2015 12 15 15 15 17 17
Reduction 2016-2021 10 7 7 10 7 7
Savings 2 8 8 5 10 10
Farm X 3 12.0 Baseline 2010-2015 10 8 10 9 11 8
Reduction 2016-2021 5 6 7 9 10 8
Savings 5 2 3 0 1 0
Farm X 4 20.0 Baseline 2010-2015 32 32 32 31 33 37
Reduction 2016-2021 13 14 11 13 9 11
Savings 19 18 21 18 24 26
Reminder: A Water Quality Trading agreement plan should be submitted to WDNR before installation of practices. Alternatively, the management practice registration form may also be used.

Page | 7
Converting to Credit Apply trade ratios to the calculated total P reduction to convert pounds into phosphorus credits. As
described in the Water Quality Trading Manual
(http://dnr.wi.gov/topic/SurfaceWater/WaterQualityTrading.html), trade ratios are designed to account
for the uncertainties associated with trading (see Table ).
Table 7. Types of uncertainty associated with trading and credit generation.
1- Equivalency is not applicable for phosphorus or TSS trades. It is included in Table 2 for
completeness, but is not relevant to the reductions quantified using the P Trade Report.
Each component of the trade ratio can be determined if you:
A. Know the practices that are generating the phosphorus reductions (i.e. the ones you added in
the “reduction” report), and
B. Know the location of the farm, or credit generator, in relation to the credit user.
Know the practices
There are two components of the trade ratio that directly relate to the phosphorus-reducing practices
themselves: uncertainty and habitat adjustment. The uncertainty factor is a practice-specific value that
can be looked-up in the How-To Manual, or at
http://dnr.wi.gov/topic/surfacewater/documents/wqtradingtoolstable_2014.pdf. Contact your regional
water quality trading coordinator to determine the appropriate uncertainty factor for practices not
currently listed in this table.
•Accounts for the distance between the credit generator and the credit user, and the impact that this distance can have on fate and transport of the pollutant.
Delivery
•Adjusts for local water quality impacts if the credit user is upstream of the credit generator. Downstream
•Accounts for situations where trading partners discharge different forms of the traded pollutant. Example: Total Nitrogen vs. Nitrate-Nitrogen
Equivalency1
•Accounts for modeling inaccuracies used to quantify load reductions, ease of verification of the practice, and the reliability of the practice to reduce loads.
Uncertainty
•Used to capture ancillary benefits from select practices that benefit habitat in addition to capturing the pollutant of concern. Only applies to wetland creation, resoration, and stream improvements.
Habitat Adjustment
Page | 8
The habitat adjustment factor only applies to a handful of practices including wetland creation, wetland
restoration, and stream habitat and improvement and management. If you select one of these practices,
contact your regional water quality trading coordinator to determine the appropriate adjustment factor
for this project.
Know the location
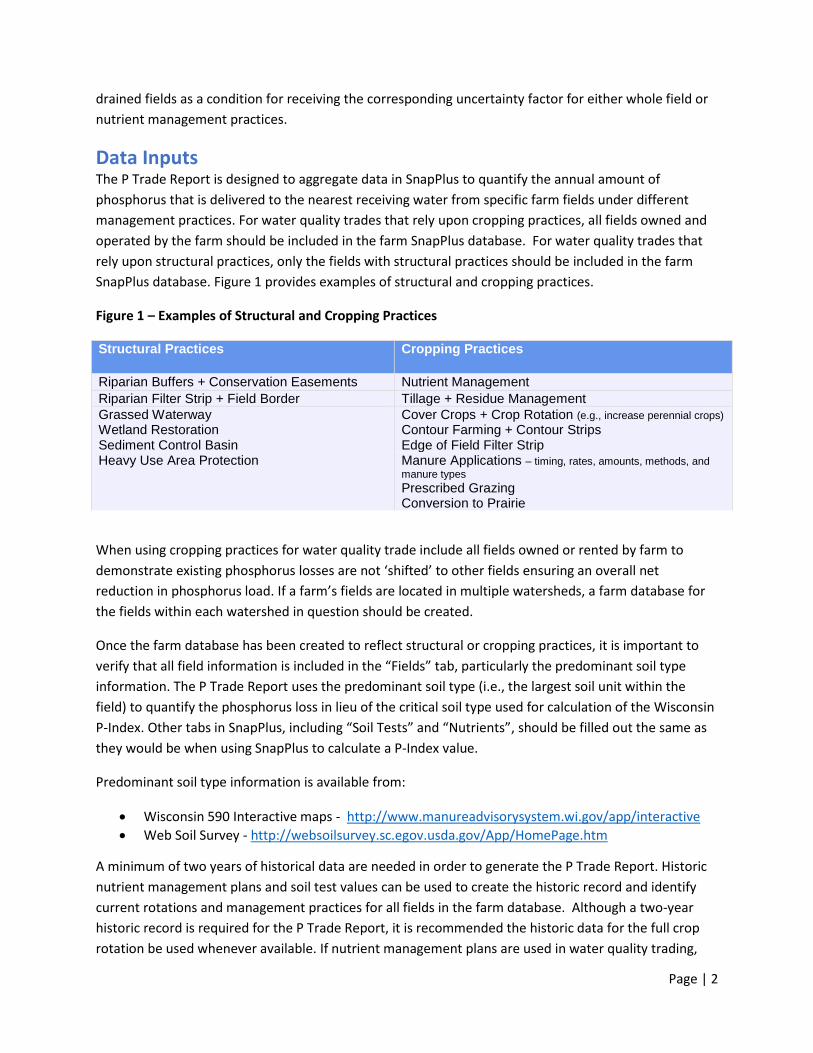
A map may be helpful in evaluating components of the trade ratio. Wisconsin’s surface water data
viewer, among other GIS-based mapping tools- http://dnr.wi.gov/topic/surfacewater/swdv/ (see Figure
1), can be used to generate such maps. These maps do not need to be submitted to DNR in a water
quality trading plan so long as management practice registration forms are completed for the practices
in question. All water quality trading forms are available at
http://dnr.wi.gov/topic/SurfaceWater/WaterQualityTrading.html.
Figure 1. Illustration of simple map that can be created using the surface water data viewer to display the location of credit user and credit generator in a watershed.
Once there is a clear understanding of the location of the credit user and generator, answer the
following questions.
Is the credit generator and credit user in the same HUC 12?
Is the credit user downstream of the credit generator?
If yes, deliver factor=0;
If no, see How-To Manual to quantify deliver factor
If yes, downstream factor=0;
If no, see How-To Manual to quantify downstream factor

Page | 9
Example Calculation using one practice:
Assume that the credit generator highlighted in yellow in Figure 1 is a 240-acre farm and plans to
generate phosphorus credits for 2014 by installing edge of field filter strips on five fields. Edge of field
filter strips has an uncertainty factor of 2:1. The total phosphorus reduction calculated using Snap-Plus P
Trade report for the five fields is 114 lbs. in 2014. Therefore, the final phosphorus credit for 2014 is:
Final Credit= 114 lbs. / 2 = 57 lbs. of TP credit in 2014
Example Calculation using multiple practices:
Some trades may utilize a variety of phosphorus-reducing practices to generate phosphorus credits. In
these instances, a variety of uncertainty factors may apply. Applying a trade ratio to each field is
recommended to calculate field specific credits. In the case multiple practices (e.g., reduced tillage,
filter strips, nutrient management, grassed waterways) are installed on the same field, it is
recommended that a weighted trade ratio be used to calculate a composite trade ratio for each
individual field.
𝐹𝑖𝑒𝑙𝑑 𝑊𝑒𝑖𝑔ℎ𝑡𝑒𝑑 𝑇𝑟𝑎𝑑𝑒 𝑅𝑎𝑡𝑖𝑜 =∑ (𝑃𝑟𝑎𝑐𝑡𝑖𝑐𝑒 𝑠𝑝𝑒𝑐𝑖𝑓𝑖𝑐 𝑡𝑟𝑎𝑑𝑒 𝑟𝑎𝑡𝑖𝑜 ∗ #𝑜𝑓 𝑎𝑐𝑟𝑒𝑠/𝑝𝑟𝑎𝑐𝑡𝑖𝑐𝑒)
∑ (𝑎𝑐𝑟𝑒𝑠 𝑤𝑖𝑡ℎ 𝑡𝑟𝑎𝑑𝑖𝑛𝑔 𝑝𝑟𝑎𝑐𝑡𝑖𝑐𝑒𝑠 )
For example, let’s assume that the same 240-acre farm illustrated in Figure 1 generates credits by:
• Installing of edge of field filter strip serving a 20-acre field and the filter strip is 0.25 acres in size;
• Planting cover crops on a 15-acre field;
• Implementing conservation tillage (no till) practice within the same 20 and 15-acre fields
Because the nonpoint source fields are upstream and within the same watershed as the point source, and trading for phosphorus, the trade ratio is equal to the uncertainty factor for the specific practices. According to Appendix A of the Water Quality Trading How-To Manual, http://dnr.wi.gov/topic/SurfaceWater/WaterQualityTrading.html, the uncertainty factor for filter strips, cover crops and conservation tillage is 2:1, provided the fields are under an approved Nutrient Management Plan. Applying a field specific trade ratio for each field results in the following:
20-acre field with conservation tillage and filter strip (0.25 acres) = 2.1:1 Trade Ratio 15-acre field with conservation tillage and cover crops = 2:1 Trade Ratio
Final credits are calculated by applying the field weighted trade ratio to the field specific total phosphorus reduction created from the Snap-Plus P Trade Report. Note: Contact your local AM/WQT regional coordinator if you would like to pursue an alternative method for deriving a trade ratio in a multiple practice scenario.
Reminder: As stated in the How-To Manual, the minimum trade ratio for point source to nonpoint source trades in 1.2:1.
Reminder: Review flexibility in TMDL Watersheds (below) when developing proposals for trading within approved TMDL watersheds

Page | 10
Using the P Trade Report within Approved TMDL Watersheds Using the P Trade Report within Approved TMDL watersheds requires an additional step (from the process described above) to determine final water quality trading credits. This step requires identifying the credit threshold for a TMDL watershed, applying the threshold to Snap-Plus P Trade report results and then using applicable trade ratios. According to DNR’s “Water Quality Trading How-To Manual”, a credit threshold refers to the amount of pollutant reduction that needs to be achieved before credits are generated. In watersheds with an approved TMDL, the credit threshold is set equal to the TMDL load allocation. If a credit user works with a nonpoint source credit generator to comply with a TMDL load allocation, “interim” credit is generated, meaning the point source will receive credit for these reductions for up to five years. “Long Term” credit is given for reductions that go above and beyond the load allocation in approved TMDL areas. Approved TMDL load allocations are determined by calculating how much reduction below baseline load conditions is needed so an impaired waterbody can meet water quality standards. When using the P Trade Report within approved TMDL watersheds, implement the following: STEP 1 - Run P Trade Baseline and Reduction reports to determine farm total and field specific P reductions as shown in figures 2 and 3 below Years P reduction practices installed Figure 2 – Total P reductions for all farm fields Farm
Acres PTP
2014 PTP 2015
PTP 2016
PTP 2017
PTP 2018
PTP 2019
PTP 2020
Farm A Baseline 251 788 671 757 741 726 859 867
Reduction 251 780 669 691 649 679 729 741
Savings 251 8 2 66 92 47 130 126
PTP = Potentially Tradeable Phosphorus
Figure 3 – Field specific P savings Farm Field Acres PTP
2016 PTP 2017
PTP 2018
PTP 2019
PTP 2020
Farm A 1 21.0 Baseline 18 14 35 40 48
Farm A 1 21.0 Reduction 18 14 24 34 39
Farm A 1 21.0 Savings 0 0 11 6 8
Farm A 2 20.0 Baseline 7 33 38 57 47
Farm A 2 20.0 Reduction 7 31 32 34 31
Farm A 2 20.0 Savings 0 2 6 21 16
Farm A TILL 1 13.0 Baseline 16 15 28 37 42
Farm A TILL 1 13.0 Reduction 16 15 12 18 20
Farm A TILL 1 13.0 Savings 0 0 14 19 22
Farm A TILL 2 21.0 Baseline 66 94 21 22 29
Farm A TILL 2 21.0 Reduction 39 46 11 10 15
Farm A TILL 2 21.0 Savings 10 12 10 12 14
PTP = Potentially Tradeable Phosphorus
Page | 11
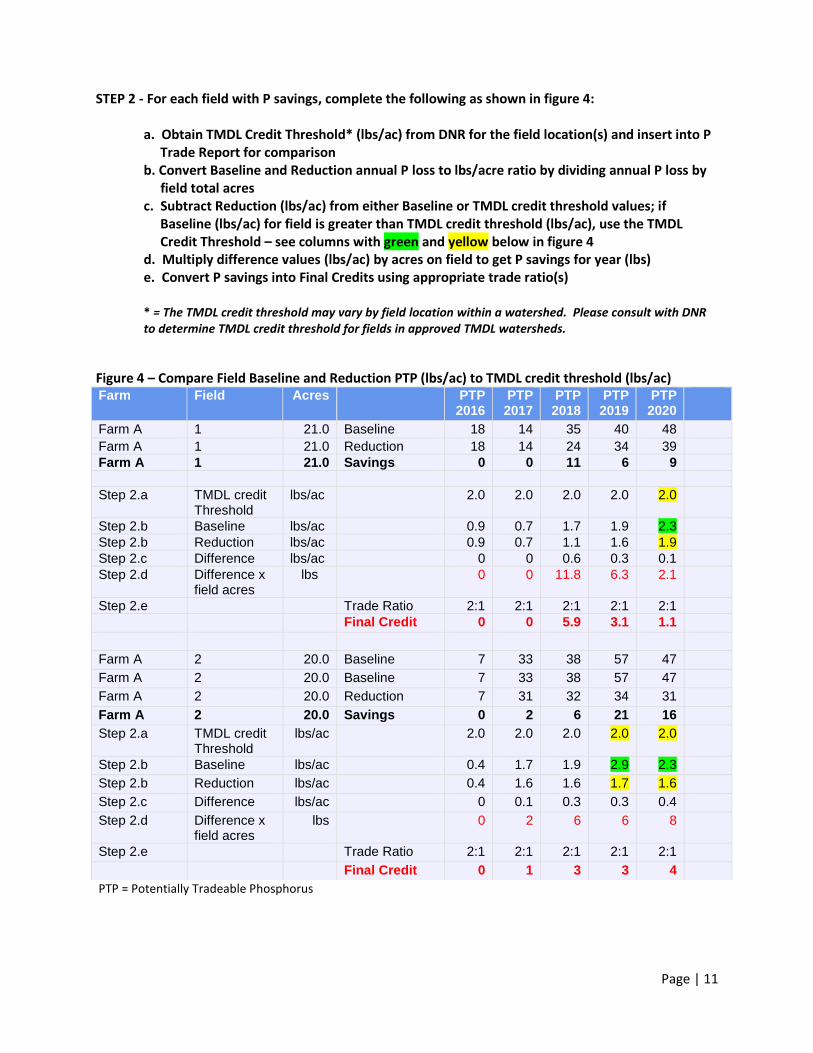
STEP 2 - For each field with P savings, complete the following as shown in figure 4:
a. Obtain TMDL Credit Threshold* (lbs/ac) from DNR for the field location(s) and insert into P Trade Report for comparison b. Convert Baseline and Reduction annual P loss to lbs/acre ratio by dividing annual P loss by field total acres c. Subtract Reduction (lbs/ac) from either Baseline or TMDL credit threshold values; if Baseline (lbs/ac) for field is greater than TMDL credit threshold (lbs/ac), use the TMDL Credit Threshold – see columns with green and yellow below in figure 4 d. Multiply difference values (lbs/ac) by acres on field to get P savings for year (lbs) e. Convert P savings into Final Credits using appropriate trade ratio(s) * = The TMDL credit threshold may vary by field location within a watershed. Please consult with DNR to determine TMDL credit threshold for fields in approved TMDL watersheds.
Figure 4 – Compare Field Baseline and Reduction PTP (lbs/ac) to TMDL credit threshold (lbs/ac) Farm Field Acres PTP
2016 PTP 2017
PTP 2018
PTP 2019
PTP 2020
Farm A 1 21.0 Baseline 18 14 35 40 48
Farm A 1 21.0 Reduction 18 14 24 34 39
Farm A 1 21.0 Savings 0 0 11 6 9
Step 2.a TMDL credit Threshold
lbs/ac 2.0 2.0 2.0 2.0 2.0
Step 2.b Baseline lbs/ac 0.9 0.7 1.7 1.9 2.3
Step 2.b Reduction lbs/ac 0.9 0.7 1.1 1.6 1.9
Step 2.c Difference lbs/ac 0 0 0.6 0.3 0.1
Step 2.d Difference x field acres
lbs 0 0 11.8 6.3 2.1
Step 2.e Trade Ratio 2:1 2:1 2:1 2:1 2:1
Final Credit 0 0 5.9 3.1 1.1
Farm A 2 20.0 Baseline 7 33 38 57 47
Farm A 2 20.0 Baseline 7 33 38 57 47
Farm A 2 20.0 Reduction 7 31 32 34 31
Farm A 2 20.0 Savings 0 2 6 21 16
Step 2.a TMDL credit Threshold
lbs/ac 2.0 2.0 2.0 2.0 2.0
Step 2.b Baseline lbs/ac 0.4 1.7 1.9 2.9 2.3
Step 2.b Reduction lbs/ac 0.4 1.6 1.6 1.7 1.6
Step 2.c Difference lbs/ac 0 0.1 0.3 0.3 0.4
Step 2.d Difference x field acres
lbs 0 2 6 6 8
Step 2.e Trade Ratio 2:1 2:1 2:1 2:1 2:1
Final Credit 0 1 3 3 4
PTP = Potentially Tradeable Phosphorus
Page | 12
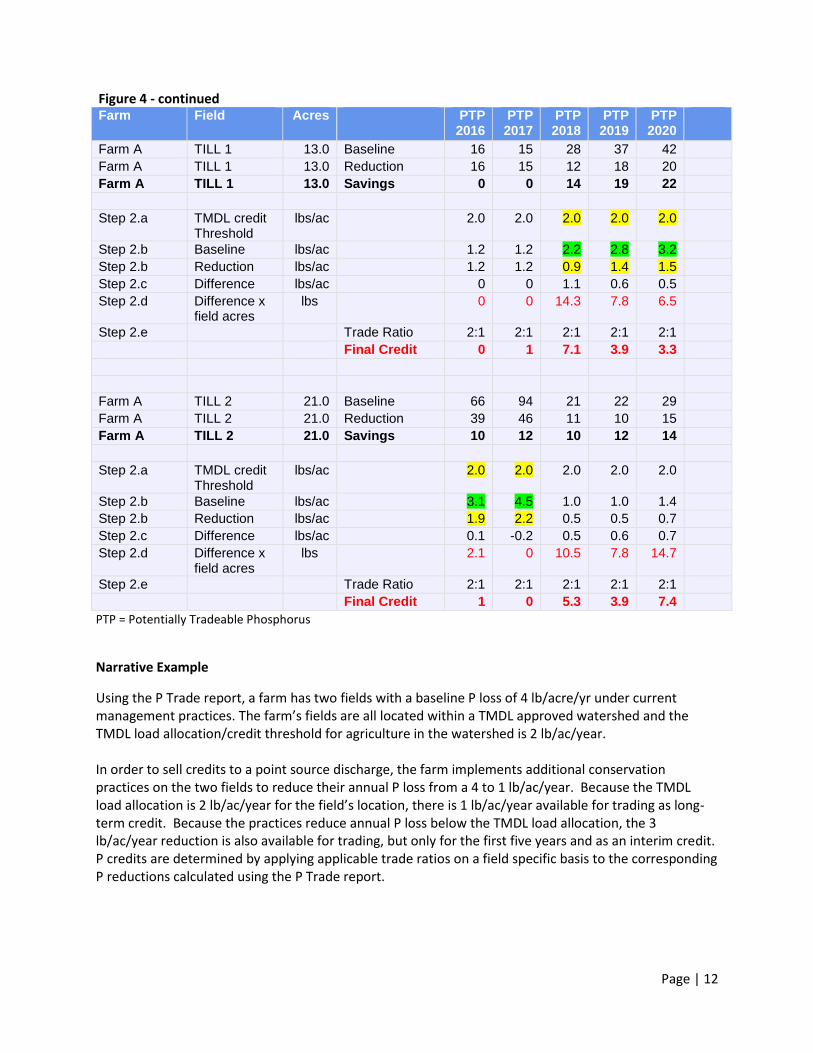
Figure 4 - continued Farm Field Acres PTP
2016 PTP 2017
PTP 2018
PTP 2019
PTP 2020
Farm A TILL 1 13.0 Baseline 16 15 28 37 42
Farm A TILL 1 13.0 Reduction 16 15 12 18 20
Farm A TILL 1 13.0 Savings 0 0 14 19 22
Step 2.a TMDL credit Threshold
lbs/ac 2.0 2.0 2.0 2.0 2.0
Step 2.b Baseline lbs/ac 1.2 1.2 2.2 2.8 3.2
Step 2.b Reduction lbs/ac 1.2 1.2 0.9 1.4 1.5
Step 2.c Difference lbs/ac 0 0 1.1 0.6 0.5
Step 2.d Difference x field acres
lbs 0 0 14.3 7.8 6.5
Step 2.e Trade Ratio 2:1 2:1 2:1 2:1 2:1
Final Credit 0 1 7.1 3.9 3.3
Farm A TILL 2 21.0 Baseline 66 94 21 22 29
Farm A TILL 2 21.0 Reduction 39 46 11 10 15
Farm A TILL 2 21.0 Savings 10 12 10 12 14
Step 2.a TMDL credit Threshold
lbs/ac 2.0 2.0 2.0 2.0 2.0
Step 2.b Baseline lbs/ac 3.1 4.5 1.0 1.0 1.4
Step 2.b Reduction lbs/ac 1.9 2.2 0.5 0.5 0.7
Step 2.c Difference lbs/ac 0.1 -0.2 0.5 0.6 0.7
Step 2.d Difference x field acres
lbs 2.1 0 10.5 7.8 14.7
Step 2.e Trade Ratio 2:1 2:1 2:1 2:1 2:1
Final Credit 1 0 5.3 3.9 7.4
PTP = Potentially Tradeable Phosphorus
Narrative Example
Using the P Trade report, a farm has two fields with a baseline P loss of 4 lb/acre/yr under current management practices. The farm’s fields are all located within a TMDL approved watershed and the TMDL load allocation/credit threshold for agriculture in the watershed is 2 lb/ac/year. In order to sell credits to a point source discharge, the farm implements additional conservation practices on the two fields to reduce their annual P loss from a 4 to 1 lb/ac/year. Because the TMDL load allocation is 2 lb/ac/year for the field’s location, there is 1 lb/ac/year available for trading as long-term credit. Because the practices reduce annual P loss below the TMDL load allocation, the 3 lb/ac/year reduction is also available for trading, but only for the first five years and as an interim credit. P credits are determined by applying applicable trade ratios on a field specific basis to the corresponding P reductions calculated using the P Trade report.

Page | 13
Reminder: Review Flexibility in TMDL Watersheds (below) when developing proposals for trading within approved TMDL watersheds