Embed Size (px)
Citation preview
PURINE-RELATED METABOLITES AND THEIR CONVERTING ENZYMES ARE
ALTERED IN FRONTAL, PARIETAL, AND TEMPORAL CORTEX AT EARLY
STAGES OF ALZHEIMER'S DISEASE PATHOLOGY
Patricia Alonso-Andrés1, José Luis Albasanz1, Isidro Ferrer2 MD, PhD , and Mairena
Martín1
1Facultad de Ciencias y Tecnologías Químicas/Facultad de Medicina de Ciudad Real.
Departamento de Química Inorgánica, Orgánica y Bioquímica. Centro Regional de
Investigaciones Biomédicas. Universidad de Castilla-La Mancha. 2Department of
Pathology and Experimental Therapeutics, University of Barcelona; Service of
Pathologic Anatomy, Bellvitge University Hospital; Institute of Neurosciences,
University of Barcelona; CIBERNED; Hospitalet de Llobregat; Spain
This article has been accepted for publication and undergone full peer review but has not beenthrough the copyediting, typesetting, pagination and proofreading process which may lead todifferences between this version and the Version of Record. Please cite this article as an‘Accepted Article’, doi: 10.1111/bpa.12592
This article is protected by copyright. All rights reserved.
2
Abstract
Adenosine, hypoxanthine, xanthine, guanosine, and inosine levels were assessed by
HPLC, and the activity of related enzymes 5’-nucleotidase (5’-NT), adenosine
deaminase (ADA), and purine nucleoside phosphorylase (PNP) measured in frontal
(FC), parietal (PC) and temporal (TC) cortices at different stages of disease
progression in Alzheimer’s disease (AD) and in age-matched controls.
Significantly decreased levels of adenosine, guanosine, hypoxanthine, and xanthine,
and apparently less inosine, are found in FC from the early stages of AD; PC and TC
show an opposing pattern, as adenosine, guanosine, and inosine are significantly
increased at least at determinate stages of AD whereas hypoxanthine and xanthine
levels remain unaltered. 5’-NT is reduced in membranes and cytosol in FC mainly at
early stages but not in PC, and only at advanced stages in cytosol in TC. ADA activity
is decreased in AD when considered as a whole but increased at early stages in TC.
Finally, PNP activity is increased only in TC at early stages.
Purine metabolism alterations occur at early stages of AD independently of
neurofibrillary tangles and β-amyloid plaques. Alterations are stage- and region-
dependent, the latter showing opposite patterns in FC compared with PC and TC.
Adenosine is the most affected of the assessed purines.
Key words: Adenosine, Alzheimer’s disease, cerebral cortex, purine metabolism.
This article is protected by copyright. All rights reserved.
3
Introduction
Alzheimer disease (AD), the most common neurodegenerative disease in adulthood, is
characterized neuropathologically by β-amyloid deposition forming plaques and
amyloid angiopathy, and hyperphosphorylated tau in neurons with neurofibrillary
tangles (NFTs) and pre-tangles, dystrophic neurites of amyloid plaques, and neuropil
threads (24, 31). NFTs increase in number and distribution from selected nuclei of the
brain stem, and entorhinal and transentorrhinal cortex (stage I-II) to the hippocampus
and limbic cortex (stage III-IV), and eventually the neocortex (stages V-VI) (14). Clinical
symptoms in AD manifest several years after the appearance of classical
neuropathological findings and that AD pathology is not restricted to β-amyloid and tau
(13, 26). On the contrary, alteration of multiple metabolic pathways and cell types
converge and contribute to the development of AD (26).
Purines and pyrimidines are components of a large number of key molecules. Primary
purines adenine and guanosine, and pyrimidines cytosine, thymidine, and uracyl are
the core of DNA, RNA, nucleosides, and nucleotides involved in energy transfer (ATP,
GTP) and co-enzymes (NADH, FADH2) (6, 32).
Adenosine produced by neurons and astrocytes modulates excitatory and inhibitory
neurotransmission, and influences relevant brain functions including sleep and arousal,
cognition and memory, and neuronal damage and degeneration, by acting as an
extracellular molecular via specific adenosine receptors (8, 29, 53, 55). There are four
G-protein coupled receptors for adenosine A1, A2A, A2B and A3 (29, 55). Importantly, A2A
receptor is necessary for neurodegeneration and memory impairment in animal models
of AD and tauopathy (16, 17, 21, 45, 61). Moreover, A2A receptor is necessary and
sufficient to trigger memory impairment in adult mice (47, 51).
Adenosine is generated intracellularly by the hydrolysis of AMP and S-adenosyl
homocysteine (SAH) by soluble 5’-nucleotidase (5’-NT) and S-adenosyl homocysteine
hydrolase, respectively. It can then be phosphorylated to AMP by adenosine kinase
This article is protected by copyright. All rights reserved.
4
(ADK) or transformed into inosine by adenosine deaminase (ADA). Extracellularly, ATP
can be dephosphorylated to AMP by ectonucleoside triphosphate diphospho-hydrolase
CD39 and AMP dephosphorylated to adenosine by 5’-nucleotidase CD73. In addition,
adenosine can be transported to intracellular and extracellular compartments by
specific transporters (28). In the intracellular space, the products of adenosine
degradation, such as AMP and inosine, are transformed into inosine or hypoxanthine
by AMP deaminase and cytosolic 5’-nucleotidase II (cN-II) or by purine nucleoside
phosphorylase (PNP), respectively. Inosine is also able to exit by nucleoside
transporter. Hypoxanthine can be oxidized by xanthine oxidase and transformed into
xanthine. Inosine, hypoxanthine, and xanthine can also be transported to the
extracellular compartment. Guanosine is derived from GMP (guanosine
monophosphate) by nucleotidase and can be phosphorylated and deaminated into
xanthine (11, 57). Ecto-5’-nucleotidase has a role in the activation of A1 and A2
receptors (19, 23, 25, 54). Figure 1 shows some of these metabolic connections.
Although not addressed in the present paper, other enzymes are important in
adenosine signaling (10, 50, 52). A1 and A2A receptors are modified in brain in AD (63).
A1 and A2A receptors are increased in frontal cortex with respect to age-matched
control (1). A1 receptors are increased in degenerating neurons and A2A receptors in
glial cells of the hippocampus in AD (5). These data contrast with previous studies
reporting decreased A1 receptor in dentate gyrus and CA3 region of the hippocampus
in AD patients (34).
Studies on enzymes linked to purine metabolism in AD are scant. AMP deaminase
activity is increased in AD with respect to control cases (58). 5’-NT activity is reduced in
brain homogenates of AD (37).
Our previous studies have shown altered expression of several genes involved in
purine metabolism and abnormal levels of certain purine metabolites in the entorhinal
cortex, frontal cortex area 8, and precunneus in AD which are region- and stage-
dependent (6). The present study is focused on the assessment of adenosine,
This article is protected by copyright. All rights reserved.
5
hypoxanthine, xanthine, guanosine, and inosine levels as well as on differences in the
activity of related enzymes 5’-NT, ADA, and PNP in three cortical regions -frontal
cortex, parietal cortex and temporal cortex- in AD with disease progression and age-
matched controls.
Material and Methods
Human samples
Human brain samples were obtained from the Institute of Neuropathology HUB-ICO-
IDIBELL Biobank following the Spanish legal regulations (Real Decreto 1716/2011) and
the approval of the local ethics committee of the Bellvitge University Hospital. Brains of
patients with AD and age-matched controls were obtained at from 3 to 24 h after death
and were immediately prepared for morphological and biochemical studies. Special
attention was paid to minimize limitations related to molecular studies of the post-
mortem brain including combined pathologies, metabolic syndrome, medication that
could interfere with biochemical studies, long agonic stress, reduced post-mortem
delay and controlled conditions of temperature and tissue processing as detailed
elsewhere (27). A slight deterioration of the quality of brain samples is expected to
dramatically alter signals related to stress in the brain, such as ATP (56) or adenosine
(30). However, brain samples pH value was not an interfering factor in the present
study as it has not been related to postmortem delay or time in storage (48). Even
considering an optimal scenario, restricted sampling conditions imply not acceptance of
certain cases thus reducing the number of suitable cases for study.
During autopsy, half of the brain was fixed in formalin, while the other half was cut into
coronal sections 1 cm thick from which selected areas were dissected and immediately
frozen on dry ice and stored at -80°C until use. The neuropathological study was
carried out on formalin-fixed, de-waxed 4-mm thick paraffin sections of the frontal (area
This article is protected by copyright. All rights reserved.
6
8), primary motor, primary sensory, parietal and temporal superior, temporal inferior,
anterior cingulate, anterior insular, and primary and associative visual cortices;
entorhinal cortex and hippocampus; caudate, putamen and pallidum; medial and
posterior thalamus; subthalamus; Meynert nucleus; amygdala; midbrain (two levels);
pons and medulla oblongata; and cerebellar cortex and dentate nucleus. The sections
were stained with hematoxylin and eosin, Luxol fast blue-Klüver Barrera, and for
immunohistochemistry to glial fibrillary acidic protein, CD68, and Iba1 for microglia, β-
amyloid, phosphorylated tau (clone AT8), αβ-crystallin, α-synuclein, TDP-43, and
ubiquitin. AD-related pathology was categorized following the classification of Braak
and Braak for neurofibrillary tangle pathology adapted for paraffin sections (simplified
as stages I-II, III-IV, and V-V) (12), and the phases of Thal (59) for β-amyloid burden.
Special care was taken to use AD cases with no or minimal co-morbidities to avoid bias
related to combined pathologies. Cases with added proteinopathies and with vascular
pathology other than small blood vessel disease were excluded. Cases with infectious
and inflammatory diseases of the nervous system, and systemic metabolic diseases
including those linked to chronic ethanol consumption, were not considered suitable in
the pathological and control groups. Main characteristics of cases are summarized in
Table 1.
Fresh frozen samples of the frontal area 8, parietal area 7, and temporal area 21 were
used in this study for the determination of adenosine, guanosine, hypoxanthine,
xanthine, and inosine levels, and the enzymatic activity of 5’-nucleotidase, adenosine
deaminase, and purine nucleotidase phosphorylase.
Membrane and cytosol fractions purification
Samples were homogenized in 30 volumes of isolation buffer (50 mM Tris HCl, pH 7.4
containing 10 mM MgCl2 and protease inhibitors) in DOUNCE homogenizer (10xA, 10x
B). After homogenization, samples were centrifuged for 5 min at 1,000xg in a Beckman
JA 20 centrifuge (Coulter, Madrid, Spain). Supernatants were recovered and
This article is protected by copyright. All rights reserved.
7
centrifuged for 20 min at 27,000xg, and the resulting pellet (membrane fraction) was
finally re-suspended in isolation buffer and homogenized again (DOUNCE
homogenizer, 10xA, 10xB). Cytosol was concentrated in Vivaspin 20 columns (MW cut
off 3 kDa) (GE Healthcare Life Sciences, UK). Columns were cleaned with Milli-Q water
and centrifuged for 20 min at 5,000xg. After this, 15 ml of supernatant was added to the
columns which were then centrifuged for 110 minutes at 5,000xg at 20°C. The eluted
fraction was lyophilized overnight in Vitris Sentry Benchtop 3L Freeze Drying System.
This fraction was employed for HPLC analysis.
Protein concentration was determined with the Lowry method using bovine serum
albumin as standard.
HPLC procedure
HPLC reagents
Stocks of adenosine, guanosine, hypoxanthine, xanthine, and inosine standards were
prepared at 1 mM with water (HPLC-grade) in a final volume of 100 ml. NaOH (100 µl
of 1 M) was added to hypoxanthine and xanthine stocks whereas inosine and
guanosine were heated for optimal homogenization. All purines were from Sigma
(Madrid, Spain), except adenosine which was from Fluka (Madrid, Spain). Purine
standards were filtered using a 0.25 µm filter.
Preparation of standard curves and samples
The standard curves were obtained using five concentrations of each purine: 500 µM,
100 µM, 10 µM, 1 µM, and 100 nM. The initial stock was 1 mM and dilutions were
prepared with water (HPLC-grade). The samples were reconstituted with water (HPLC-
grade) and adjusted to pH between 2 and 3 with 1 M HCl. The final volume of the
samples was 400 µl.
HPLC protocol
Chromatographic analysis was performed with Ultimate 3000 U-HPLC (ThermoFisher,
Madrid, Spain) and data peaks were processed with Chromaleon 7 (ThermoFisher,
This article is protected by copyright. All rights reserved.
8
Madrid, Spain). HPLC diode array was used working at a 254 nm wavelength. We
employed a C18 column of 4.6 mm x 250 mm, 5 µm particle size. Volumes of 10 µl
were injected for the standard and 40 µl for the samples. Two solvents were used for
gradient elution: solvent A, 20 mM phosphate buffer solution (pH 5.7), and solvent B
100% methanol. The gradient was initiated at 95% solvent A and 5% solvent B for 11
min, followed by 80% solvent A and 20% solvent B for 9 min, and finally 95% solvent A
for 2 min. The total run time was 22 min with a constant flow rate of 0.8 ml/min at 25°C.
Retention times for hypoxanthine, xanthine, inosine, guanosine, and adenosine were
3.5, 3.9, 8.4, 9.4, and 15.5 min, respectively. Each purine level was obtained by
interpolation from the corresponding purine standard curve. Data were then normalized
using the protein concentration of each sample.
Determination of protein concentration in HPLC samples
Protein concentration was measured with Micro BCA Protein Assay (Thermo Scientific,
Rockford, USA) using bovine serum albumin as a standard.
Measurement of 5’-nucleotidase activity
5’-NT activity was measured in the membranes and cytosolic fractions. In the cytosol,
5’-NT activity was determined with one-time measurement of Vmax at a saturated
concentration of 500 μM AMP. Membranes and cytosol samples (20 μg protein) were
pre-incubated in 180 μl reaction medium containing 50 mM Tris, 5 mM MgCl2, pH 9, at
37°C for 10 min. The reaction was initiated by the addition of 20 μl AMP (final
concentrations, 10 μM-1 mM in the case of membranes and 500 μM in the case of
cytosol) and stopped after 20 min by adding 200 μl of 10% trichloroacetic acid (TCA).
The samples were chilled on ice for 10 min and centrifuged at 12,000xg for 4 min at
4°C. The supernatants were used to measure inorganic phosphate released (20) using
KH2PO4 as Pi standard. Non-enzymatic hydrolysis of AMP was corrected by adding
membranes after TCA in order to denaturalize the enzyme. Incubation times and
protein concentration were selected in order to ensure the linearity of the reactions. All
This article is protected by copyright. All rights reserved.
9
samples were run in duplicate. Enzyme activity was expressed as nmol Pi released/min
x mg of protein (46).
Measurement of adenosine deaminase activity
ADA activity was measured in the cytosol of AD and control samples with the
commercially available ADA activity assay kit (Abcam, London, UK) following the
indications of the supplier. This is an assay where inosine formed from the breakdown
of adenosine is detected via a multi-step reaction, resulting in the formation of an
intermediate that reacts with an ADA probe to generate a fluorescent product that can
be quantified at λex / λem of 535/587 nm. The kit measures total activity of Adenosine
Deaminase with limit of quantification of 10 μU recombinant Adenosine Deaminase.
ADA activity was calculated as:
ΔRFU535/587 nm= (RFU2-RFU2BG)-(RFU1-RFU1BG)
where ΔRFU535/587 nm was used to obtained X pmol of inosine generated by ADA during
a reaction time ΔT= T2-T1. RFU2BG and RFU1BG represented background values at
reaction times, and RFU2 and RFU1 were fluorescence values at the same reaction
times.
Adenosine deaminase concentration was calculated as:
𝐴𝐷𝐴 𝐴𝑐𝑡𝑖𝑣𝑖𝑡𝑦 =𝑋
∆𝑇×𝜇𝑔 𝑜𝑓 𝑝𝑟𝑜𝑡𝑒𝑖𝑛∗ 𝐷 = pmol/min/µg=µU/µh
where X was the quantity of inosine extrapolated from the standard curve (pmol), ΔT
was the reaction time, µg of protein was the quantity of protein put on each well, and D
the dilution factor of each sample.
Measurement of purine nucleotidase phosphorylase activity
PNP activity was measured in the cytosol using Purine Nucleoside Phosphorylase
activity assay kit (Abcam, London, UK) following the indications of the supplier. This is
an assay where the hypoxanthine formed from the breakdown of inosine is detected via
This article is protected by copyright. All rights reserved.
10
a multi-step reaction, resulting in the generation of an intermediate that reacts with the
PNP Probe. The fluorescent product is measured at λex / λem of 535/587 nm. Limit of
quantification is 0.005 µU recombinant PNP. PNP activity was calculated as:
ΔRFU535/587 nm= (RFU2-RFU2BG)-(RFU1-RFU1BG)
where ΔRFU535/587 nm was used to obtained Y pmol of hypoxanthine generated by PNP
during a reaction time ΔT= T2-T1. RFU2BG and RFU1BG represented background values
at reaction times, and RFU2 and RFU1 were the fluorescence values at the same
reaction times.
PNP concentration was calculated as:
𝑃𝑁𝑃 𝐴𝑐𝑡𝑖𝑣𝑖𝑡𝑦 =𝑌
∆𝑇×𝜇𝑔 𝑜𝑓 𝑝𝑟𝑜𝑡𝑒𝑖𝑛∗ 𝐷 = pmol/min/µg=µU/µh
where Y was the quantity of hypoxanthine extrapolated from standard curve (pmol), ΔT
was the reaction time, µg of protein was the quantity of protein put on each well, and D
the dilution factor of each sample.
Statistical analysis
Data were analyzed with GraphPad Prism 6.0 program (GraphPad Software, San
Diego, CA, USA). Differences between mean values of two groups (control and AD)
were studied with Student’s t-test. The difference between mean values of three or
more groups (control and AD stages) was evaluated with ANOVA-Fisher’s LSD post-
test; p<0.05 was considered significantly different. Regarding nucleotidase activities,
the KM and Vmax values were calculated using a nonlinear Michaelis-Menten curve and
analyzed using unpaired two-tailed Student’s t-test or ANOVA-Fisher’s LSD post-test
test; p<0.05 was considered significantly different. Pearson r correlation coefficients
and corresponding P values were obtained by Correlation analysis.
Results
This article is protected by copyright. All rights reserved.
11
Nucleotide measurement in frontal, parietal, and temporal cortex
Adenosine, guanosine, hypoxanthine, xanthine, and inosine were determined in the
frontal, parietal, and temporal cortices in control and total AD cases. To study
Alzheimer’s progression, AD samples were further divided in three groups, initial (I-II),
intermediate (III-IV), and advanced (V-VI) stages of NFT degeneration.
Adenosine was significantly decreased in the frontal cortex in AD (9.22 ± 1.91 pmol/µg
prot, p<0.001) compared with control cases (24.97 ± 5.21 pmol/µg prot). Lower levels
were observed at stages I-II (3.85 ± 3.39 pmol/µg prot, p<0.01) when compared to
intermediate (9.76 ± 1.03 pmol/µg prot, p<0.05) and advanced stages (11.91 ± 4.21
pmol/µg prot, p<0.05). In contrast, adenosine levels were increased in the parietal
(85.15 ± 7.77 pmol/µg prot, p<0.05) and temporal (73.88 ± 7.60 pmol/µg prot, p<0.05)
cortices in AD compared with corresponding controls (55.45 ± 7.97 and 44.56 ± 5.65
pmol/µg prot, respectively). Comparing the adenosine level in control cases in the three
different brain areas we can observe a lower level in frontal cortex (24.97 ± 5.21
pmol/µg prot) than in parietal (55.45 ± 7.97 pmol/µg prot) and temporal (44.56 ± 5.65
pmol/µg prot) cortices (Figure 2).
Guanosine levels were not significantly altered in the frontal cortex in AD cases when
compared with controls. Only reduction in the levels of guanosine was found in frontal
cortex at early stages (AD I-II: 69.03 ± 18.51 vs C: 166.29 ± 22.40 pmol/µg prot,
p<0.05). In contrast, guanosine levels in AD were increased in the parietal cortex (AD:
144.20 ± 14.27 vs C: 90.22 ± 13.30 pmol/µg prot, p<0.05) and temporal cortex (AD:
146.20 ± 11.40 vs C: 73.80 ± 9.00 pmol/µg prot, p<0.01). In the parietal cortex, higher
values were observed at advanced stages (AD V-VI: 170.50 ± 40.34 pmol/µg prot,
p<0.05), whereas in the temporal cortex they were significantly increased at early (AD
I-II: 158.30 ± 10.35 pmol/µg prot, p<0.01) and advanced (AD V-VI: 154.70 ± 30.15
pmol/µg prot, p<0.01) stages of the disease (Figure 2). Contrary to adenosine control
values, guanosine level in control frontal cortex (166.29 ± 22.40 pmol/µg prot) was
This article is protected by copyright. All rights reserved.
12
higher than in the parietal (90.22 ± 13.30 pmol/µg prot) and temporal (73.80 ± 9.00
pmol/µg prot) cortices.
Hypoxanthine levels were decreased only in the frontal cortex at early stages of AD-
related pathology (AD I-II: 1901 ± 683 vs C: 3534 ± 408 pmol/µg prot, p<0.05). No
modifications were identified in the parietal and temporal cortices (Figure 2).
Xanthine levels were decreased in frontal cortex at early stages of AD-related
pathology (AD I-II: 1290 ± 439 vs C: 2374 ± 219 pmol/µg prot, p<0.01) which resulted
in a decrease of xanthine levels in total AD (AD: 1888 ± 181 pmol/µg prot, p<0.05)
when compared with controls. No differences were observed in the parietal and
temporal cortices (Figure 2).
Inosine levels were not significantly altered in the frontal cortex in AD. Increased levels
were found in AD parietal cortex (AD: 1083 ± 99 vs C: 735 ± 93 pmol/µg prot, p<0.05)
and AD temporal cortex (AD: 1030 ± 86 vs C: 610 ± 82 pmol/µg prot, p<0.01) when
compared with controls. Values were higher at advanced stages in the parietal cortex
(AD V-VI: 1260 ± 280 pmol/µg prot, p<0.05), and at early (AD I-II: 1133 ± 84 pmol/µg
prot, p<0.01) and advanced (AD V-VI: 1075 ± 226 pmol/µg prot, p<0.05) stages in the
temporal cortex (Figure 2).
Enzymatic activities
5’-Nucleotidase (5’-NT), adenosine deaminase (ADA), and purine nucleoside
phosphorylase (PNP) activities were measured in the same frontal, temporal, and
parietal cortex of AD and control samples used for nucleotide assessment.
5’-NT activity in membrane
Prior to the 5’-NT activity assessment, the possible contribution of alkaline
phosphatase to the conversion of AMP into adenosine was evaluated. To this end, the
hydrolysis of 500 µM AMP was assayed in the absence or the presence of 100 µM
levamisole, a specific inhibitor of alkaline phosphatase, using both control and AD
This article is protected by copyright. All rights reserved.

13
samples from different membrane and cytosol preparations. No significant differences
were found after comparing results obtained in the absence or the presence of the
inhibitor which allow to suggest that alkaline phosphatase did not participate in AMP
hydrolysis under our conditions (Figure 3).
5’-NT activity was measured at different concentrations of AMP (10 μM to 1 mM) and
the results indicated that this activity increased with increasing AMP concentrations
until saturation. Data were fitted to Michaelis-Menten model with a non-linear
regression and the corresponding Vmax and KM values were obtained. Reduced Vmax
and KM values were found in frontal cortex in AD compared with control cases (Vmax
AD: 0.019 ± 0.002 vs C: 0.034 ± 0.004 nmol Pi/mg prot · min, p<0.01; KM AD: 56.8 ±
7.2 vs C: 152.7 ± 34.7 µM, p<0.01). Significant decreased Vmax and KM values occurred
through all disease stages. No significant differences in parietal or temporal cortices
were found in AD (Figure 4).
5’-NT activity in cytosol
In the frontal cortex, cytosolic 5’-NT activity was significantly decreased in the AD
group, mainly at early stages of NFT pathology with respect to control cases (AD:
0.009 ± 0.001 vs C: 0.014 ± 0.002 nmol Pi/mg prot · min, p<0.05). No other significant
modifications were observed in parietal cortex, but decreased 5’-NT activity occurred in
the temporal cortex at advanced stages of AD (AD V-VI: 0.007 ± 0.001 vs C: 0.013 ±
0.001 nmol Pi/mg prot · min, p<0.05) (Figure 4). 5’-NT activity measured in the present
work was not associated to postmortem delay neither in membrane nor cytosolic
fractions (Figure 5).
ADA activity
ADA activity was significantly decreased in the frontal cortex in AD cases (AD: 27.25 ±
3.00 vs C: 36.78 ± 3.65 pmol/ µg prot · min, p<0.05), but increased in the temporal
cortex in AD (AD: 38.21 ± 9.17 vs C: 17.69 ± 2.06 pmol/ µg prot · min, p<0.05), mainly
This article is protected by copyright. All rights reserved.
14
at early stages (AD I-II: 57.92 ± 20.98 pmol/ µg prot · min, p<0.05), with no significant
differences between AD stages. No modifications in ADA activity were noted in the
parietal cortex in AD cases (Figure 6A). ADA activity was not associated to postmortem
delay neither in membrane nor cytosolic fractions (Figure 6B).
PNP activity
PNP activity did not show significant differences between control and AD cases in
frontal or parietal cortices. PNP activity was significantly increased in the temporal
cortex at early stages of AD with respect to control cases (AD I-II: 24.39 ± 9.71 vs C:
9.26 ± 1.43 pmol/ µg prot · min, p<0.05) (Figure 7A). ADA activity was not associated
to postmortem delay neither in membrane nor cytosolic fractions (Figure 7B).
This article is protected by copyright. All rights reserved.
15
Discussion
Previous experiments have determined that nucleoside concentrations are unevenly
distributed in different human brain areas (15, 40, 41, 43). For instance, similarly to our
results, adenosine was found at lower levels in frontal than in parietal (42) or temporal
(41) cortex in control human brain samples. In turn, guanosine in frontal cortex has
higher levels than in parietal or temporal cortex. Although we have no detailed
information to fully explain regional differences in controls in the present study, the
different regional activity of enzymes related to purines metabolism could be involved
(41). On the other hand, a comparative study reported that levels of hypoxanthine and
adenosine are lower in human brain samples (ca. 6 times) as compared to those in rat
brain. Levels of xanthine and inosine are slightly higher in rat (ca. 2 times) than in
human brain, while the guanosine level is 2 times higher in human brain (44).
Levels of purines have been assessed in the CSF in AD (33, 35, 36). Levels of cGMP
but not of cAMP are decreased in AD (60). Altered levels of methionine, tryptophan,
and products of tyrosine pathway together with increased xanthine and hypoxanthine
co-relate with mild cognitive impairment in AD-related cohorts (36). Other studies show
no changes in hypoxanthine but increased levels of xanthine in the CSF in AD (22).
Although metabolomics in combination with other measurements can be useful to
identify biomarkers of disease progression (49), determinations in the CSF and
peripheral blood do not necessarily reflect molecular events in particular brain regions.
Previous studies in AD, showed deregulation with regional variations of adenine
phosphoribosyltransferase, deoxyguanosine kinase, RNA polymerase III subunit B,
ENTPD3, AK5, NME1, NME3, NME5, NME7 and ENTPD2 messenger RNAs (6). In
addition, liquid chromatography mass spectrometry-based metabolomics in the
entorhinal cortex identified altered levels of dGMP, glycine, xanthosine, inosine
This article is protected by copyright. All rights reserved.
16
diphosphate, guanine, and deoxyguanosine (6). Purine metabolism has been reported
to be deregulated in patients with major depression, and certain purines exhibit
antidepressant properties (2, 7, 38, 39). AD cases in the present series did not have
major depressive disease. However, the locus coeruleus and the raphe nuclei of the
brain stem, major sources of noradrenergic and serotoninergic innervations to the
hippocampus, amygdala and neocortex respectively, are altered at early stages of AD-
related pathology (4, 13). Accordingly, it has been hypothesized that depression in the
elderly and AD can be linked, at least in part, to AD-related pathology in selected nuclei
of the brainstem (4).
The present observations reveal three important general aspects. The first of these
concerns regional variations: 1. the frontal cortex is the most affected area in AD-
related pathology, showing significantly decreased levels of adenosine, guanosine,
hypoxanthine, and xanthine, and a tendency of inosine to decrease; and 2. parietal
cortex and temporal cortex show an opposing pattern when compared with the frontal
cortex, as adenosine, guanosine, and inosine are significantly increased at least at
defined stages of AD whereas hypoxanthine and xanthine levels do not show
differences in AD-related pathology when compared with controls. The second point
concerns adenosine as the purine most commonly affected in all regions: adenosine
levels are altered, although in opposing directions, in frontal cortex, and parietal and
temporal cortex, followed by guanosine and inosine.
Regarding enzyme activities, 5’-NT Vmax value is reduced in membranes and cytosol in
frontal cortex but not in parietal cortex, and only at advanced stages in cytosol in
temporal cortex. ADA activity is decreased in AD when considered as a whole
compared with controls but increased at early stages of AD-related pathology in
temporal cortex. Finally, PNP activity is increased only in the temporal cortex at early
stages of AD-related pathology. Adenosine, guanosine, and inosine can be generated
This article is protected by copyright. All rights reserved.
17
from AMP, GMP, and IMP, respectively, through the action of 5’-NT. Decreased 5’-NT
activity in frontal cortex correlates with decreased levels of these metabolites (although
not significant for inosine) in this region in AD cases. Levels of adenosine, guanosine,
and inosine in parietal cortex and temporal cortex do not relate to 5’-NT in these
regions. Significantly decreased Vmax and KM values occurred through all disease
stages. No significant differences in parietal or temporal cortices were found in AD
(Figure 3). These results have to be interpreted with care, because 5’-NT, a glycosyl
phosphatidylinositol-anchored membrane protein, is a dissociation-sensitive enzyme
(18, 62, 64). However, it has been previously demonstrated, by means of artificial
postmortem delay experiments, that ecto-nucleotidase activity in human brains was
stable up to 24 h, indicating the reliability of this tissue for these enzyme determinations
(3). In agreement, 5’-NT activity measured in the present work was not associated to
postmortem delay neither in membrane nor cytosolic fractions. As the efficiency of the
enzyme is defined as (Vmax/[E]total) / KM, 5’-NT enzyme efficiency could be altered due to
the lower Vmax and the lower KM found in AD cases versus controls.
It may be speculated that reduced levels of adenosine in frontal cortex in AD underlie
increased expression and activity of adenosine A1 receptors previously described in
this region throughout disease progression (1).
Adenosine is transformed into inosine by ADA (11). Therefore, changes in inosine can
be linked to alterations of adenosine. Inosine decrease in frontal cortex and decrease
in parietal and temporal cortex in AD has the same pattern as that seen for adenosine
in these regions. However, ADA activity is not significantly decreased in frontal cortex
and significantly increased only in temporal cortex in the present series. Activity of
adenosine monophosphate deaminase, another enzyme involved in inositol synthesis,
is increased in the temporal cortex in soluble and membrane fractions in AD (58).
This article is protected by copyright. All rights reserved.
18
PNP catalyzes the conversion of inosine to hypoxanthine and the degradation of
guanosine to guanine (9). Therefore, changes in PNP can produce changes in
hypoxanthine and guanine levels. PNP activity is increased in temporal cortex at
advanced stages of AD-related pathology; however, hypoxanthine level are not altered
in temporal cortex and is decreased in frontal cortex at early stages of AD-related
pathology. Finally, xanthine is obtained from oxidation of hypoxanthine by xanthine
oxidase (11). Levels of hypoxanthine correlate with xanthine in the frontal, parietal, and
temporal cortices in the present series.
The third important point identified in this study is the early alteration of purine levels
and enzymatic activity in different regions of the three cerebral cortices at stages in
which there is no evidence of NFT pathology or β-amyloid deposition in neocortex
(Braak stages I-III; Thal phases 0). Reduced levels of adenosine, guanosine,
hypoxanthine, and xanthine, and a tendency toward decrease of inosine, occur at
stages I-II of NFT pathology in which tau aggregates in the cerebral cortex are limited
to the entorhinal and transentorhinal cortices and discrete neurons in the hippocampus.
Importantly, adenosine, guanosine, and inosine are increased in the temporal cortex,
as is adenosine in the parietal cortex during the same early stages. Moreover, 5’-NT
and ADA activities are reduced in frontal cortex at stages I-II.
The present findings are descriptive and do not contemplate possible functional
implications. Nor do they pretend to explore the pathogenesis of the disease deeply.
However, they show 1: alterations of purine metabolism in the cerebral cortex at early
stages of AD-related pathology which are independent of NFTs and β-amyloid plaques;
2: alterations which are stage- and region-dependent, the latter showing opposite
patterns in frontal cortex compared with parietal cortex and temporal cortex; 3:
adenosine to be the most vulnerable member of the group of assessed purines; and 4:
This article is protected by copyright. All rights reserved.
19
variable correspondence between metabolite levels and enzymes involved in their
synthesis.
These observations point to the likely implications of these particular patterns in the
analysis and interpretation of purine modifications in CSF as possible biomarkers in AD
and other neurodegenerative diseases.
Acknowledgement
This work has been supported by grants BFU2011-23034 from Ministerio de Economía
y Competitividad and PEII-2014-030-P from Junta de Comunidades de Castilla-La
Mancha (JCCM). We wish to thank T. Yohannan for editorial help.
Authors declare no conflict of interest.
References
1. Albasanz JL, Perez S, Barrachina M, Ferrer I, Martin M (2008) Up-regulation of
adenosine receptors in the frontal cortex in Alzheimer's disease. Brain
pathology.18(2):211-9.
2. Ali-Sisto T, Tolmunen T, Toffol E, Viinamaki H, Mantyselka P, Valkonen-
Korhonen M, Honkalampi K, Ruusunen A, Velagapudi V, Lehto SM (2016) Purine
metabolism is dysregulated in patients with major depressive disorder.
Psychoneuroendocrinology.70:25-32.
3. Aliagas E, Villar-Menendez I, Sevigny J, Roca M, Romeu M, Ferrer I, Martin-
Satue M, Barrachina M (2013) Reduced striatal ecto-nucleotidase activity in
schizophrenia patients supports the "adenosine hypothesis". Purinergic
signalling.9(4):599-608.
4. Andres-Benito P, Fernandez-Duenas V, Carmona M, Escobar LA, Torrejon-
Escribano B, Aso E, Ciruela F, Ferrer I (2017) Locus coeruleus at asymptomatic early
and middle Braak stages of neurofibrillary tangle pathology. Neuropathology and
applied neurobiology.43(5):373-92.
This article is protected by copyright. All rights reserved.
20
5. Angulo E, Casado V, Mallol J, Canela EI, Vinals F, Ferrer I, Lluis C, Franco R
(2003) A1 adenosine receptors accumulate in neurodegenerative structures in
Alzheimer disease and mediate both amyloid precursor protein processing and tau
phosphorylation and translocation. Brain pathology.13(4):440-51.
6. Ansoleaga B, Jove M, Schluter A, Garcia-Esparcia P, Moreno J, Pujol A,
Pamplona R, Portero-Otin M, Ferrer I (2015) Deregulation of purine metabolism in
Alzheimer's disease. Neurobiology of aging.36(1):68-80.
7. Bettio LE, Neis VB, Pazini FL, Brocardo PS, Patten AR, Gil-Mohapel J, Christie
BR, Rodrigues AL (2016) The antidepressant-like effect of chronic guanosine treatment
is associated with increased hippocampal neuronal differentiation. Eur J
Neurosci.43(8):1006-15.
8. Boison D (2008) Adenosine as a neuromodulator in neurological diseases.
Current opinion in pharmacology.8(1):2-7.
9. Boison D (2011) Modulators of nucleoside metabolism in the therapy of brain
diseases. Curr Top Med Chem.11(8):1068-86.
10. Boison D (2013) Adenosine kinase: exploitation for therapeutic gain.
Pharmacological reviews.65(3):906-43.
11. Borowiec A, Lechward K, Tkacz-Stachowska K, Skladanowski AC (2006)
Adenosine as a metabolic regulator of tissue function: production of adenosine by
cytoplasmic 5'-nucleotidases. Acta biochimica Polonica.53(2):269-78.
12. Braak H, Alafuzoff I, Arzberger T, Kretzschmar H, Del Tredici K (2006) Staging
of Alzheimer disease-associated neurofibrillary pathology using paraffin sections and
immunocytochemistry. Acta neuropathologica.112(4):389-404.
13. Braak H, Del Tredici K (2015) The preclinical phase of the pathological process
underlying sporadic Alzheimer's disease. Brain.138(Pt 10):2814-33.
14. Braak H, Thal DR, Ghebremedhin E, Del Tredici K (2011) Stages of the
pathologic process in Alzheimer disease: age categories from 1 to 100 years. J
Neuropathol Exp Neurol.70(11):960-9.
15. Cabre R, Jove M, Naudi A, Ayala V, Pinol-Ripoll G, Gil-Villar MP, Dominguez-
Gonzalez M, Obis E, Berdun R, Mota-Martorell N, Portero-Otin M, Ferrer I, Pamplona
R (2016) Specific Metabolomics Adaptations Define a Differential Regional
Vulnerability in the Adult Human Cerebral Cortex. Front Mol Neurosci.9:138.
16. Canas PM, Porciuncula LO, Cunha GM, Silva CG, Machado NJ, Oliveira JM,
Oliveira CR, Cunha RA (2009) Adenosine A2A receptor blockade prevents
synaptotoxicity and memory dysfunction caused by beta-amyloid peptides via p38
mitogen-activated protein kinase pathway. J Neurosci.29(47):14741-51.
This article is protected by copyright. All rights reserved.
21
17. Cunha RA (2016) How does adenosine control neuronal dysfunction and
neurodegeneration? Journal of neurochemistry.139(6):1019-55.
18. Cunha RA, Brendel P, Zimmermann H, Ribeiro JA (2000) Immunologically
distinct isoforms of ecto-5'-nucleotidase in nerve terminals of different areas of the rat
hippocampus. Journal of neurochemistry.74(1):334-8.
19. Cunha RA, Sebastiao AM, Ribeiro JA (1998) Inhibition by ATP of hippocampal
synaptic transmission requires localized extracellular catabolism by ecto-nucleotidases
into adenosine and channeling to adenosine A1 receptors. J Neurosci.18(6):1987-95.
20. Chan KM, Delfert D, Junger KD (1986) A direct colorimetric assay for Ca2+ -
stimulated ATPase activity. Analytical biochemistry.157(2):375-80.
21. Dall'Igna OP, Fett P, Gomes MW, Souza DO, Cunha RA, Lara DR (2007)
Caffeine and adenosine A(2a) receptor antagonists prevent beta-amyloid (25-35)-
induced cognitive deficits in mice. Exp Neurol.203(1):241-5.
22. Degrell I, Niklasson F (1988) Purine metabolites in the CSF in presenile and
senile dementia of Alzheimer type, and in multi infarct dementia. Archives of
gerontology and geriatrics.7(2):173-8.
23. Dunwiddie TV, Diao L, Proctor WR (1997) Adenine nucleotides undergo rapid,
quantitative conversion to adenosine in the extracellular space in rat hippocampus. J
Neurosci.17(20):7673-82.
24. Duyckaerts C, Dickson D (2011) Neuropathology of Alzheimer’s disease and its
variants. 2nd Edition, Wiley-Blackwell, Oxford.
25. Ena SL, De Backer JF, Schiffmann SN, de Kerchove d'Exaerde A (2013) FACS
array profiling identifies Ecto-5' nucleotidase as a striatopallidal neuron-specific gene
involved in striatal-dependent learning. J Neurosci.33(20):8794-809.
26. Ferrer I (2012) Defining Alzheimer as a common age-related neurodegenerative
process not inevitably leading to dementia. Progress in neurobiology.97(1):38-51.
27. Ferrer I, Martinez A, Boluda S, Parchi P, Barrachina M (2008) Brain banks:
benefits, limitations and cautions concerning the use of post-mortem brain tissue for
molecular studies. Cell Tissue Bank.9(3):181-94.
28. Fredholm BB (2014) Adenosine--a physiological or pathophysiological agent?
Journal of molecular medicine.92(3):201-6.
29. Fredholm BB, AP IJ, Jacobson KA, Linden J, Muller CE (2011) International
Union of Basic and Clinical Pharmacology. LXXXI. Nomenclature and classification of
adenosine receptors--an update. Pharmacological reviews.63(1):1-34.
30. Fredholm BB, Chen JF, Cunha RA, Svenningsson P, Vaugeois JM (2005)
Adenosine and brain function. Int Rev Neurobiol.63:191-270.
This article is protected by copyright. All rights reserved.
22
31. Goedert M, Spillantini MG (2006) A century of Alzheimer's disease.
Science.314(5800):777-81.
32. Ipata PL, Camici M, Micheli V, Tozz MG (2011) Metabolic network of
nucleosides in the brain. Curr Top Med Chem.11(8):909-22.
33. Isobe C, Abe T, Terayama Y (2010) Levels of reduced and oxidized coenzyme
Q-10 and 8-hydroxy-2'-deoxyguanosine in the CSF of patients with Alzheimer's disease
demonstrate that mitochondrial oxidative damage and/or oxidative DNA damage
contributes to the neurodegenerative process. J Neurol.257(3):399-404.
34. Jansen KL, Faull RL, Dragunow M, Synek BL (1990) Alzheimer's disease:
changes in hippocampal N-methyl-D-aspartate, quisqualate, neurotensin, adenosine,
benzodiazepine, serotonin and opioid receptors--an autoradiographic study.
Neuroscience.39(3):613-27.
35. Kaddurah-Daouk R, Rozen S, Matson W, Han X, Hulette CM, Burke JR,
Doraiswamy PM, Welsh-Bohmer KA (2011) Metabolomic changes in autopsy-
confirmed Alzheimer's disease. Alzheimers Dement.7(3):309-17.
36. Kaddurah-Daouk R, Zhu H, Sharma S, Bogdanov M, Rozen SG, Matson W, Oki
NO, Motsinger-Reif AA, Churchill E, Lei Z, Appleby D, Kling MA, Trojanowski JQ,
Doraiswamy PM, Arnold SE, Pharmacometabolomics Research N (2013) Alterations in
metabolic pathways and networks in Alzheimer's disease. Translational
psychiatry.3:e244.
37. Kanfer JN, Hattori H, Orihel D (1986) Reduced phospholipase D activity in brain
tissue samples from Alzheimer's disease patients. Annals of neurology.20(2):265-7.
38. Kaster MP, Budni J, Gazal M, Cunha MP, Santos AR, Rodrigues AL (2013) The
antidepressant-like effect of inosine in the FST is associated with both adenosine A1
and A 2A receptors. Purinergic signalling.9(3):481-6.
39. Kaster MP, Rosa AO, Rosso MM, Goulart EC, Santos AR, Rodrigues AL (2004)
Adenosine administration produces an antidepressant-like effect in mice: evidence for
the involvement of A1 and A2A receptors. Neuroscience letters.355(1-2):21-4.
40. Kekesi KA, Kovacs Z, Szilagyi N, Bobest M, Szikra T, Dobolyi A, Juhasz G,
Palkovits M (2006) Concentration of nucleosides and related compounds in cerebral
and cerebellar cortical areas and white matter of the human brain. Cellular and
molecular neurobiology.26(4-6):833-44.
41. Kovacs Z, Dobolyi A, Juhasz G, Kekesi KA (2010) Nucleoside map of the
human central nervous system. Neurochem Res.35(3):452-64.
42. Kovacs Z, Dobolyi A, Kekesi KA, Juhasz G (2013) 5'-nucleotidases, nucleosides
and their distribution in the brain: pathological and therapeutic implications. Curr Med
Chem.20(34):4217-40.
This article is protected by copyright. All rights reserved.
23
43. Kovacs Z, Juhasz G, Palkovits M, Dobolyi A, Kekesi KA (2011) Area, age and
gender dependence of the nucleoside system in the brain: a review of current literature.
Curr Top Med Chem.11(8):1012-33.
44. Kovacs Z, Kekesi KA, Bobest M, Torok T, Szilagyi N, Szikra T, Szepesi Z,
Nyilas R, Dobolyi A, Palkovits M, Juhasz G (2005) Post mortem degradation of
nucleosides in the brain: comparison of human and rat brains for estimation of in vivo
concentration of nucleosides. J Neurosci Methods.148(1):88-93.
45. Laurent C, Burnouf S, Ferry B, Batalha VL, Coelho JE, Baqi Y, Malik E,
Mariciniak E, Parrot S, Van der Jeugd A, Faivre E, Flaten V, Ledent C, D'Hooge R,
Sergeant N, Hamdane M, Humez S, Muller CE, Lopes LV, Buee L, Blum D (2016) A2A
adenosine receptor deletion is protective in a mouse model of Tauopathy. Mol
Psychiatry.21(1):97-107.
46. Leon-Navarro DA, Albasanz JL, Martin M (2015) Hyperthermia-induced
seizures alter adenosine A1 and A2A receptors and 5'-nucleotidase activity in rat
cerebral cortex. Journal of neurochemistry.134(3):395-404.
47. Li P, Rial D, Canas PM, Yoo JH, Li W, Zhou X, Wang Y, van Westen GJ, Payen
MP, Augusto E, Goncalves N, Tome AR, Li Z, Wu Z, Hou X, Zhou Y, AP IJ, Boyden
ES, Cunha RA, Qu J, Chen JF (2015) Optogenetic activation of intracellular adenosine
A2A receptor signaling in the hippocampus is sufficient to trigger CREB
phosphorylation and impair memory. Mol Psychiatry.20(11):1339-49.
48. Monoranu CM, Apfelbacher M, Grunblatt E, Puppe B, Alafuzoff I, Ferrer I, Al-
Saraj S, Keyvani K, Schmitt A, Falkai P, Schittenhelm J, Halliday G, Kril J, Harper C,
McLean C, Riederer P, Roggendorf W (2009) pH measurement as quality control on
human post mortem brain tissue: a study of the BrainNet Europe consortium.
Neuropathology and applied neurobiology.35(3):329-37.
49. Motsinger-Reif AA, Zhu H, Kling MA, Matson W, Sharma S, Fiehn O, Reif DM,
Appleby DH, Doraiswamy PM, Trojanowski JQ, Kaddurah-Daouk R, Arnold SE (2013)
Comparing metabolomic and pathologic biomarkers alone and in combination for
discriminating Alzheimer's disease from normal cognitive aging. Acta Neuropathol
Commun.1:28.
50. Nam HW, Hinton DJ, Kang NY, Kim T, Lee MR, Oliveros A, Adams C, Ruby CL,
Choi DS (2013) Adenosine transporter ENT1 regulates the acquisition of goal-directed
behavior and ethanol drinking through A2A receptor in the dorsomedial striatum. J
Neurosci.33(10):4329-38.
51. Pagnussat N, Almeida AS, Marques DM, Nunes F, Chenet GC, Botton PH,
Mioranzza S, Loss CM, Cunha RA, Porciuncula LO (2015) Adenosine A(2A) receptors
This article is protected by copyright. All rights reserved.
24
are necessary and sufficient to trigger memory impairment in adult mice. Br J
Pharmacol.172(15):3831-45.
52. Pinto-Duarte A, Coelho JE, Cunha RA, Ribeiro JA, Sebastiao AM (2005)
Adenosine A2A receptors control the extracellular levels of adenosine through
modulation of nucleoside transporters activity in the rat hippocampus. Journal of
neurochemistry.93(3):595-604.
53. Rahman A (2009) The role of adenosine in Alzheimer's disease. Curr
Neuropharmacol.7(3):207-16.
54. Rebola N, Lujan R, Cunha RA, Mulle C (2008) Adenosine A2A receptors are
essential for long-term potentiation of NMDA-EPSCs at hippocampal mossy fiber
synapses. Neuron.57(1):121-34.
55. Ribeiro JA, Sebastiao AM, de Mendonca A (2002) Adenosine receptors in the
nervous system: pathophysiological implications. Progress in neurobiology.68(6):377-
92.
56. Rodrigues RJ, Tome AR, Cunha RA (2015) ATP as a multi-target danger signal
in the brain. Frontiers in neuroscience.9:148.
57. Schmidt AP, Lara DR, Souza DO (2007) Proposal of a guanine-based
purinergic system in the mammalian central nervous system. Pharmacology &
therapeutics.116(3):401-16.
58. Sims B, Powers RE, Sabina RL, Theibert AB (1998) Elevated adenosine
monophosphate deaminase activity in Alzheimer's disease brain. Neurobiology of
aging.19(5):385-91.
59. Thal DR, Rub U, Orantes M, Braak H (2002) Phases of A beta-deposition in the
human brain and its relevance for the development of AD. Neurology.58(12):1791-800.
60. Ugarte A, Gil-Bea F, Garcia-Barroso C, Cedazo-Minguez A, Ramirez MJ,
Franco R, Garcia-Osta A, Oyarzabal J, Cuadrado-Tejedor M (2015) Decreased levels
of guanosine 3', 5'-monophosphate (cGMP) in cerebrospinal fluid (CSF) are associated
with cognitive decline and amyloid pathology in Alzheimer's disease. Neuropathology
and applied neurobiology.41(4):471-82.
61. Viana da Silva S, Haberl MG, Zhang P, Bethge P, Lemos C, Goncalves N,
Gorlewicz A, Malezieux M, Goncalves FQ, Grosjean N, Blanchet C, Frick A, Nagerl UV,
Cunha RA, Mulle C (2016) Early synaptic deficits in the APP/PS1 mouse model of
Alzheimer's disease involve neuronal adenosine A2A receptors. Nat Commun.7:11915.
62. Vogel M, Kowalewski H, Zimmermann H, Hooper NM, Turner AJ (1992) Soluble
low-Km 5'-nucleotidase from electric-ray (Torpedo marmorata) electric organ and
bovine cerebral cortex is derived from the glycosyl-phosphatidylinositol-anchored
ectoenzyme by phospholipase C cleavage. Biochem J.284 ( Pt 3):621-4.
This article is protected by copyright. All rights reserved.
25
63. Woods LT, Ajit D, Camden JM, Erb L, Weisman GA (2016) Purinergic receptors
as potential therapeutic targets in Alzheimer's disease. Neuropharmacology.104:169-
79.
64. Zimmermann H, Zebisch M, Strater N (2012) Cellular function and molecular
structure of ecto-nucleotidases. Purinergic signalling.8(3):437-502.
This article is protected by copyright. All rights reserved.
26
Figure legends
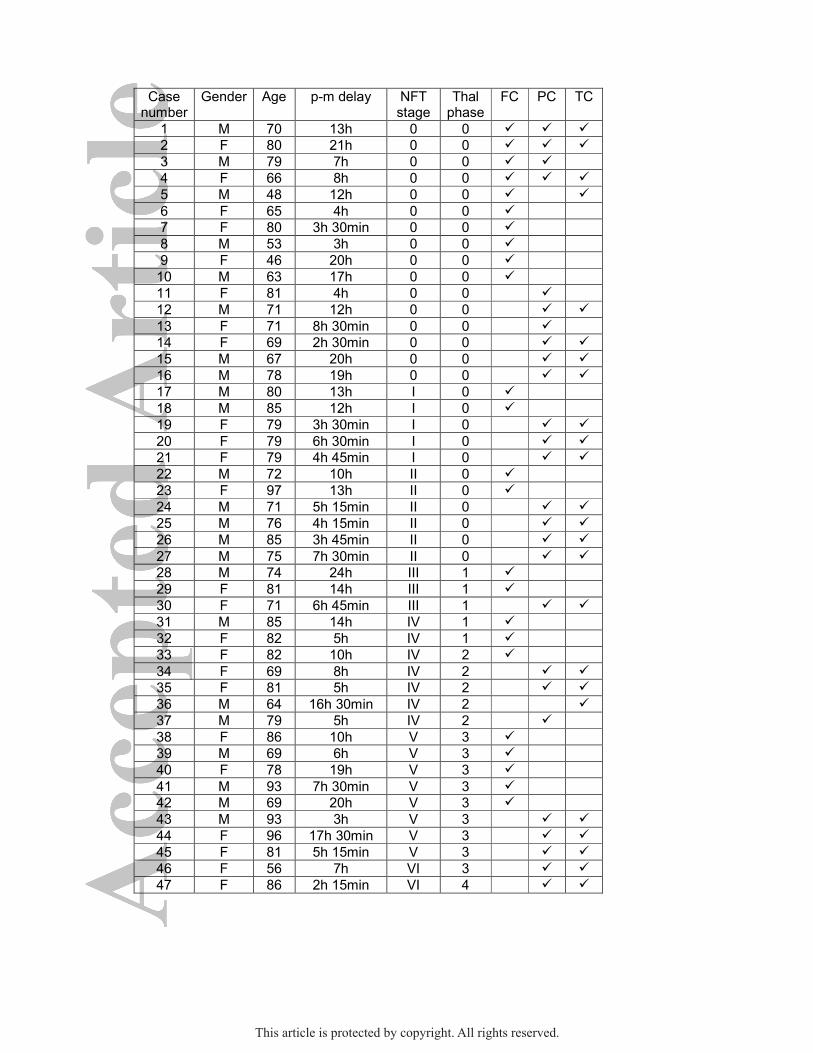
Table 1: Summary of the cases; M: male; F: female; P-M delay: postmortem delay
between death and tissue processing; FC: Frontal cortex; PC: parietal cortex; TC:
temporal cortex; NFT stage: Braak stage of neurofibrillary tangle pathology; Thal:
phases of β-amyloid plaques (plaque distribution).
Figure 1: Purine metabolic pathway. E-NTPDases: ecto-nucleoside tri-phosphate
diphosphohydrolases; PD, ectophosphodiesterase; ADA: adenosine deaminase;
SAHH: S-adenosyl homocysteine hydrolase; SHMT: S-adenosyl methyl transferase;
PNP: purine nucleoside phosphorylase; HGPRT: hypoxanthine-guanine
phosphoribosyl transferase (modified from (57)).
Figure 2: Adenosine, guanosine, hypoxanthine, xanthine, and inosine levels in frontal
cortex (FC), parietal cortex (PC), and temporal cortex (TC) in control (C) and cases
with AD-related pathology (AD) at early (AD I-II), intermediate (AD III-IV), and
advanced (AD V-VI) stages of NFT pathology. Values are expressed as mean ± SEM.
*p<0.05, **p<0.01 and ***p<0.001 according to ANOVA - Fisher’s LSD test.
Figure 3: Contribution of Alkaline Phosphatase to measured 5’-Nucleotidase (5’-NT)
activity. Presence of 100 µM levamisole, a selective alkaline phosphatase inhibitor,
during the assay determining 5’-NT activity did not modify the activity of 5’-NT neither in
membranes nor cytosolic fraction.
Figure 4: 5’-Nucleotidase (5’-NT) activity in membranes and in cytosol in the frontal
cortex (FC), parietal cortex (PC), and temporal cortex (TC) in control (C) and cases
This article is protected by copyright. All rights reserved.
27
with AD-related pathology (AD) at early (AD I-II), intermediate (AD III-IV), and
advanced (AD V-VI) stages of NFT pathology. 5’-NT activity was determined by fitting a
Michaelis Menten model using a non-linear regression. Values are expressed as mean
± SEM. *p<0.05 and **p<0.01 significantly different from the control value according to
ANOVA - Fisher’s LSD test.
Figure 5: Correlation analysis between 5’-Nucleotidase activity and postmortem delay
values. 5’-NT activity in membranes and in cytosol from the frontal, parietal and
temporal cortices of control and cases with AD-related pathology (Figure 4). r:
Pearson’s correlation coefficient. P: P value. Straight line: linear regression fit of 5´-NT
activity value.
Figure 6: Adenosine deaminase analysis. A. ADA activity in the frontal cortex (FC),
parietal cortex (PC), and temporal cortex (TC) in control (C) and cases with AD-related
pathology (AD) at early (AD I-II), intermediate (AD III-IV), and advanced (AD V-VI)
stages of NFT pathology. Data are mean ± SEM. *p<0.05 significantly different from the
control value, according to ANOVA - Fisher’s LSD test. B. Correlation analysis between
ADA activity and postmortem delay values. r: Pearson’s correlation coefficient. P: P
value. Straight line: linear regression fit of ADA activity value.
Figure 7: Purine nucleotide phosphorylase analysis. A. PNP activity in the frontal
cortex (FC), parietal cortex (PC), and temporal cortex (TC) in control (C) and cases
with AD-related pathology (AD) at early (AD I-II), intermediate (AD III-IV), and
advanced (AD V-VI) stages of NFT pathology. Data are mean ± SEM. *p<0.05
significantly different from the control value, according to ANOVA - Fisher’s LSD test.
B. Correlation analysis between PNP activity and postmortem delay values. r:
Pearson’s correlation coefficient. P: P value. Straight line: linear regression fit of PNP
activity value.
This article is protected by copyright. All rights reserved.
Case number
Gender Age p-m delay NFT stage
Thal phase
FC PC TC
1 M 70 13h 0 0 � � �
2 F 80 21h 0 0 � � �
3 M 79 7h 0 0 � �
4 F 66 8h 0 0 � � �
5 M 48 12h 0 0 � �
6 F 65 4h 0 0 �
7 F 80 3h 30min 0 0 �
8 M 53 3h 0 0 �
9 F 46 20h 0 0 �
10 M 63 17h 0 0 �
11 F 81 4h 0 0 �
12 M 71 12h 0 0 � �
13 F 71 8h 30min 0 0 �
14 F 69 2h 30min 0 0 � �
15 M 67 20h 0 0 � �
16 M 78 19h 0 0 � �
17 M 80 13h I 0 �
18 M 85 12h I 0 �
19 F 79 3h 30min I 0 � �
20 F 79 6h 30min I 0 � �
21 F 79 4h 45min I 0 � �
22 M 72 10h II 0 �
23 F 97 13h II 0 �
24 M 71 5h 15min II 0 � �
25 M 76 4h 15min II 0 � �
26 M 85 3h 45min II 0 � �
27 M 75 7h 30min II 0 � �
28 M 74 24h III 1 �
29 F 81 14h III 1 �
30 F 71 6h 45min III 1 � �
31 M 85 14h IV 1 �
32 F 82 5h IV 1 �
33 F 82 10h IV 2 �
34 F 69 8h IV 2 � �
35 F 81 5h IV 2 � �
36 M 64 16h 30min IV 2 �
37 M 79 5h IV 2 �
38 F 86 10h V 3 �
39 M 69 6h V 3 �
40 F 78 19h V 3 �
41 M 93 7h 30min V 3 �
42 M 69 20h V 3 �
43 M 93 3h V 3 � �
44 F 96 17h 30min V 3 � �
45 F 81 5h 15min V 3 � �
46 F 56 7h VI 3 � �
47 F 86 2h 15min VI 4 � �
This article is protected by copyright. All rights reserved.
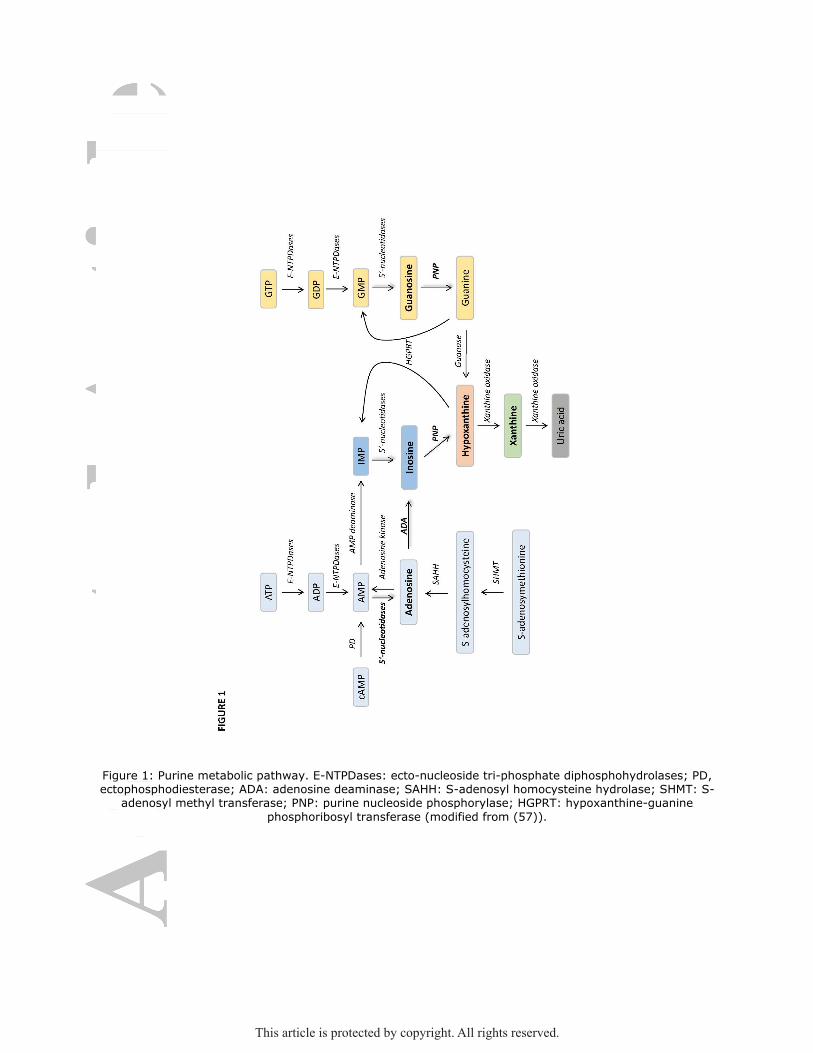
Figure 1: Purine metabolic pathway. E-NTPDases: ecto-nucleoside tri-phosphate diphosphohydrolases; PD, ectophosphodiesterase; ADA: adenosine deaminase; SAHH: S-adenosyl homocysteine hydrolase; SHMT: S-
adenosyl methyl transferase; PNP: purine nucleoside phosphorylase; HGPRT: hypoxanthine-guanine
phosphoribosyl transferase (modified from (57)).
This article is protected by copyright. All rights reserved.
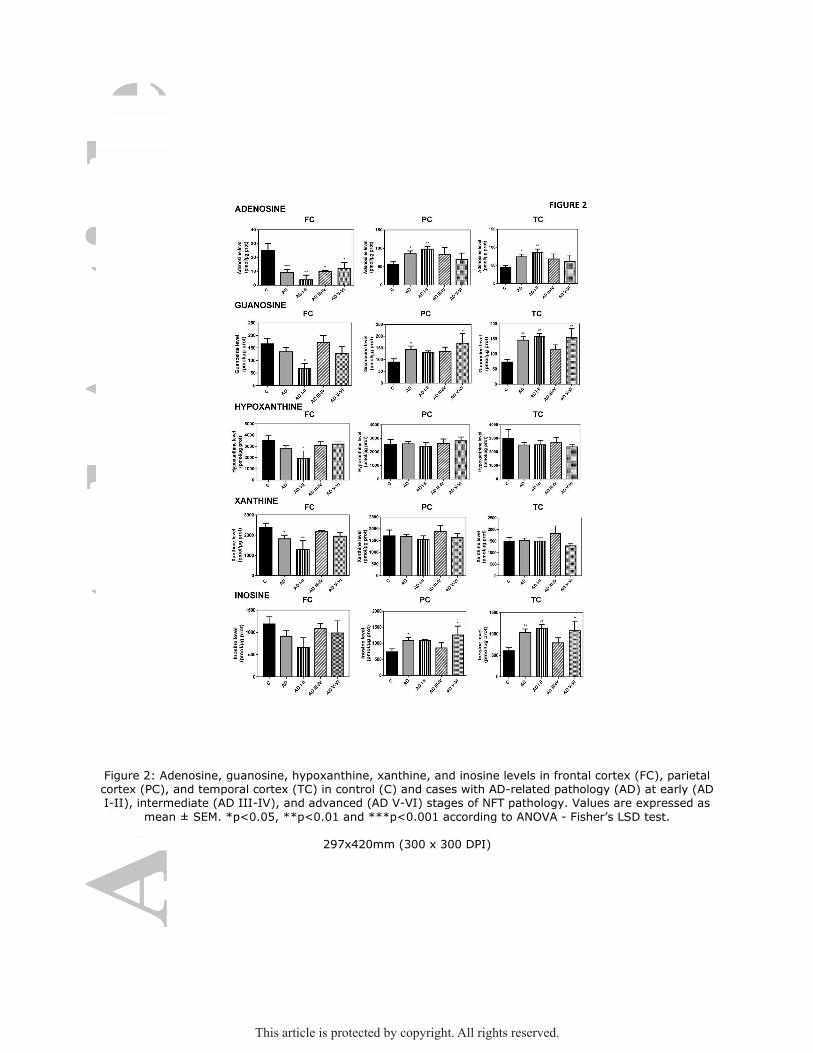
Figure 2: Adenosine, guanosine, hypoxanthine, xanthine, and inosine levels in frontal cortex (FC), parietal cortex (PC), and temporal cortex (TC) in control (C) and cases with AD-related pathology (AD) at early (AD I-II), intermediate (AD III-IV), and advanced (AD V-VI) stages of NFT pathology. Values are expressed as
mean ± SEM. *p<0.05, **p<0.01 and ***p<0.001 according to ANOVA - Fisher’s LSD test.
297x420mm (300 x 300 DPI)
This article is protected by copyright. All rights reserved.
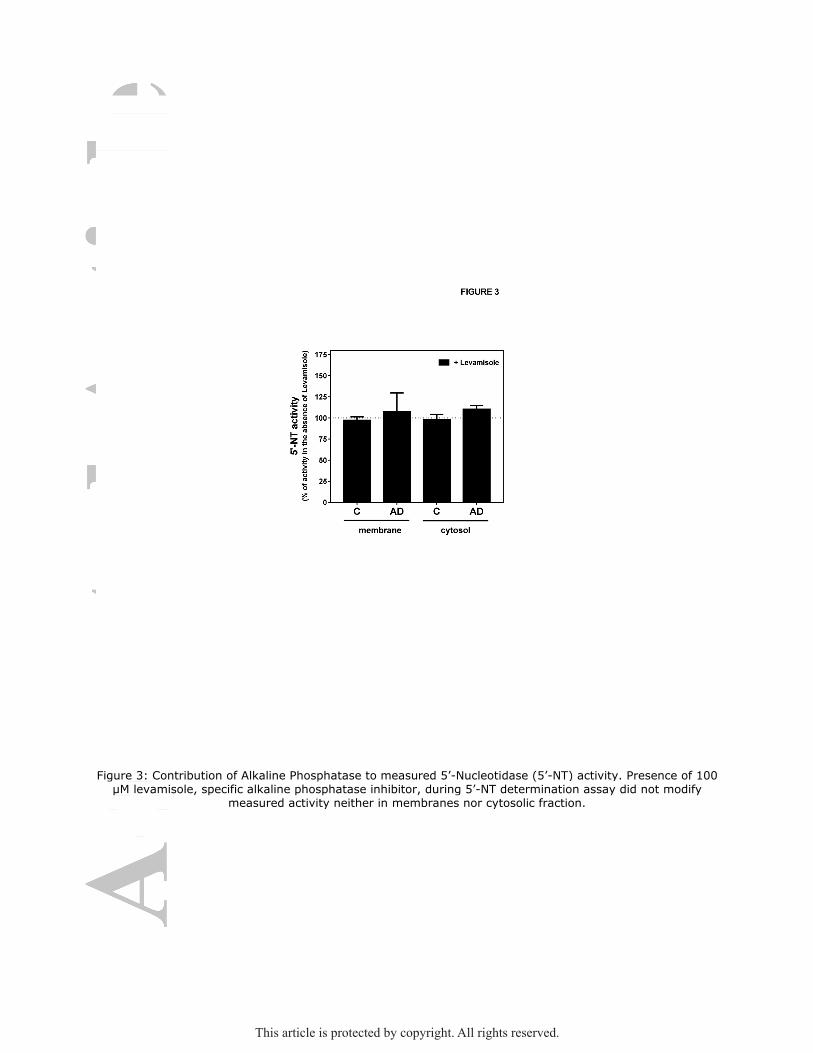
Figure 3: Contribution of Alkaline Phosphatase to measured 5’-Nucleotidase (5’-NT) activity. Presence of 100 µM levamisole, specific alkaline phosphatase inhibitor, during 5’-NT determination assay did not modify
measured activity neither in membranes nor cytosolic fraction.
This article is protected by copyright. All rights reserved.
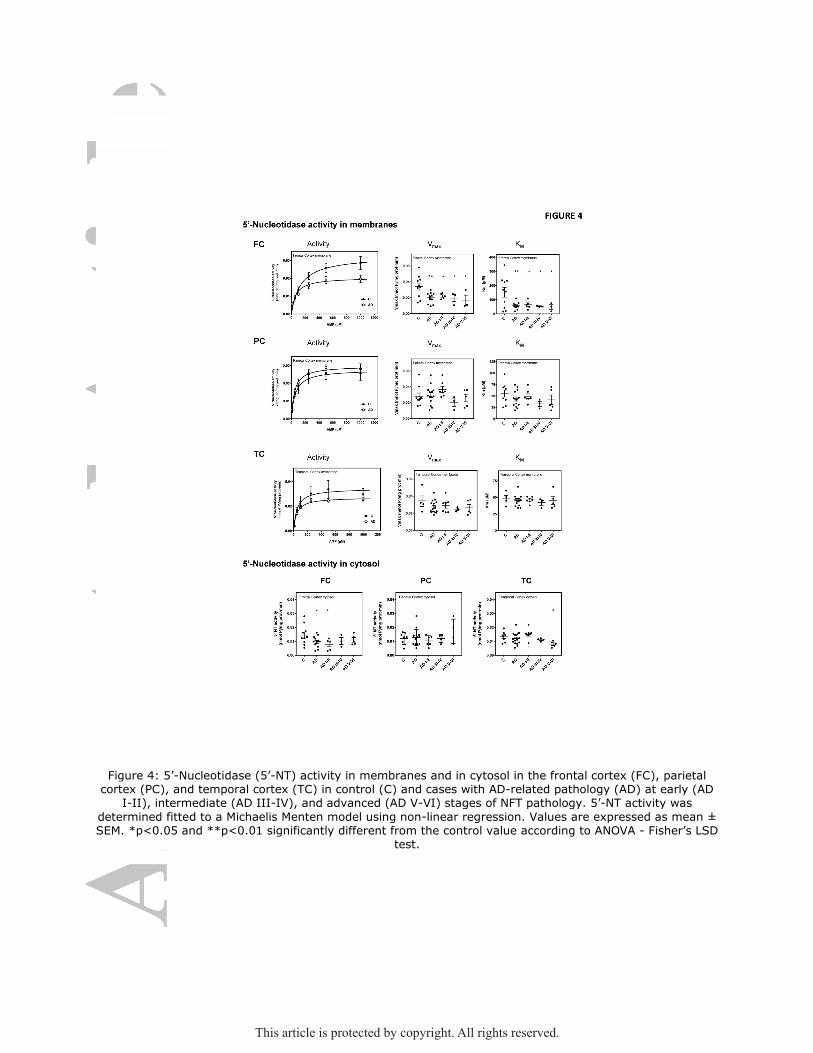
Figure 4: 5’-Nucleotidase (5’-NT) activity in membranes and in cytosol in the frontal cortex (FC), parietal cortex (PC), and temporal cortex (TC) in control (C) and cases with AD-related pathology (AD) at early (AD
I-II), intermediate (AD III-IV), and advanced (AD V-VI) stages of NFT pathology. 5’-NT activity was
determined fitted to a Michaelis Menten model using non-linear regression. Values are expressed as mean ± SEM. *p<0.05 and **p<0.01 significantly different from the control value according to ANOVA - Fisher’s LSD
test.
This article is protected by copyright. All rights reserved.
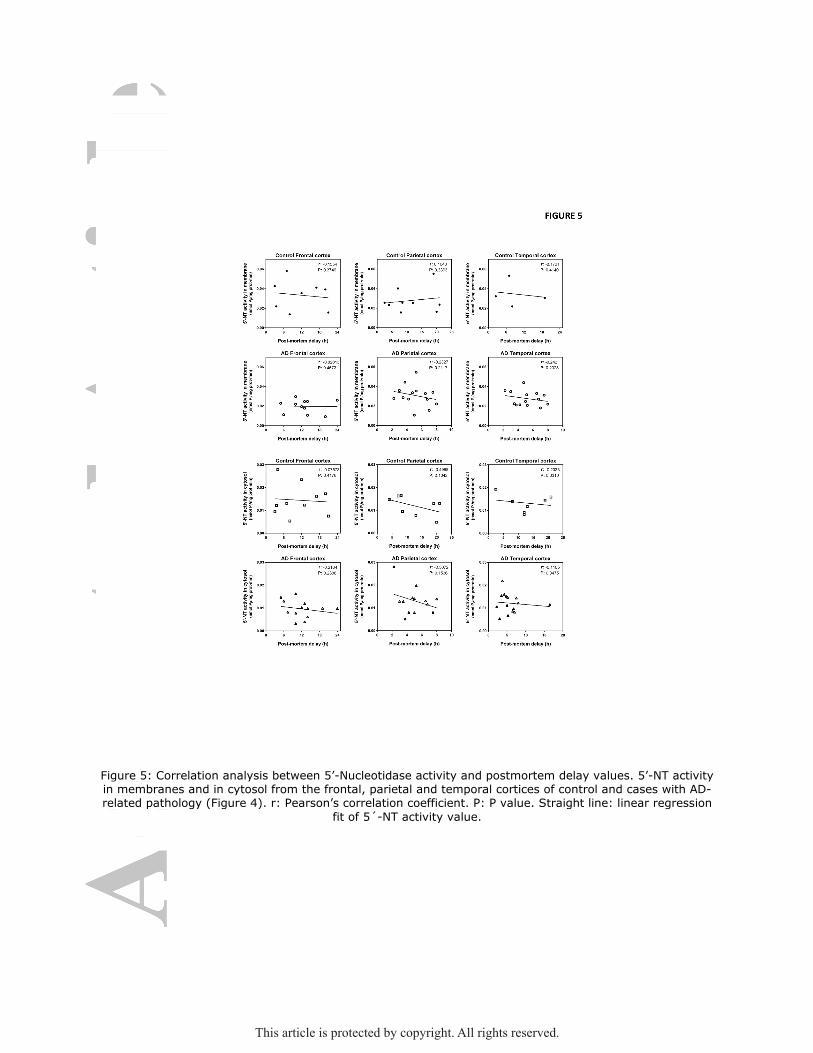
Figure 5: Correlation analysis between 5’-Nucleotidase activity and postmortem delay values. 5’-NT activity in membranes and in cytosol from the frontal, parietal and temporal cortices of control and cases with AD-related pathology (Figure 4). r: Pearson’s correlation coefficient. P: P value. Straight line: linear regression
fit of 5´-NT activity value.
This article is protected by copyright. All rights reserved.

Figure 6: Adenosine deaminase analysis. A. ADA activity in the frontal cortex (FC), parietal cortex (PC), and temporal cortex (TC) in control (C) and cases with AD-related pathology (AD) at early (AD I-II),
intermediate (AD III-IV), and advanced (AD V-VI) stages of NFT pathology. Data are mean ± SEM. *p<0.05
significantly different from the control value, according to ANOVA - Fisher’s LSD test. B. Correlation analysis between ADA activity and postmortem delay values. r: Pearson’s correlation coefficient. P: P value. Straight
line: linear regression fit of ADA activity value.
This article is protected by copyright. All rights reserved.
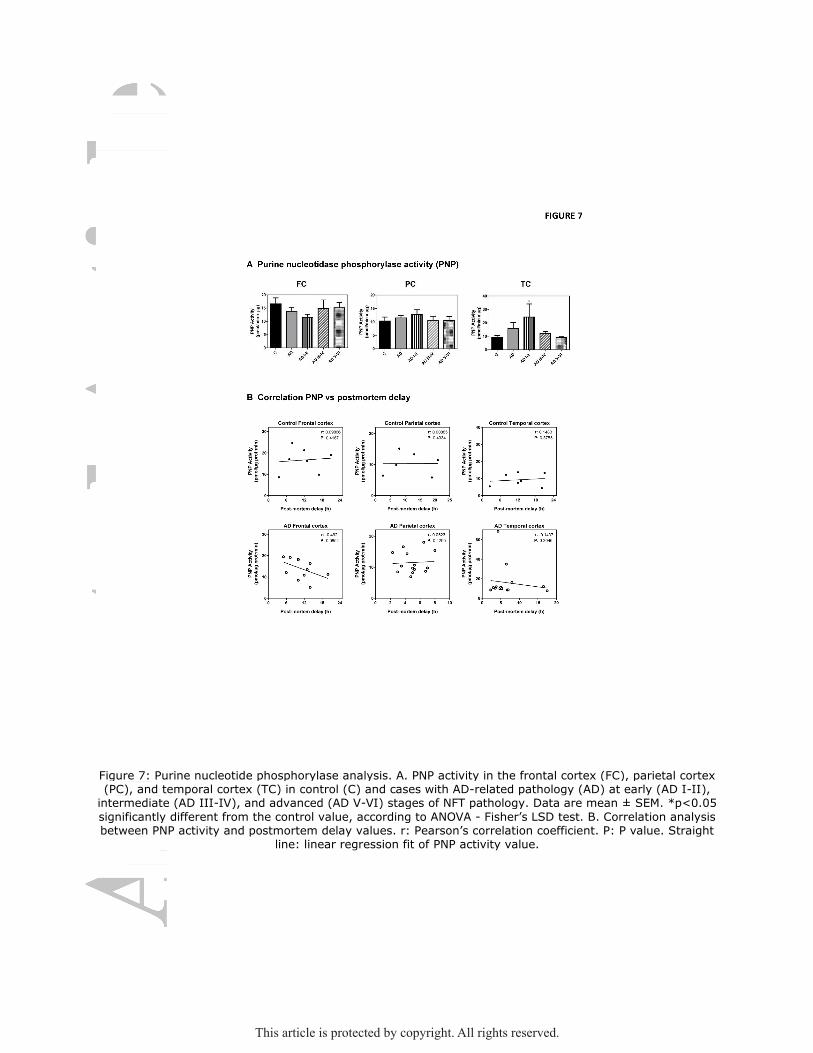
Figure 7: Purine nucleotide phosphorylase analysis. A. PNP activity in the frontal cortex (FC), parietal cortex (PC), and temporal cortex (TC) in control (C) and cases with AD-related pathology (AD) at early (AD I-II), intermediate (AD III-IV), and advanced (AD V-VI) stages of NFT pathology. Data are mean ± SEM. *p<0.05
significantly different from the control value, according to ANOVA - Fisher’s LSD test. B. Correlation analysis between PNP activity and postmortem delay values. r: Pearson’s correlation coefficient. P: P value. Straight
line: linear regression fit of PNP activity value.
This article is protected by copyright. All rights reserved.